Attached files
| file | filename |
|---|---|
| 8-K - 8-K - CRAWFORD & CO | d514577d8k.htm |
 Crawford &
Company New York Trip with William Blair
April 3, 2013
Exhibit 99.1 |
 Crawford
& Company FORWARD-LOOKING STATEMENTS AND ADDITIONAL INFORMATION
2
Forward-looking Statements
–This presentation contains forward-looking statements, including
statements about the future financial condition, results of operations and earnings
outlook of Crawford & Company. Statements, both qualitative and
quantitative, that are not statements of historical fact may be
“forward-looking
statements”
as defined in the Private Securities Litigation Reform Act of 1995 and other
securities laws. Forward-looking statements involve a number of
risks and uncertainties that could cause actual results to differ materially from historical experience or Crawford & Company’s present
expectations. Accordingly, no one should place undue reliance on
forward-looking statements, which speak only as of the date on which they are
made. Crawford & Company does not undertake to update
forward-looking statements to reflect the impact of circumstances or events that may
arise or not arise after the date the forward-looking statements are made.
Results for any interim period presented herein are not necessarily
indicative of results to be expected for the full year or for any other future
period. For further information regarding Crawford & Company, and the
risks and uncertainties involved in forward-looking statements, please read
Crawford & Company’s reports filed with the United States Securities and
Exchange Commission and available at www.sec.gov or in the Investor Relations
section of Crawford & Company’s website at
www.crawfordandcompany.com.
–Crawford’s business is dependent, to a significant extent, on case
volumes. The Company cannot predict the future trend of case volumes for a
number of reasons, including the fact that the frequency and severity of
weather-related claims and the occurrence of natural and man-made
disasters, which are a significant source of claims and revenue for the Company,
are generally not subject to accurate forecasting. Revenues Before Reimbursements
(“Revenues”) –Revenues Before Reimbursements are referred to
as “Revenues” in both consolidated and segment charts, bullets and
tables throughout this presentation.
Segment and Consolidated Operating Earnings
–Under the Financial Accounting Standards Board’s Accounting Standards
Codification Topic 280, “Segment Reporting,” the Company has
defined segment operating earnings as the primary measure used by the
Company to evaluate the results of each of its four operating segments. Segment
operating earnings exclude income taxes, interest expense, amortization of
customer-relationship intangible assets, stock option expense, earnings
or loss attributable to non-controlling interests, certain unallocated
corporate and shared costs and credits, and special charges and credits.
Consolidated operating earnings is the total of segment operating earnings and
certain unallocated and shared costs and credits. Non-GAAP Financial
Information –For additional information about certain non-GAAP
financial information presented herein, see the Appendix following this presentation. |
 Crawford
& Company Crawford & Company at a Glance
Exchange/Tickers:
NYSE: CRDA and CRDB
Trailing 52 week High/Low:
CRDA: $3.13-$5.98
CRDB: $3.25-$8.60
Market Capitalization (3/27/13):
$333.3 million
Annual Dividend/Yield (3/27/13):
CRDA: $0.16 or 3.2%
CRDB: $0.12 or 1.6%
Analyst Coverage:
Adam Klauber, William Blair (Outperform)
Mark Hughes, Suntrust (Neutral)
Greg Peters, Raymond James (Market
Perform)
3 |
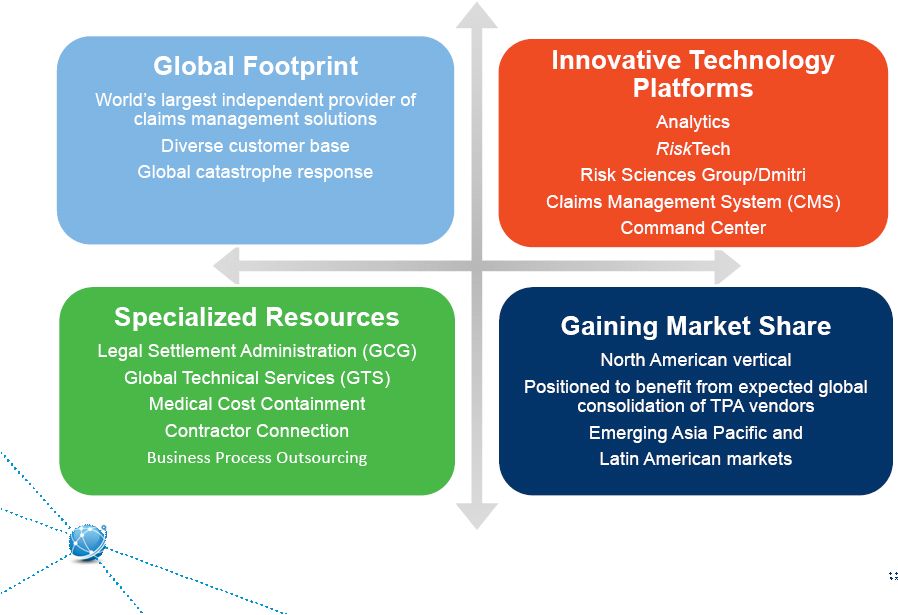
 Crawford
& Company A Business Services Leader since 1941
The world’s largest independent provider of global claims management solutions
Multiple globally recognized brand names: Crawford, Broadspire, GCG
Clients include multinational insurance carriers, brokers and local insurance firms as
well as 200 of the Fortune 500
4 |
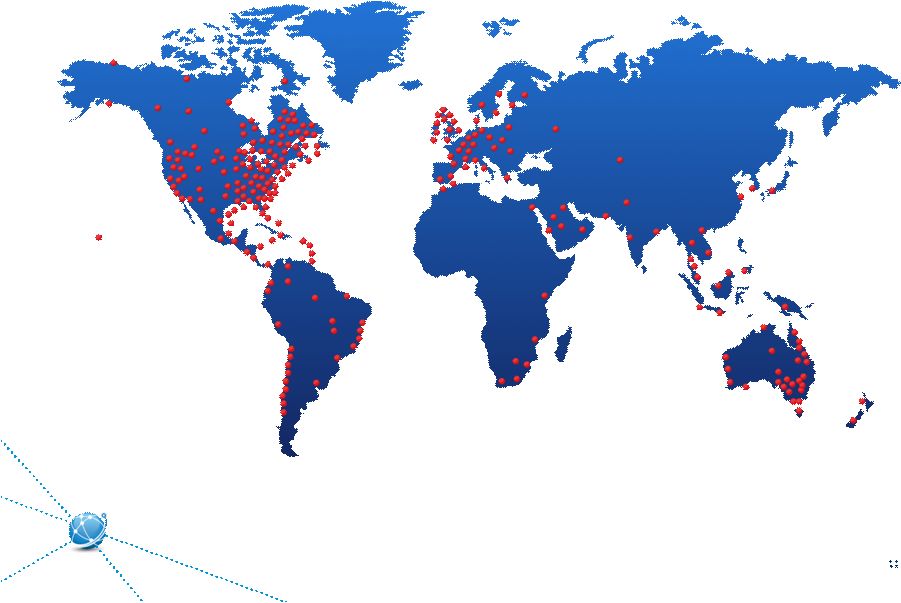 Crawford
& Company $1.2 Billion Revenue Company
700 Locations
70+ Countries
8,500 Employees
OUR GLOBAL STRENGTH
5 |
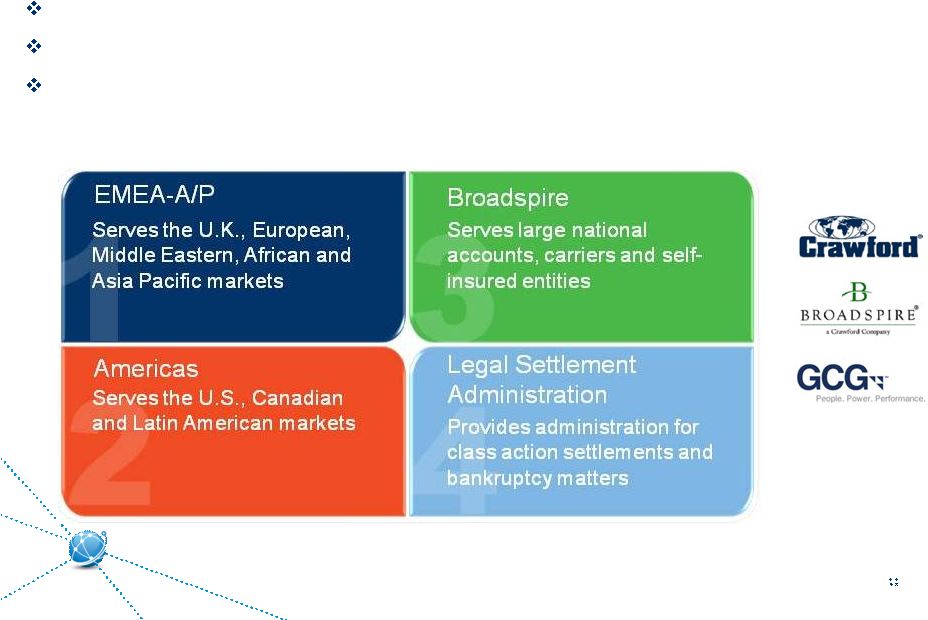
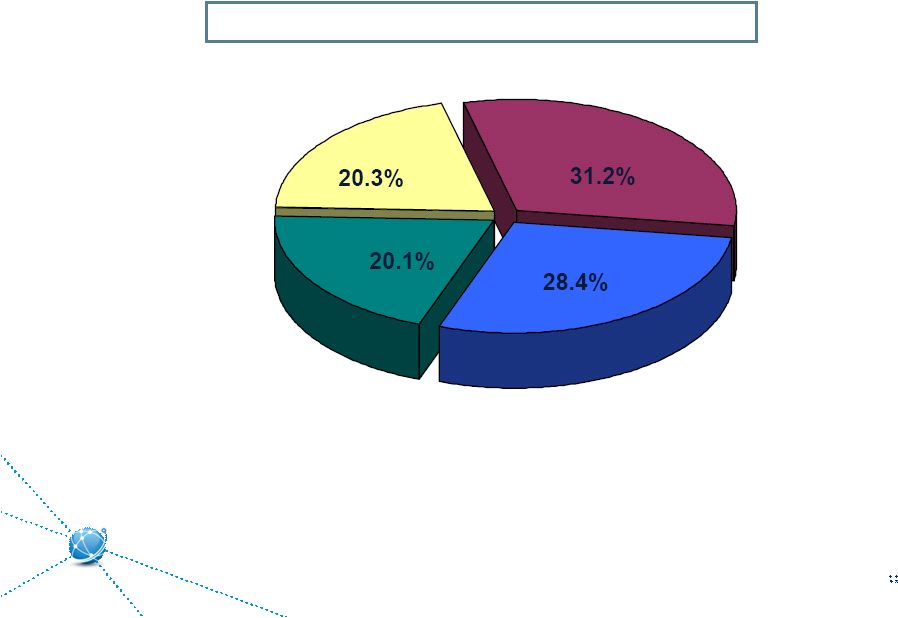 Crawford
& Company Diversified Business and Clients
2012 Revenues of approximately $1.2 Billion
•
Property and Casualty
Services
•
Global Technical
Services
•
Third Party
Administration
•
Global Markets
EMEA/AP
Americas
•
Property and Casualty Services
•
Catastrophe Management Services
•
Contractor Connection
•
Centralized Claim Administration
•
Affinity Programs
Legal Settlement Administration
•
Class Actions
–
Securities
–
Product Liability
•
Bankruptcy Administration
Broadspire
•
Workers’
Compensation and
Liability Claims Administration
•
Medical and Case Management
•
Long-Term Care Services
•
Integrated Disability Management
•
Risk Management Information
Systems (RSG)
•
Claim Triage Solution (e-Triage)
6 |
 Crawford
& Company Catalysts/Drivers
7
Cyclical Positive Industry Claim Trends:
Increased underwriting pressure creates a positive claim
trend.
Weather/Catastrophe Trends:
Catastrophic events worldwide are increasing in severity
and frequency. Crawford is uniquely positioned to serve
these markets.
Healthcare Reform:
Increased healthcare spending is a positive for
Broadspire’s medical case management and cost
containment services.
Future Inflation:
Rising interest rates drive interest income in Broadspire
and lower the Company’s anticipated pension obligations.
Market Position:
Leading market position in each of our segments.
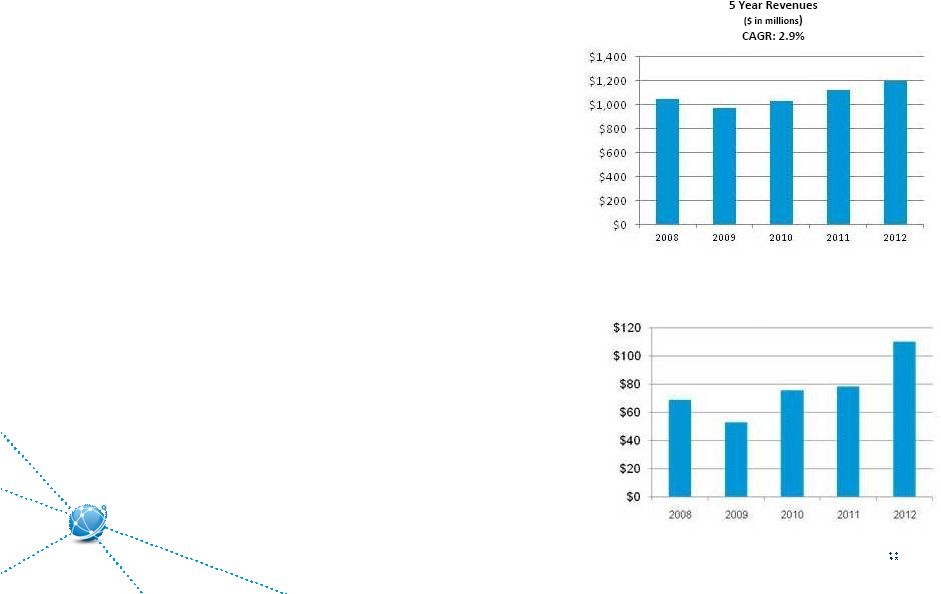
Consolidated Operating Earnings
($ in millions)
CAGR: 12.1% |
 Crawford
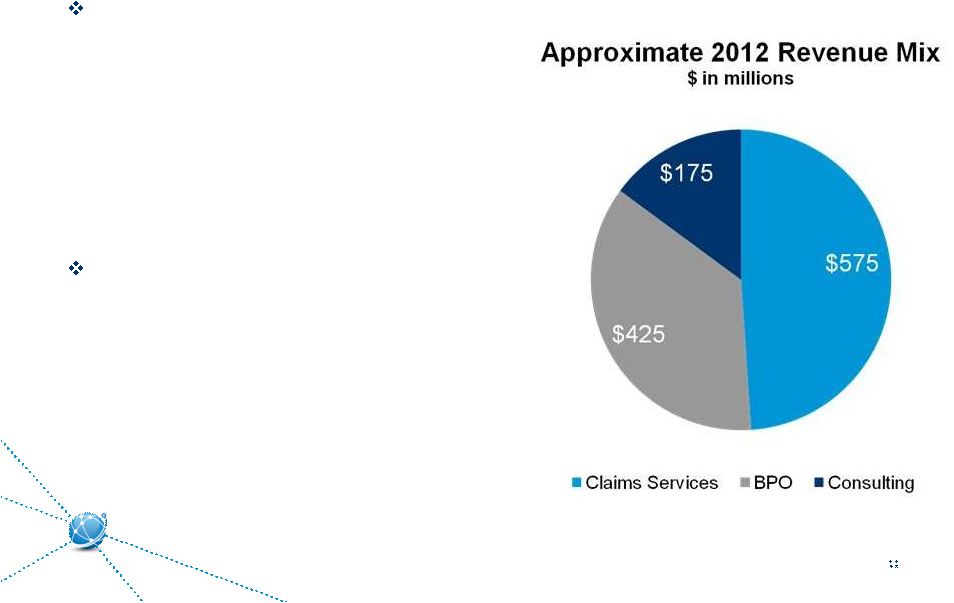
& Company Crawford Provides More Than Claims Services
8
P&C outsourced claims services provided
about $575 million, or 49%, of total
Crawford revenue in 2012
•
Claims services is a mature business in most
geographies
•
Revenues are driven by claims volume, which is
affected by regional economies, economic growth
•
Severe weather and natural disasters can produce
swings in volatility
•
Global Technical Services is the leader in mega-claims
$600 million, or 51%, was derived from
higher-value added business services
–BPO
•
Third Party Administration
•
Network services
•
Legal Settlement Administration
–Consulting
•
Medical Management
•
Analytics
•
Forensic Accounting |
 Crawford’s
Expertise Claims Services: Thai Flooding Catastrophe Response
Business Process Outsourcing: Deepwater Horizon
Consulting: Medical Management |
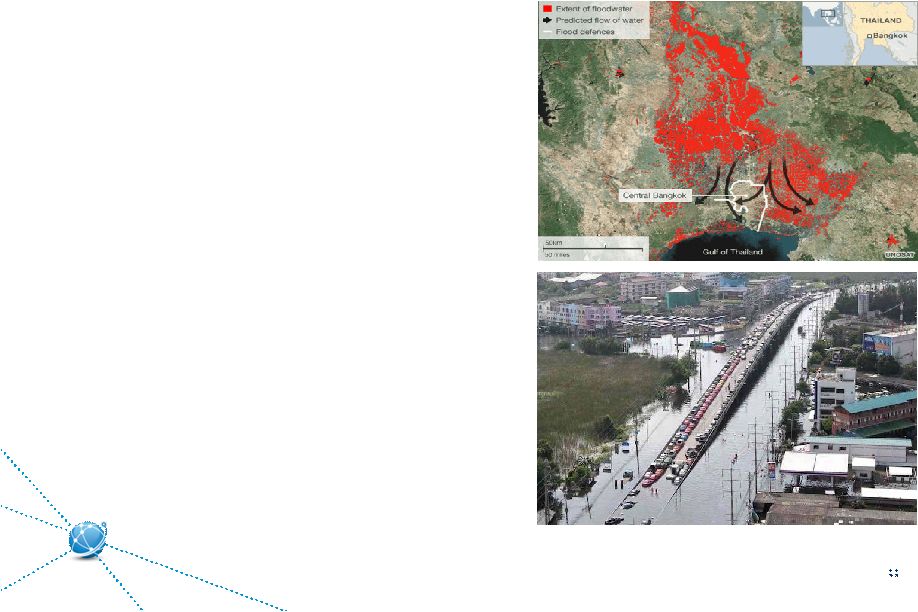 Crawford
& Company Catastrophe Response: Thai Flooding
Top ten historic insurance loss
Crawford handling losses in excess of $4
billion
Flooding affected an area the size of South
Carolina
Leveraged global capabilities through
deployment of 160 staff including 50 support
staff and 35 senior adjusters from other
locations globally
In-house forensic accountants utilized
10 |
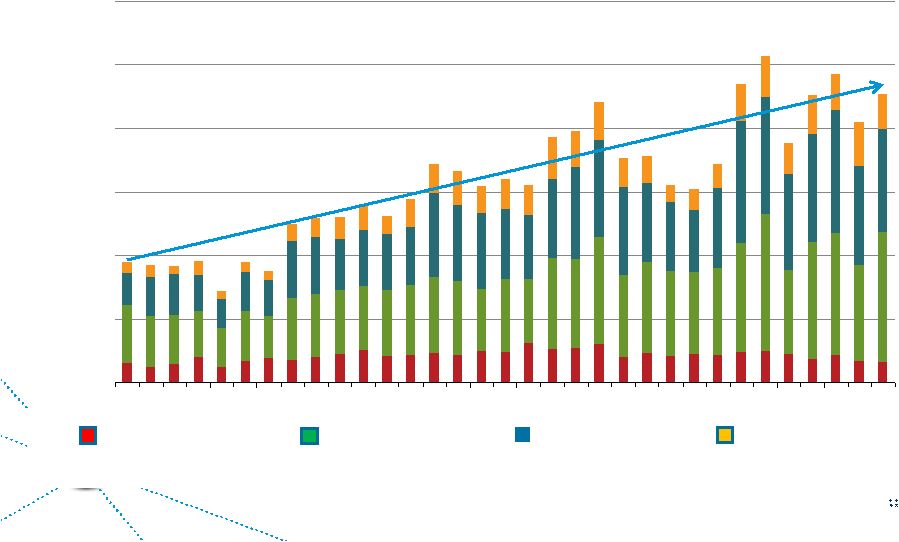 Crawford
& Company Natural catastrophes worldwide 1980 –
2012
Natural catastrophes per year more than doubled over period
Crawford is uniquely positioned to respond on a global basis
Number of Events
Meteorological
events
(Storm)
Hydrological
events
(Flood, mass
movement)
Climatological
events
(Extreme temperature,
drought, forest fire)
Geophysical
events
(Earthquake, tsunami,
volcanic eruption)
200
400
600
800
1 000
1 200
1980
1982
1984
1986
1988
1990
1992
1994
1996
1998
2000
2002
2004
2006
2008
2010
2012
11
Global Natural Catastrophe Update
©
2013 Munich Re
Source: Geo Risks Research, NatCatSERVICE –
As at January 2013 |
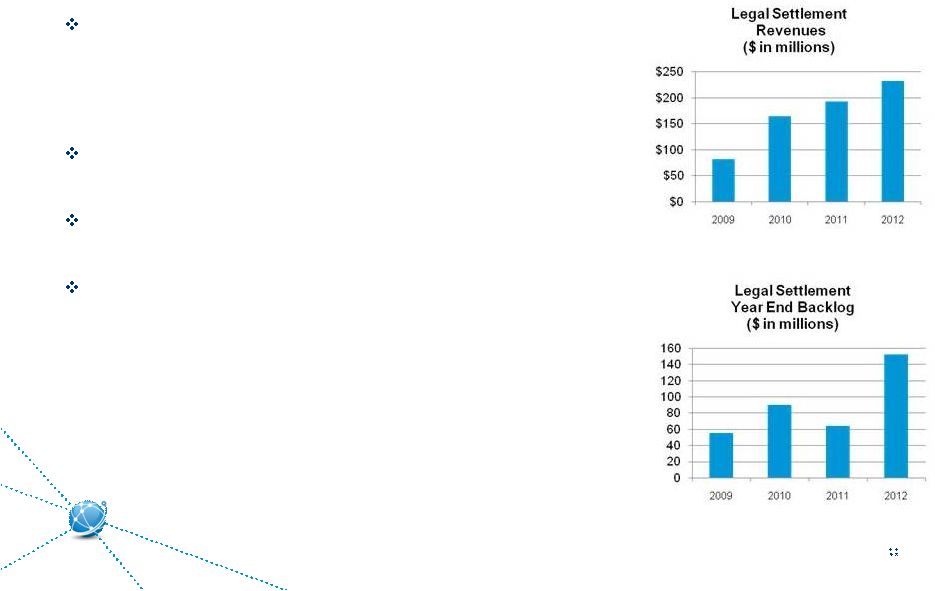 Crawford
& Company High-Volume Claims Services: Deepwater Horizon
12
The
Garden
City
Group
(GCG)
is
the
recognized
leader
in
legal administration services for class action
settlements and other claims administration,
bankruptcy cases and legal noticing programs.
Largest program is the combined GCCF/Deepwater Horizon
settlement
This special project resolves economic loss and property
damage claims related to the Deepwater Horizon Incident
GCG’s other high-profile distribution matters include:
–the General Motors bankruptcy
–the $6.15 billion WorldCom settlement
–the $3.4 billion Native American Trust Settlement
–the $3.05 billion VisaCheck/MasterMoney Antitrust settlement.
|
 Crawford
& Company 13
Consulting: Medical Management
•
Case managers proactively manage medical treatment in the rehabilitation
process, enabling our clients’
employees to recover as quickly as possible in the
most cost-effective manner.
•
Medical
costs
are
currently
60%
of
workers
compensation
cost
and
are estimated
to be over 70% by 2016, increasing the importance of effective medical cost
containment.
•
Healthcare reform is expected to increase activity in the healthcare market overall,
which could negatively impact access to providers and slow return to work, which
would increase medical and workers compensation cost and potentially increase
claims frequency.
•
Broadspire’s in-house integrated model provides services to mitigate increasing
medical
costs,
ultimately
decreasing
our
clients’
overall
loss
costs.
This
is
a
key
element of Broadspire’s value proposition to clients. |
 Financial
Review and Operational Focus |
 Crawford
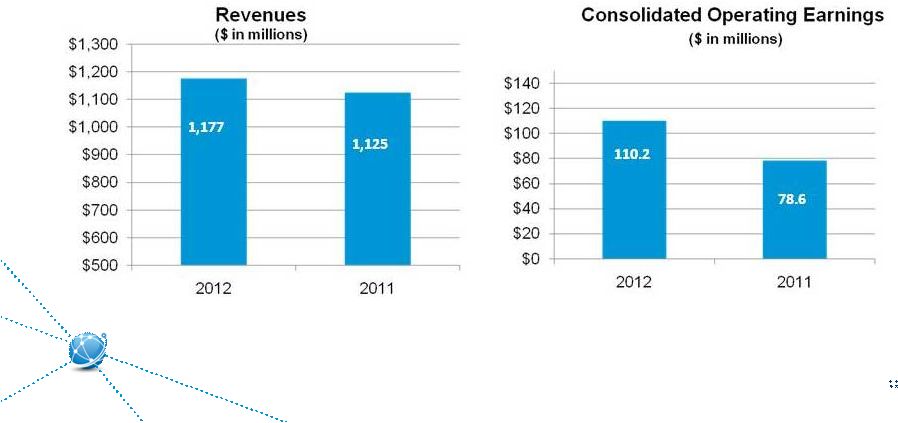
& Company 2012 Business Summary
15
Record revenues of $1.177 billion
Record consolidated operating earnings of $110.2 million
Record operating cash flow of $92.9 million
Including special payment, dividends of $0.20 per CRDA and $0.16
per CRDB
1,177
1,125
110.2
78.6 |
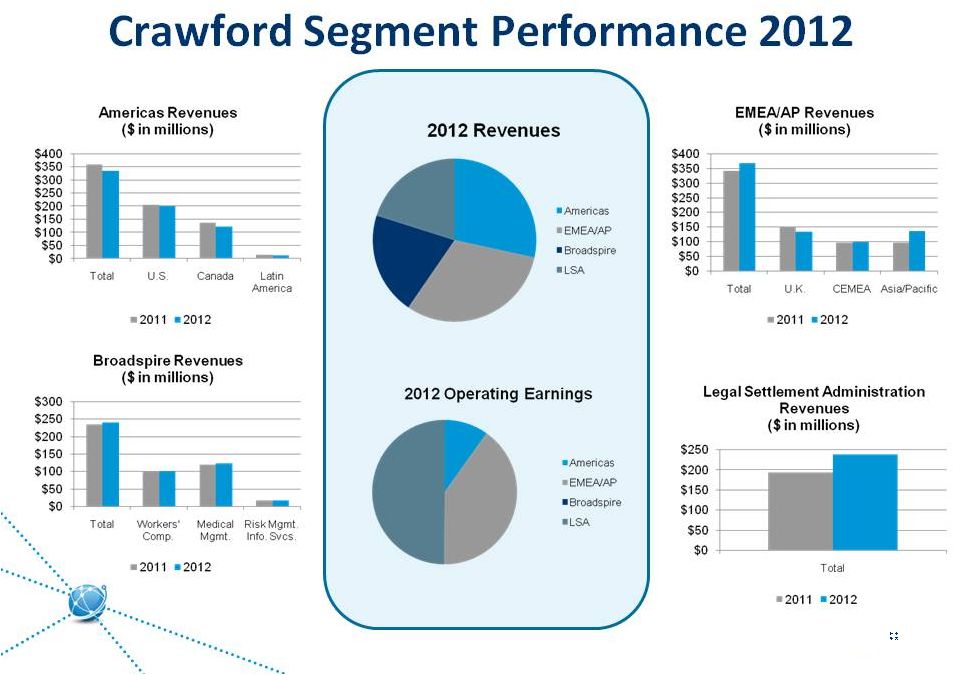 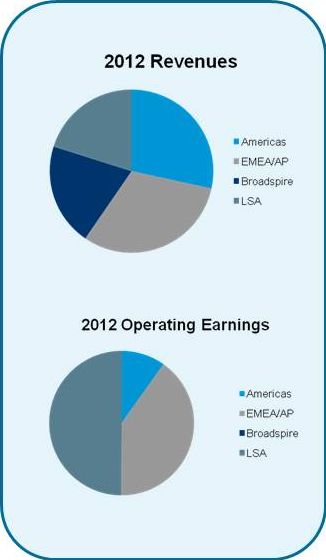 Crawford Segment
Performance 2012 Crawford & Company
16 |
 Crawford
& Company 2013 Operational Focus
17
Sustain Operating Performance through Improved Profitability
Americas improvement in U.S. Property & Casualty and Canada
Continued progress in Broadspire
Strengthen the Balance Sheet
Manage debt levels and pension obligations
Drive operating cash flow to support business growth
Enhance Total Return to Shareholders
Dividend policy to provide meaningful yield
Seek opportunities to repurchase outstanding shares below
intrinsic value |
 Crawford
& Company Most Recent 2013 Guidance
18
On February 25, 2013, Crawford reaffirmed initial full year 2013
guidance as follows:
Consolidated revenues before reimbursements between $1.05 and $1.08
billion
Consolidated operating earnings between $85.0 and $93.0 million
Consolidated cash provided by operating activities between $65.0
and
$70.0 million
After reflecting stock option expense, net corporate interest expense,
customer-relationship intangible asset amortization expense, and income
taxes, net income attributable to shareholders of Crawford & Company on
a GAAP basis between $49.0 and $54.0 million, or $0.85 to $0.95 diluted
earnings per CRDB share |
 Crawford
& Company Enhanced Return to Shareholders
Dividends and Buyback:
19
During
the
2013
first
quarter,
Crawford
paid
a
regular
quarterly
dividend
of $0.04 on CRDA and $0.03 on CRDB
Crawford also paid a special dividend of $0.06 per share on both
classes
of stock during the 2012 fourth quarter
During 2012, Crawford paid dividends of $0.20 per share on CRDA and
$0.16 per share on CRDB, or double 2011 dividends per share
Through 2012, Crawford repurchased 607,877 shares of CRDA and 7,000
shares of CRDB at an average cost of $4.63 and $3.83, respectively
2012 Total Return:
CRDA price increased 38.6%. Total return was 45.6%
CRDB price increased 29.5%. Total return was 33.9% |
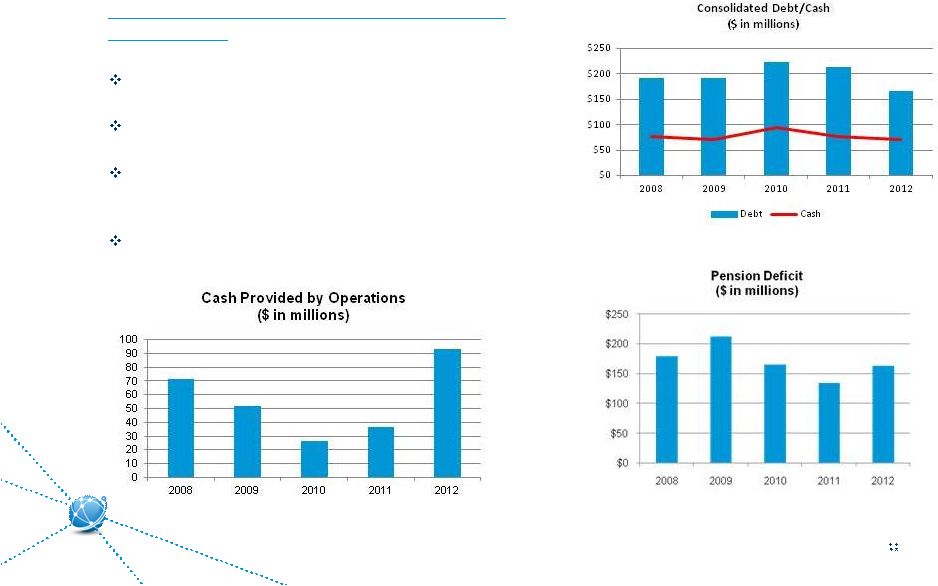 Crawford
& Company Crawford Capital Structure
20
Improving Balance Sheet Supports Return to
Shareholders
Debt reduced by $62 million, or 25% since 2010
Pension risk management implemented in 2009
Material improvement in cash flow from both
operations and working capital management
Net debt of $95.2 million at December 31, 2012 |
 Crawford
& Company Management Alignment with Shareholders
Short-Term Incentive Compensation Plan Matrix:
Business
Metric:
Corporate:
Units:
Revenues
30%
30%
Operating Earnings
25%
25%
Operating Margin
25%
25%
DSO
20%
20%
21
Stock Ownership Guidelines:
Multiple of
Officer:
Base Salary:
President/CEO
3x
CFO/EVPs
2x
Balanced short and long term system focused on strategic priorities and
aligned with shareholders
Long-term incentive compensation plan based on three-year EPS performance
tied to the Company’s strategic plan |
 Crawford
& Company Capital Structure and Governance
Class A and B Shares:
As of March 5, 2013, there were approximately 29.6 million shares of Class A Common Stock
and
24.7
million
shares
of
Class
B
Common
Stock
outstanding.
The
two
classes
are
substantially identical, except with respect to the voting rights of the Class B shares and the
greater cash dividends offered on Class A shares.
Insider Ownership:
The
Jesse
C.
Crawford
family
beneficially
owns
40.1%
of
outstanding
A
shares
and
52.0%
of
outstanding Class B shares as of March 5, 2013.
Board Diversification and Makeup:
Eight
of
nine
members
are
independent,
with
the
exception
of
the
CEO,
Jeff
Bowman.
CEO
and chairman roles are split.
22 |
 Crawford
& Company 23
CRAWFORD IS POSITIONED FOR STRONG RETURNS |
 Crawford &
Company Appendix |
 Crawford
& Company Non-GAAP Financial Information
25
Measurements of financial performance not calculated in accordance with GAAP should be
considered as supplements to, and not substitutes for, performance measurements
calculated or derived in accordance with GAAP. Any such
measures are not necessarily comparable to other similarly-titled measurements employed by
other companies. Reimbursements for Out-of-Pocket Expenses
In the normal course of our business, our operating segments incur certain
out-of-pocket expenses that are thereafter reimbursed by our clients. Under
GAAP, these out-of-pocket expenses and associated reimbursements are
required to be included when reporting expenses and revenues,
respectively, in our consolidated results of operations. In this
presentation, we do not believe it is informative to include the GAAP-required
gross up of our revenues and expenses for these pass-through reimbursed
expenses. The amounts of reimbursed expenses and related revenues offset each
other in our consolidated results of operations with no impact to our net income
or operating earnings (loss). Unless noted in this presentation, revenue
and expense amounts exclude reimbursements for out-of-pocket
expenses. Segment and Consolidated Operating Earnings
Operating earnings is the primary financial performance measure used by our senior
management and chief operating decision maker (“CODM”) to
evaluate the financial performance of our Company and operating segments, and make
resource allocation and certain compensation decisions. Management
believes operating earnings is useful to others in that it allows them to evaluate segment and consolidated operating
performance using
the same criteria our management and chief operation decision maker use.
Consolidated operating earnings (loss) represent segment earnings (loss)
including certain unallocated corporate and shared costs and credits, but before
net corporate interest expense, stock option expense, amortization of
customer-relationship intangible assets, special charges and credits, income
taxes, and net income or loss attributable to noncontrolling
interests.
Net Debt
Net debt is computed as the sum of long-term debt, capital leases and
short-term borrowings less cash and cash equivalents. Management believes
that net debt is useful because it provides investors with an estimate of what the
Company’s debt would be if all available cash was used to pay down the
debt of the Company. The measure is not meant to imply that management
plans to use all available cash to pay down debt. |
 Crawford
& Company Non-GAAP Financial Information
26
Unaudited ($ in thousands)
2008
2009
2010
2011
2012
Revenues Before Reimbursements
Total Revenues
1,135,916
$
1,048,202
$
1,110,801
$
1,211,362
$
1,266,138
$
Reimbursements
(87,334)
(78,334)
(80,384)
(86,007)
(89,421)
Revenues Before Reimbursements
1,048,582
$
969,868
$
1,030,417
$
1,125,355
$
1,176,717
$
Unaudited ($ in thousands)
2008
2009
2010
2011
2012
Operating Earnings (Loss)
Americas
28,766
$
29,394
$
20,748
$
19,851
$
11,877
$
EMEA/AP
32,999
23,401
24,828
28,421
48,585
Broadspire
3,526
(1,602)
(11,712)
(11,434)
27
Legal Settlement Administration
10,814
13,130
47,661
51,307
60,284
Unallocated corporate and shared costs, net
(6,362)
(10,996)
(5,841)
(9,555)
(10,613)
Consolidated Operating Earnings
69,743
53,327
75,684
78,590
110,160
(Deduct) Add:
Goodwill and intangible asset impairment charges
-
(140,945)
(10,788)
-
-
Net corporate interest expense
(17,622)
(14,166)
(15,002)
(15,911)
(8,607)
Stock option expense
(861)
(914)
(761)
(450)
(408)
Amortization expense
(6,025)
(5,994)
(5,995)
(6,177)
(6,373)
Special charges and credits
(788)
(4,059)
(4,650)
2,379
(11,332)
Income before income taxes
44,447
$
(112,751)
$
38,488
$
58,431
$
83,440
$
Reconciliation of Non-GAAP Items |
 Crawford
& Company Non-GAAP Financial Information, continued
27
Unaudited ($ in thousands)
December 31,
2012
Net Debt
Short-term borrowings
13,275
$
Current installments of long-term debt and capital leases
838
$
Long-term debt and capital leases, less current installments
152,293
$
Total debt
166,406
$
Less: Cash and cash equivalents
71,157
$
Net debt
95,249
$
Reconciliation of Non-GAAP Items |
 Crawford &
Company |