Attached files
| file | filename |
|---|---|
| 8-K - FORM 8-K - PEPCO HOLDINGS LLC | t76074_8k.htm |
Exhibit 99
 |
Barclays Investor Meetings
Investing Today for a Brighter Tomorrow
April 2, 2013 Atlanta, GA
|
 |
Safe Harbor Statement/Regulation G Information
Some of the statements contained in today’s presentation with respect to Pepco Holdings, Pepco, Delmarva Power and Atlantic City Electric, including each of their respective subsidiaries, are forward-looking statements within the meaning of the U.S. federal securities laws and are subject to the safe harbor created thereby under the Private Securities Litigation Reform Act of 1995. These statements include declarations regarding the intents, beliefs and current expectations of one or more of PHI, Pepco, DPL or ACE (each a Reporting Company) or their subsidiaries. In some cases you can identify forward-looking statements by terminology such as “may,” “might,” “will,” “should,” “could,” “expects,” “intends,” “assumes,” “seeks to,” “plans,” “anticipates,” “believes,” “projects,” “estimates,” “predicts,” “potential,” “future,” “goal,” “objective,” or “continue”, the negative or other variations of such terms, or comparable terminology, or by discussions of strategy that involve risks and uncertainties. Forward-looking statements involve estimates, assumptions, known and unknown risks, uncertainties and other factors that may cause one or more Reporting Companies’ or their subsidiaries’ actual results, levels of activity, performance or achievements to be materially different from any future results, levels of activity, performance or achievements expressed or implied by such forward-looking statements. Therefore, forward-looking statements are not guarantees or assurances of future performance, and actual results could differ materially from those indicated by the forward-looking statements. These forward-looking statements are qualified in their entirety by, and should be read together with, the risk factors included in the “Risk Factors” section and other statements in each Reporting Company’s annual report on Form 10-K for the year ended December 31, 2012 filed on March 1, 2013 and other Securities and Exchange Commission (SEC) filings, and investors should refer to these risk factor sections and such other statements. All such factors are difficult to predict, contain uncertainties, are beyond each Reporting Company’s or its subsidiaries’ control and may cause actual results to differ materially from those contained in the forward-looking statements. Any forward-looking statements speak only as to the date of this presentation and none of the Reporting Companies undertakes an obligation to update any forward-looking statements to reflect events or circumstances after the date on which such statements are made or to reflect the occurrence of unanticipated events. New factors emerge from time to time, and it is not possible for a Reporting Company to predict all such factors. Furthermore, it may not be possible to assess the impact of any such factor on such Reporting Company’s or its subsidiaries’ business (viewed independently or together with the business or businesses of some or all of the other Reporting Companies or their subsidiaries) or the extent to which any factor, or combination of factors, may cause results to differ materially from those contained in any forward-looking statement. Any specific factors that may be provided should not be construed as exhaustive. PHI routinely makes available important information with respect to each Reporting Company, including copies of each Reporting Company’s annual, periodic and current reports filed or furnished with the SEC under the Securities Exchange Act of 1934, on PHI’s website at http://www.pepcoholdings.com/investors. PHI recognizes its website as a key channel of distribution to reach public investors and as a means of disclosing material non-public information to comply with each Reporting Company’s disclosure obligations under SEC Regulation FD. PHI discloses net income from continuing operations and related per share data (both as historical information and earnings guidance) excluding certain items (non-GAAP financial information) because management believes that these items are not representative of PHI’s ongoing business operations. Management uses this information, and believes that such information is useful to investors, in evaluating PHI’s period-over-period performance. The inclusion of this disclosure is intended to complement, and should not be considered as an alternative to, PHI’s reported net income from continuing operations and related per share data in accordance with accounting principles generally accepted in the United States (GAAP).
1
|
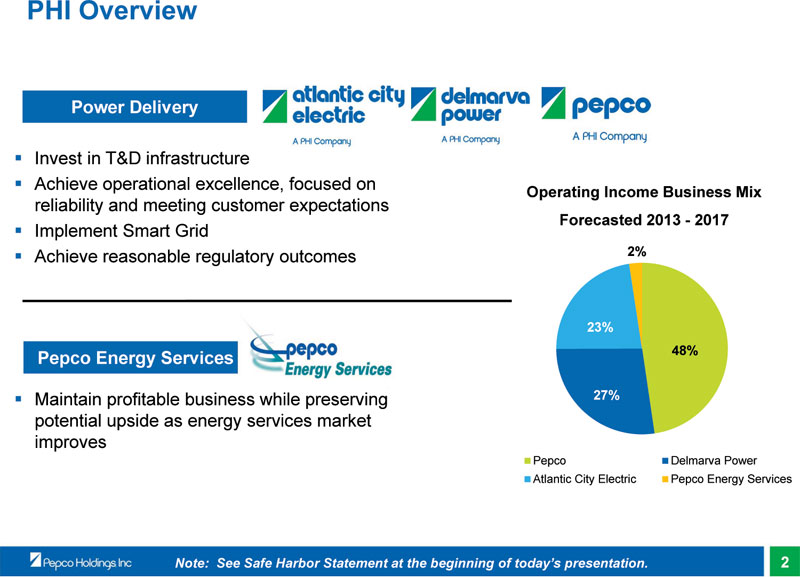 |
PHI Overview
Power Delivery
Invest in T&D infrastructure
Achieve operational excellence, focused on
Operating Income Business Mix
reliability and meeting customer expectations
Forecasted 2013 - 2017
Implement Smart Grid
Achieve reasonable regulatory outcomes 2%
23%
Pepco Energy Services 48%
Maintain profitable business while preserving 27% potential upside as energy services market improves
Pepco Delmarva Power Atlantic City Electric Pepco Energy Services
Note: See Safe Harbor Statement at the beginning of today’s presentation. 2
|
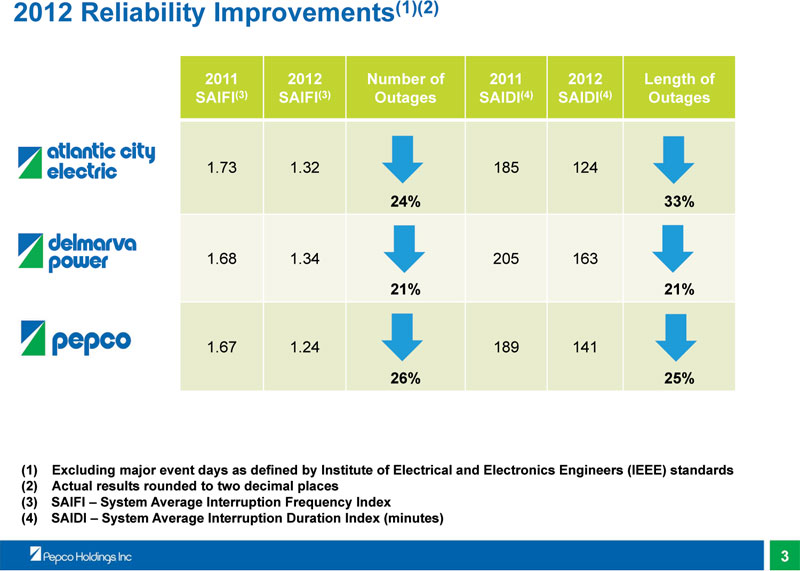 |
2012 Reliability Improvements(1)(2)
2011 2012 Number of 2011 2012 Length of SAIFI(3) SAIFI(3) Outages SAIDI(4) SAIDI(4) Outages
1.73 1.32 185 124
24% 33%
1.68 1.34 205 163
21% 21%
1.67 1.24 189 141
26% 25%
(1) Excluding major event days as defined by Institute of Electrical and Electronics Engineers (IEEE) standards (2) Actual results rounded to two decimal places (3) SAIFI – System Average Interruption Frequency Index (4) SAIDI – System Average Interruption Duration Index (minutes)
3
|
 |
Customer Satisfaction Improvements
PHI uses an independent firm (Market Strategies, Inc.) to survey its customers on a quarterly basis.
Overall satisfaction has increased at all 3 utilities since 2011. PHI’s customer satisfaction score has increased 9 percentage points since fall 2011.
Of the key drivers for customer satisfaction, reliability and restoration performance are the most important to customers. Customer satisfaction in this area is improving, with high scores for Delmarva Power (92%) and Atlantic City Electric (89%), and increasing scores for Pepco (75%).
In a recent JD Power survey on Hurricane Sandy performance, Atlantic City Electric was recognized for storm restoration and communications efforts. Atlantic City Electric, Delmarva Power, and Pepco all received above average ratings.
In JD Power’s 2012 survey, Delmarva Power and Atlantic City Electric scored well, ranking 3rd and 5th, respectively (Residential Customers East Region, Midsize Segment) out of 14 utilities.
Pepco’s ranking improved, but still fell below average (Residential Customers East Region, Large Segment).
4
|
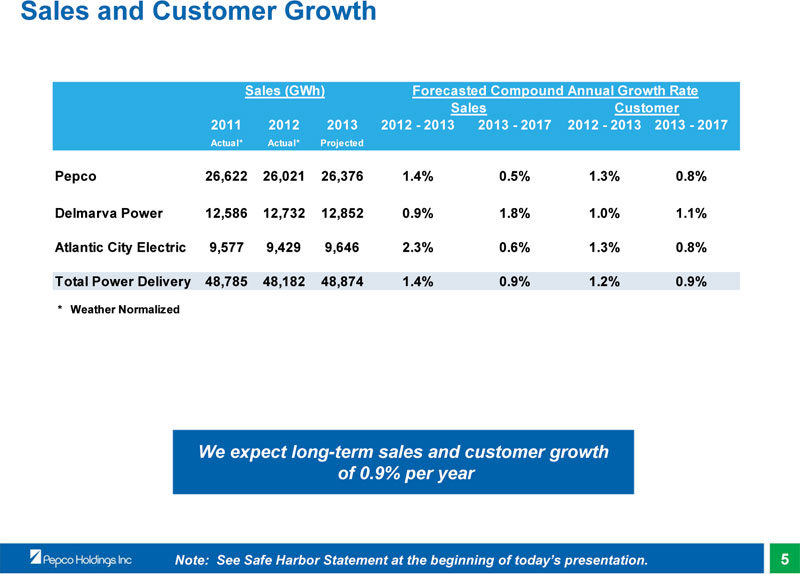 |
Sales and Customer Growth
Sales (GWh) Forecasted Compound Annual Growth Rate Sales Customer 2011 2012 2013 2012 - 2013 2013 - 2017 2012 - 2013 2013 - 2017
Actual* Actual* Projected
Pepco 26,622 26,021 26,376 1.4% 0.5% 1.3% 0.8%
Delmarva Power 12,586 12,732 12,852 0.9% 1.8% 1.0% 1.1% Atlantic City Electric 9,577 9,429 9,646 2.3% 0.6% 1.3% 0.8% Total Power Delivery 48,785 48,182 48,874 1.4% 0.9% 1.2% 0.9%
* Weather Normalized
We expect long-term sales and customer growth of 0.9% per year
Note: See Safe Harbor Statement at the beginning of today’s presentation. 5
|
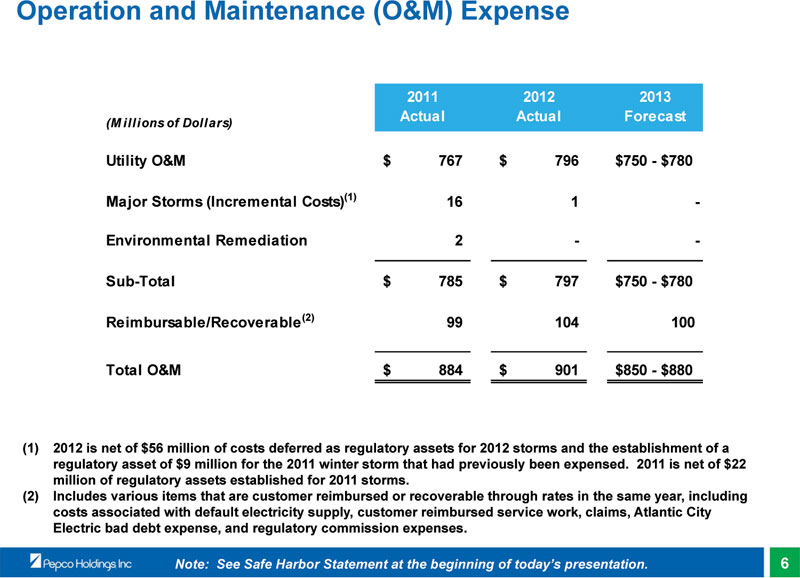 |
Operation and Maintenance (O&M) Expense
2011 2012 2013 Actual Actual Forecast
(M illions of Dollars)
Utility O&M $ 767 $ 796 $750 - $780
Major Storms (Incremental Costs)(1) 16 1 -
Environmental Remediation 2 - -
Sub-Total $ 785 $ 797 $750 - $780 Reimbursable/Recoverable(2) 99 104 100 Total O&M $ 884 $ 901 $850 - $880
(1) 2012 is net of $56 million of costs deferred as regulatory assets for 2012 storms and the establishment of a regulatory asset of $9 million for the 2011 winter storm that had previously been expensed. 2011 is net of $22 million of regulatory assets established for 2011 storms.
(2) Includes various items that are customer reimbursed or recoverable through rates in the same year, including costs associated with default electricity supply, customer reimbursed service work, claims, Atlantic City Electric bad debt expense, and regulatory commission expenses.
Note: See Safe Harbor Statement at the beginning of today’s presentation. 6
|
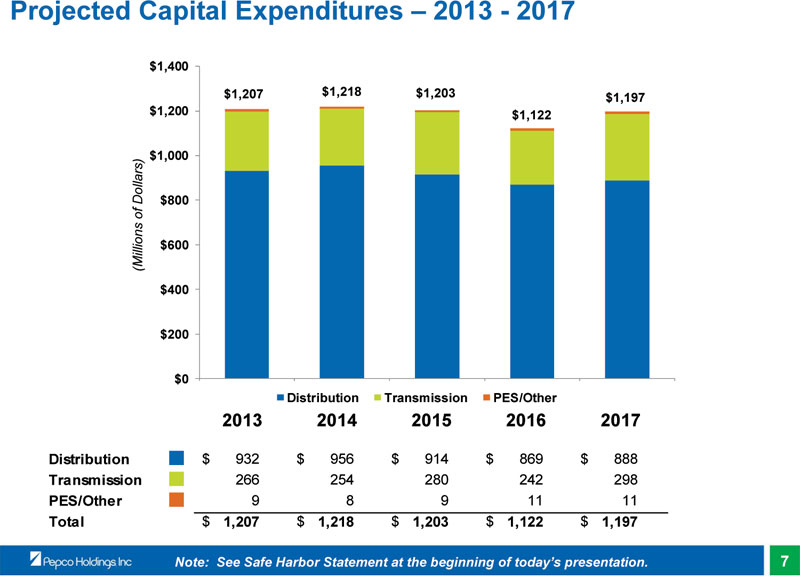 |
Projected Capital Expenditures – 2013 - 2017
$1,400 $1,207 $1,218 $1,203 $1,197 $1,200 $1,122
$1,000
$800
(Millions of Dollars) $600 $400
$200
$0
2013 2014 2015 2016 2017
Distribution Transmission PES/Other
2013 2014 2015 2016 2017
Distribution $ 932 $ 956 $ 914 $ 869 $ 888 Transmission 266 254 280 242 298 PES/Other 9 8 9 11 11
Total $ 1,207 $ 1,218 $ 1,203 $ 1,122 $ 1,197
Note: See Safe Harbor Statement at the beginning of today’s presentation. 7
|
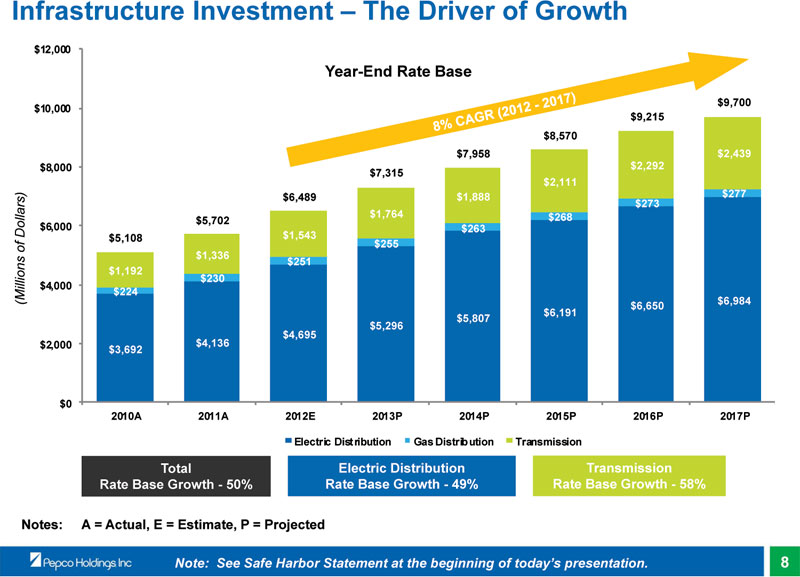 |
Infrastructure Investment – The Driver of Growth
$12,000
Year-End Rate Base
$9,700 $10,000 $9,215 $8,570 $7,958 $2,439 $8,000 $2,292 $7,315 $2,111 $6,489 $1,888 $277 $273 $1,764 $268 $5,702 $6,000 $263 $5,108 $1,543 $255 $1,336 $251 $1,192 $230 $4,000 $224
(Millions of Dollars) $6,984
$6,650 $6,191 $5,807 $5,296 $4,695 $2,000 $4,136 $3,692
$0
2010A 2011A 2012E 2013P 2014P 2015P 2016P 2017P
Electric Distribution Gas Distribution Transmission
Total Electric Distribution Transmission Rate Base Growth - 50% Rate Base Growth - 49% Rate Base Growth - 58%
Notes: A = Actual, E = Estimate, P = Projected
Note: See Safe Harbor Statement at the beginning of today’s presentation. 8
|
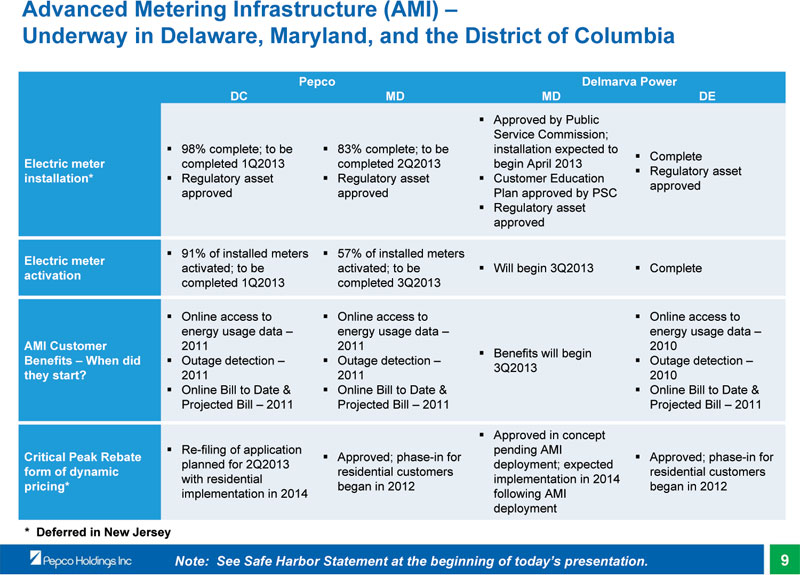 |
Advanced Metering Infrastructure (AMI) –
Underway in Delaware, Maryland, and the District of Columbia
Pepco Delmarva Power DC MD MD DE
Approved by Public Service Commission; 98% complete; to be 83% complete; to be installation expected to
Complete Electric meter completed 1Q2013 completed 2Q2013 begin April 2013Regulatory asset installation* Regulatory asset Regulatory asset Customer Education approved approved approved Plan approved by PSC
Regulatory asset approved
91% of installed meters 57% of installed meters
Electric meter activated; to be activated; to be Will begin 3Q2013 Complete activation completed 1Q2013 completed 3Q2013
Online access to Online access to Online access to energy usage data – energy usage data – energy usage data –
AMI Customer 2011 2011 2010
Benefits will begin
Benefits – When did Outage detection – Outage detection – Outage detection –3Q2013 they start? 2011 2011 2010Online Bill to Date & Online Bill to Date & Online Bill to Date & Projected Bill – 2011 Projected Bill – 2011 Projected Bill – 2011
Approved in concept Re-filing of application pending AMI
Critical Peak Rebate Approved; phase-in for Approved; phase-in for planned for 2Q2013 deployment; expected form of dynamic residential customers residential customers with residential implementation in 2014 pricing* began in 2012 began in 2012 implementation in 2014 following AMI deployment
* Deferred in New Jersey
Note: See Safe Harbor Statement at the beginning of today’s presentation. 9
|
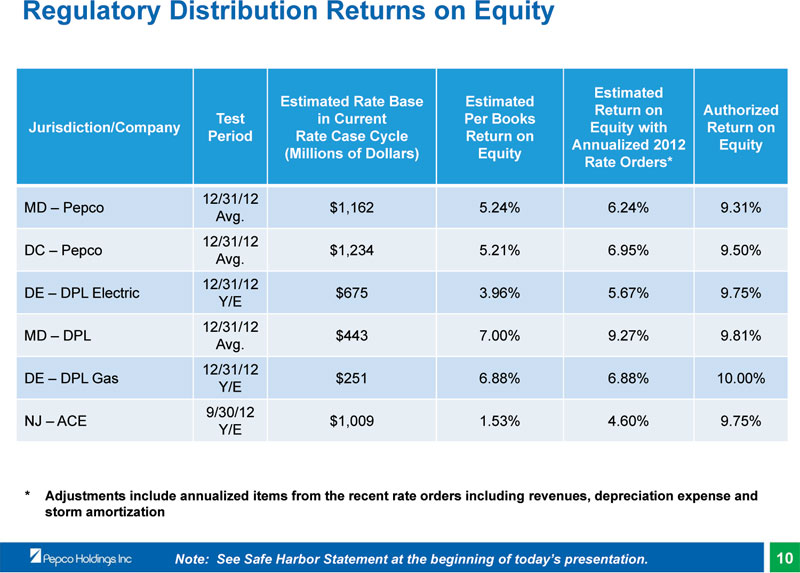 |
Regulatory Distribution Returns on Equity
Estimated Estimated Rate Base Estimated
Return on Authorized Test in Current Per Books Jurisdiction/Company Equity with Return on Period Rate Case Cycle Return on Annualized 2012 Equity (Millions of Dollars) Equity Rate Orders*
12/31/12
MD – Pepco $1,162 5.24% 6.24% 9.31% Avg.
12/31/12
DC – Pepco $1,234 5.21% 6.95% 9.50% Avg.
12/31/12
DE – DPL Electric $675 3.96% 5.67% 9.75% Y/E
12/31/12
MD – DPL $443 7.00% 9.27% 9.81% Avg.
12/31/12
DE – DPL Gas $251 6.88% 6.88% 10.00% Y/E
9/30/12
NJ – ACE $1,009 1.53% 4.60% 9.75% Y/E
* Adjustments include annualized items from the recent rate orders including revenues, depreciation expense and storm amortization
Note: See Safe Harbor Statement at the beginning of today’s presentation. 10
|
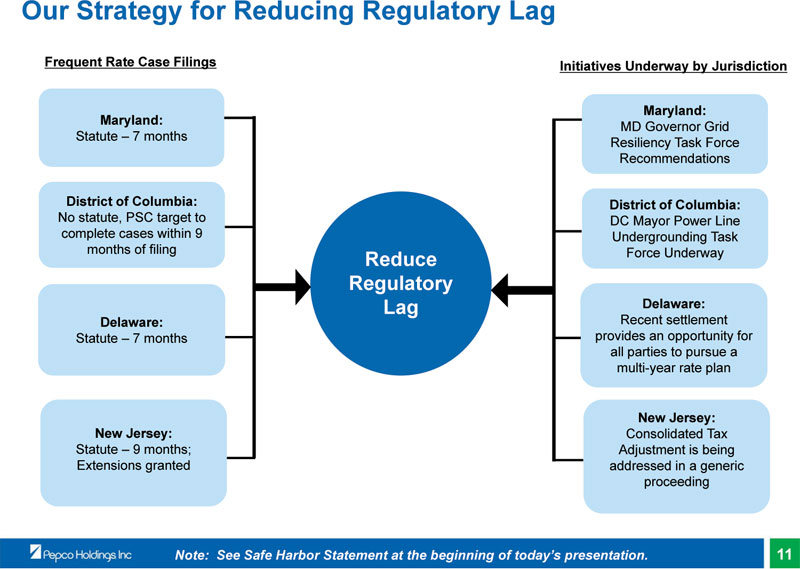 |
Our Strategy for Reducing Regulatory Lag
Frequent Rate Case Filings Initiatives Underway by Jurisdiction
Maryland: Maryland:
MD Governor Grid Statute – 7 months Resiliency Task Force Recommendations
District of Columbia: District of Columbia:
No statute, PSC target to DC Mayor Power Line complete cases within 9 Undergrounding Task months of filing Force Underway
Reduce Regulatory
Lag Delaware: Delaware: Recent settlement Statute – 7 months provides an opportunity for all parties to pursue a multi-year rate plan
New Jersey: New Jersey: Consolidated Tax Statute – 9 months; Adjustment is being Extensions granted addressed in a generic proceeding
Note: See Safe Harbor Statement at the beginning of today’s presentation. 11
|
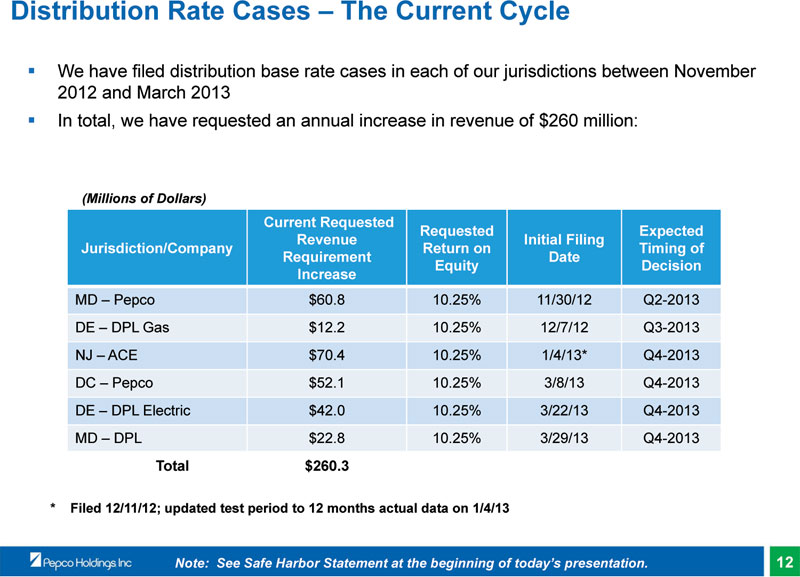 |
Distribution Rate Cases – The Current Cycle
We have filed distribution base rate cases in each of our jurisdictions between November 2012 and March 2013 In total, we have requested an annual increase in revenue of $260 million:
(Millions of Dollars)
Current Requested
Requested Expected Revenue Initial Filing Jurisdiction/Company Return on Timing of Requirement Date Equity Decision Increase
MD – Pepco $60.8 10.25% 11/30/12 Q2-2013 DE – DPL Gas $12.2 10.25% 12/7/12 Q3-2013 NJ – ACE $70.4 10.25% 1/4/13* Q4-2013 DC – Pepco $52.1 10.25% 3/8/13 Q4-2013 DE – DPL Electric $42.0 10.25% 3/22/13 Q4-2013 MD – DPL $22.8 10.25% 3/29/13 Q4-2013
Total $260.3
* Filed 12/11/12; updated test period to 12 months actual data on 1/4/13
Note: See Safe Harbor Statement at the beginning of today’s presentation. 12
|
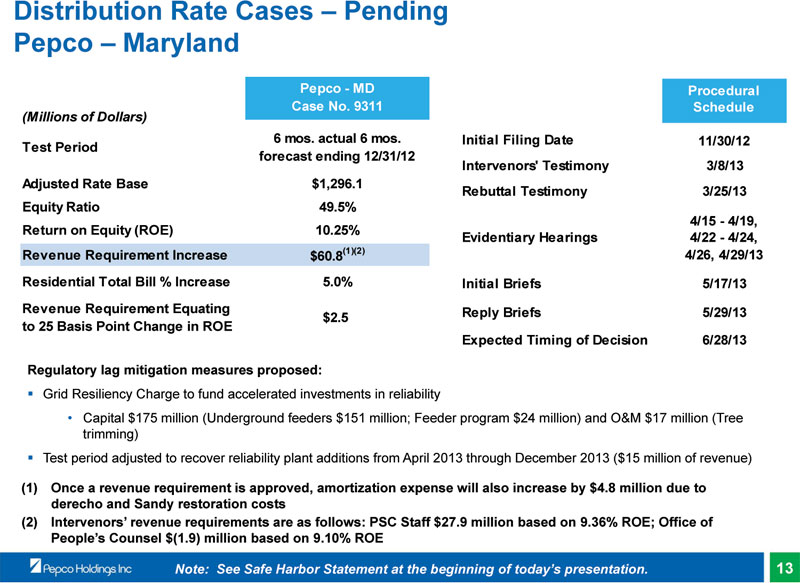 |
Distribution Rate Cases – Pending Pepco – Maryland
Pepco - MD Procedural Case No. 9311 Schedule
(Millions of Dollars)
6 mos. actual 6 mos. Initial Filing Date 11/30/12 Test Period forecast ending 12/31/12 Intervenors' Testimony 3/8/13 Adjusted Rate Base $1,296.1 Rebuttal Testimony 3/25/13 Equity Ratio 49.5% 4/15 - 4/19, Return on Equity (ROE) 10.25% Evidentiary Hearings 4/22 - 4/24, Revenue Requirement Increase $60.8(1)(2) 4/26, 4/29/13 Residential Total Bill % Increase 5.0% Initial Briefs 5/17/13 Revenue Requirement Equating Reply Briefs 5/29/13 $2.5 to 25 Basis Point Change in ROE
Expected Timing of Decision 6/28/13
Regulatory lag mitigation measures proposed:
Grid Resiliency Charge to fund accelerated investments in reliability
• Capital $175 million (Underground feeders $151 million; Feeder program $24 million) and O&M $17 million (Tree trimming)Test period adjusted to recover reliability plant additions from April 2013 through December 2013 ($15 million of revenue)
(1) Once a revenue requirement is approved, amortization expense will also increase by $4.8 million due to derecho and Sandy restoration costs (2) Intervenors’ revenue requirements are as follows: PSC Staff $27.9 million based on 9.36% ROE; Office of People’s Counsel $(1.9) million based on 9.10% ROE
Note: See Safe Harbor Statement at the beginning of today’s presentation. 13
|
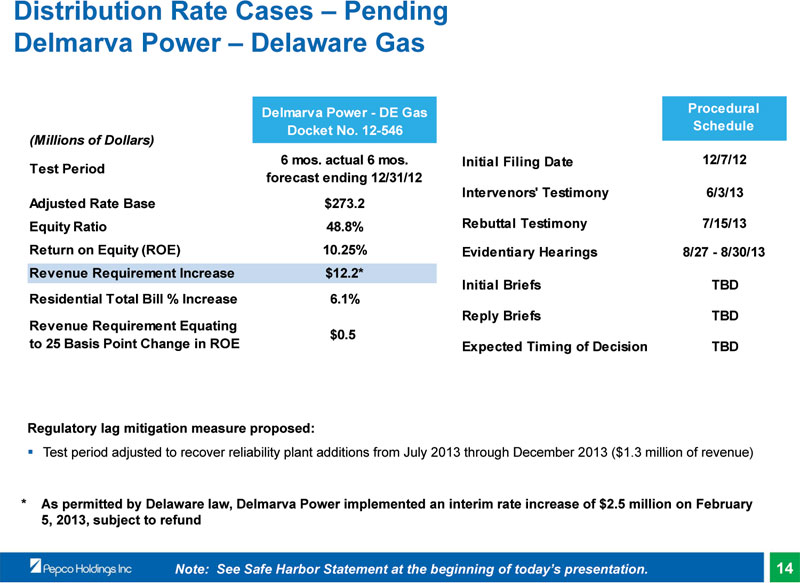 |
Distribution Rate Cases – Pending Delmarva Power – Delaware Gas
Delmarva Power - DE Gas Procedural Docket No. 12-546 Schedule
(Millions of Dollars)
6 mos. actual 6 mos. Initial Filing Date 12/7/12 Test Period forecast ending 12/31/12 Intervenors' Testimony 6/3/13 Adjusted Rate Base $273.2 Equity Ratio 48.8% Rebuttal Testimony 7/15/13 Return on Equity (ROE) 10.25% Evidentiary Hearings 8/27 - 8/30/13 Revenue Requirement Increase $12.2* Initial Briefs TBD Residential Total Bill % Increase 6.1% Reply Briefs TBD Revenue Requirement Equating $0.5 to 25 Basis Point Change in ROE Expected Timing of Decision TBD
Regulatory lag mitigation measure proposed:
Test period adjusted to recover reliability plant additions from July 2013 through December 2013 ($1.3 million of revenue)
* As permitted by Delaware law, Delmarva Power implemented an interim rate increase of $2.5 million on February 5, 2013, subject to refund
Note: See Safe Harbor Statement at the beginning of today’s presentation. 14
|
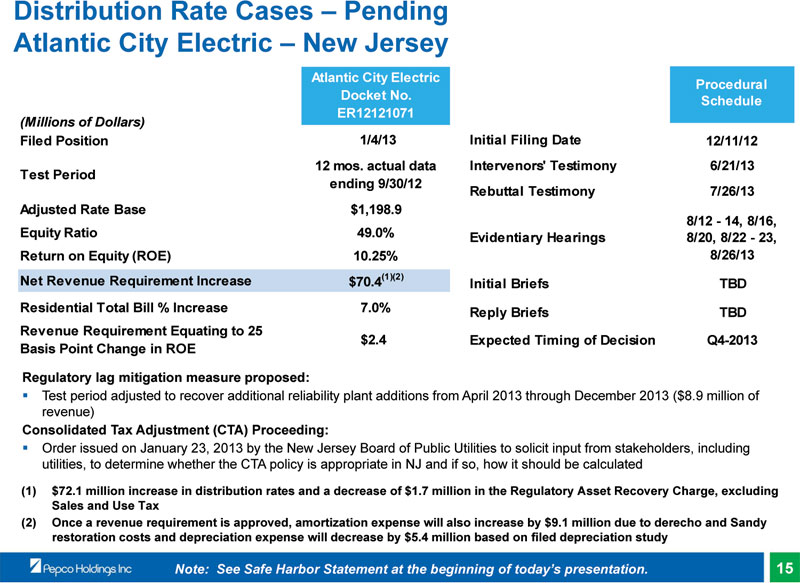 |
Distribution Rate Cases – Pending Atlantic City Electric – New Jersey
Atlantic City Electric
Procedural Docket No. Schedule ER12121071
(Millions of Dollars)
Filed Position 1/4/13 Initial Filing Date 12/11/12 12 mos. actual data Intervenors' Testimony 6/21/13 Test Period ending 9/30/12 Rebuttal Testimony 7/26/13 Adjusted Rate Base $1,198.9 8/12 - 14, 8/16, Equity Ratio 49.0% Evidentiary Hearings 8/20, 8/22 - 23, Return on Equity (ROE) 10.25% 8/26/13 Net Revenue Requirement Increase $70.4(1)(2) Initial Briefs TBD Residential Total Bill % Increase 7.0% Reply Briefs TBD Revenue Requirement Equating to 25 $2.4 Expected Timing of Decision Q4-2013 Basis Point Change in ROE
Regulatory lag mitigation measure proposed:
Test period adjusted to recover additional reliability plant additions from April 2013 through December 2013 ($8.9 million of revenue)
Consolidated Tax Adjustment (CTA) Proceeding:
Order issued on January 23, 2013 by the New Jersey Board of Public Utilities to solicit input from stakeholders, including utilities, to determine whether the CTA policy is appropriate in NJ and if so, how it should be calculated
(1) $72.1 million increase in distribution rates and a decrease of $1.7 million in the Regulatory Asset Recovery Charge, excluding Sales and Use Tax (2) Once a revenue requirement is approved, amortization expense will also increase by $9.1 million due to derecho and Sandy restoration costs and depreciation expense will decrease by $5.4 million based on filed depreciation study
Note: See Safe Harbor Statement at the beginning of today’s presentation. 15
|
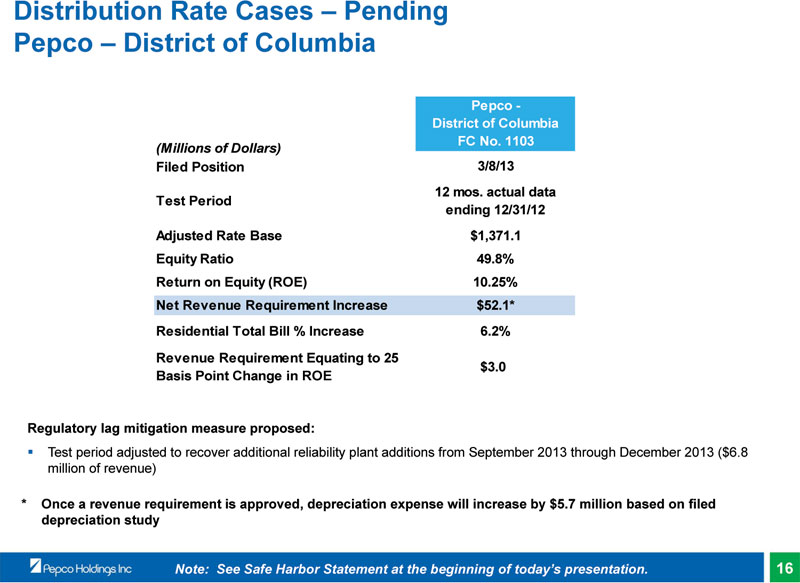 |
Distribution Rate Cases – Pending Pepco – District of Columbia
Pepco - District of Columbia FC No. 1103
(Millions of Dollars)
Filed Position 3/8/13 12 mos. actual data Test Period ending 12/31/12 Adjusted Rate Base $1,371.1 Equity Ratio 49.8% Return on Equity (ROE) 10.25% Net Revenue Requirement Increase $52.1* Residential Total Bill % Increase 6.2% Revenue Requirement Equating to 25 $3.0 Basis Point Change in ROE
Regulatory lag mitigation measure proposed:
Test period adjusted to recover additional reliability plant additions from September 2013 through December 2013 ($6.8 million of revenue)
* Once a revenue requirement is approved, depreciation expense will increase by $5.7 million based on filed depreciation study
Note: See Safe Harbor Statement at the beginning of today’s presentation. 16
|
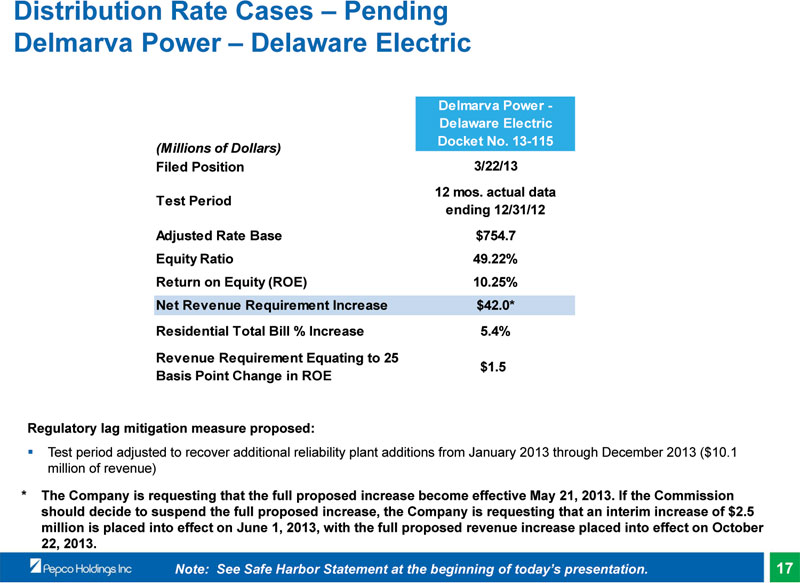 |
Distribution Rate Cases – Pending Delmarva Power – Delaware Electric
Delmarva Power - Delaware Electric Docket No. 13-115
(Millions of Dollars)
Filed Position 3/22/13 12 mos. actual data Test Period ending 12/31/12 Adjusted Rate Base $754.7 Equity Ratio 49.22% Return on Equity (ROE) 10.25% Net Revenue Requirement Increase $42.0* Residential Total Bill % Increase 5.4% Revenue Requirement Equating to 25 $1.5 Basis Point Change in ROE
Regulatory lag mitigation measure proposed:
Test period adjusted to recover additional reliability plant additions from January 2013 through December 2013 ($10.1 million of revenue)
* The Company is requesting that the full proposed increase become effective May 21, 2013. If the Commission should decide to suspend the full proposed increase, the Company is requesting that an interim increase of $2.5 million is placed into effect on June 1, 2013, with the full proposed revenue increase placed into effect on October 22, 2013.
Note: See Safe Harbor Statement at the beginning of today’s presentation. 17
|
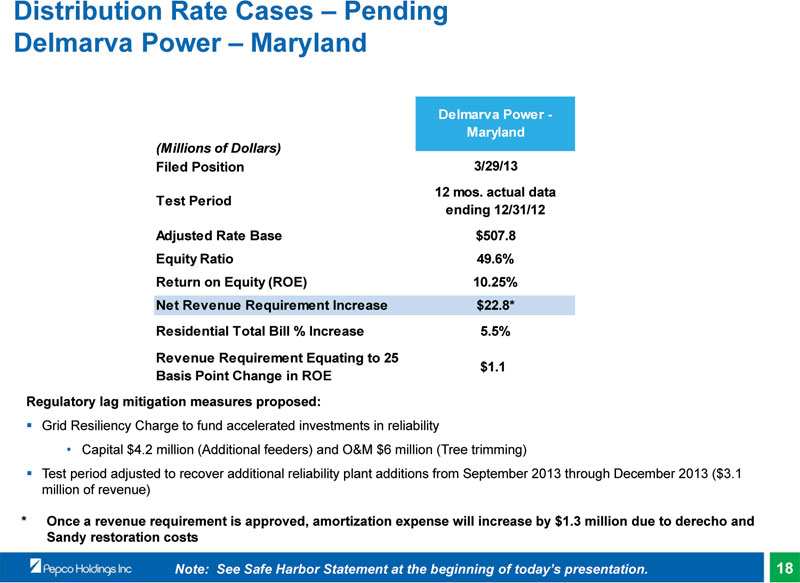 |
Distribution Rate Cases – Pending Delmarva Power – Maryland
Delmarva Power - Maryland
(Millions of Dollars)
Filed Position 3/29/13 12 mos. actual data Test Period ending 12/31/12 Adjusted Rate Base $507.8 Equity Ratio 49.6% Return on Equity (ROE) 10.25% Net Revenue Requirement Increase $22.8* Residential Total Bill % Increase 5.5% Revenue Requirement Equating to 25 $1.1 Basis Point Change in ROE
Regulatory lag mitigation measures proposed:
Grid Resiliency Charge to fund accelerated investments in reliability
• Capital $4.2 million (Additional feeders) and O&M $6 million (Tree trimming)
Test period adjusted to recover additional reliability plant additions from September 2013 through December 2013 ($3.1 million of revenue)
* Once a revenue requirement is approved, amortization expense will increase by $1.3 million due to derecho and Sandy restoration costs
Note: See Safe Harbor Statement at the beginning of today’s presentation. 18
|
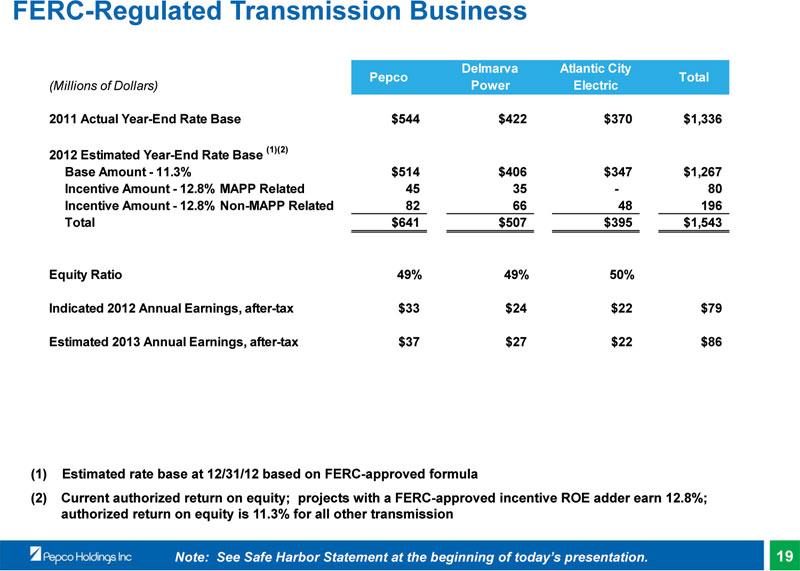 |
FERC-Regulated Transmission Business
Delmarva Atlantic City
Pepco Total
(Millions of Dollars) Power Electric
2011 Actual Year-End Rate Base $544 $422 $370 $1,336
2012 Estimated Year-End Rate Base (1)(2)
Base Amount - 11.3% $514 $406 $347 $1,267 Incentive Amount - 12.8% MAPP Related 45 35 - 80 Incentive Amount - 12.8% Non-MAPP Related 82 66 48 196 Total $641 $507 $395 $1,543
Equity Ratio 49% 49% 50%
Indicated 2012 Annual Earnings, after-tax $33 $24 $22 $79
Estimated 2013 Annual Earnings, after-tax $37 $27 $22 $86
(1) Estimated rate base at 12/31/12 based on FERC-approved formula
(2) Current authorized return on equity; projects with a FERC-approved incentive ROE adder earn 12.8%; authorized return on equity is 11.3% for all other transmission
Note: See Safe Harbor Statement at the beginning of today’s presentation. 19
|
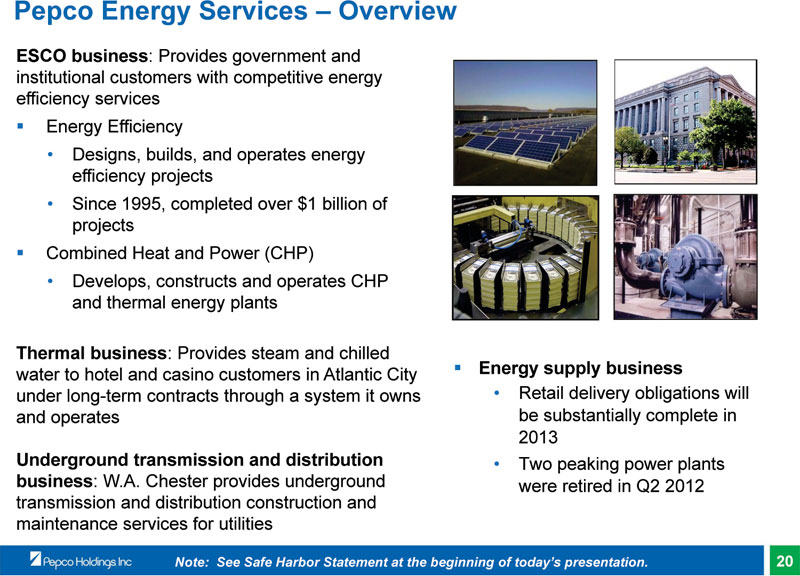 |
Pepco Energy Services – Overview
ESCO business: Provides government and institutional customers with competitive energy efficiency services Energy Efficiency
• Designs, builds, and operates energy efficiency projects
• Since 1995, completed over $1 billion of projects Combined Heat and Power (CHP)
• Develops, constructs and operates CHP and thermal energy plants
Thermal business: Provides steam and chilled water to hotel and casino customers in Atlantic City Energy supply business under long-term contracts through a system it owns • Retail delivery obligations will and operates be substantially complete in 2013
Underground transmission and distribution • Two peaking power plants business: W.A. Chester provides underground were retired in Q2 2012 transmission and distribution construction and maintenance services for utilities
Note: See Safe Harbor Statement at the beginning of today’s presentation. 20
|
 |
Pepco Energy Services – ESCO Market - Challenged
The ESCO market experienced a Energy Efficiency Contracts Signed and Project Development Pipeline
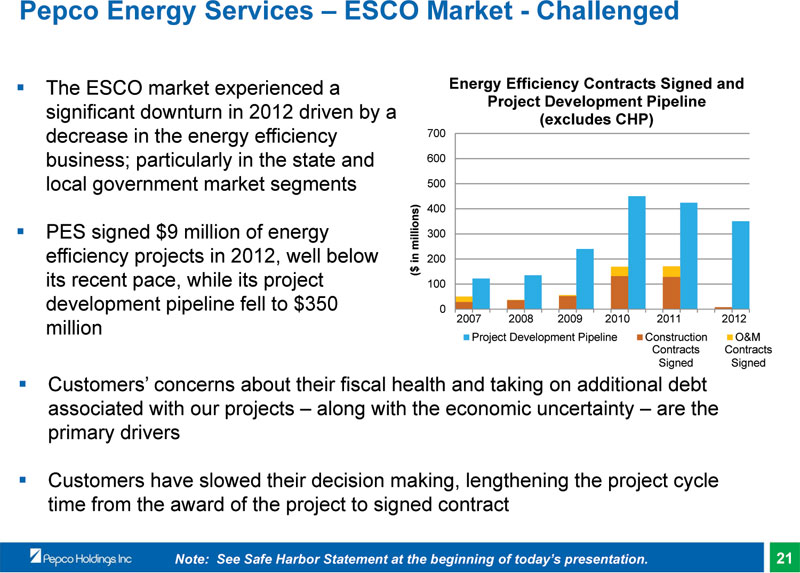
significant downturn in 2012 driven by a (excludes CHP) decrease in the energy efficiency 700 business; particularly in the state and 600 local government market segments 500
400
PES signed $9 million of energy 300 efficiency projects in 2012, well below ($ in millions) 200 its recent pace, while its project 100 development pipeline fell to $350 0
million 2007 2008 2009 2010 2011 2012 Project Development Pipeline Construction O&M
Contracts Contracts Signed Signed
Customers’ concerns about their fiscal health and taking on additional debt associated with our projects – along with the economic uncertainty – are the primary drivers
Customers have slowed their decision making, lengthening the project cycle time from the award of the project to signed contract
Note: See Safe Harbor Statement at the beginning of today’s presentation. 21
|
 |
Pepco Energy Services – 2013 Outlook
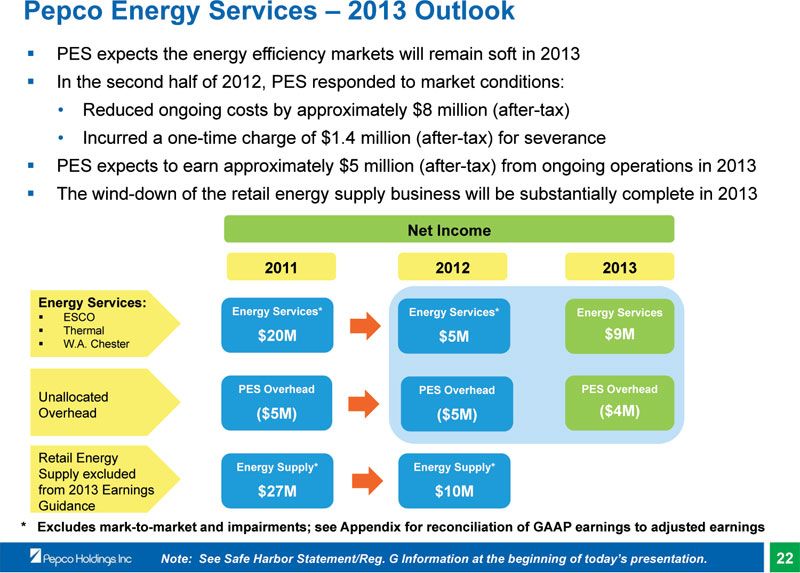
PES expects the energy efficiency markets will remain soft in 2013 In the second half of 2012, PES responded to market conditions:
• Reduced ongoing costs by approximately $8 million (after-tax)
• Incurred a one-time charge of $1.4 million (after-tax) for severance
PES expects to earn approximately $5 million (after-tax) from ongoing operations in 2013 The wind-down of the retail energy supply business will be substantially complete in 2013
Net Income
2011 2012 2013
Energy Services:
Energy Services* Energy Services* Energy Services
ESCO
Thermal $20M $5M $9M
W.A. Chester
PES Overhead PES Overhead PES Overhead
Unallocated
Overhead ($5M) ($5M) ($4M)
Retail Energy
Energy Supply* Energy Supply*
Supply excluded from 2013 Earnings $27M $10M Guidance
* Excludes mark-to-market and impairments; see Appendix for reconciliation of GAAP earnings to adjusted earnings
Note: See Safe Harbor Statement/Reg. G Information at the beginning of today’s presentation. 22
|
 |
Cross-Border Energy Leases
In January 2013, an appellate court issued an opinion in a Consolidated Edison case that disallowed tax benefits associated with certain cross-border energy lease transactions After updating our assessment of PHI’s cross-border energy leases, we expect to record an estimated non-cash charge to earnings of between $355 - $380 million, after-tax, in the first quarter of 2013, which includes:
• Recalculation of the book value of the leases
• Interest on disallowed federal income tax deductions from January 1, 2001 through March 31, 2013
Deposit made with the IRS for additional taxes and related interest of $242 million on March 4, 2013
• Takes into account tax benefits from matters unrelated to the leases that offset the amount of taxes and interest due
• Funded with short-term debt
We continue to evaluate a partial or full liquidation of the cross-border lease investments which could be accomplished within one yearThe financial impacts do not affect our core utility operations; the leases are legacy investments that were made through non-regulated subsidiaries between 1994 and 2002
Note: See Safe Harbor Statement at the beginning of today’s presentation. 23
|
 |
2013 Financing Activity
Debt Issuance
Utility long-term debt issuance of $750 - $850 million*
• Pepco ~$400 million of which $250 million was issued March 18, 2013; ($200 million maturing)
• Delmarva Power ~$300 million ($250 million maturing)
• Atlantic City Electric ~$100 million ($69 million maturing)
Equity Issuance
Equity forward transaction entered into on March 5, 2012; settled on February 27, 2013
• 17.92 million shares priced at $19.25 per share
• Net proceeds of $312 million used to repay outstanding commercial paper, a portion of which was issued in order to make capital contributions to the utility subsidiaries, and for general corporate purposes
Dividend Reinvestment Plan/Employee Savings Plan (approximately $42 million)
Assuming the unwind of the majority of the cross-border energy lease portfolio, next anticipated equity issuance will be beyond 2014
* Debt issuance amounts may be reduced due to proceeds received in connection with the unwind of the cross-border energy lease portfolio.
Note: See Safe Harbor Statement at the beginning of today’s presentation. 24
|
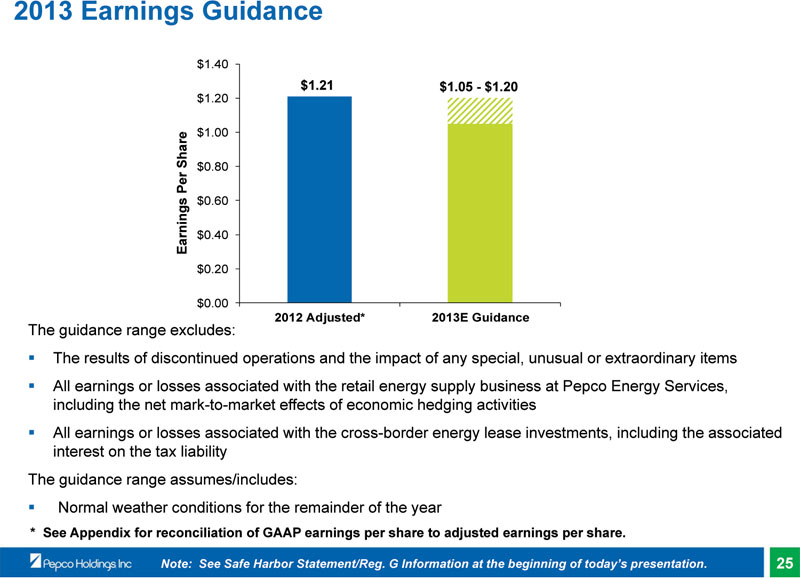 |
2013 Earnings Guidance
$1.40 $1.21 $1.05 - $1.20 $1.20
$1.00
$0.80
$0.60
Earnings Per Share $0.40 $0.20
$0.00
2012 Adjusted* 2013E Guidance
The guidance range excludes:
The results of discontinued operations and the impact of any special, unusual or extraordinary itemsAll earnings or losses associated with the retail energy supply business at Pepco Energy Services, including the net mark-to-market effects of economic hedging activities All earnings or losses associated with the cross-border energy lease investments, including the associated interest on the tax liability The guidance range assumes/includes: Normal weather conditions for the remainder of the year
* See Appendix for reconciliation of GAAP earnings per share to adjusted earnings per share.
Note: See Safe Harbor Statement/Reg. G Information at the beginning of today’s presentation. 25
|
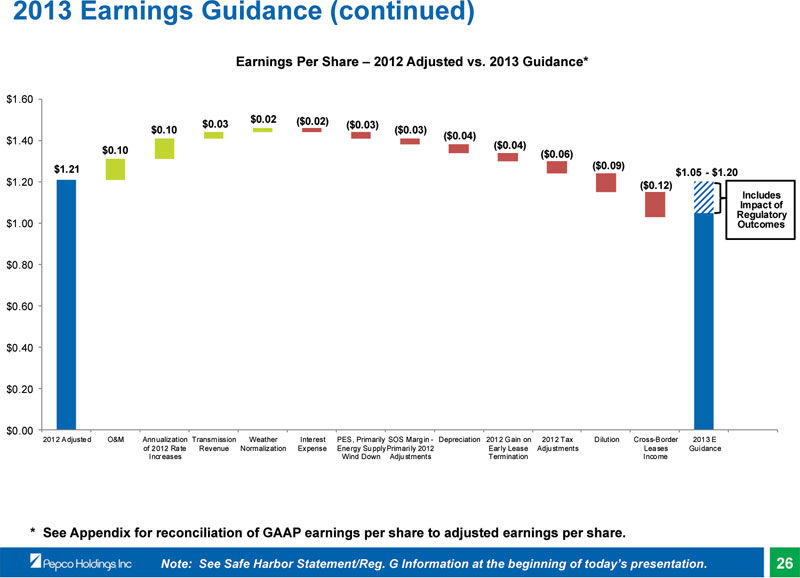 |
2013 Earnings Guidance (continued)
Earnings Per Share – 2012 Adjusted vs. 2013 Guidance*
$1.60 $0.02 ($0.02) $0.03 ($0.03) $0.10 ($0.03)
($0.04) $1.40 ($0.04) $0.10 ($0.06) $1.21 ($0.09) $1.05 - $1.20 $1.20 ($0.12)
Includes Impact of Regulatory $1.00 Outcomes
$0.80 $0.60 $0.40 $0.20
$0.00
2012 Adjusted O&M Annualization Transmission Weather Interest PES, Primarily SOS Margin - Depreciation 2012 Gain on 2012 Tax Dilution Cross-Border 2013 E of 2012 Rate Revenue Normalization Expense Energy SupplyPrimarily 2012 Early Lease Adjustments Leases Guidance Increases Wind Down Adjustments Termination Income
* See Appendix for reconciliation of GAAP earnings per share to adjusted earnings per share.
Note: See Safe Harbor Statement/Reg. G Information at the beginning of today’s presentation. 26
|
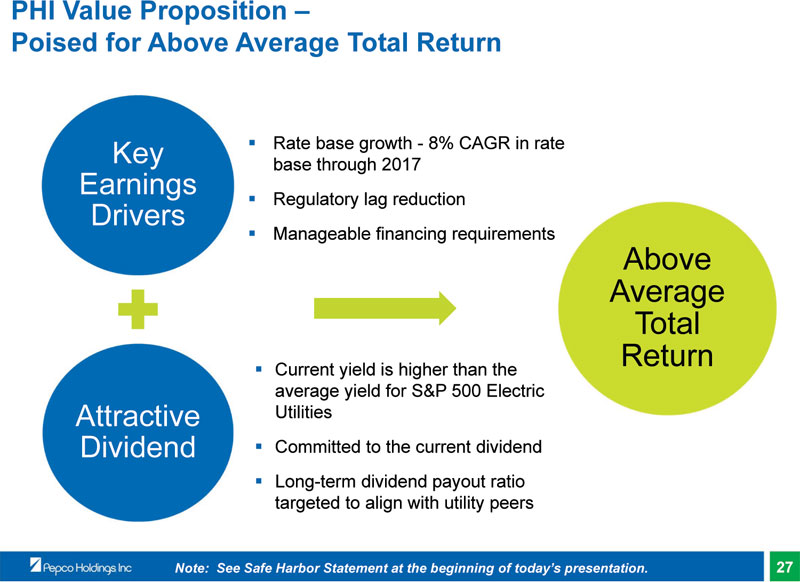 |
PHI Value Proposition –
Poised for Above Average Total Return
Key Rate base growth - 8% CAGR in rate base through 2017
Earnings
Regulatory lag reduction
Drivers
Manageable financing requirements
Above Average Total Return
Current yield is higher than the average yield for S&P 500 Electric
Attractive Utilities
Dividend Committed to the current dividendLong-term dividend payout ratio targeted to align with utility peers
Note: See Safe Harbor Statement at the beginning of today’s presentation. 27
|
 |
Appendix
|
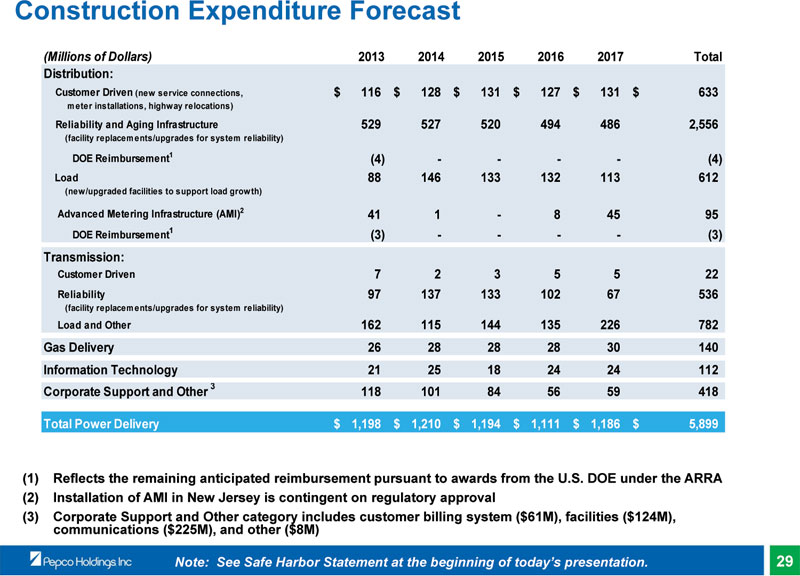 |
Construction Expenditure Forecast
(Millions of Dollars) 2013 2014 2015 2016 2017 Total Distribution: Customer Driven (new service connections, $ 116 $ 128 $ 131 $ 127 $ 131 $ 633
meter installations, highway relocations)
Reliability and Aging Infrastructure 529 527 520 494 486 2,556
(facility replacements/upgrades for system reliability)
DOE Reimbursement1 (4) - - - - (4) Load 88 146 133 132 113 612
(new/upgraded facilities to support load growth)
Advanced Metering Infrastructure (AMI)2 41 1 - 8 45 95 DOE Reimbursement1 (3) - - - - (3) Transmission: Customer Driven 7 2 3 5 5 22 Reliability 97 137 133 102 67 536
(facility replacements/upgrades for system reliability)
Load and Other 162 115 144 135 226 782 Gas Delivery 26 28 28 28 30 140 Information Technology 21 25 18 24 24 112 Corporate Support and Other 3 118 101 84 56 59 418
Total Power Delivery $ 1,198 $ 1,210 $ 1,194 $ 1,111 $ 1,186 $ 5,899
(1) Reflects the remaining anticipated reimbursement pursuant to awards from the U.S. DOE under the ARRA (2) Installation of AMI in New Jersey is contingent on regulatory approval (3) Corporate Support and Other category includes customer billing system ($61M), facilities ($124M), communications ($225M), and other ($8M)
Note: See Safe Harbor Statement at the beginning of today’s presentation. 29
|
 |
Pepco Undergrounding Status – Maryland
The Maryland rate case filed in December 2012 outlined a plan to underground certain distribution feeders:
• Immediate recommendation to underground 6 distribution feeders (3 each in Montgomery and Prince George’s counties)
• Selection based on the 3 feeders in each county with the highest opportunity for improvement in both frequency and duration of outages
• Undergrounding work to be performed during 2014 and 2015 at a combined cost of $151 million
• The filing also contained proposals to accelerate priority feeder work ($12 million per year for 2 years), and tree trimming ($17 million)In addition, the rate case filing:
• Indicated that we are examining options for undergrounding portions of the 69kV supply lines that feed certain distribution substations
• Outlined a five-year plan (approximately $200 million per year) for continuing to underground additional distribution feeders
30
|
 |
FERC Filing Challenging Our Transmission Rates
On February 27, 2013, the public utilities commissions and public advocates in all four of our jurisdictions made a Section 206 filing at FERC challenging the transmission rates of each of the Company’s three utilities Two primary issues included in the filing:
• Request to reduce the ROE base to 8.7% based on a zone of reasonableness between 6.78% and 10.33%
• Request to modify the formula rate protocols in order to require additional data and identification and justification of costs
The impact on a 100 basis-point change in the transmission ROE is approximately $7 million in after-tax earnings
The complainants must show that the existing transmission rates are not just and reasonable The Company is preparing a filing in support of its current ROE and formula rate process
Note: See Safe Harbor Statement at the beginning of today’s presentation. 31
|
 |
MAPP Abandoned Cost Recovery
FERC order issued on February 28, 2013
FERC concluded that the MAPP project was canceled for reasons beyond the Company’s control and granted recovery of prudently incurred costs Key elements of the Order:
• Established a hearing to review the prudence of the $87.5 million abandonment costs and the requested 5 year amortization period
• Disallowed the incentive and RTO membership adders which reduce the project’s ROE from 12.8% to 10.8%
• Denied 50% recovery of the $4.2 million of costs incurred prior to November 1, 2008 (the date of the MAPP incentive order)
The Company plans to seek rehearing of the Commission’s disallowance of the ROE adders as well as the determination to deny 50% of costs incurred prior to November 1, 2008
Note: See Safe Harbor Statement at the beginning of today’s presentation. 32
|
 |
Our Approach to Earnings Guidance
Range provided for ongoing operations (GAAP results excluding special, unusual or extraordinary items)For guidance purposes, the items below will be excluded from results even if not classified as a special item for reporting purposes:
• Effect of adopting new accounting standards
• Effect of changes in tax law
• Impairments of assets, including goodwill
• All earnings or losses associated with the retail energy supply business at Pepco Energy Services, including the net mark-to-market effects of economic hedging activities
• All earnings or losses associated with the cross-border energy lease investments, including the associated interest on the tax liability
• Other unusual items
Note: See Safe Harbor Statement/Reg. G Information at the beginning of today’s presentation. 33
|
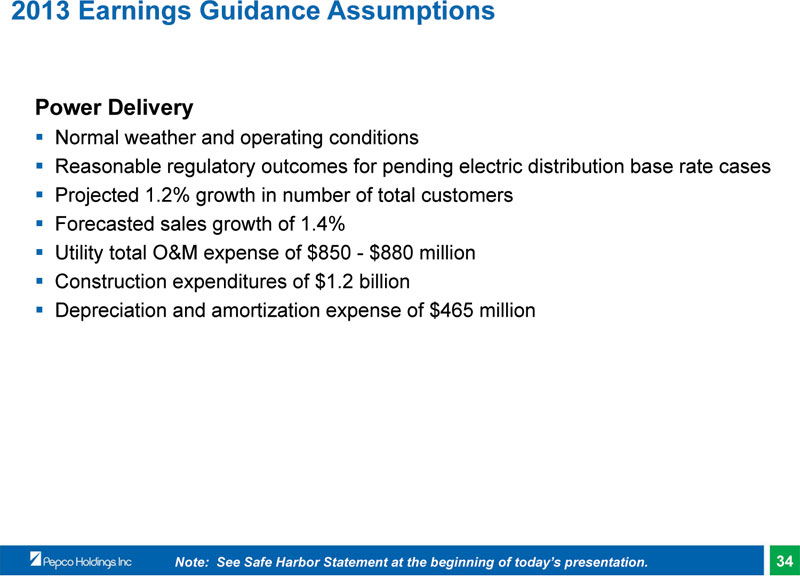 |
2013 Earnings Guidance Assumptions
Power Delivery
Normal weather and operating conditions
Reasonable regulatory outcomes for pending electric distribution base rate casesProjected 1.2% growth in number of total customersForecasted sales growth of 1.4%Utility total O&M expense of $850 - $880 million Construction expenditures of $1.2 billion Depreciation and amortization expense of $465 million
Note: See Safe Harbor Statement at the beginning of today’s presentation. 34
|
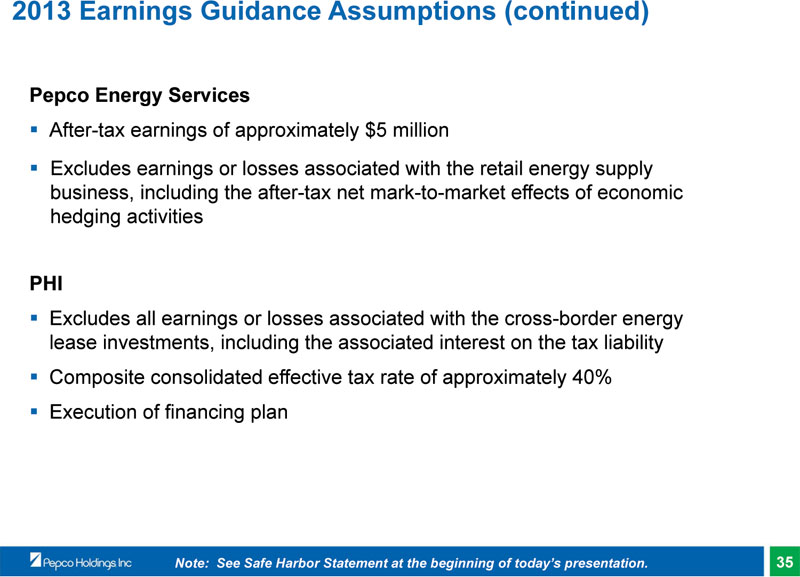 |
2013 Earnings Guidance Assumptions (continued)
Pepco Energy Services
After-tax earnings of approximately $5 million
Excludes earnings or losses associated with the retail energy supply business, including the after-tax net mark-to-market effects of economic hedging activities
PHI
Excludes all earnings or losses associated with the cross-border energy lease investments, including the associated interest on the tax liabilityComposite consolidated effective tax rate of approximately 40%Execution of financing plan
Note: See Safe Harbor Statement at the beginning of today’s presentation. 35
|
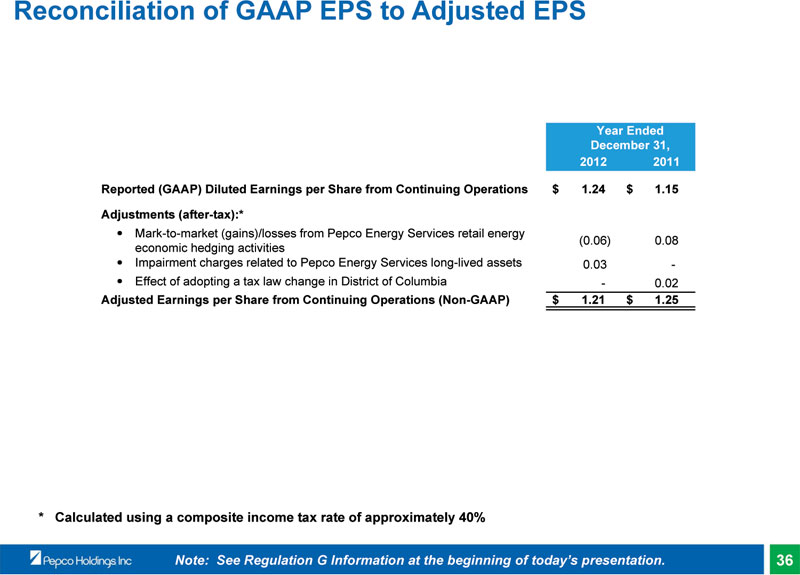 |
Reconciliation of GAAP EPS to Adjusted EPS
Year Ended December 31, 2012 2011
Reported (GAAP) Diluted Earnings per Share from Continuing Operations $ 1.24 $ 1.15
Adjustments (after-tax):*
Mark-to-market (gains)/losses from Pepco Energy Services retail energy
(0.06) 0.08 economic hedging activities Impairment charges related to Pepco Energy Services long-lived assets 0.03 -Effect of adopting a tax law change in District of Columbia - 0.02
Adjusted Earnings per Share from Continuing Operations (Non-GAAP) $ 1.21 $ 1.25
* Calculated using a composite income tax rate of approximately 40%
Note: See Regulation G Information at the beginning of today’s presentation. 36
|