Attached files
| file | filename |
|---|---|
| 8-K - FORM 8-K - Nationstar Mortgage Holdings Inc. | d511685d8k.htm |
Exhibit 99.1

Exhibit 99.1
Investor Presentation
March 2013
Our Business Today
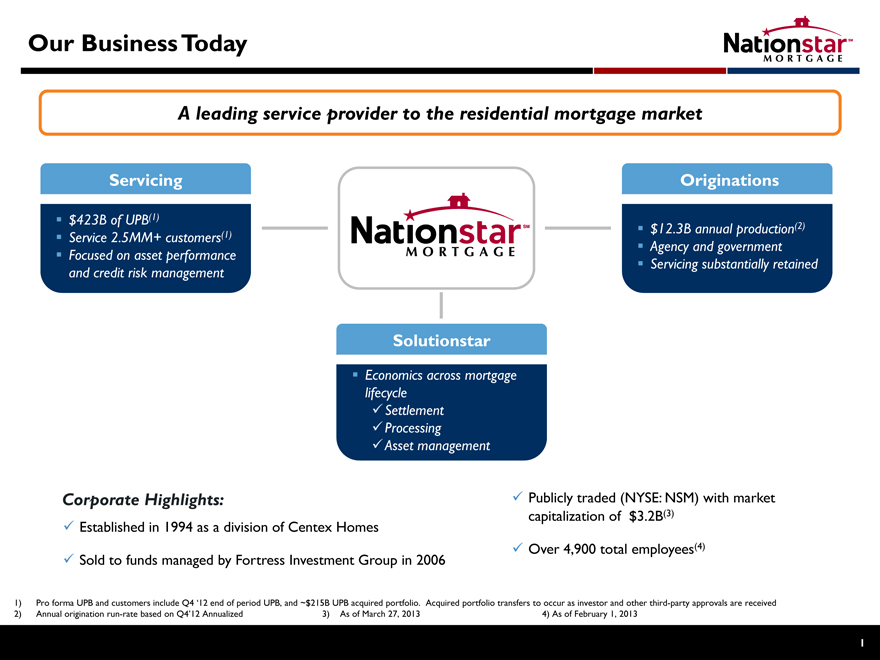
A leading service provider to the residential mortgage market
Servicing
$423B of UPB(1)
Service 2.5MM+ customers(1)
Focused on asset performance and credit risk management
Originations
$12.3B annual production(2)
Agency and government
Servicing substantially retained
Solutionstar
Economics across mortgage lifecycle
Settlement
Processing
Asset management
Corporate Highlights: Publicly traded (NYSE: NSM) with market capitalization of $3.2B(3)
Established in 1994 as a division of Centex Homes
Over 4,900 total employees(4)
Sold to funds managed by Fortress Investment Group in 2006
1) Pro forma UPB and customers include Q4 ‘12 end of period UPB, and ~$215B UPB acquired portfolio. Acquired portfolio transfers to occur as investor and other third-party approvals are received
2) Annual origination run-rate based on Q4’12 Annualized 3) As of March 27, 2013 4) As of February 1, 2013
| 1 |
|
The Future of Our Business
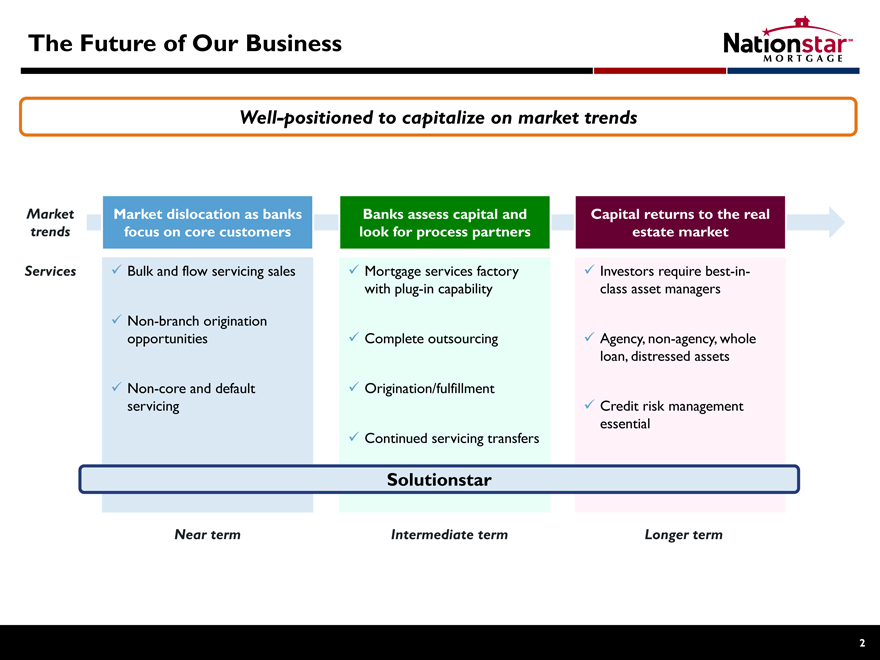
Well-positioned to capitalize on market trends
Market trends
Services
Market dislocation as banks focus on core customers
Bulk and flow servicing sales
Non-branch origination opportunities
Non-core and default servicing
Banks assess capital and look for process partners
Mortgage services factory with plug-in capability
Complete outsourcing
Origination/fulfillment
Continued servicing transfers
Capital returns to the real estate market
Investors require best-in-class asset managers
Agency, non-agency, whole loan, distressed assets
Credit risk management essential
Solutionstar
Near term Intermediate term Longer term
| 2 |
|
Servicing: Opportunities in ‘13 and Beyond
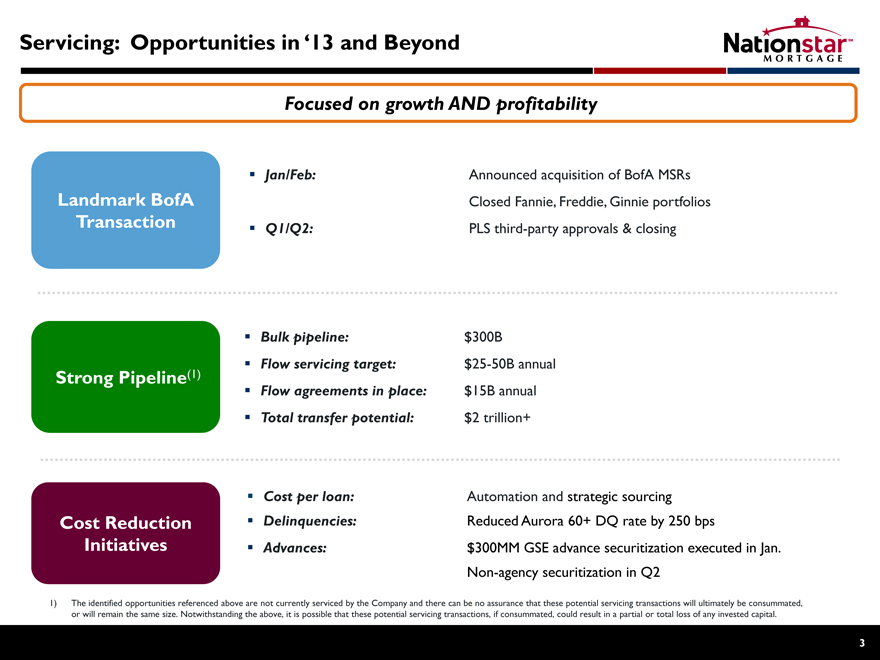
Focused on growth AND profitability
Landmark BofA Transaction
Jan/Feb: Announced acquisition of BofA MSRs Closed Fannie, Freddie, Ginnie portfolios
Q1/Q2: PLS third-party approvals & closing
Strong Pipeline(1)
Bulk pipeline: $300B
Flow servicing target: $25-50B annual
Flow agreements in place: $15B annual
Total transfer potential: $2 trillion+
Cost Reduction Initiatives
Cost per loan: Automation and strategic sourcing Delinquencies: Reduced Aurora 60+ DQ rate by 250 bps
Advances: $300MM GSE advance securitization executed in Jan. Non-agency securitization in Q2
1) The identified opportunities referenced above are not currently serviced by the Company and there can be no assurance that these potential servicing transactions will ultimately be consummated, or will remain the same size. Notwithstanding the above, it is possible that these potential servicing transactions, if consummated, could result in a partial or total loss of any invested capital.
| 3 |
|
Servicing Profitability Ramp
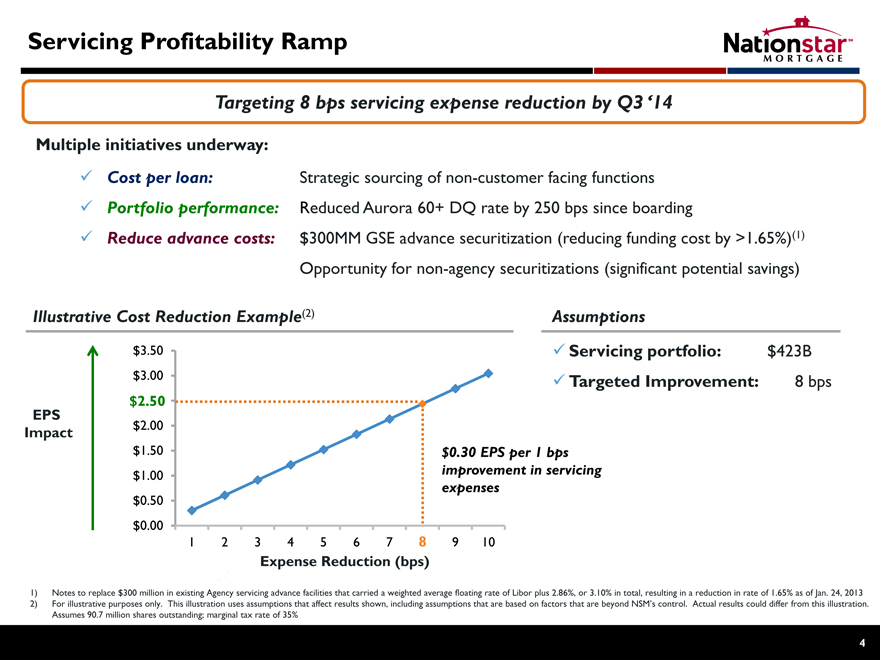
Targeting 8 bps servicing expense reduction by Q3 ‘14
Multiple initiatives underway:
Cost per loan: Strategic sourcing of non-customer facing functions
Portfolio performance: Reduced Aurora 60+ DQ rate by 250 bps since boarding
Reduce advance costs: $300MM GSE advance securitization (reducing funding cost by >1.65%)(1) Opportunity for non-agency securitizations (significant potential savings)
Illustrative Cost Reduction Example(2)
EPS Impact
$3.50 Servicing portfolio: $423B $3.00 Targeted Improvement: 8 bps $2.50 $2.00 $1.50 $0.30 EPS per 1 bps $1.00 improvement in servicing $0.50 expenses $0.00
12 345 67 8 89 10
Expense Reduction (bps)
1) Notes to replace $300 million in existing Agency servicing advance facilities that carried a weighted average floating rate of Libor plus 2.86%, or 3.10% in total, resulting in a reduction in rate of 1.65% as of Jan. 24, 2013
2) For illustrative purposes only. This illustration uses assumptions that affect results shown, including assumptions that are based on factors that are beyond NSM’s control. Actual results could differ from this illustration. Assumes 90.7 million shares outstanding; marginal tax rate of 35%
| 4 |
|
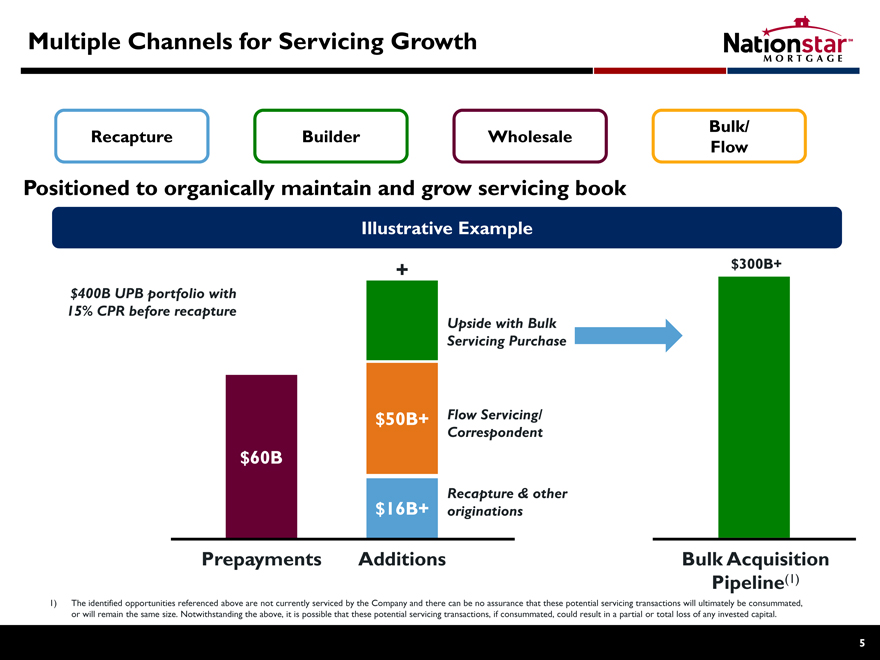
Multiple Channels for Servicing Growth
Bulk/ Recapture Builder Wholesale Flow
Positioned to organically maintain and grow servicing book
Illustrative Example
+ $300B+ $400B UPB portfolio with 15% CPR before recapture Upside with Bulk Servicing Purchase
$50B+ Flow Servicing/ Correspondent
$60B
$16B+ Recapture & other originations
Prepayments Additions Bulk Acquisition Pipeline(1)
1) The identified opportunities referenced above are not currently serviced by the Company and there can be no assurance that these potential servicing transactions will ultimately be consummated, or will remain the same size. Notwithstanding the above, it is possible that these potential servicing transactions, if consummated, could result in a partial or total loss of any invested capital.
| 5 |
|
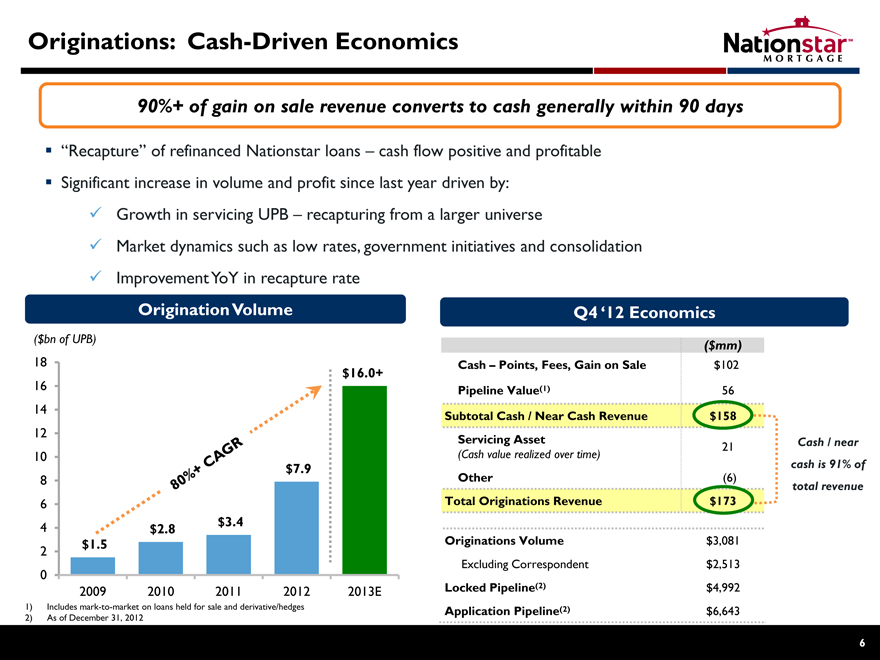
Originations: Cash-Driven Economics
90%+ of gain on sale revenue converts to cash generally within 90 days
“Recapture” of refinanced Nationstar loans – cash flow positive and profitable
Significant increase in volume and profit since last year driven by:
Growth in servicing UPB – recapturing from a larger universe
Market dynamics such as low rates, government initiatives and consolidation
Improvement YoY in recapture rate
Origination Volume Q4 ‘12 Economics
($bn of UPB) ($mm)
18 Cash – Points, Fees, Gain on Sale $102
16 $16.0+
Pipeline Value(1) 56
14
Subtotal Cash / Near Cash Revenue $158
12
Servicing Asset Cash / near
21
10 (Cash value realized over time) $7.9 cash is 91% of
| 8 |
|
Other (6) total revenue |
| 6 |
|
Total Originations Revenue $173 |
| 4 |
|
$3.4 $2.8 Originations Volume $3,081 $1.5 |
| 2 |
|
Excluding Correspondent $2,513
0
2009 2010 2011 2012 2013E Locked Pipeline(2) $4,992
1) Includes mark-to-market on loans held for sale and derivative/hedges Application Pipeline(2) $6,643
2) As of December 31, 2012
| 6 |
|
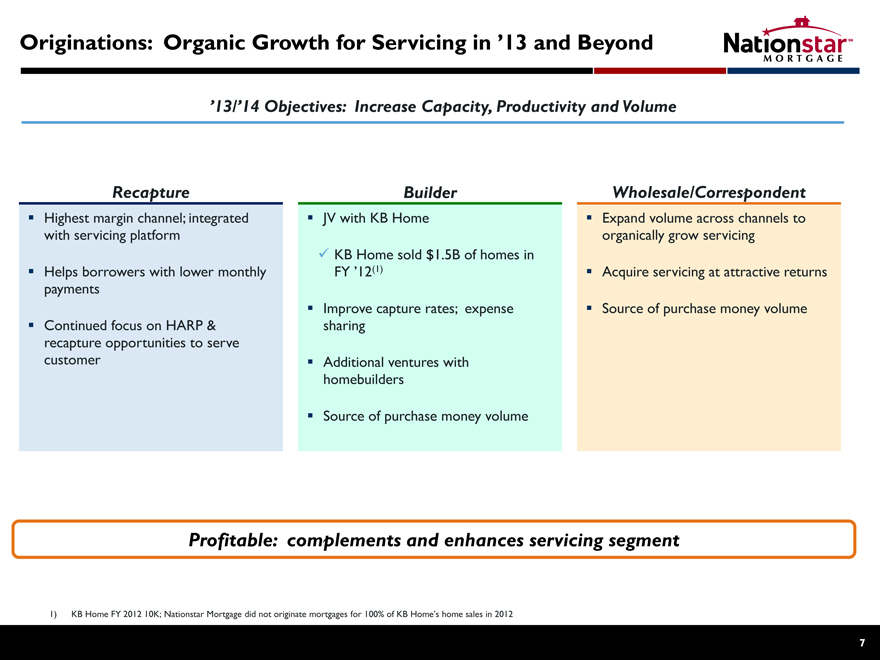
Originations: Organic Growth for Servicing in ’13 and Beyond
’13/’14 Objectives: Increase Capacity, Productivity and Volume
Recapture Builder Wholesale/Correspondent
Highest margin channel; integrated JV with KB Home Expand volume across channels to with servicing platform organically grow servicing
KB Home sold $1.5B of homes in
Helps borrowers with lower monthly FY ’12(1) Acquire servicing at attractive returns payments
Improve capture rates; expense Source of purchase money volume
Continued focus on HARP & sharing recapture opportunities to serve customer Additional ventures with homebuilders
Source of purchase money volume
Profitable: complements and enhances servicing segment
1) KB Home FY 2012 10K; Nationstar Mortgage did not originate mortgages for 100% of KB Home’s home sales in 2012
| 7 |
|
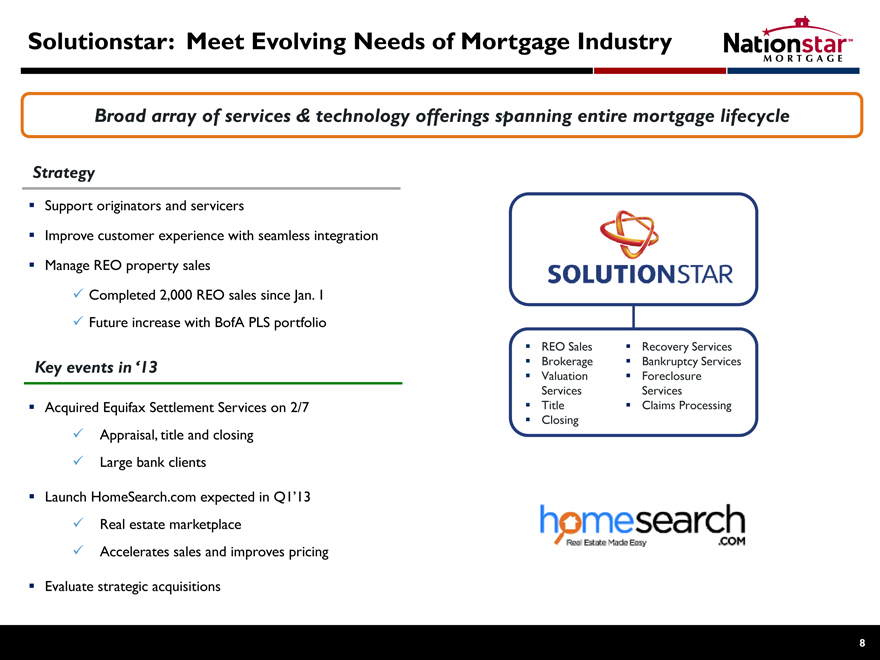
Solutionstar: Meet Evolving Needs of Mortgage Industry
Broad array of services & technology offerings spanning entire mortgage lifecycle
Strategy
Support originators and servicers
Improve customer experience with seamless integration
Manage REO property sales
Completed 2,000 REO sales since Jan. 1
Future increase with BofA PLS portfolio
Key events in ‘13
Acquired Equifax Settlement Services on 2/7
Appraisal, title and closing
Large bank clients
Launch HomeSearch.com expected in Q1’13
Real estate marketplace
Accelerates sales and improves pricing
Evaluate strategic acquisitions
REO Sales Recovery Services
Brokerage Bankruptcy Services
Valuation Foreclosure Services Services
Title Claims Processing
Closing
| 8 |
|
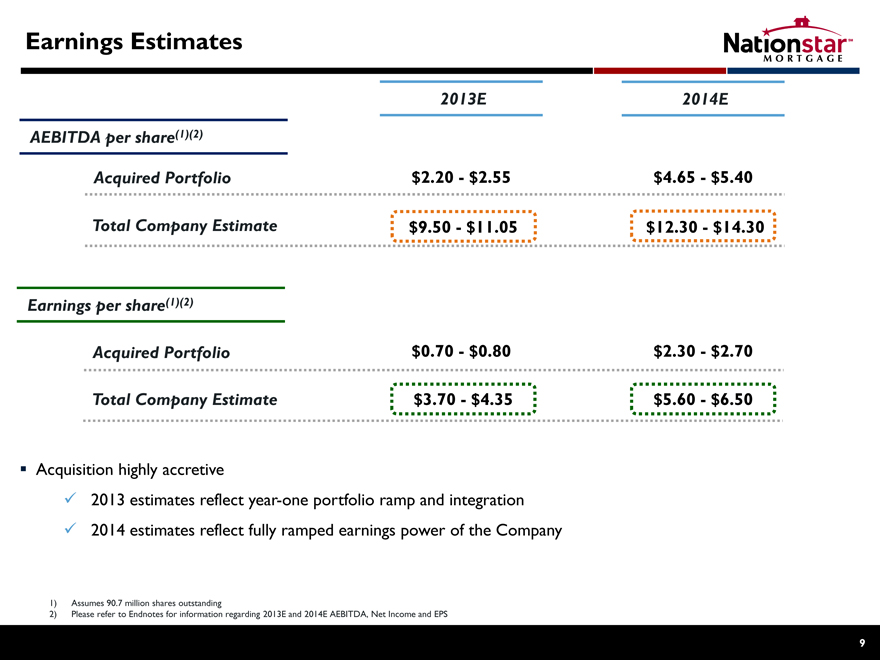
Earnings Estimates
2013E 2014E
AEBITDA per share(1)(2)
Acquired Portfolio $2.20—$2.55 $4.65 — $ 5.40
Total Company Estimate $9.50—$11.05 $12.30—$14.30
Earnings per share(1)(2)
Acquired Portfolio $0.70—$0.80 $2.30 — $ 2.70
Total Company Estimate $3.70—$4.35 $5.60 — $ 6.50
Acquisition highly accretive
2013 estimates reflect year-one portfolio ramp and integration
2014 estimates reflect fully ramped earnings power of the Company
1) Assumes 90.7 million shares outstanding
2) Please refer to Endnotes for information regarding 2013E and 2014E AEBITDA, Net Income and EPS
9
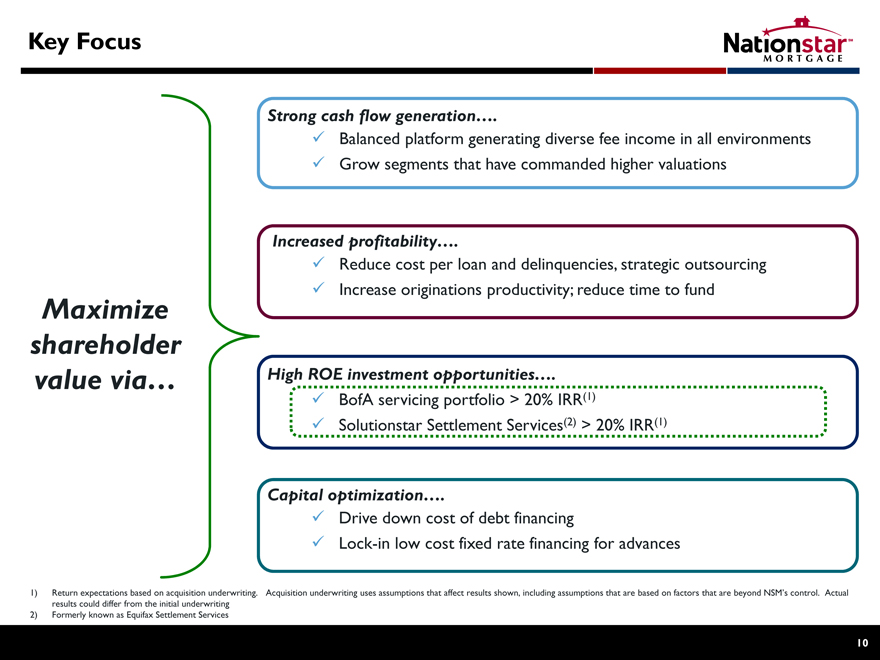
Key Focus
Strong cash flow generation….
Balanced platform generating diverse fee income in all environments
Grow segments that have commanded higher valuations
Increased profitability….
Reduce cost per loan and delinquencies, strategic outsourcing
Increase originations productivity; reduce time to fund
High ROE investment opportunities….
BofA servicing portfolio > 20% IRR(1)
Solutionstar Settlement Services(2) > 20% IRR(1)
Capital optimization….
Drive down cost of debt financing
Lock-in low cost fixed rate financing for advances
Maximize shareholder value via…
1) Return expectations based on acquisition underwriting. Acquisition underwriting uses assumptions that affect results shown, including assumptions that are based on factors that are beyond NSM’s control. Actual results could differ from the initial underwriting
2) Formerly known as Equifax Settlement Services
10
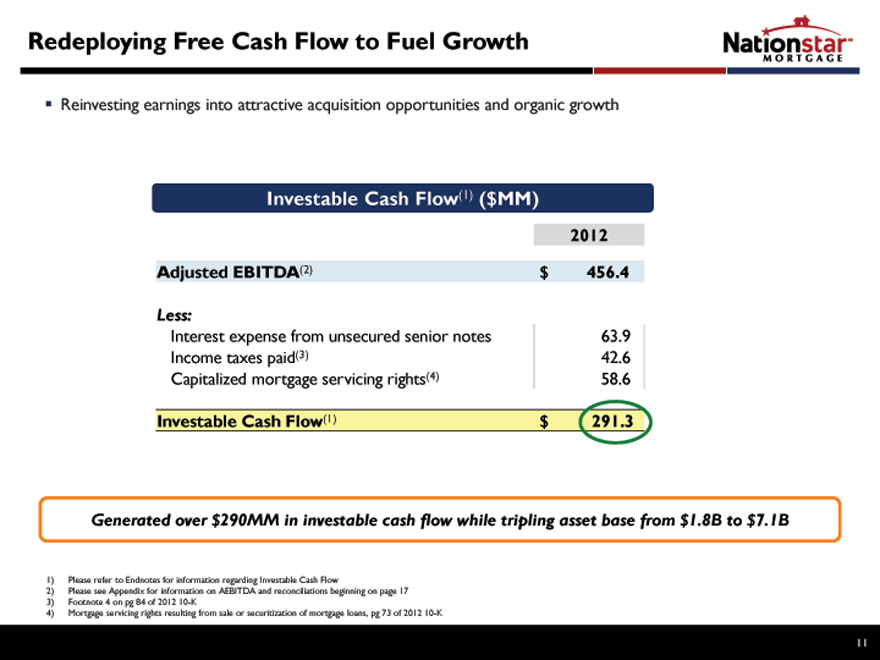
Redeploying Free Cash Flow to Fuel Growth
? Nationstar reinvesting earnings into attractive acquisition opportunities and organic growth
Investable Cash Flow(1) ($MM)
2012
Adjusted EBITDA(2) $ 456.4
Less:
Interest expense from unsecured senior notes 63.9 Income taxes paid(3) 42.6 Capitalized mortgage servicing rights(4) 58.6
Investable Cash Flow(1) $ 291.3
Generated over $290MM in investable cash flow while tripling asset base from $1.8B to $7.1B
1) Please refer to Endnotes for information regarding Investable Cash Flow
2) Please see Appendix for information on AEBITDA and reconciliations beginning on page 17
3) Footnote 4 on pg 84 of 2012 10-K
4) Mortgage servicing rights resulting from sale or securitization of mortgage loans, pg 73 of 2012 10-K
11
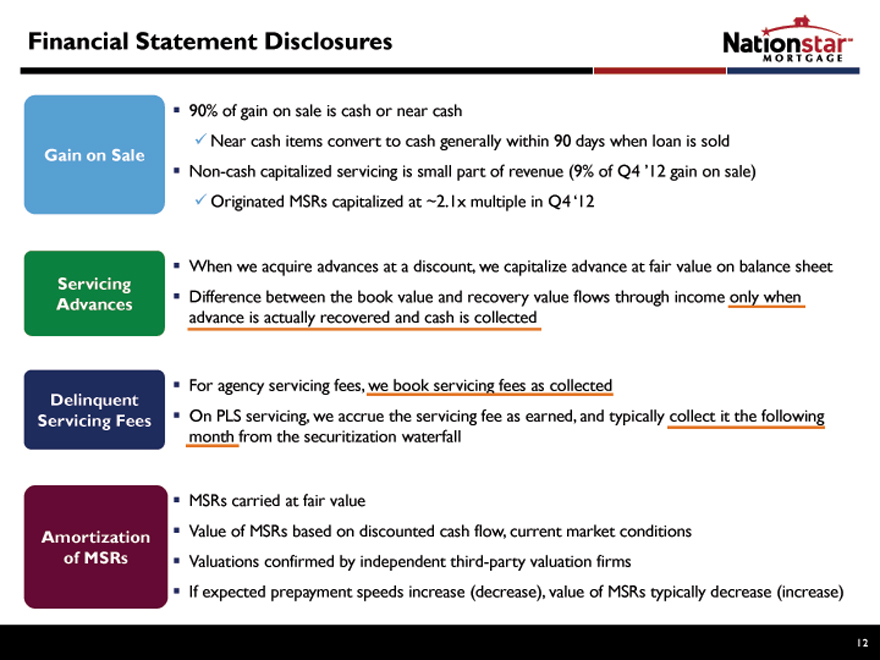
Gain on Sale
90% of gain on sale is cash or near cash
Near cash items convert to cash generally within 90 days when loan is sold
Non-cash capitalized servicing is small part of revenue (9% of Q4 ‘12 gain on sale)
Originated MSRs capitalized at ~2.1x multiple in Q4 ‘12
Servicing Advances
When we acquire advances at a discount, we capitalize advance at fair value on balance sheet
Difference between the book value and recovery value flows through income only when advance is actually recovered and cash is collected
Delinquent Servicing Fees
For agency servicing fees, we book servicing fees as collected
On PLS servicing, we accrue the servicing fee as earned, and typically collect it the following month from the securitization waterfall
Amortization of MSRs
MSRs carried at fair value
Value of MSRs based on discounted cash flow, current market conditions
Valuations confirmed by independent third-party valuation firms
If expected prepayment speeds increase (decrease), value of MSRs typically decrease (increase)

Appendix
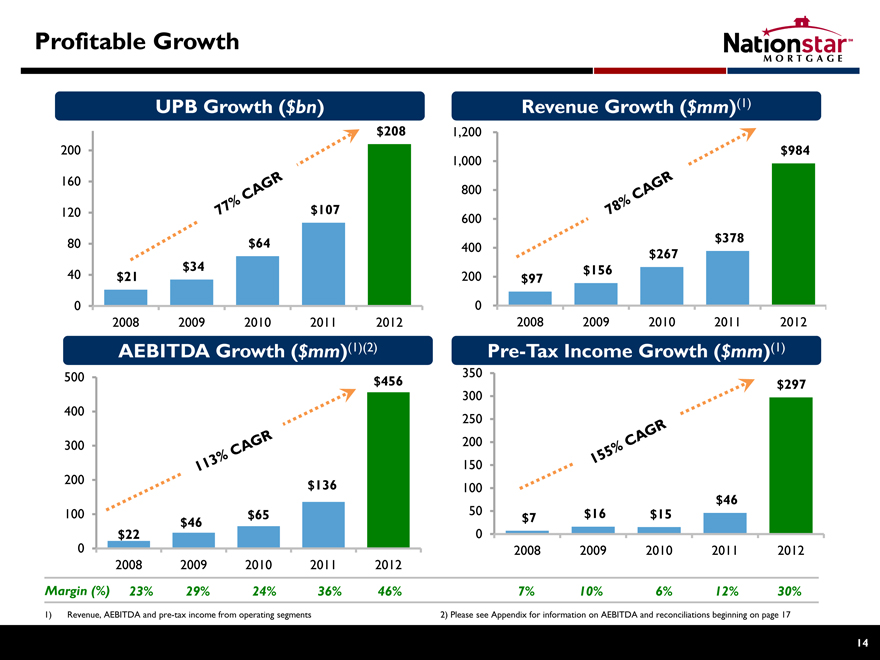
Profitable Growth
UPB Growth ($bn)
$208
200
160
120 $107
80 $64 $34
40 $21
0
2008 2009 2010 2011 2012
$208
200
160
120 $107
80 $64 $34
40 $21
0
2008 2009 2010 2011 2012
77% CAGR
Revenue Growth ($mm)(1)
1,200 1,000 800 600 400 200 0
$984
$378 $267 $156 $97
2008 2009 2010 2011 2012
78% CAGR
AEBITDA Growth ($mm)(1)(2)
500 $456
400
300
200 $136
100 $65
$22 $46
0
2008 2009 2010 2011 2012
Margin (%) 23% 29% 24% 36% 46%
111% CAGR
Pre-Tax Income Growth ($mm)(1)
350 $297
300 250 200 150
100 $46
50 $16 $15 $7
0
2008 2009 2010 2011 2012
7% 10% 6% 12% 30%
155% CAGR
1) Revenue, AEBITDA and pre-tax income from operating segments
2) Please see Appendix for information on AEBITDA and reconciliations beginning on page 17
14
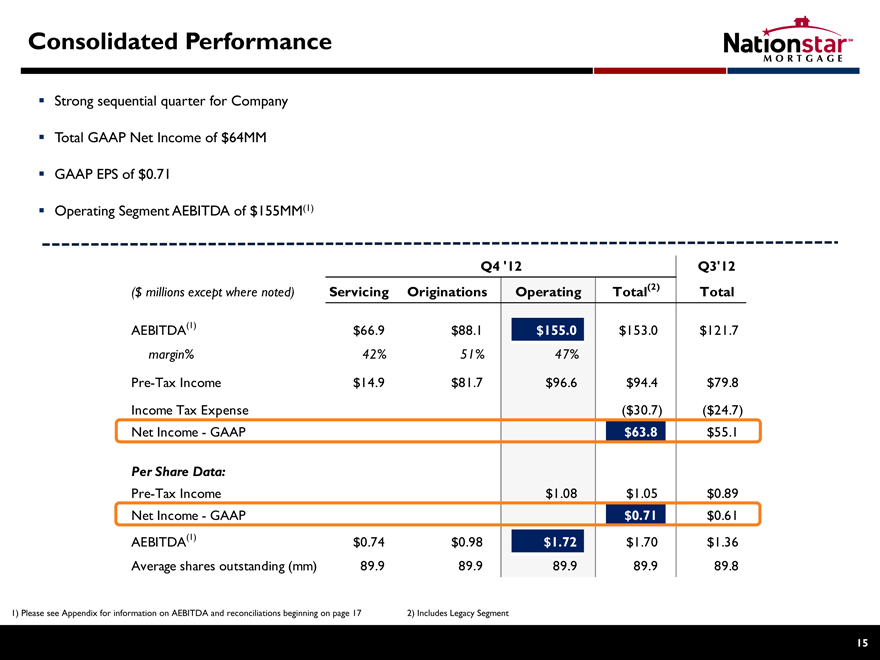
Consolidated Performance
Strong sequential quarter for Company Total GAAP Net Income of $64MM GAAP EPS of $0.71 Operating Segment AEBITDA of $155MM(1)
Q4 ‘12 Q3’12 ($ millions except where noted) Servicing Originations Operating Total(2) Total
AEBITDA(1) $66.9 $88.1 $155.0 $153.0 $121.7 margin% 42% 51% 47%
Pre-Tax Income $14.9 $81.7 $96.6 $94.4 $79.8 Income Tax Expense ($30.7) ($24.7) Net Income—GAAP $63.8 $55.1
Per Share Data:
Pre-Tax Income $1.08 $1.05 $0.89 Net Income—GAAP $0.71 $0.61 AEBITDA(1) $0.74 $0.98 $1.72 $1.70 $1.36 Average shares outstanding (mm) 89.9 89.9 89.9 89.9 89.8
1) Please see Appendix for information on AEBITDA and reconciliations beginning on page 17
2) Includes Legacy Segment
15
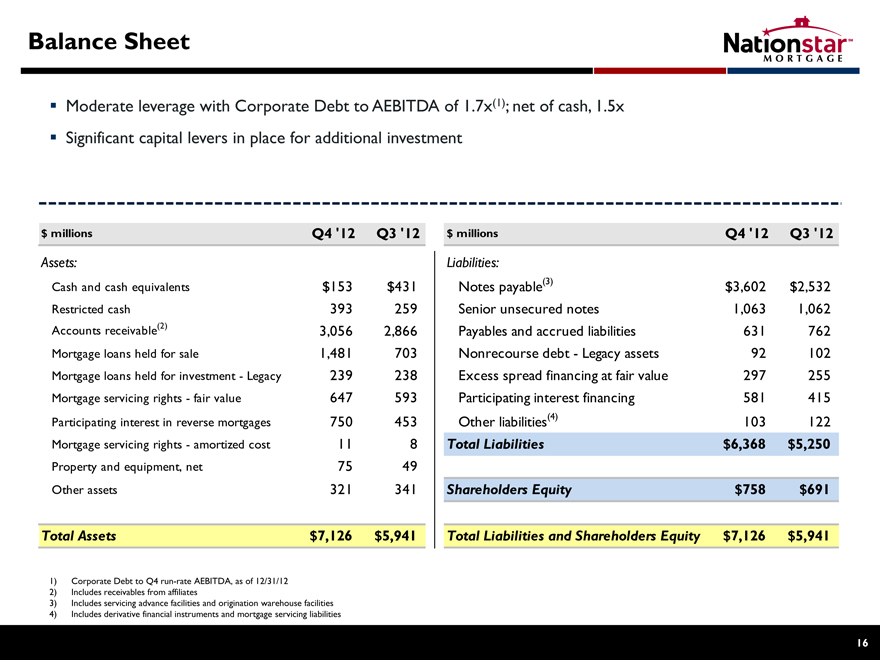
Balance Sheet
Moderate leverage with Corporate Debt to AEBITDA of 1.7x(1); net of cash, 1.5x Significant capital levers in place for additional investment
$ millions Q4 ‘12 Q3 ‘12
Assets:
Cash and cash equivalents $153 $431 Restricted cash 393 259 Accounts receivable(2) 3,056 2,866 Mortgage loans held for sale 1,481 703 Mortgage loans held for investment—Legacy 239 238 Mortgage servicing rights—fair value 647 593 Participating interest in reverse mortgages 750 453 Mortgage servicing rights—amortized cost 11 8 Property and equipment, net 75 49 Other assets 321 341
Total Assets $7,126 $5,941
$ millions Q4 ‘12 Q3 ‘12
Liabilities:
Notes payable(3) $3,602 $2,532 Senior unsecured notes 1,063 1,062 Payables and accrued liabilities 631 762 Nonrecourse debt—Legacy assets 92 102 Excess spread financing at fair value 297 255 Participating interest financing 581 415 Other liabilities(4) 103 122
Total Liabilities $6,368 $5,250 Shareholders Equity $758 $691 Total Liabilities and Shareholders Equity $7,126 $5,941
1) Corporate Debt to Q4 run-rate AEBITDA, as of 12/31/12
2) Includes receivables from affiliates
3) Includes servicing advance facilities and origination warehouse facilities
4) Includes derivative financial instruments and mortgage servicing liabilities
16
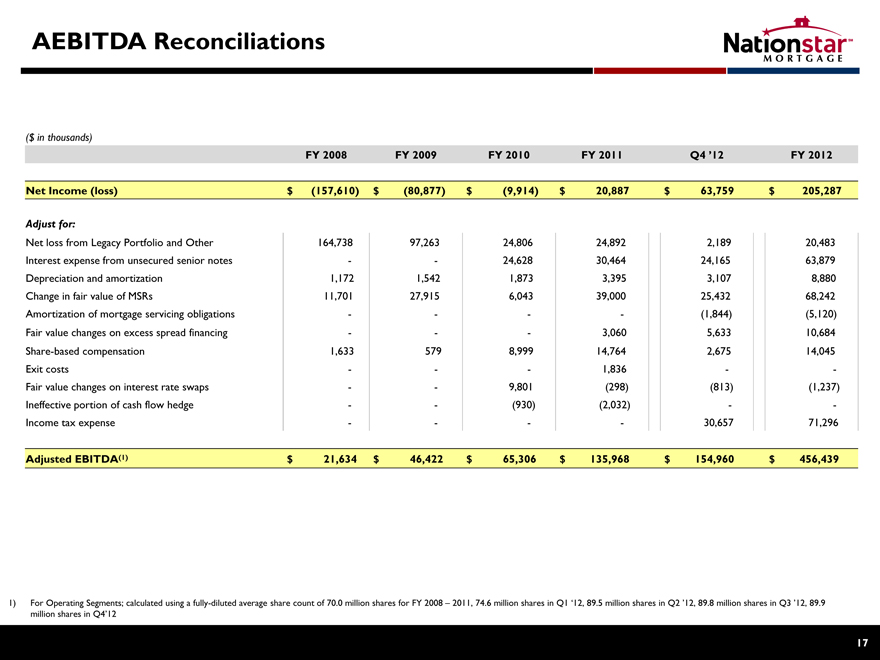
AEBITDA Reconciliations
($ in thousands)
FY 2008 FY 2009 FY 2010 FY 2011 Q4 ’12 FY 2012
Net Income (loss) $ (157,610) $ (80,877) $ (9,914) $ 20,887 $ 63,759 $ 205,287
Adjust for:
Net loss from Legacy Portfolio and Other 164,738 97,263 24,806 24,892 2,189 20,483
Interest expense from unsecured senior notes — 24,628 30,464 24,165 63,879
Depreciation and amortization 1,172 1,542 1,873 3,395 3,107 8,880
Change in fair value of MSRs 11,701 27,915 6,043 39,000 25,432 68,242
Amortization of mortgage servicing obligations — — (1,844) (5,120)
Fair value changes on excess spread financing ——3,060 5,633 10,684
Share-based compensation 1,633 579 8,999 14,764 2,675 14,045
Exit costs ——1,836 —
Fair value changes on interest rate swaps — 9,801 (298) (813) (1,237)
Ineffective portion of cash flow hedge — (930) (2,032) —
Income tax expense — — 30,657 71,296
Adjusted EBITDA(1) $ 21,634 $ 46,422 $ 65,306 $ 135,968 $ 154,960 $ 456,439
1) For Operating Segments; calculated using a fully-diluted average share count of 70.0 million shares for FY 2008 – 2011, 74.6 million shares in Q1 ‘12, 89.5 million shares in Q2 ’12, 89.8 million shares in Q3 ’12, 89.9 million shares in Q4’12
17
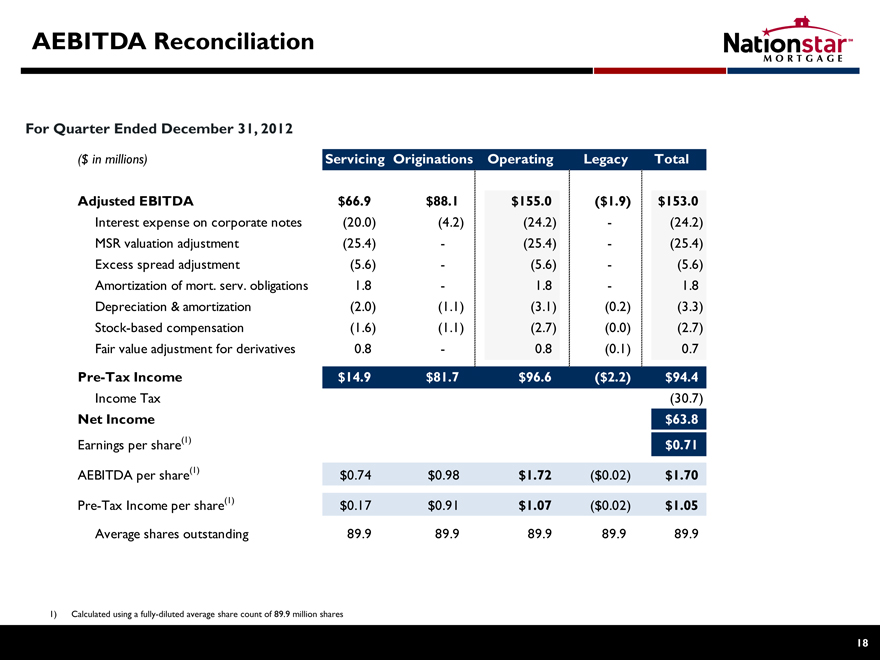
AEBITDA Reconciliation
For Quarter Ended December 31, 2012
($ in millions) Servicing Originations Operating Legacy Total
Adjusted EBITDA $66.9 $88.1 $155.0 ($1.9) $153.0
Interest expense on corporate notes (20.0) (4.2) (24.2) — (24.2) MSR valuation adjustment (25.4) — (25.4) — (25.4) Excess spread adjustment (5.6) — (5.6) — (5.6) Amortization of mort. serv. obligations 1.8 — 1.8 — 1.8 Depreciation & amortization (2.0) (1.1) (3.1) (0.2) (3.3) Stock-based compensation (1.6) (1.1) (2.7) (0.0) (2.7) Fair value adjustment for derivatives 0.8 — 0.8 (0.1) 0.7
Pre-Tax Income $14.9 $81.7 $96.6 ($2.2) $94.4
Income Tax (30.7)
Net Income $63.8
Earnings per share(1) $0.71 AEBITDA per share(1) $0.74 $0.98 $1.72 ($0.02) $1.70 Pre-Tax Income per share(1) $0.17 $0.91 $1.07 ($0.02) $1.05 Average shares outstanding 89.9 89.9 89.9 89.9 89.9
Calculated using a fully-diluted average share count of 89.9 million shares
18
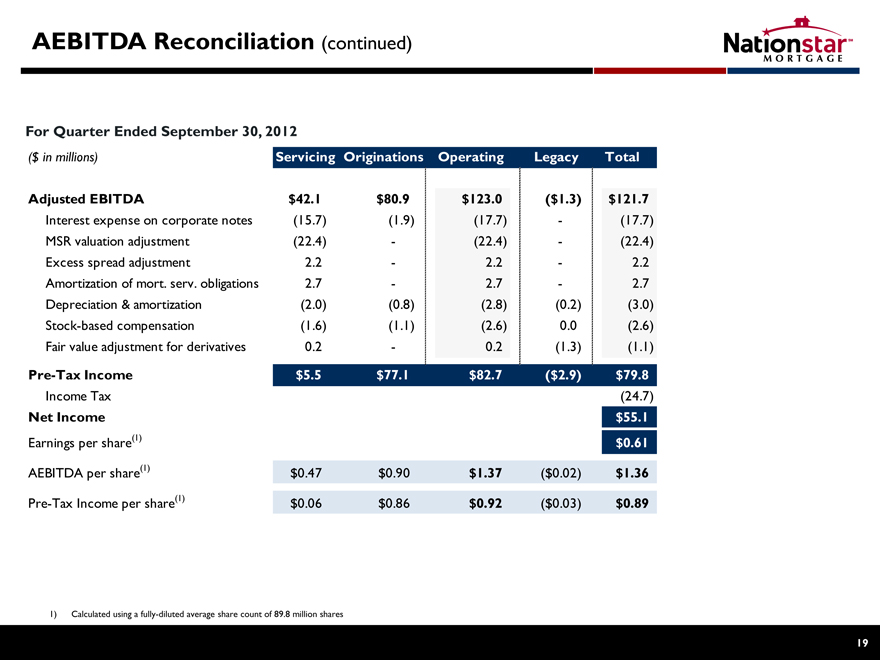
AEBITDA Reconciliation (continued)
For Quarter Ended September 30, 2012
($ in millions) Servicing Originations Operating Legacy Total
Adjusted EBITDA $42.1 $80.9 $123.0 ($1.3) $121.7
Interest expense on corporate notes (15.7) (1.9) (17.7) — (17.7) MSR valuation adjustment (22.4) — (22.4) — (22.4) Excess spread adjustment 2.2 — 2.2 — 2.2 Amortization of mort. serv. obligations 2.7 — 2.7 — 2.7 Depreciation & amortization (2.0) (0.8) (2.8) (0.2) (3.0) Stock-based compensation (1.6) (1.1) (2.6) 0.0 (2.6) Fair value adjustment for derivatives 0.2 — 0.2 (1.3) (1.1)
Pre-Tax Income $5.5 $77.1 $82.7 ($2.9) $79.8
Income Tax (24.7)
Net Income $55.1
Earnings per share(1) $0.61 AEBITDA per share(1) $0.47 $0.90 $1.37 ($0.02) $1.36 Pre-Tax Income per share(1) $0.06 $0.86 $0.92 ($0.03) $0.89
1) Calculated using a fully-diluted average share count of 89.8 million shares
19
2013 Estimate Net Income 2013 Estimate Net Income is based on our expectations of continued growth, current market conditions and increased operating efficiencies in our business in addition to our financial targets for 2013. Our actual Net Income for 2013 on an annualized basis may differ from our 2013(E) Net Income.
2014 Estimate Net Income 2014 Estimate Net Income is based on our expectations of continued growth, current market conditions and increased operating efficiencies in our business in addition to our financial targets for 2014. Our actual Net Income for 2014 on an annualized basis may differ from our 2014(E) Net Income.
Adjusted EBITDA (“AEBITDA”) This disclaimer applies to every usage of “Adjusted EBITDA” or “AEBITDA” in this presentation. Adjusted EBITDA is a key performance metric used by management in evaluating the performance of our segments. Adjusted EBITDA represents our Operating Segments’ income (loss), and excludes income and expenses that relate to the financing of our senior notes, depreciable (or amortizable) asset base of the business, income taxes (if any), exit costs from our restructuring and certain non-cash items. Adjusted EBITDA also excludes results from our legacy asset portfolio and certain securitization trusts that were consolidated upon adoption of the accounting guidance eliminating the concept of a qualifying special purpose entity (“QSPE“).
Investable Cash Flow This disclaimer applies to every usage of “Investable Cash Flow” in this presentation. Invested Cash Flow is a key performance metric used by management in evaluating the performance of our business. Investable Cash Flow represents our AEBITDA less interest expense from unsecured senior notes, income taxes paid and mortgage servicing rights resulting from sale or securitization of mortgage loans.
Q4 ‘12 Adjusted EBITDA Run-Rate Q4 ‘12 Adjusted EBITDA Run-Rate is a non-GAAP performance metric used by management in evaluating the performance of our segments, which is calculated by multiplying Q4 ‘12 Adjusted EBITDA by four quarters to determine the annualized number. Q4 ‘12 Adjusted EBITDA Run-Rate represents our Operating Segments’ income (loss), and excludes income and expenses that relate to the financing of our senior notes, depreciable (or amortizable) asset base of the business, income taxes (if any), exit costs from our restructuring and certain non-cash items. Q4 ‘12 Adjusted EBITDA also excludes results from our legacy asset portfolio and certain securitization trusts that were consolidated upon adoption of the new accounting guidance eliminating the concept of a qualifying special purpose entity
2013 Estimate AEBITDA 2013 Estimate AEBITDA is based on our expectations of continued growth, current market conditions and increased operating efficiencies in our business in addition to our financial targets for 2013. Target for all non-GAAP figures excludes the same items as we excluded in our 2011/2012 non-GAAP reconciliation, as follows: income and expenses that relate to the financing of the senior notes, depreciable (or amortizable) asset base and several other relevant items. Our actual AEBITDA for 2013 on an annualized basis may differ from our 2013(E) AEBITDA.
2014 Estimate AEBITDA 2014 Estimate AEBITDA is based on our expectations of continued growth, current market conditions and increased operating efficiencies in our business in addition to our financial targets for 2014. Target for all non-GAAP figures excludes the same items as we excluded in our 2011/2012 non-GAAP reconciliation, as follows: income and expenses that relate to the financing of the senior notes, depreciable (or amortizable) asset base and several other relevant items. Our actual AEBITDA for 2014 on an annualized basis may differ from our 2014(E) AEBITDA.
NOTE: 2013 and 2014 Estimate Net Income and 2013 and 2014 Estimate AEBITDA are forward-looking and subject to significant business, economic, regulatory and competitive uncertainties, many of which are beyond control of Nationstar and its management, and are based upon assumptions with respect to future decisions, which are subject to change. Actual results will vary and those variations may be material. Nothing in this presentation should be regarded as a representation by any person that this target will be achieved and Nationstar undertakes no duty to update this target.