Attached files
| file | filename |
|---|---|
| 8-K - 8-K - ROTECH HEALTHCARE INC | a20130327form8k.htm |
Confidential Rotech Healthcare Preliminary Q4 2012 Results Originally distributed February 14, 2013 Updated as of March 26, 2013 based on most current available information
# 1 8 0 2 e f7 1 2 v 4 .0 Confidential Disclaimer This presentation includes “forward-looking statements" within the meaning of the Securities Litigation Reform Act of 1995. These statements include but are not limited to our plans, objectives, expectations and intentions and other statements that contain words such as “expects,” “contemplates,” “anticipates,” “plans,” “intends,” “believes” and variations of such words or similar expressions that predict or indicate future events or trends, or that do not relate to historical matters. These statements are based on our current beliefs or expectations and are inherently subject to significant uncertainties and changes in circumstances, many of which are beyond our control. There can be no assurance that our beliefs or expectations will be achieved. Actual results may differ materially from our beliefs or expectations due to economic, business, competitive, market and regulatory factors. Accordingly, you are cautioned not to place undue reliance on forward-looking statements. This presentation includes certain forecasts with respect to the Company’s future financial performance. Such forecasts are included for informational purposes only. Although such forecasts are based upon the best available estimates and judgments of the management of the Company as to the future financial performance of the Company, such forecasts are subject to changes in circumstances beyond our control. There can be no assurance that any such forecasts will be achieved, and actual results may differ materially. Accordingly, the Company makes no representation or warranty (express or implied) with respect to such forecasts and you are cautioned not to place undue reliance on them. This presentation also includes certain unaudited quarterly and annual financial information. Such unaudited financial information are subject to normal year-end audit adjustments. 1

Confidential Historical Financials 2
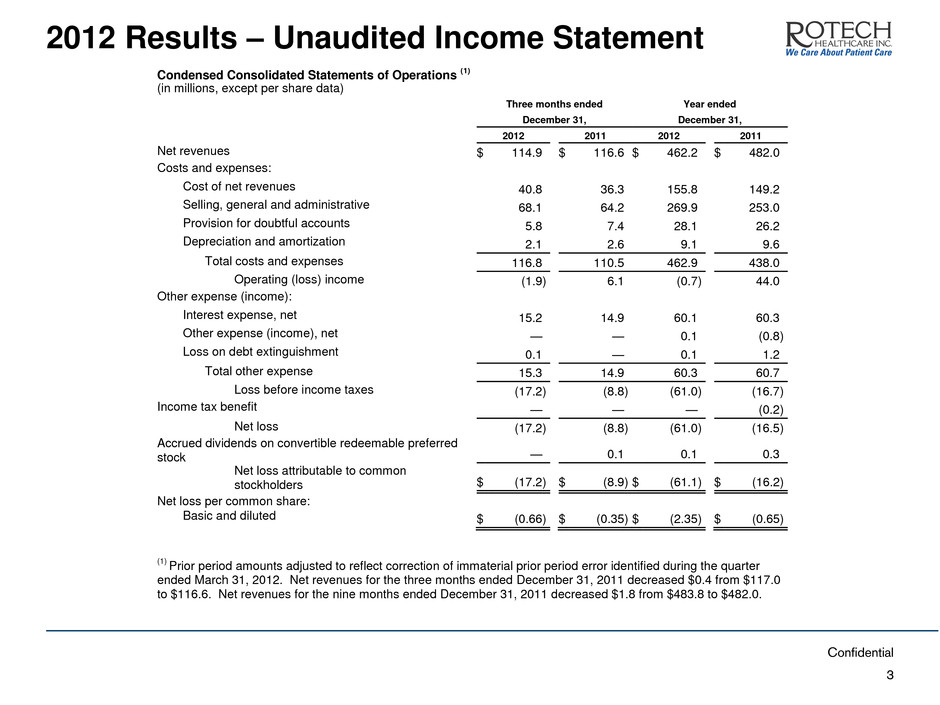
Confidential 2012 Results – Unaudited Income Statement 3 Condensed Consolidated Statements of Operations (1) (in millions, except per share data) Three months ended Year ended December 31, December 31, 2012 2011 2012 2011 Net revenues $ 114.9 $ 116.6 $ 462.2 $ 482.0 Costs and expenses: Cost of net revenues 40.8 36.3 155.8 149.2 Selling, general and administrative 68.1 64.2 269.9 253.0 Provision for doubtful accounts 5.8 7.4 28.1 26.2 Depreciation and amortization 2.1 2.6 9.1 9.6 Total costs and expenses 116.8 110.5 462.9 438.0 Operating (loss) income (1.9 ) 6.1 (0.7 ) 44.0 Other expense (income): Interest expense, net 15.2 14.9 60.1 60.3 Other expense (income), net — — 0.1 (0.8 ) Loss on debt extinguishment 0.1 — 0.1 1.2 Total other expense 15.3 14.9 60.3 60.7 Loss before income taxes (17.2 ) (8.8 ) (61.0 ) (16.7 ) Income tax benefit — — — (0.2 ) Net loss (17.2 ) (8.8 ) (61.0 ) (16.5 ) Accrued dividends on convertible redeemable preferred stock — 0.1 0.1 0.3 Net loss attributable to common stockholders $ (17.2 ) $ (8.9 ) $ (61.1 ) $ (16.2 ) Net loss per common share: Basic and diluted $ (0.66 ) $ (0.35 ) $ (2.35 ) $ (0.65 ) (1) Prior period amounts adjusted to reflect correction of immaterial prior period error identified during the quarter ended March 31, 2012. Net revenues for the three months ended December 31, 2011 decreased $0.4 from $117.0 to $116.6. Net revenues for the nine months ended December 31, 2011 decreased $1.8 from $483.8 to $482.0.
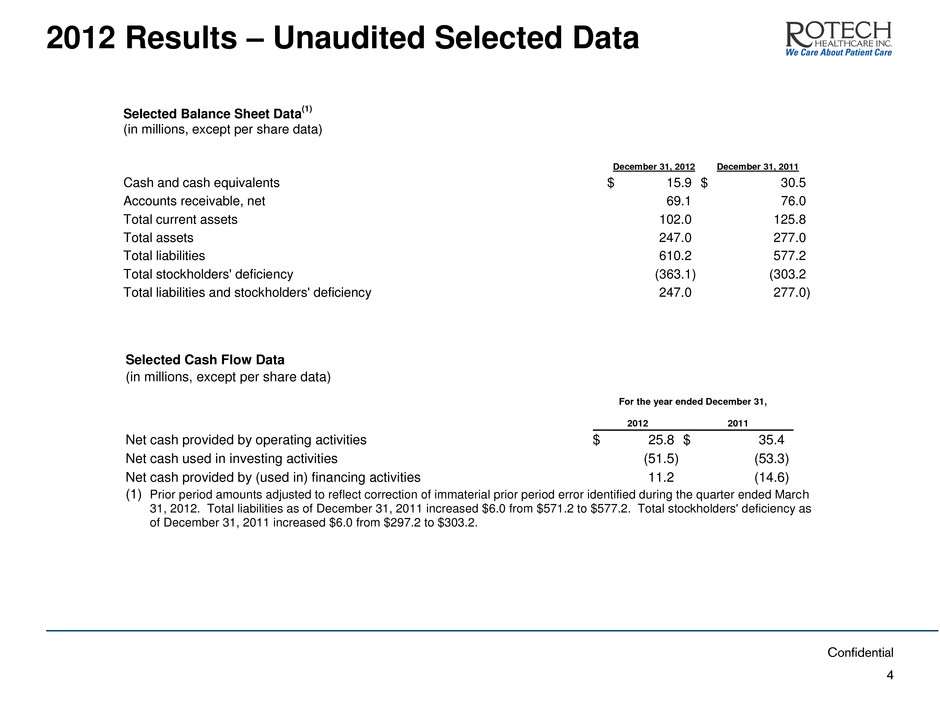
Confidential 2012 Results – Unaudited Selected Data 4 Selected Balance Sheet Data (1) (in millions, except per share data) December 31, 2012 December 31, 2011 Cash and cash equivalents $ 15.9 $ 30.5 Accounts receivable, net 69.1 76.0 Total current assets 102.0 125.8 Total assets 247.0 277.0 Total liabilities 610.2 577.2 Total stockholders' deficiency (363.1 ) (303.2 Total liabilities and stockholders' deficiency 247.0 277.0 ) Selected Cash Flow Data (in millions, xcept per s are data) For the year ended December 31, 2012 2011 Net cash provided by operating activities $ 25.8 $ 35.4 Net cash used in investing activities (51.5 ) (53.3 ) Net cash provided by (used in) financing activities 11.2 (14.6 ) (1) Prior period amounts adjusted to reflect correction of immaterial prior period error identified during the quarter ended March 31, 2012. Total liabilities as of December 31, 2011 increased $6.0 from $571.2 to $577.2. Total stockholders' deficiency as of December 31, 2011 increased $6.0 from $297.2 to $303.2.
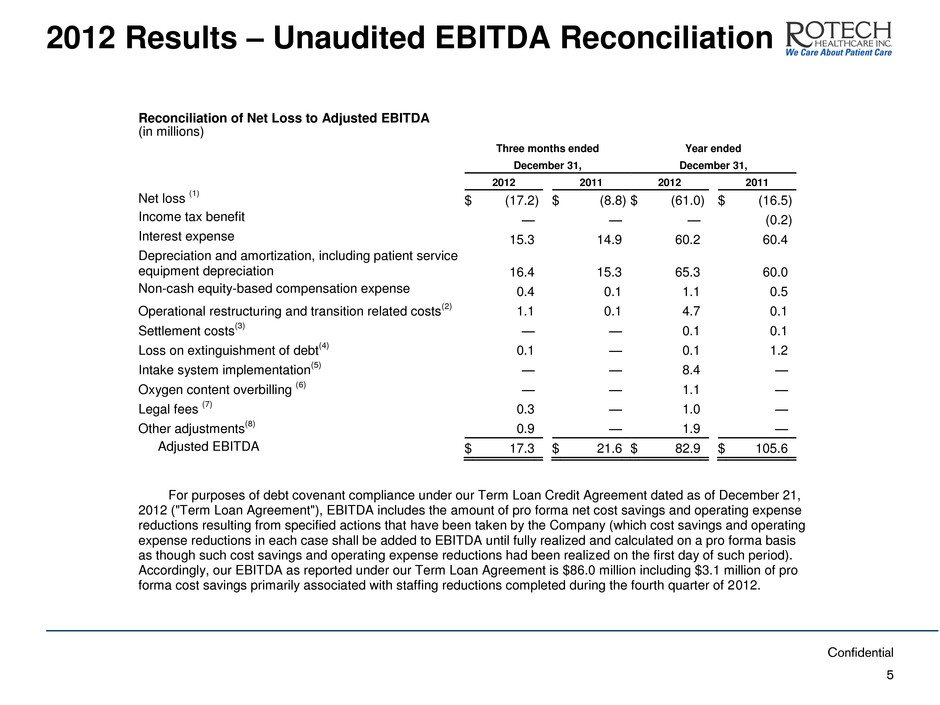
Confidential 2012 Results – Unaudited EBITDA Reconciliation 5 Reconciliation of Net Loss to Adjusted EBITDA (in millions) Three months ended Year ended December 31, December 31, 2012 2011 2012 2011 Net loss (1) $ (17.2 ) $ (8.8 ) $ (61.0 ) $ (16.5 ) Income tax benefit — — — (0.2 ) Interest expense 15.3 14.9 60.2 60.4 Depreciation and amortization, including patient service equipment depreciation 16.4 15.3 65.3 60.0 Non-cash equity-based compensation expense 0.4 0.1 1.1 0.5 Operational restructuring and transition related costs (2) 1.1 0.1 4.7 0.1 Settlement costs (3) — — 0.1 0.1 Loss on extinguishment of debt (4) 0.1 — 0.1 1.2 Intake system implementation (5) — — 8.4 — Oxygen content overbilling (6) — — 1.1 — Legal fees (7) 0.3 — 1.0 — Other adjustments (8) 0.9 — 1.9 — Adjusted EBITDA $ 17.3 $ 21.6 $ 82.9 $ 105.6 For purposes of debt covenant compliance under our Term Loan Credit Agreement dated as of December 21, 2012 ("Term Loan Agreement"), EBITDA includes the amount of pro forma net cost savings and operating expense reductions resulting from specified actions that have been taken by the Company (which cost savings and operating expense reductions in each case shall be added to EBITDA until fully realized and calculated on a pro forma basis as though such cost savings and operating expense reductions had been realized on the first day of such period). Accordingly, our EBITDA as reported under our Term Loan Agreement is $86.0 million including $3.1 million of pro forma cost savings primarily associated with staffing reductions completed during the fourth quarter of 2012.
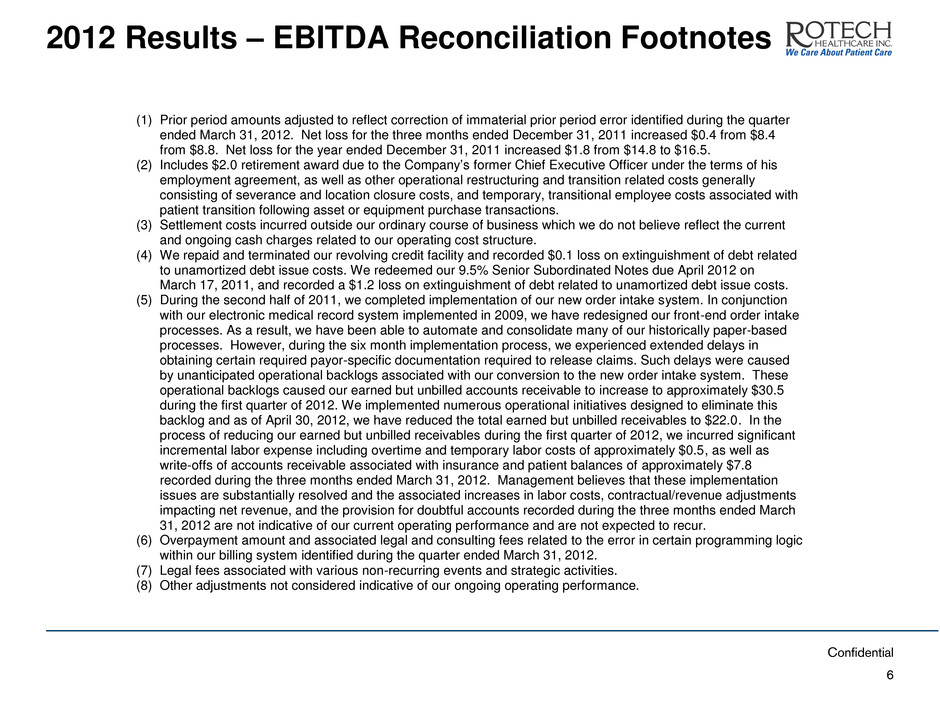
Confidential 2012 Results – EBITDA Reconciliation Footnotes 6 (1) Prior period amounts adjusted to reflect correction of immaterial prior period error identified during the quarter ended March 31, 2012. Net loss for the three months ended December 31, 2011 increased $0.4 from $8.4 from $8.8. Net loss for the year ended December 31, 2011 increased $1.8 from $14.8 to $16.5. (2) Includes $2.0 retirement award due to the Company’s former Chief Executive Officer under the terms of his employment agreement, as well as other operational restructuring and transition related costs generally consisting of severance and location closure costs, and temporary, transitional employee costs associated with patient transition following asset or equipment purchase transactions. (3) Settlement costs incurred outside our ordinary course of business which we do not believe reflect the current and ongoing cash charges related to our operating cost structure. (4) We repaid and terminated our revolving credit facility and recorded $0.1 loss on extinguishment of debt related to unamortized debt issue costs. We redeemed our 9.5% Senior Subordinated Notes due April 2012 on March 17, 2011, and recorded a $1.2 loss on extinguishment of debt related to unamortized debt issue costs. (5) During the second half of 2011, we completed implementation of our new order intake system. In conjunction with our electronic medical record system implemented in 2009, we have redesigned our front-end order intake processes. As a result, we have been able to automate and consolidate many of our historically paper-based processes. However, during the six month implementation process, we experienced extended delays in obtaining certain required payor-specific documentation required to release claims. Such delays were caused by unanticipated operational backlogs associated with our conversion to the new order intake system. These operational backlogs caused our earned but unbilled accounts receivable to increase to approximately $30.5 during the first quarter of 2012. We implemented numerous operational initiatives designed to eliminate this backlog and as of April 30, 2012, we have reduced the total earned but unbilled receivables to $22.0. In the process of reducing our earned but unbilled receivables during the first quarter of 2012, we incurred significant incremental labor expense including overtime and temporary labor costs of approximately $0.5, as well as write-offs of accounts receivable associated with insurance and patient balances of approximately $7.8 recorded during the three months ended March 31, 2012. Management believes that these implementation issues are substantially resolved and the associated increases in labor costs, contractual/revenue adjustments impacting net revenue, and the provision for doubtful accounts recorded during the three months ended March 31, 2012 are not indicative of our current operating performance and are not expected to recur. (6) Overpayment amount and associated legal and consulting fees related to the error in certain programming logic within our billing system identified during the quarter ended March 31, 2012. (7) Legal fees associated with various non-recurring events and strategic activities. (8) Other adjustments not considered indicative of our ongoing operating performance.
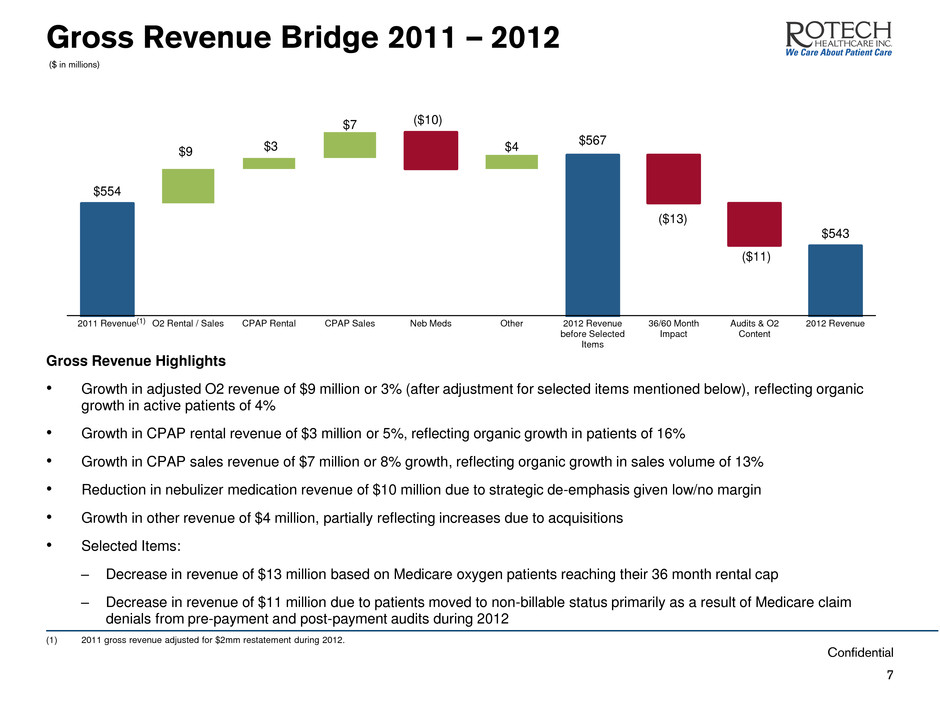
Confidential $554 $9 $3 $7 ($10) $4 $567 ($13) ($11) $543 2011 Revenue O2 Rental / Sales CPAP Rental CPAP Sales Neb Meds Other 2012 Revenue before Selected Items 36/60 Month Impact Audits & O2 Content 2012 Revenue Gross Revenue Bridge 2011 – 2012 7 ($ in millions) (1) (1) 2011 gross revenue adjusted for $2mm restatement during 2012. Gross Revenue Highlights • Growth in adjusted O2 revenue of $9 million or 3% (after adjustment for selected items mentioned below), reflecting organic growth in active patients of 4% • Growth in CPAP rental revenue of $3 million or 5%, reflecting organic growth in patients of 16% • Growth in CPAP sales revenue of $7 million or 8% growth, reflecting organic growth in sales volume of 13% • Reduction in nebulizer medication revenue of $10 million due to strategic de-emphasis given low/no margin • Growth in other revenue of $4 million, partially reflecting increases due to acquisitions • Selected Items: – Decrease in revenue of $13 million based on Medicare oxygen patients reaching their 36 month rental cap – Decrease in revenue of $11 million due to patients moved to non-billable status primarily as a result of Medicare claim denials from pre-payment and post-payment audits during 2012
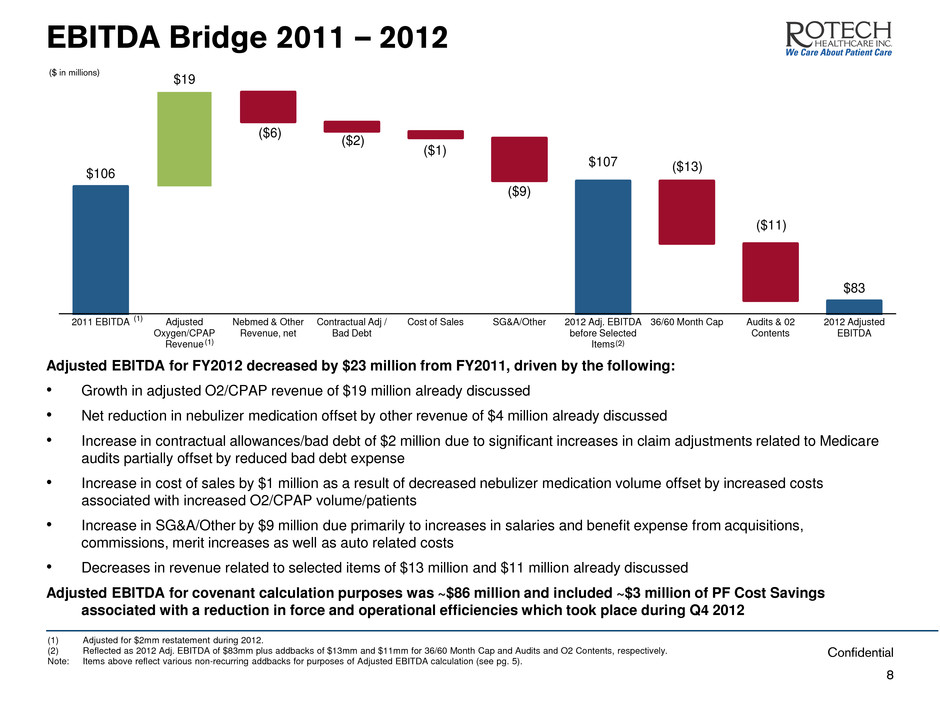
Confidential $106 $19 ($6) ($2) ($1) ($9) $107 ($13) ($11) $83 2011 EBITDA Adjusted Oxygen/CPAP Revenue Nebmed & Other Revenue, net Contractual Adj / Bad Debt Cost of Sales SG&A/Other 2012 Adj. EBITDA before Selected Items 36/60 Month Cap Audits & 02 Contents 2012 Adjusted EBITDA EBITDA Bridge 2011 – 2012 8 ($ in millions) (1) (1) (1) Adjusted for $2mm restatement during 2012. (2) Reflected as 2012 Adj. EBITDA of $83mm plus addbacks of $13mm and $11mm for 36/60 Month Cap and Audits and O2 Contents, respectively. Note: Items above reflect various non-recurring addbacks for purposes of Adjusted EBITDA calculation (see pg. 5). Adjusted EBITDA for FY2012 decreased by $23 million from FY2011, driven by the following: • Growth in adjusted O2/CPAP revenue of $19 million already discussed • Net reduction in nebulizer medication offset by other revenue of $4 million already discussed • Increase in contractual allowances/bad debt of $2 million due to significant increases in claim adjustments related to Medicare audits partially offset by reduced bad debt expense • Increase in cost of sales by $1 million as a result of decreased nebulizer medication volume offset by increased costs associated with increased O2/CPAP volume/patients • Increase in SG&A/Other by $9 million due primarily to increases in salaries and benefit expense from acquisitions, commissions, merit increases as well as auto related costs • Decreases in revenue related to selected items of $13 million and $11 million already discussed Adjusted EBITDA for covenant calculation purposes was ~$86 million and included ~$3 million of PF Cost Savings associated with a reduction in force and operational efficiencies which took place during Q4 2012 (2)

Confidential Challenges and Opportunities 9
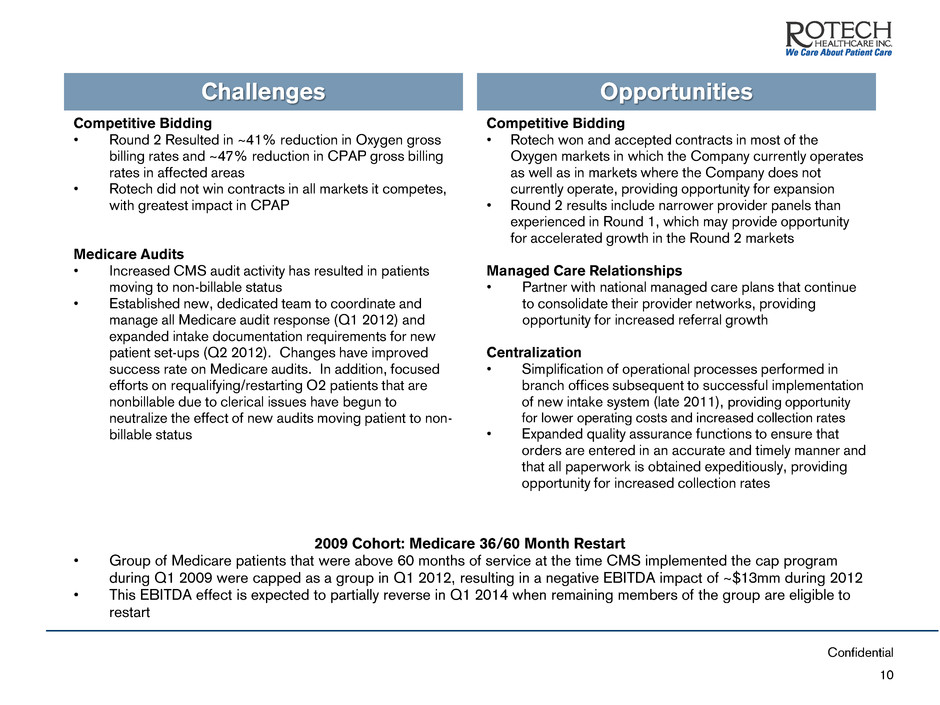
Confidential 10 Challenges Opportunities Competitive Bidding • Round 2 Resulted in ~41% reduction in Oxygen gross billing rates and ~47% reduction in CPAP gross billing rates in affected areas • Rotech did not win contracts in all markets it competes, with greatest impact in CPAP Medicare Audits • Increased CMS audit activity has resulted in patients moving to non-billable status • Established new, dedicated team to coordinate and manage all Medicare audit response (Q1 2012) and expanded intake documentation requirements for new patient set-ups (Q2 2012). Changes have improved success rate on Medicare audits. In addition, focused efforts on requalifying/restarting O2 patients that are nonbillable due to clerical issues have begun to neutralize the effect of new audits moving patient to non- billable status Competitive Bidding • Rotech won and accepted contracts in most of the Oxygen markets in which the Company currently operates as well as in markets where the Company does not currently operate, providing opportunity for expansion • Round 2 results include narrower provider panels than experienced in Round 1, which may provide opportunity for accelerated growth in the Round 2 markets Managed Care Relationships • Partner with national managed care plans that continue to consolidate their provider networks, providing opportunity for increased referral growth Centralization • Simplification of operational processes performed in branch offices subsequent to successful implementation of new intake system (late 2011), providing opportunity for lower operating costs and increased collection rates • Expanded quality assurance functions to ensure that orders are entered in an accurate and timely manner and that all paperwork is obtained expeditiously, providing opportunity for increased collection rates 2009 Cohort: Medicare 36/60 Month Restart • Group of Medicare patients that were above 60 months of service at the time CMS implemented the cap program during Q1 2009 were capped as a group in Q1 2012, resulting in a negative EBITDA impact of ~$13mm during 2012 • This EBITDA effect is expected to partially reverse in Q1 2014 when remaining members of the group are eligible to restart

Confidential Competitive Bidding Round 2 Summary 11 Est. Annual Impact (millions) Rate Reduction Lost Contract Total (1) Est. Gross Revenue Impact ($23.6) ($10.5) ($34.1) Est. Net Revenue Impact ($28.0) Est. Gross EBITDA Impact ($20.0) In 2013, half-year EBITDA impact of approximately ~$10mm is expected to be partially mitigated by gradual runoff of grandfathered patients in lost markets and increased referral rates in prevailing markets (1) Calculated without consideration of offsetting volume growth in markets won with limited number of contracted suppliers per CBA. Analysis reflects only initial offers of contracts in competitive bidding markets and does not include additional contracts that may be offered as a result of other providers declining contracts. The following is a breakdown of annual gross revenue, net revenue and EBITDA impact of competitive bidding round 2 based on annualized Q4 2012 results in relevant markets. The impact below is reflected after full runoff of the existing patient base in lost markets and includes no increase in referrals in markets in which the Company prevailed • Rate reduction reflects reduction in revenue in affected markets based on reimbursement reductions in affected markets • Lost contract reflects incremental revenue impact of lost contracts after giving PF consideration to effect of rate reduction in lost markets
