Attached files
| file | filename |
|---|---|
| 8-K - 8-K CURRENT REPORT - AgEagle Aerial Systems Inc. | v339500_8k.htm |
A Domestic Onshore Oil Company EnerJex Resources, Inc. (OTC: ENRJ) Energy Prospectus Group Luncheon March 27th, 2013
2 SUMMARY : The material presented is a presentation of general background information about EnerJex Resources, Inc . (“ENRJ”) as of the date of this document . This information is in summary form and does not purport to be complete . This document (and/or attachments to this document) is not intended to be relied upon as advice to existing or potential investors . FORWARD - LOOKING STATEMENTS : This document (including the financial projections and any subsequent questions and answers) contains statements that are forward - looking within the meaning of Section 27 A of the Securities Act of 1933 and Section 21 E of the Securities Exchange Act of 1934 . Such forward - looking statements are only predictions and are not guarantees of future performance . Investors are cautioned that any such forward - looking statements are and will be, as the case may be, subject to many risks, uncertainties, certain assumptions and factors relating to the operations and business environment of ENRJ that may cause the actual results of the companies to be materially different from any future results expressed or implied in such forward-looking statements . RESERVE AND RESOURCE DISCLOSURE : Securities and Exchange Commission (“SEC”) rules prohibit a publicly - reporting oil and gas company from including oil and gas resource estimates in its filings with the SEC, except proved, probable and possible reserves that meet the SEC’s definition of such terms . Estimates of non - proved and non - probable reserves included herein are not based on SEC definitions and guidelines and may not meet specific definitions of reserves or resource categories within the meaning of the SPE/SPEE/WPC Petroleum Resource Management System . NO REPRESENTATIONS : The information in this document (and/or attachments to this document) is current as of the date indicated . That information is not complete, and the performance projections included herein have not been audited . These presentation materials do not contain certain material information concerning ENRJ, including important disclosures and risk factors associated with making an investment in ENRJ, and are subject to revision at any time . ENRJ does not undertake any obligated to inform you of any changes in circumstances that may affect, in the future, the accuracy of the information set forth herein . Although ENRJ believes that the expectations and assumptions reflected in this document and the forward - looking statements are reasonable based upon information currently available to ENRJ, and their respective principals, employees, agents and authorized representatives, none of ENRJ, or their respective principals, employees, agents or authorized representatives makes any warranty or representation, whether express or implied, or assumes any legal liability for the accuracy, completeness or usefulness of any information disclosed . ENRJ nor any of its respective principals, employees, agents or authorized representatives accepts any responsibility or liability whatsoever caused by any action taken in reliance upon this document and/or its attachments . Disclaimer / Forward Looking Statements
▪ Drilling Success Rate ▪ Economic Trends ▪ Company Overview
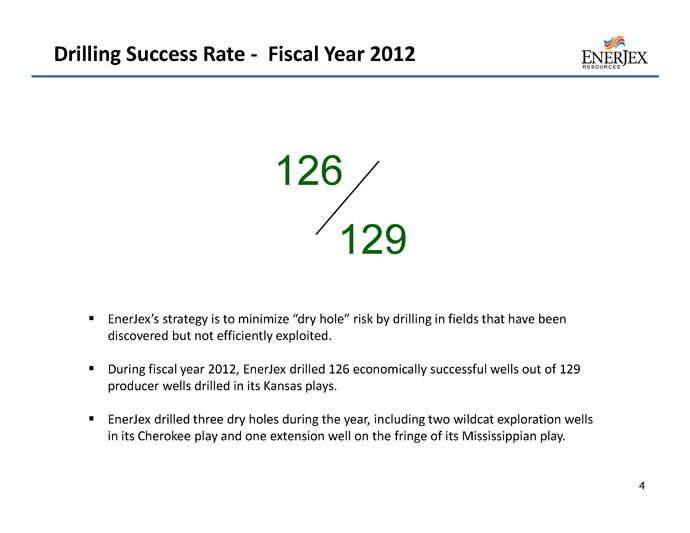
4 Drilling Success Rate - Fiscal Year 2012 ▪ EnerJex’s strategy is to minimize “dry hole” risk by drilling in fields that have been discovered but not efficiently exploited. ▪ During fiscal year 2012, EnerJex drilled 126 economically successful wells out of 129 producer wells drilled in its Kansas plays . ▪ EnerJex drilled three dry holes during the year, including two wildcat exploration wells in its Cherokee play and one extension well on the fringe of its Mississippian play. 126 129
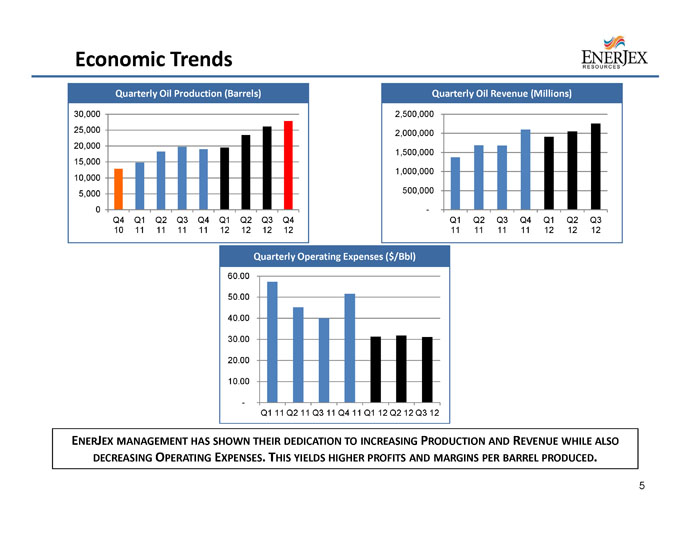
5 Economic Trends Quarterly Operating Expenses ($/Bbl) E NER J EX MANAGEMENT HAS SHOWN THEIR DEDICATION TO INCREASING P RODUCTION AND R EVENUE WHILE ALSO DECREASING O PERATING E XPENSES . T HIS YIELDS HIGHER PROFITS AND MARGINS PER BARREL PRODUCED . Quarterly Oil Revenue (Millions) Quarterly Oil Production (Barrels) - 10.00 20.00 30.00 40.00 50.00 60.00 Q1 11 Q2 11 Q3 11 Q4 11 Q1 12 Q2 12 Q3 12 0 5,000 10,000 15,000 20,000 25,000 30,000 Q4 10 Q1 11 Q2 11 Q3 11 Q4 11 Q1 12 Q2 12 Q3 12 Q4 12 - 500,000 1,000,000 1,500,000 2,000,000 2,500,000 Q1 11 Q2 11 Q3 11 Q4 11 Q1 12 Q2 12 Q3 12
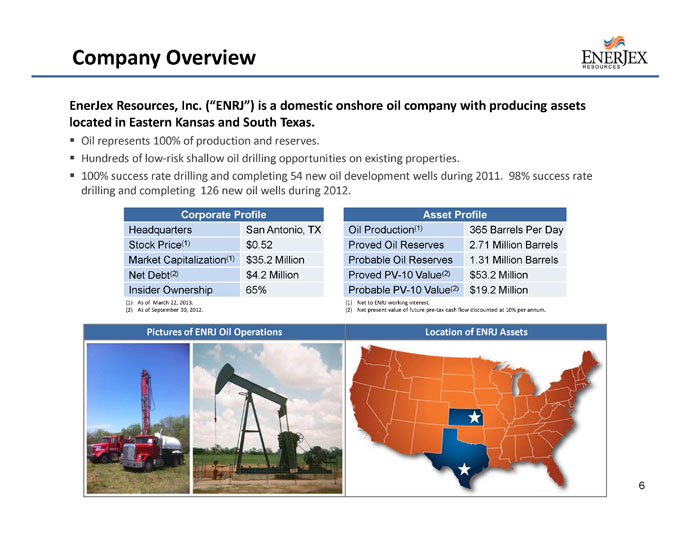
6 Company Overview EnerJex Resources, Inc. (“ENRJ”) is a domestic onshore oil company with producing assets located in Eastern Kansas and South Texas. ▪ Oil represents 100% of production and reserves. ▪ Hundreds of low-risk shallow oil drilling opportunities on existing properties. ▪ 100 % success rate drilling and completing 54 new oil development wells during 2011. 98% success rate drilling and completing 126 new oil wells during 2012. Corporate Profile Asset Profile Headquarters San Antonio, TX Oil Production (1) 365 Barrels Per Day Stock Price (1) $0.52 Proved Oil Reserves 2.71 Million Barrels Market Capitalization (1) $35.2 Million Probable Oil Reserves 1.31 Million Barrels Net Debt (2) $4.2 Million Proved PV - 10 Value (2) $53.2 Million Insider Ownership 65% Probable PV - 10 Value (2) $19.2 Million (1) Net to ENRJ working interest. (2) Net present value of future pre - tax cash flow discounted at 10% per annum. Location of ENRJ Assets Pictures of ENRJ Oil Operations (1) As of March 22, 2013. (2) As of September 30, 2012.
▪ Kansas – Mississippian Project ▪ Kansas – Cherokee Project ▪ Five Spot Pattern ▪ Kansas Type Curves ▪ Texas – El Toro Project ▪ Overview of Oil Portfolio ▪ Summary of Oil Reserves

8 Mississippian Project Gas Oil Shallow Gas Oil & Gas Gas Storage Oil & Gas Fields in Kansas Woodson County Oil & Gas Fields Project Profile Asset Profile Location (County) Woodson, KS More than 1 billion barrels of oil have been produced from the Mississippian formation in Kansas, and it currently accounts for more than 25 % of the state’s 40 million barrels of annual oil production ( 2 ) . This project has the potential to produce 1 , 000 barrels of oil per day . Gross Acres 4,260 Working Interest 90% Producing Formation Mississippian Formation Depth 1,700 Feet Cumulative Oil Production 5.3 Million Barrels Upside Potential : ▪ Hundreds of unbooked potential drilling locations ( 3 ) . ▪ Numerous additional prospective oil zones . ▪ Higher recovery % of oil in place . Current Oil Production 160 Barrels / Day Proved Oil Reserves 2,057,460 Barrels % Developed 18% PV - 10 Value $37,580,450 Proved Drilling Locations (1) 73 Additional Drilling Locations (3) ~200 Completed Well Cost $85,000 (1) Undeveloped oil wells included in reserve report. (2) According to the Kansas Geological Society. (3) Potential undeveloped oil wells identified by ENRJ that are not included in reserve report.
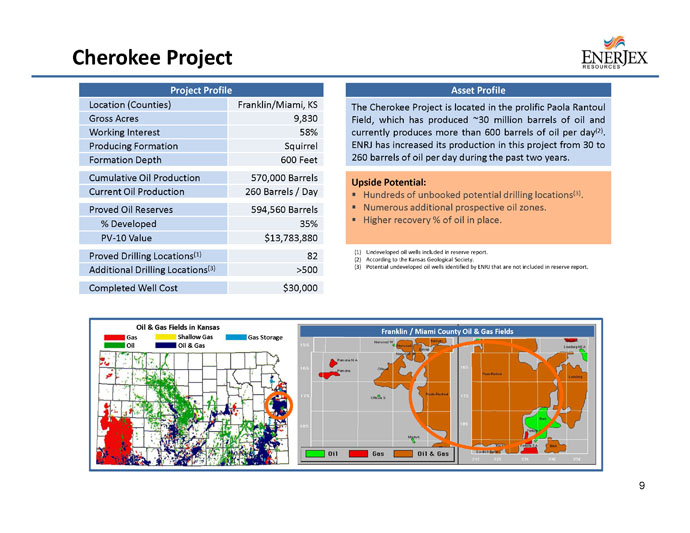
Project Profile Asset Profile Location (Counties) Franklin/Miami, KS The Cherokee Project is located in the prolific Paola Rantoul Field, which has produced ~ 30 million barrels of oil and currently produces more than 600 barrels of oil per day ( 2 ) . ENRJ has increased its production in this project from 30 to 260 barrels of oil per day during the past two years . Gross Acres 9,830 Working Interest 58% Producing Formation Squirrel Formation Depth 600 Feet Cumulative Oil Production 570,000 Barrels Upside Potential : ▪ Hundreds of unbooked potential drilling locations ( 3 ) . ▪ Numerous additional prospective oil zones . ▪ Higher recovery % of oil in place . Current Oil Production 260 Barrels / Day Proved Oil Reserves 594,560 Barrels % Developed 35% PV - 10 Value $13,783,880 Proved Drilling Locations (1) 82 Additional Drilling Locations (3) >500 Completed Well Cost $30,000 9 Cherokee Project Franklin / Miami County Oil & Gas Fields Gas Oil Shallow Gas Oil & Gas Gas Storage Oil & Gas Fields in Kansas (1) Undeveloped oil wells included in reserve report. (2) According to the Kansas Geological Society. (3) Potential undeveloped oil wells identified by ENRJ that are not included in reserve report.
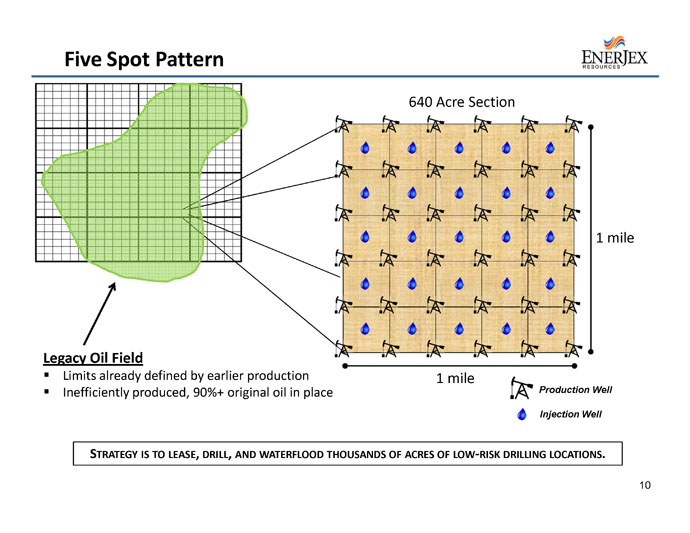
10 Five Spot Pattern Production Well Injection Well 1 mile 1 mile Legacy Oil Field ▪ Limits already defined by earlier production ▪ Inefficiently produced, 90%+ original oil in place S TRATEGY IS TO LEASE , DRILL , AND WATERFLOOD THOUSANDS OF ACRES OF LOW - RISK DRILLING LOCATIONS . 640 Acre Section
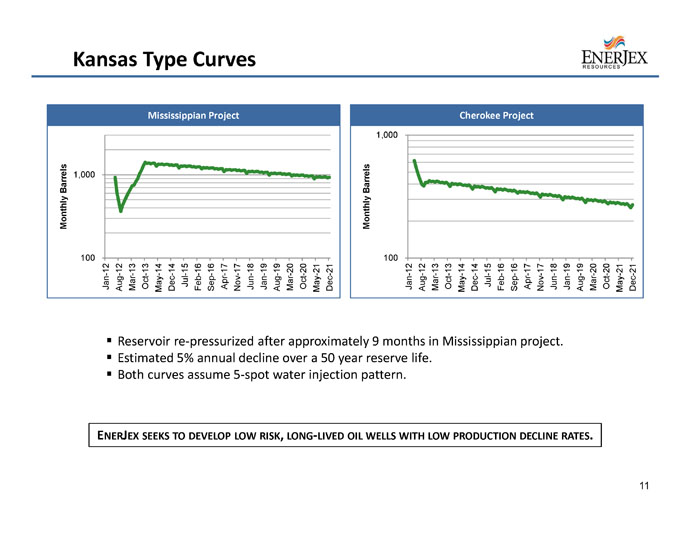
11 Kansas Type Curves E NER J EX SEEKS TO DEVELOP LOW RISK , LONG - LIVED OIL WELLS WITH LOW PRODUCTION DECLINE RATES . ▪ Reservoir re - pressurized after approximately 9 months in Mississippian project. ▪ Estimated 5% annual decline over a 50 year reserve life . ▪ Both curves assume 5 - spot water injection pattern. 100 1,000 Jan-12 Aug-12 Mar-13 Oct-13 May-14 Dec-14 Jul-15 Feb-16 Sep-16 Apr-17 Nov-17 Jun-18 Jan-19 Aug-19 Mar-20 Oct-20 May-21 Dec-21 Monthly Barrels Mississippian Project 100 1,000 Jan-12 Aug-12 Mar-13 Oct-13 May-14 Dec-14 Jul-15 Feb-16 Sep-16 Apr-17 Nov-17 Jun-18 Jan-19 Aug-19 Mar-20 Oct-20 May-21 Dec-21 Monthly Barrels Cherokee Project
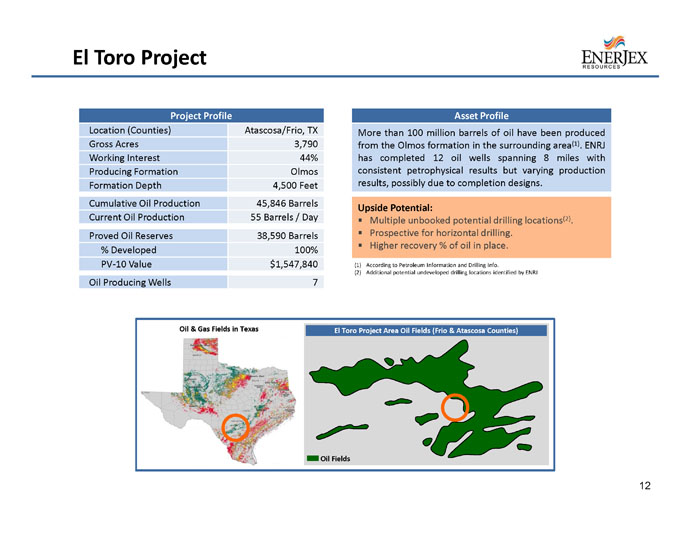
12 El Toro Project Project Profile Asset Profile Location (Counties) Atascosa/Frio, TX More than 100 million barrels of oil have been produced from the Olmos formation in the surrounding area ( 1 ) . ENRJ has completed 12 oil wells spanning 8 miles with consistent petrophysical results but varying production results, possibly due to completion designs . Gross Acres 3,790 Working Interest 44% Producing Formation Olmos Formation Depth 4,500 Feet Cumulative Oil Production 45,846 Barrels Upside Potential : ▪ Multiple unbooked potential drilling locations ( 2 ) . ▪ Prospective for horizontal drilling . ▪ Higher recovery % of oil in place . Current Oil Production 55 Barrels / Day Proved Oil Reserves 38,590 Barrels % Developed 100% PV - 10 Value $1,547,840 Oil Producing Wells 7 (1) According to Petroleum Information and Drilling Info . (2) Additional potential undeveloped drilling locations identified by ENRJ El Toro Project Area Oil Fields (Frio & Atascosa Counties) Oil Fields Oil & Gas Fields in Texas
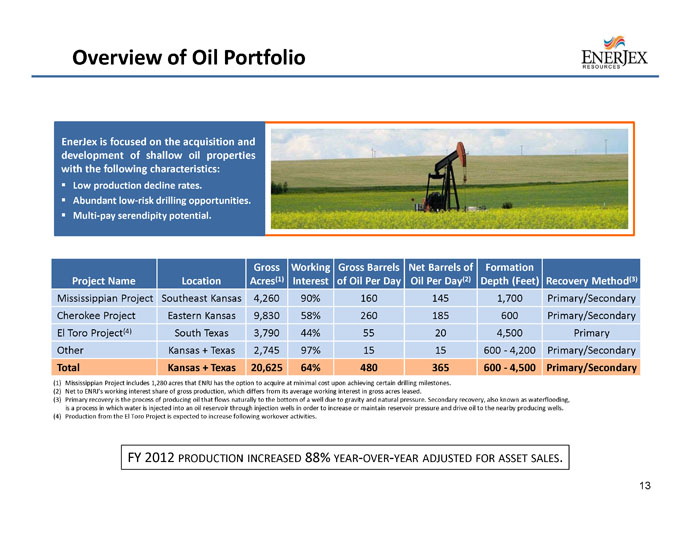
13 Overview of Oil Portfolio Project Name Location Gross Acres (1) Working Interest Gross Barrels of Oil Per Day Net Barrels of Oil Per Day (2) Formation Depth (Feet) Recovery Method (3) Mississippian Project Southeast Kansas 4,260 90% 160 145 1,700 Primary/Secondary Cherokee Project Eastern Kansas 9,830 58% 260 185 600 Primary/Secondary El Toro Project (4) South Texas 3,790 44% 55 20 4,500 Primary Other Kansas + Texas 2,745 97% 15 15 600 - 4,200 Primary/Secondary Total Kansas + Texas 20,625 64% 480 365 600 - 4,500 Primary/Secondary (1) Mississippian Project includes 1,280 acres that ENRJ has the option to acquire at minimal cost upon achieving certain drillin g m ilestones. (2) Net to ENRJ’s working interest share of gross production, which differs from its average working interest in gross acres leas ed. (3) Primary recovery is the process of producing oil that flows naturally to the bottom of a well due to gravity and natural pres sur e. Secondary recovery, also known as waterflooding , is a process in which water is injected into an oil reservoir through injection wells in order to increase or maintain reserv oir pressure and drive oil to the nearby producing wells. (4) Production from the El Toro Project is expected to increase following workover activities. EnerJex is focused on the acquisition and development of shallow oil properties with the following characteristics : ▪ Low production decline rates. ▪ Abundant low - risk drilling opportunities. ▪ Multi - pay serendipity potential. FY 2012 PRODUCTION INCREASED 88% YEAR - OVER - YEAR ADJUSTED FOR ASSET SALES .
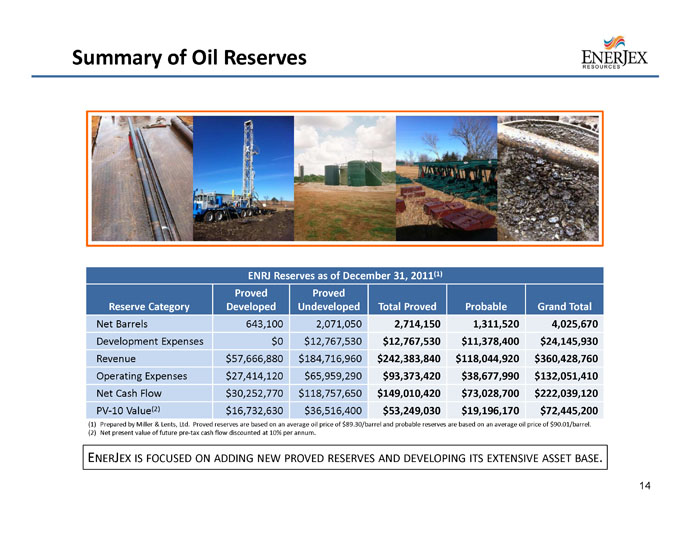
14 Summary of Oil Reserves ENRJ Reserves as of December 31, 2011 (1) Reserve Category Proved Developed Proved Undeveloped Total Proved Probable Grand Total Net Barrels 643,100 2,071,050 2,714,150 1,311,520 4,025,670 Development Expenses $0 $12,767,530 $12,767,530 $11,378,400 $24,145,930 Revenue $57,666,880 $184,716,960 $242,383,840 $118,044,920 $360,428,760 Operating Expenses $27,414,120 $65,959,290 $93,373,420 $38,677,990 $132,051,410 Net Cash Flow $30,252,770 $118,757,650 $149,010,420 $73,028,700 $222,039,120 PV - 10 Value (2) $16,732,630 $36,516,400 $53,249,030 $19,196,170 $72,445,200 (1) Prepared by Miller & Lents, Ltd . Proved reserves are based on an average oil price of $ 89 . 30 /barrel and probable reserves are based on an average oil price of $ 90 . 01 /barrel . (2) Net present value of future pre - tax cash flow discounted at 10 % per annum . E NER J EX IS FOCUSED ON ADDING NEW PROVED RESERVES AND DEVELOPING ITS EXTENSIVE ASSET BASE .
▪ Growth Trends ▪ Value Proposition ▪ Capitalization / Ownership Table ▪ Robust Financial Profile ▪ Hedging: Protect and Stabilize Cash Flows ▪ Management Team ▪ Corporate Objectives
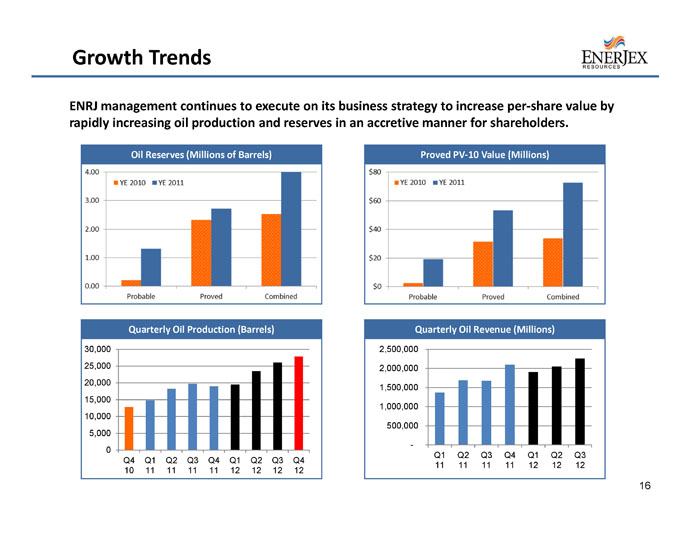
Quarterly Oil Production (Barrels) Quarterly Oil Revenue (Millions) Proved PV - 10 Value (Millions) ENRJ management continues to execute on its business strategy to increase per - share value by rapidly increasing oil production and reserves in an accretive manner for shareholders. 16 Growth Trends Oil Reserves (Millions of Barrels) 0 5,000 10,000 15,000 20,000 25,000 30,000 Q4 10 Q1 11 Q2 11 Q3 11 Q4 11 Q1 12 Q2 12 Q3 12 Q4 12 - 500,000 1,000,000 1,500,000 2,000,000 2,500,000 Q1 11 Q2 11 Q3 11 Q4 11 Q1 12 Q2 12 Q3 12
17 Value Proposition ENRJ provides leverage to oil and a compelling value proposition based on its proved reserves and growth potential. ▪ Trading at 0.72x proved PV - 10 value and $14.1 per barrel of proved oil reserves. ▪ Oil represents 100% of proved reserves (zero natural gas production). Upside Reserve Potential ▪ ENRJ has the potential to multiply the proved reserves associated with its existing properties . ▪ Hundreds of highly prospective drilling locations were not included in ENRJ’s 2011 reserve report . ▪ 37% of prospective Mississippian Project acreage (subject to option exercise) was not included in ENRJ’s 2011 reserve report.
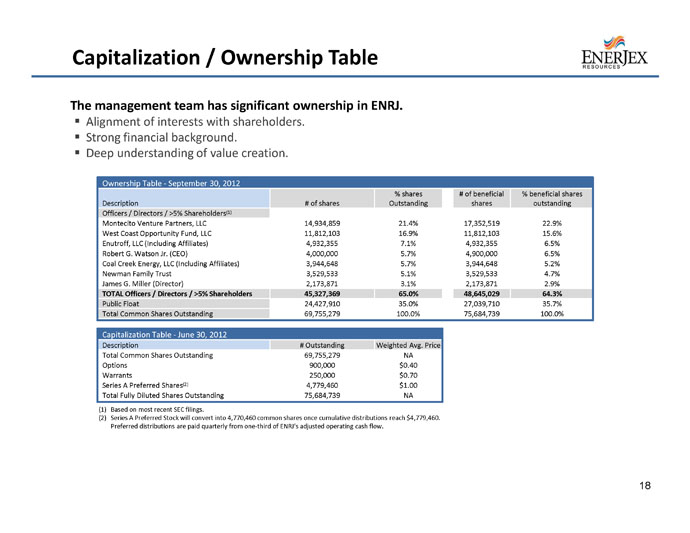
18 Capitalization / Ownership Table The management team has significant ownership in ENRJ. ▪ Alignment of interests with shareholders. ▪ Strong financial background. ▪ Deep understanding of value creation. Ownership Table - September 30, 2012 Description # of shares % shares Outstanding # of beneficial shares % beneficial shares outstanding Officers / Directors / >5% Shareholders (1) Montecito Venture Partners, LLC 14,934,859 21.4% 17,352,519 22.9% West Coast Opportunity Fund, LLC 11,812,103 16.9% 11,812,103 15.6% Enutroff, LLC (Including Affiliates) 4,932,355 7.1% 4,932,355 6.5% Robert G. Watson Jr. (CEO) 4,000,000 5.7% 4,900,000 6.5% Coal Creek Energy, LLC (Including Affiliates) 3,944,648 5.7% 3,944,648 5.2% Newman Family Trust 3,529,533 5.1% 3,529,533 4.7% James G. Miller (Director) 2,173,871 3.1% 2,173,871 2.9% TOTAL Officers / Directors / >5% Shareholders 45,327,369 65.0% 48,645,029 64.3% Public Float 24,427,910 35.0% 27,039,710 35.7% Total Common Shares Outstanding 69,755,279 100.0% 75,684,739 100.0% Capitalization Table - June 30, 2012 Description # Outstanding Weighted Avg. Price Total Common Shares Outstanding 69,755,279 NA Options 900,000 $0.40 Warrants 250,000 $0.70 Series A Preferred Shares (2) 4,779,460 $1.00 Total Fully Diluted Shares Outstanding 75,684,739 NA (1) Based on most recent SEC filings. (2) Series A Preferred Stock will convert into 4,770,460 common shares once cumulative distributions reach $4,779,460. Preferred distributions are paid quarterly from one - third of ENRJ’s adjusted operating cash flow.
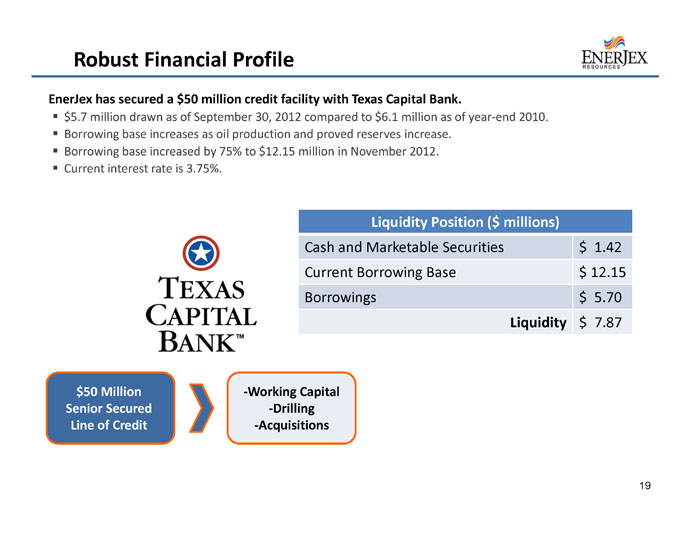
EnerJex has secured a $50 million credit facility with Texas Capital Bank. ▪ $5.7 million drawn as of September 30, 2012 compared to $6.1 million as of year - end 2010. ▪ Borrowing base increases as oil production and proved reserves increase. ▪ Borrowing base increased by 75% to $12.15 million in November 2012. ▪ Current interest rate is 3.75%. 19 Robust Financial Profile $50 Million Senior Secured Line of Credit - Working Capital - Drilling - Acquisitions Liquidity Position ($ millions) Cash and Marketable Securities $ 1 . 42 Current Borrowing Base $ 12 . 15 Borrowings $ 5 . 70 Liquidity $ 7 . 87

20 Crude Oil Hedges Period Monthly Volumes Avg. Price Per Barrel Aug 12 – Dec 12 5,600 $82.39 Jan 13 – Dec 13 4,900 $80.00 Jan 14 – Dec 14 4,450 $80.26 Jan 15 – Dec 15 4,000 $81.96 Hedging: Protect and Stabilize Cash Flows A PPROXIMATELY 65% OF TODAY ’ S PRODUCTION IS HEDGED IN THE LOW $80/B BL PRICE RANGE . T HIS STRATEGY PRESERVES UPSIDE POTENTIAL WHILE PROTECTING AGAINST DOWNSIDE PRICE RISK .
Robert Watson Jr. (Chief Executive Officer / Director) ▪ Co - founder and former CEO of Black Sable Energy, a private oil exploration and production company focused on South Texas that was subsequently sold to ENRJ. ▪ Former President of Centerra Energy Partners, a private oil and gas partnership focused on South Texas. ▪ Senior Associate at American Capital, Ltd. (NASDAQ: ACAS), a publicly traded middle - market private equity firm and global asset manager with $68 billion in assets under management. » Executed 7 transactions in excess of $150 million in invested capital, and actively participated in the daily management of 12 portfolio companies. ▪ Member of Investment Banking Team in the Energy Group at CIBC World Markets. ▪ Graduate of Southern Methodist University with a Bachelor of Arts degree in Finance. Atticus Lowe, CFA (SVP of Corporate Development / Director) ▪ Chief Investment Officer of West Coast Asset Management, Inc. » Invested more than $200 million in the oil and gas exploration and production industry on behalf of principals and clients during the past 10 years. ▪ Director and Chairman of Audit Committee for Black Raven Energy, Inc., a private oil and natural gas exploration and production company with producing assets located in the DJ Basin. ▪ Graduate of Westmont College with a Bachelor of Arts degree in Economics and Business. 21 Management Team
Douglas M. Wright (Chief Financial Officer) ▪ Former Corporate Controller and Chief Accounting Officer of Nations Petroleum Company, Ltd. from 2006 until his appointment by ENRJ. ▪ Oversight of Financial Reporting for sub of Noble Energy, Inc. (NYSE: NBL) from 2005 to 2006. » Responsible for SEC reporting relating to its $3.4 billion acquisition of Patina Oil & Gas Corp. ▪ Served in various managerial roles from 1986 to 1996 at Oryx Energy Co., which was purchased by Kerr McGee Corp. for $3.1 billion. ▪ Began his career at Deloitte & Touche where he served as a manager from 1977 to 1986, and was a firm designated specialist in the energy field. ▪ Graduate of the University of Pittsburgh and recipient of a Master of Business Administration Degree from the University of North Texas James Miller (Director) ▪ Former Executive at Utilicorp United, subsequently renamed Aquila, Inc. (NYSE:ILA) between 1989 and 2002. » CEO of business unit responsible for electricity generation and electric and natural gas transmission and distribution businesses serving 1.3 million customers. » Merged with Great Plains Energy (NYSE: GXP) in 2007 through a series of transactions valued at $2.6 billion, including the sale of natural gas properties and other assets to Black Hills Corp. (NYSE: BKH) for $940 million. ▪ Former President of Michigan Gas Utilities between 1983 and 1989, which was later acquired by Utilicorp United. ▪ Graduate of the University of Wisconsin with a Bachelor of Sciences degree in Electrical Engineering and a Master of Business Administration degree in Management. Lance Helfert (Director) ▪ Founder and President of West Coast Asset Management, Inc. » Multi - strategy asset manager with a focus on concentrated opportunistic investments. » Registered Investment Advisor with approximately $200 million in assets under management. ▪ Former Portfolio Manager at Wilshire Associates » Responsible for $1 Billion portfolio of small - mid cap investments. ▪ Graduate of Pepperdine University with a Bachelor of Sciences degree in Business Administration . 22 Management Team (Continued)

23 Corporate Objectives ▪ Increase Kansas production to 1,000+ barrels of oil per day through development of existing drilling inventory. ▪ Significantly increase oil reserves attributed to existing properties. ▪ Continue exploring and developing Texas assets. ▪ Continue a proactive investor outreach campaign to increase company exposure and improve stock trading volume. ▪ List stock on NYSE MKT or NASDAQ. MANAGEMENT IS 100% FOCUSED ON CREATING PER - SHARE VALUE FOR STOCKHOLDERS
Corporate Website: www.enerjex.com Corporate Headquarters: 4040 Broadway Street, Suite 508 San Antonio, TX 78209 Chief Executive Officer: Robert Watson, Jr. (210) 451-5545 Investor Relations: Daniel Vernon (405) 230 - 1124 A Domestic Onshore Oil Company