Attached files
| file | filename |
|---|---|
| EX-99 - EX-99 - Tim Hortons Inc. | d508512dex99.htm |
| EX-32.(C) - EX-32.(C) - Tim Hortons Inc. | d508512dex32c.htm |
| EX-32.(D) - EX-32.(D) - Tim Hortons Inc. | d508512dex32d.htm |
| EX-31.(C) - EX-31.(C) - Tim Hortons Inc. | d508512dex31c.htm |
| EX-31.(D) - EX-31.(D) - Tim Hortons Inc. | d508512dex31d.htm |
Table of Contents
UNITED STATES
SECURITIES AND EXCHANGE COMMISSION
WASHINGTON, D.C. 20549
FORM 10-K/A
Amendment No. 1
(Mark One)
| x | ANNUAL REPORT PURSUANT TO SECTION 13 or 15(d) OF THE SECURITIES EXCHANGE ACT OF 1934 |
For the Fiscal Year Ended December 30, 2012
| ¨ | TRANSITIONAL REPORT PURSUANT TO SECTION 13 OR 15(d) OF THE SECURITIES EXCHANGE ACT OF 1934 |
For the transition period from to
Commission File Number: 001-32843
TIM HORTONS INC.
(Exact name of Registrant as specified in its charter)
| Canada | 98-0641955 | |
| (State or other jurisdiction of incorporation or organization) |
(I.R.S. Employer Identification Number) | |
| 874 Sinclair Road, Oakville, ON, Canada | L6K 2Y1 | |
| (Address of principal executive offices) | (Zip Code) | |
Registrant’s telephone number, including area code 905-845-6511
Securities registered pursuant to Section 12(b) of the Act:
| Title of each class |
Name of each exchange on which registered | |
| Common Shares, without par value | New York Stock Exchange | |
| Associated Share Purchase Rights | Toronto Stock Exchange |
Securities registered pursuant to Section 12(g) of the Act: None
Indicate by check mark if the Registrant is a well-known seasoned issuer, as defined in Rule 405 of the Securities Act. YES x NO ¨.
Indicate by check mark if the Registrant is not required to file reports pursuant to Section 13 or Section 15(d) of the Act. YES ¨ NO x.
Indicate by check mark whether the Registrant (1) has filed all reports required to be filed by Section 13 or 15(d) of the Securities Exchange Act of 1934 during the preceding 12 months (or for such shorter period that the Registrant was required to file such reports) and (2) has been subject to such filing requirements for the past 90 days. YES x NO ¨.
Indicate by check mark whether the Registrant has submitted electronically and posted on its corporate Web site, if any, every Interactive Data File required to be submitted and posted pursuant to Rule 405 of Regulation S-T during the preceding 12 months (or for such shorter period that the Registrant was required to submit and post such files). YES x NO ¨.
Indicate by check mark if disclosure of delinquent filers pursuant to Item 405 of Regulation S-K is not contained herein, and will not be contained, to the best of Registrant’s knowledge, in definitive proxy or information statements incorporated by reference in Part III of this Form 10-K or any amendment to this Form 10-K. x
Indicate by check mark whether the Registrant is a large accelerated filer, an accelerated filer, a non-accelerated filer, or a smaller reporting company. See the definitions of “large accelerated filer,” “accelerated filer” and “smaller reporting company” in Rule 12b-2 of the Exchange Act.
| Large accelerated filer | x | Accelerated filer | ¨ | |||
| Non-accelerated filer | ¨ (Do not check if a smaller reporting company) | Smaller reporting company | ¨ | |||
Indicate by check mark whether the Registrant is a shell company (as defined in Rule 12b-2 of the Exchange Act). YES ¨ NO x.
The aggregate market value of the common shares held by non-affiliates of the Registrant computed by reference to the price at which such shares were last sold, as of June 29, 2012, was Cdn.$8,309,068,696 (US$8,149,606,413).
Number of common shares outstanding as of February 15, 2013: 153,404,839
DOCUMENTS INCORPORATED BY REFERENCE:
Exhibit index on pages 84 - 88.
Table of Contents
EXPLANATORY NOTE
Tim Hortons Inc., a corporation incorporated under the Canada Business Corporations Act (the “Company”), qualifies as a foreign private issuer in the U.S. for purposes of the Securities Exchange Act of 1934, as amended (the “Exchange Act”). Although as a foreign private issuer the Company is no longer required to do so, the Company currently continues to file annual reports on Form 10-K, quarterly reports on Form 10-Q, and current reports on Form 8-K with the Securities and Exchange Commission (“SEC”) instead of filing the reports available to foreign private issuers. The Company prepares and files a management proxy circular and related material under Canadian requirements. As the Company’s management proxy circular is not filed pursuant to Regulation 14A, the Company may not incorporate by reference information required by Part III of its Form 10-K from its management proxy circular.
The Company filed its Annual Report on Form 10-K for the fiscal year ended December 30, 2012 (“2012 Form 10-K”) on February 21, 2013. In reliance upon and as permitted by Instruction G(3) to Form 10-K, the Company is filing this Amendment No. 1 on Form 10-K/A in order to include in the 2012 Form 10-K the Part III information not previously included in the 2012 Form 10-K.
No attempt has been made in this Amendment No. 1 on Form 10-K/A to modify or update the other disclosures presented in the 2012 Form 10-K. This Amendment No. 1 on Form 10-K/A does not reflect events occurring after the filing of the 2012 Form 10-K. Accordingly, this Amendment No. 1 on Form 10-K/A should be read in conjunction with the 2012 Form 10-K and the Company’s other filings with the SEC.
In this Amendment No. 1 on Form 10-K/A, we also refer to Tim Hortons Inc. as “Tim Hortons,” “we,” “us,” “our,” “our corporation,” or “the corporation.” References to “GAAP” mean generally accepted accounting principles in the United States.
All references to our websites contained herein do not constitute incorporation by reference of information contained on such websites and such information should not be considered part of this document.
2
Table of Contents
TIM HORTONS INC.
2012 FORM 10-K/A ANNUAL REPORT
| Page | ||||
| PART III | ||||
| Item 10. Directors, Executive Officers and Corporate Governance |
4 | |||
| 13 | ||||
| 73 | ||||
| Item 13. Certain Relationships and Related Transactions, and Director Independence |
76 | |||
| 80 | ||||
| PART IV | ||||
| 82 | ||||
| 83 | ||||
3
Table of Contents
| Item 10. | Directors, Executive Officers and Corporate Governance |
Directors of Registrant
|
M. Shan Atkins Independent Age: 56 Residence: Long Grove, Illinois, United States Director Since: March 2007 |
M. Shan Atkins has been a Managing Director of Chetrum Capital LLC, a private investment firm, since 2001. From 1996 to 2001, Ms. Atkins held various positions with Sears Roebuck & Co., a major retailer, being promoted to Executive Vice President in 1999. Prior to joining Sears, Ms. Atkins spent 14 years with Bain & Company, Inc., an international management consulting firm, as a leader in Bain’s consumer and retail practice. Ms. Atkins began her career as a public accountant at what is now PricewaterhouseCoopers LLP, a major accounting firm, and has designations as a C.A. (Ontario) and C.P.A. (Illinois). Ms. Atkins has served as a member of Queen’s School of Business Advisory Board since the Spring of 2009. She has also been a director of Northwest Community Healthcare since 2001, and is a member of its audit and compliance committee and its compensation and governance committee. Ms. Atkins holds a Bachelor of Commerce degree from Queen’s University in Kingston, Ontario, as well as a Master of Business Administration from Harvard University. | |||||||
| Board and Committee Attendance | Tim Hortons Inc. Board Committee Membership | |||||||
| Board
Meetings Attended |
Committee Meetings Attended |
Human Resource and Compensation Committee (HRCC) Nominating and Corporate Governance Committee (NCGC) | ||||||
| 6 of 6 | 100% | HRCC: 5 of 5 | 100% | |||||
| NCGC: 4 of 4 | 100% | |||||||
| Number of Tim Hortons Securities Beneficially Owned, Controlled or Directed(1) |
Current Public Company Board Memberships (stock exchange listing(s) indicated in parentheses) | |||||||
| DSUs | Common Shares |
Value of Securities Held(2) |
The Pep Boys-Manny, Moe & Jack (NYSE) Spartan Stores Inc. (NASDAQ) | |||||
| 10,638 | 1,000 | $611,111 | Other Public Company Board Memberships in Last Five Years (duration of service and stock exchange listing(s) indicated in parentheses) | |||||
| Shoppers Drug Mart Corporation (2005-2012) (TSX) | ||||||||
|
Achievement of Stock Ownership Guidelines (at least 3X annual retainer for Board service, or $270,000) |
Relevant Skills, Experience, and Other Considerations | |||||||
|
6.8X |
General retail; senior leadership; public company board; human resource and compensation; and, financial expertise. | |||||||

| (1) | As at March 12, 2013. Please refer to pages 74 and 75, which provide ownership details as at March 25, 2013. DSU holdings for directors as at March 25, 2013 reflect DERs earned on such DSUs on March 19, 2013. |
| (2) | Based upon the closing price of our common shares on the TSX on March 12, 2013 of $52.51. |
4
Table of Contents
|
Michael J. Endres Independent Audit Committee Financial Expert Age: 65 Residence: Columbus, Ohio, Director Since: April 2006 |
Michael J. Endres is a Managing Principal of Stonehenge Financial Holdings, Inc. (“Stonehenge”), a private equity firm that he co-founded in 1999. Prior to co-founding Stonehenge, Mr. Endres was Vice Chairman of Banc One Capital Holdings Corporation and Chairman of Banc One Capital Partners. Mr. Endres currently serves as a member of the board of directors of Worthington Industries, Inc. and Huntington Bancshares, Inc. Mr. Endres also serves on the Board of Trustees of OhioHealth Corporation, a large non-profit health system with multiple hospitals and related healthcare facilities and services, located in Ohio. He holds a Bachelor of Science degree from Miami University in Oxford, Ohio. | |||||||
| Board and Committee Attendance | Tim Hortons Inc. Board Committee Membership | |||||||
| Board Meetings
Attended |
Committee Meetings Attended |
Audit Committee (Chair) Executive Committee (not included for director attendance purposes) | ||||||
| 6 of 6 | 100% | Audit: 4 of 4 | 100% | |||||
| Number of Tim Hortons Securities Beneficially Owned, Controlled or Directed(1) |
Current Public
Company Board Memberships (stock exchange listing(s) indicated in parentheses) | |||||||
| DSUs | Common Shares |
Value of Securities Held(2) |
Worthington Industries, Inc. (NYSE) Huntington Bancshares, Inc. (NASDAQ) | |||||
| 17,695 |
52,832 | $3,703,373 | Other Public Company Board Memberships in Last
Five Years (duration of service and stock exchange listing(s) indicated in parentheses) | |||||
| None | ||||||||
|
Achievement of Stock Ownership Guidelines (at least 3X annual |
Relevant Skills, Experience, and Other Considerations | |||||||
|
41.1X |
Financial expertise; new business development/M&A; senior leadership; public company board; and, risk assessment and mitigation expertise. | |||||||

| (1) | As at March 12, 2013. Please refer to pages 74 and 75, which provide ownership details as at March 25, 2013. DSU holdings for directors as at March 25, 2013 reflect DERs earned on such DSUs on March 19, 2013. |
| (2) | Based upon the closing price of our common shares on the TSX on March 12, 2013 of $52.51. |
5
Table of Contents
|
Moya M. Greene Independent Age: 58 Residence: London, United Kingdom |
Moya M. Greene has been Chief Executive Officer of the Royal Mail, the U.K. government postal service, since July 2010, and prior thereto, was the President, Chief Executive Officer and a member of the Board of the Directors of Canada Post Corporation, the Canadian postal authority, since May 2005. She was also Vice Chair of Purolator and served on its Nominating and Corporate Governance Committee and Compensation Committee. From 2003 to 2004, Ms. Greene was Senior Vice President, Operational Effectiveness, of Bombardier Inc., a leading manufacturer of rail transportation equipment and aircraft. From 2000 to 2003, she was Senior Vice President, Chief Administrative Officer, Retail Products, at Canadian Imperial Bank of Commerce, a leading North American financial institution, and from 1996 to 2000, Managing Director, Infrastructure Finance and Public Private Partnership for TD Securities Inc., a leading Canadian financial services firm. Ms. Greene also has an extensive public service background, having served most recently as Assistant Deputy Minister for Transport Canada, the Canadian federal transportation authority, from 1991 to 1996 and, from 1989 to 1991, as Director, General Policy, for Human Resources and Social Development, Canada. She is a graduate of Osgoode Hall Law School and was recognized in 2003 and in 2012 by the National Post as one of Canada’s Top 100 influential women and in 2004 by the Ivey School of Business/Women Executive Network as one of the Top 40 female corporate executives in Canada. | |||||||
| Board and Committee Attendance | Tim Hortons Inc. Board Committee Membership | |||||||
| Board Meetings
Attended |
Committee Meetings Attended |
Audit Committee Human Resource and Compensation Committee (HRCC) | ||||||
| 6 of 6 | 100% | HRCC: 5 of 5 | 100% | |||||
| Audit: 4 of 4 | 100% | |||||||
| Number of
Tim Hortons Securities Beneficially Owned, Controlled or Directed(1) |
Current Public Company Board Memberships (stock exchange listing(s) indicated in parentheses) | |||||||
| DSUs | Common Shares |
Value of Securities Held(2) |
None | |||||
| Other Public Company Board Memberships in Last Five Years (duration of service and stock exchange listing(s) indicated in parentheses) | ||||||||
| 12,941 | — | $679,532 | None | |||||
|
Achievement of Stock Ownership Guidelines (at least 3X annual |
Relevant Skills, Experience, and Other Considerations | |||||||
|
7.6X |
General retail; financial; CSR; senior leadership; government/regulatory; human resource and compensation; risk assessment and mitigation; distribution, warehouse and logistics; governance/legal; public company board; new business development/M&A; and, international expertise. | |||||||

| (1) | As at March 12, 2013. Please refer to pages 74 and 75, which provide ownership details as at March 25, 2013. DSU holdings for directors as at March 25, 2013 reflect DERs earned on such DSUs on March 19, 2013. |
| (2) | Based upon the closing price of our common shares on the TSX on March 12, 2013 of $52.51. |
6
Table of Contents
|
Paul D. House Executive Chairman, President and CEO Age: 69 Residence: Jordan, Ontario, Canada Director Since: November 2005 |
Since May 24, 2011, Mr. House has served as our Executive Chairman and President and CEO. From March 1, 2008 to May 2011, Mr. House served as our Executive Chairman. Mr. House joined our corporation as Vice President of Marketing in 1985 and occupied various senior management positions leading to his appointment in 1993 as Chief Operating Officer. He became President and Chief Operating Officer in 1995 and Chief Executive Officer in November 2005. In 2007, he was appointed Chairman of the Board and Chief Executive Officer. Mr. House served on the Board of Directors of Wendy’s International, Inc. from 1998 through February 1, 2007. He is a member of the Board of Directors of the Tim Horton Children’s Foundation and serves on the Board of Trustees of Brock University, as well as on the Advisory Board of the Brock University Business School. Mr. House joined Dairy Queen Canada in 1972 and held various management positions with that company including Vice President of Canadian Operations. Mr. House holds a Bachelor of Arts in Economics from McMaster University. | |||||
| Board Attendance | Tim Hortons Inc. Board Committee Membership | |||||
| Board
Meetings Attended |
Executive Committee (not included for director attendance purposes) | |||||
|
6 of 6 |
100% | |||||
| Number of Tim Hortons Securities Beneficially Owned, Controlled or Directed(1) |
Current Public Company Board
Memberships (stock exchange listing(s) indicated in parentheses) | |||||
| DSUs | Common Shares |
Value of Securities Held(2) |
None | |||
| Other Public Company Board Memberships in Last Five Years (duration of service and stock exchange listing(s) indicated in parentheses) | ||||||
| N/A | 177,789 | $9,335,700 | None | |||
| Stock
Ownership Guideline Compliance |
Relevant Skills, Experience,
and Other Considerations | |||||
| See pages 41 and 42 for executive officer stock ownership guideline compliance. | Franchised organization; brand marketing; senior leadership; real estate; general retail; distribution, warehouse and logistics; restaurant industry and operations; new business development/M&A; and, public company board expertise. | |||||

| (1) | As at March 12, 2013. Please refer to pages 74 and 75, which provide ownership details as at March 25, 2013. DSU holdings for directors as at March 25, 2013 reflect DERs earned on such DSUs on March 19, 2013. |
| (2) | Based upon the closing price of our common shares on the TSX on March 12, 2013 of $52.51. |
7
Table of Contents
|
The Hon. Frank Iacobucci Lead Director Since: February 2007 Independent Age: 75 Residence: Toronto, Ontario, Canada Director Since: February 2006 |
The Hon. Frank Iacobucci has been Counsel to Torys LLP, a major Canadian law firm, since July 2005. Mr. Iacobucci was the Chairman of Torstar Corporation, a newspaper and book publishing company, from July 2005 until May 2009. From September 2004 to June 2005, Mr. Iacobucci served as Interim President of the University of Toronto while the search for a new university president was being conducted. From 1991 to 2004, Mr. Iacobucci served as a Justice of the Supreme Court of Canada. Mr. Iacobucci is a Board Member of Costi Immigration Services, and is a member of the Advisory Committee of General Motors of Canada. From 2005 to 2012, Mr. Iacobucci served as Chair of the Higher Education Quality Council of Ontario. Mr. Iacobucci is a member of the Law Society of Upper Canada and holds academic degrees from Cambridge University and the University of British Columbia, and has been the recipient of numerous awards and honours from Canada, the United States, and Italy. In 2007, Mr. Iacobucci was made a Companion of the Order of Canada. | |||||||
| Board and Committee Attendance | Tim Hortons Inc. Board Committee Membership | |||||||
| Board
Meetings Attended |
Committee Meetings Attended |
Human Resource and Compensation Committee (HRCC) Nominating and Corporate Governance Committee (Chair) (NCGC) Executive Committee (not included for director attendance purposes) | ||||||
| 6 of 6 |
100% | HRCC: 5 of 5 | 100% | |||||
| NCGC: 4 of 4 | 100% | |||||||
| Number of Tim Hortons
Securities Beneficially Owned, Controlled or Directed(1) |
Current Public Company Board Memberships (stock exchange listing(s) indicated in parentheses) | |||||||
| DSUs | Common Shares |
Value of Securities Held(2) |
None | |||||
| Other Public Company Board Memberships in Last Five Years (duration of service and stock exchange listing(s) indicated in parentheses) | ||||||||
| 28,733 |
6,633 | $1,857,069 | Torstar Corporation (2003-2009) (TSX) | |||||
| Achievement of Stock Ownership Guidelines (at least 3X annual |
Relevant Skills, Experience, and Other Considerations | |||||||
| 20.6X |
Governance/legal; public company board; government/regulatory; senior leadership; human resource and compensation; CSR; and, financial expertise. | |||||||

| (1) | As at March 12, 2013. Please refer to pages 74 and 75, which provide ownership details as at March 25, 2013. DSU holdings for directors as at March 25, 2013 reflect DERs earned on such DSUs on March 19, 2013. |
| (2) | Based upon the closing price of our common shares on the TSX on March 12, 2013 of $52.51. |
8
Table of Contents
|
John A. Lederer Independent Age: 57 Residence: Toronto, Ontario, Canada Director Since: February 2007 |
John A. Lederer currently serves as President and Chief Executive Officer, and as a director, of US Foods, a position he has held since September 2010. He served as Chairman of the Board and Chief Executive Officer of Duane Reade, a privately held chain of retail pharmacies located primarily in the New York City area, from April 2008 to August 2010. Mr. Lederer served as President of Loblaw Companies Limited, Canada’s largest food distributor, from 2001 through September 2006 and also served as a director of Loblaw Companies Limited for much of this period, capping a 30-year career with Loblaw and its subsidiary companies during which he held a number of senior leadership positions. In these roles, he was responsible for the operation, performance, innovation, and growth of national and regional banners, businesses, and divisions. Mr. Lederer is a former director of the Food Marketing Institute. He holds a Bachelor of Arts degree from York University. Mr. Lederer has served as a member of the Board of Directors of the Tim Horton Children’s Foundation since May 2008. | |||||||
| Board and Committee Attendance | Tim Hortons Inc. Board Committee Membership | |||||||
| Board Meetings Attended | Committee Meetings Attended |
Human Resource and Compensation Committee (HRCC) Nominating and Corporate Governance Committee (NCGC) | ||||||
| 6 of 6 | 100% | HRCC: 5 of 5 | 100% | |||||
| NCGC: 4 of 4 | 100% | |||||||
| Number of Tim Hortons
Securities Beneficially Owned, Controlled or Directed(1) |
Current Public Company Board
Memberships (stock exchange listing(s) indicated in parentheses) | |||||||
| DSUs | Common Shares |
Value of Securities Held(2) |
None | |||||
| Other Public Company Board Memberships in Last Five Years (duration of service and stock exchange listing(s) indicated in parentheses) | ||||||||
| 20,286 | 15,120 | $1,859,169 | None | |||||
| Achievement of
Stock Ownership Guidelines (at least 3X annual retainer for Board service, or $270,000) |
Relevant Skills, Experience, and Other Considerations | |||||||
|
20.7X |
Senior leadership; general retail; franchised organization; real estate; and, brand marketing expertise. | |||||||

| (1) | As at March 12, 2013. Please refer to pages 74 and 75, which provide ownership details as at March 25, 2013. DSU holdings for directors as at March 25, 2013 reflect DERs earned on such DSUs on March 19, 2013. |
| (2) | Based upon the closing price of our common shares on the TSX on March 12, 2013 of $52.51. |
9
Table of Contents
|
David H. Lees Independent Age: 68 Residence: Caledon, Ontario, Canada Director Since: February 2006 |
Dr. David H. Lees is the President and Chief Executive Officer of Cardinal Health in Canada, a major medical product manufacturer, distributor, and service provider, and the parent company of Source Medical Corporation and Cardinal Health’s other Canadian operations. From 1999 to 2006, Dr. Lees served as President and Chief Executive Officer of Source Medical. Dr. Lees was President, Chief Executive Officer and a director of Canada | |||||||
| Board and Committee Attendance | Tim Hortons Inc. Board Committee Membership | |||||||
| Board
Meetings Attended |
Committee Meetings Attended |
Audit Committee Nominating and Corporate Governance Committee (NCGC) | ||||||
| 6 of 6 | 100% | Audit: 4 of 4 | 100% | |||||
| NCGC: 4 of 4 | 100% | |||||||
| Number of Tim Hortons
Securities Beneficially Owned, Controlled or Directed(1) |
Current Public Company Board
Memberships (stock exchange listing(s) indicated in parentheses) | |||||||
| DSUs | Common Shares |
Value of Securities Held(2) |
None | |||||
| Other Public Company Board Memberships in Last Five Years (duration of service and stock exchange listing(s) indicated in parentheses) | ||||||||
| 20,122 | 6,650 | $1,405,798 | None | |||||
| Achievement of Stock Ownership Guidelines (at least 3X annual retainer for Board service, or $270,000) |
Relevant Skills, Experience, and Other Considerations | |||||||
|
15.6X |
Senior leadership; manufacturing; distribution, warehouse, and logistics; public company board; and, financial expertise. | |||||||

| (1) | As at March 12, 2013. Please refer to pages 74 and 75, which provide ownership details as at March 25, 2013. DSU holdings for directors as at March 25, 2013 reflect DERs earned on such DSUs on March 19, 2013. |
| (2) | Based upon the closing price of our common shares on the TSX on March 12, 2013 of $52.51. |
10
Table of Contents
|
Ronald W. Osborne(1) Independent Audit Committee Financial Expert Age: 66 Residence: Toronto, Ontario, Canada Director Since: November 2008 |
Ronald W. Osborne has been the Chairman of the Board of Directors of Postmedia Network Canada Corp. and its subsidiary Postmedia Network Inc. (collectively, “Postmedia”) since July 2010. Postmedia is a publishing company, the assets of which were formerly owned by Canwest Global Communications Corporation. Until May 2012, Mr. Osborne served as a director of Sun Life Financial Inc. (“Sun Life”) an international financial services organization, and Sun Life Assurance Company of Canada, serving as Sun Life’s Chairman from 2005 to November 2011. Mr. Osborne served as the President and Chief Executive Officer and a director of Ontario Power Generation Inc., an Ontario-based electricity generation company, from 1998 until December 2003. From 1996 to 1998, Mr. Osborne was a senior executive within the BCE Group of Companies, Canada’s largest communications conglomerate. From 1981 to 1994, Mr. Osborne held various positions at Maclean Hunter, including the position of Chief Executive Officer from 1986 until 1994. Mr. Osborne was a partner of Clarkson Gordon, Chartered Accountants, in Toronto from 1979 until 1981. Mr. Osborne is currently a trustee of RioCan Real Estate Investment Trust. Mr. Osborne also serves as a director of Holcim (Canada) Inc. (formerly St. Lawrence Cement Group Inc.). He was also a director of Brookfield Renewable Power Inc. until November 2010. Mr. Osborne graduated from Cambridge University in England with a Bachelor of Arts degree. In 1972, he became a member of the Institute of Chartered Accountants of Ontario and a Fellow of the Institute in 1988. | |||||||
| Board and Committee Attendance | Tim Hortons Inc. Board Committee Membership | |||||||
| Board
Meetings Attended |
Committee Meetings Attended |
Audit Committee | ||||||
| 6 of 6 | 100% | Audit: 4 of 4 | 100% | |||||
| Number of
Tim Hortons Securities Beneficially Owned, Controlled or Directed(2) |
Current Public Company Board Memberships (stock exchange listing(s) indicated in parentheses) | |||||||
| RioCan Real Estate Investment Trust (TSX) Postmedia Network Canada Corp. (TSX) | ||||||||
| DSUs | Common Shares |
Value of Securities Held(3) |
Other Public Company Board Memberships in Last Five Years (duration of service and stock exchange listing(s) indicated in parentheses) | |||||
| 10,574 | 3,000 | $712,771 | Sun Life Financial Inc. (1999-2012) (TSX; NYSE; Philippines) Brookfield Renewable Power Inc. (public debt) (2009-2010) Torstar Corporation (2003-2009) (TSX) | |||||
| Achievement of Stock Ownership Guidelines (at least 3X annual retainer for Board service, or $270,000) |
Relevant Skills, Experience,
and Other Considerations | |||||||
|
7.9X |
Senior leadership; financial; new business development/M&A; public company board; human resource and compensation; and, governance/legal expertise. | |||||||

| (1) | Mr. Osborne was a director of Air Canada when it filed for protection under the Companies’ Creditors Arrangement Act (“CCAA”) in April 2003. Air Canada successfully emerged from the CCAA proceedings and was restructured pursuant to a plan of arrangement in September 2004. Mr. Osborne is no longer a director of Air Canada. Mr. Osborne was also a director of Nortel Networks Corporation and Nortel Networks Limited (collectively, “Nortel”) when, on April 10, 2006, the Ontario Securities Commission (“OSC”) issued a management cease trade order prohibiting all directors, officers, and certain other current and former employees of Nortel from trading in securities of Nortel until two business days following receipt by the OSC of all filings required to be made by Nortel pursuant to Ontario securities laws. This order resulted from Nortel’s need to restate certain previously reported financial results and related delays in filing certain of its 2005 financial results. This order was revoked effective June 8, 2006. Mr. Osborne served on the Nortel board from June 29, 2005 to June 29, 2006. |
| (2) | As at March 12, 2013. Please refer to pages 74 and 75, which provide ownership details as at March 25, 2013. DSU holdings for directors as at March 25, 2013 reflect DERs earned on such DSUs on March 19, 2013. |
| (3) | Based upon the closing price of our common shares on the TSX on March 12, 2013 of $52.51. |
11
Table of Contents
|
Wayne C. Sales Independent Age: 63 Residence: Jupiter, Florida, United States Director Since: April 2006 |
Wayne C. Sales served as the Chairman of the Board of
Directors of SUPERVALU INC. (“SUPERVALU”), a grocery retailer and distributor, from June 2010 until March 2013. Mr. Sales has been a director of SUPERVALU since 2006. From July 2012 until February 2013, he served as President and Chief Executive Officer of SUPERVALU. Previously, he served as President and Chief Executive Officer, and then as Vice-Chairman, of Canadian Tire Corporation Limited, a Toronto Stock Exchange-listed retail, financial services, and petroleum company. He served as Vice-Chairman of Canadian Tire until June 2007 following his tenure as President and Chief Executive Officer, a position that he held from 2000 to 2006. Prior to 2000, Mr. Sales held positions as Executive Vice President and Senior Vice President, Marketing at Canadian Tire Retail, a subsidiary of Canadian Tire. Mr. Sales is a graduate of Harvard Business School’s Advanced Management Program. | |||||||
| Board and Committee Attendance | Tim Hortons Inc. Board Committee Membership | |||||||
| Board Meetings
Attended |
Committee Meetings Attended |
Human Resource and Compensation Committee (Chair) (HRCC) Nominating and Corporate Governance Committee (NCGC) | ||||||
| 6 of 6 | 100% | HRCC: 5 of 5 | 100% | |||||
| NCGC: 4 of 4 | 100% | |||||||
| Number of Tim Hortons
Securities Beneficially Owned, Controlled or Directed(1) |
Current Public Company Board
Memberships (stock exchange listing(s) indicated in parentheses) | |||||||
|
DSUs |
Common |
Value of |
SUPERVALU INC. (NYSE) | |||||
| Other Public Company
Board Memberships in Last Five Years in parentheses) | ||||||||
| 20,240 | 12,030 | $1,694,498 | Discovery Air Inc. (2008-2012) (TSX) Georgia Gulf Corporation (2007-2012) (NYSE) | |||||
| Achievement of
Stock Ownership Guidelines (at least 3X annual retainer for Board service, or $270,000) |
Relevant Skills, Experience, and Other Considerations | |||||||
|
18.8X |
General retail; senior leadership; franchised organization; brand marketing; human resource and compensation; and, new business development/M&A expertise. | |||||||

| (1) | As at March 12, 2013. Please refer to pages 74 and 75, which provide ownership details as at March 25, 2013. DSU holdings for directors as at March 25, 2013 reflect DERs earned on such DSUs on March 19, 2013. |
| (2) | Based upon the closing price of our common shares on the TSX on March 12, 2013 of $52.51. |
Section 16(a) Beneficial Ownership Reporting Compliance
Section 16(a) of the Exchange Act does not apply because we are a foreign private issuer under U.S. securities laws. Our officers and directors are required to file reports of equity ownership and changes of ownership with the Canadian Securities Administrators and do not file such reports under the Exchange Act.
Code of Ethics (Standards of Business Practices)
The Company has adopted a Code of Ethics, which we have designated as our Standards of Business Practices, that applies to all of our officers and employees, including our principal executive officer, principal financial officer, principal accounting officer or controller, or persons performing similar functions. The Standards of Business Practices is available on the Company’s investor website at www.timhortons-invest.com.
Audit Committee
The current members of the Audit Committee are Mr. Endres (Chair), Ms. Greene and Messrs. Lees and Osborne, each of whom is independent under our Independence Requirements (as defined below under Item 13 – “Director Independence”), which incorporate the listing standards of the New York Stock Exchange (“NYSE”) and the rules of the Canadian Securities Administrators. The Board of Directors has determined that all current Audit Committee members are financially literate and that Messrs. Endres and Osborne are “audit committee financial experts,” as such term is defined by applicable U.S. securities laws. The Audit Committee met four times during 2012. Executive sessions comprised only of the independent directors who were members of the Audit Committee were held at each of those meetings.
12
Table of Contents
| Item 11. | Executive Compensation |
As a foreign private issuer in the United States, we are deemed to comply with this Item if we provide information required by Items 6.B and 6.E.2 of Form 20-F, with more detailed information provided if otherwise made publicly available or required to be disclosed in Canada. We have provided information required by Items 6.B and 6.E.2 of Form 20-F in our management proxy circular related to the Meeting (the “proxy circular”) and have filed it through the Canadian System for Electronic Document Analysis and Retrieval (“SEDAR”), the Canadian equivalent of the SEC’s Next-Generation EDGAR system, at www.sedar.com. In addition, our proxy circular has been furnished to the SEC on Form 8-K. As a foreign private issuer in the U.S., we are not required to disclose executive compensation according to the requirements of Regulation S-K that apply to U.S. domestic issuers, and we are otherwise not required to adhere to the U.S. requirements relative to certain other proxy disclosures and requirements. Our executive compensation disclosure complies with Canadian requirements, which are, in most respects, substantially similar to the U.S. rules. We generally attempt to comply with the spirit of the U.S. proxy rules when possible and to the extent that they do not conflict, in whole or in part, with required Canadian corporate or securities requirements or disclosure.
All dollar amounts included in this Item 11 are in Canadian dollars, unless otherwise expressly stated to be in U.S. dollars.
Human Resource and Compensation Committee
The current members of the Human Resource and Compensation Committee (“HRCC”) are Mr. Sales (Chair), Mses. Atkins and Greene, and Messrs. Iacobucci and Lederer, each of whom is independent under our Independence Requirements. Additionally, each director satisfies the requirements of “non-employee directors” under Rule 16b-3 of the Exchange Act and of “outside directors” under Section 162(m) of the Internal Revenue Code, as required by our Independence Requirements. The HRCC met five times during 2012. As required by the HRCC’s charter, executive sessions comprised only of the independent directors who were members of the HRCC were held at each of those 2012 meetings.
The HRCC oversees and administers executive compensation programs for our executive officers (designated as such by the Board) and for any other officers that report directly to the CEO, and determines all elements of their compensation, other than for our Executive Chairman, President and CEO, for whom compensation amounts are determined by the Board upon recommendation from the HRCC. This is consistent with the HRCC’s accountability for review and approval, in advance, of any employment, change in control, or severance arrangements extended to any executive officers or officers that report directly to the CEO. The HRCC’s recommendations regarding the Executive Chairman, President and CEO compensation are made, as required by the HRCC’s charter, in executive session.
The CEO provides input to the HRCC regarding the performance and compensation for the executive officers. The “Compensation Discussion and Analysis” in this Form 10-K/A includes a description of the role that other members of our senior management play in determining executive compensation and a description of the services provided by the HRCC’s independent compensation consultant, currently Mercer (Canada) Limited. The HRCC is also responsible for the annual HRCC Report to be included in our proxy circular and for making recommendations to the Board for the implementation of incentive compensation or bonus plans, equity-based plans, and other benefits, policies, and practices for our executive officers.
In order to carry out the responsibilities set forth above, the HRCC:
| • | along with the Board, reviews and approves the annual financial and business goals and objectives established by the CEO; |
| • | evaluates the performance of executive officers in light of the above goals and objectives; |
| • | establishes performance objectives, including the weight attributed to each measure, corresponding target performance levels, and payout curves under our annual cash incentive and long-term equity compensation plans; |
| • | makes award (i.e., type of award or vehicle) and grant determinations under equity compensation plans, subject to the Board’s approval of grant amounts for the Executive Chairman, President and CEO; and, |
| • | monitors governance and best practice initiatives and trends in executive compensation. |
The HRCC also considers and reports at least annually to the Board on Board compensation matters, and periodically reviews the terms of, and monitors compliance on an annual basis with, our stock ownership guidelines for directors and officers. The HRCC may delegate its responsibilities to subcommittees if it determines such delegation would be in the best interest of our corporation. The HRCC did not delegate any such duties in 2012. A more detailed narrative of the HRCC’s processes and procedures for the consideration and determination of executive and director compensation is set forth below under “Compensation Discussion and Analysis”.
Succession Planning. The Board’s most fundamental oversight responsibility is the selection, appointment, and continued evaluation of the corporation’s CEO. The Board is supported in this endeavor by a comprehensive succession planning process and related management development programs. Such process and programs are overseen by the HRCC on an annual basis.
13
Table of Contents
On an annual basis the HRCC reviews the succession plans for each of the executive officer positions. The focus for the executive team discussion with the HRCC is the identification of short- and long-term successors to the CEO role, and of development plans for the executive team members as well as for their successors. Where no immediate successors are identified for executive officer roles, management and the HRCC consider whether external candidates would be appropriate to fill any such positions.
Through this process, the Board is able to gain a thorough understanding of the potential for internal candidates to succeed the CEO role. Due to the active ongoing CEO search, which included an assessment and review of internal candidates as well as external candidates, as well as the implementation of a revised organizational structure during 2012 (and continuing into 2013), the regular annual succession planning activity was not undertaken in 2012. A CEO profile that describes the characteristics desired in the next CEO to address current and future needs of the corporation relating to strategy, operations, growth, opportunities, and other considerations, has been developed as a guide in the CEO search to evaluate potential candidates.
In addition to executive officer succession, the corporation completes a review of succession plans for all officer-level, director-level, and management-level roles on a biennial basis. Succession profiles for employees at these levels are created and contain information regarding employment and education history, prior year performance, current development plans, succession potential, and, where applicable, readiness to assume a role at the next level of management. As part of the successor planning process, a thorough calibration within and across teams is conducted for each level of management.
Leadership development has been a particular focus of the corporation for several years at all officer levels within the corporation. Development plans for officers may include formal skill-development or leadership-development programs, coaching and mentoring, stretch assignments, or cross-functional project work, to prepare internal candidates for further advancement within the corporation. This focus supports the Board’s commitment to solid succession management and development of the corporation’s high-potential talent.
Restructuring. In August 2012, we announced the implementation of an organizational structure which includes a corporate centre and business unit design. We began the process of implementing this new organizational structure by realigning roles and responsibilities under that new structure in fiscal 2012, and we expect the realignment of roles and responsibilities to be substantially completed by the end of the first quarter of 2013. We believe that the new structure will facilitate the execution of strategic initiatives as we continue to grow our business, and streamline decision-making across the corporation.
Compensation Committee—Interlocks and Insider Participation. There were no reportable interlocks or insider participation affecting the HRCC during 2012. That is, none of the current members of the HRCC are or have been officers or employees of our corporation or any of its subsidiaries; and, none of our executive officers served on the board of directors or compensation committee of another company or organization of which one of whose executive officers served on our corporation’s Board or HRCC.
Compensation Committee Pre-Approval Policy. Our Compensation Committee Pre-Approval Policy governs the review and approval, in advance of engagement, for independent compensation consultant services and fees, generally similar to the manner of operation of the policy governing the Audit Committee’s pre-approval of services and fees of the corporation’s independent auditor. The policy requires that, prior to the commencement of the succeeding year, the HRCC’s independent consultant develop and provide to the HRCC a project plan setting forth the known or anticipated services to be performed over the succeeding year, together with an estimate of the fees (expected budget) associated with such services. In addition, under the policy, the HRCC approves the specific terms of the independent consultant’s engagement annually.
14
Table of Contents
Human Resource and Compensation Committee Report
The Human Resource and Compensation Committee has reviewed and discussed the Compensation Discussion and Analysis contained in this Form 10-K/A with management of our corporation and, based on such review and discussion, the Human Resource and Compensation Committee recommended to the Board of Directors that the information set forth under “Compensation Discussion and Analysis” below be included in our proxy circular and in this Form 10-K/A to be filed on or about March 26, 2013, which will amend our corporation’s Form 10-K for the fiscal year ended December 30, 2012, filed with the SEC on February 21, 2013.
Respectfully submitted,
Human Resource and Compensation Committee
Wayne C. Sales, Chair
M. Shan Atkins
Moya M. Greene
The Hon. Frank Iacobucci
John A. Lederer
15
Table of Contents
COMPENSATION DISCUSSION AND ANALYSIS
Executive Summary
This Compensation Discussion and Analysis (“CD&A”) describes and explains our executive compensation philosophy, principles, and programs for the named executive officers (“NEOs”) who include: the Executive Chairman, President and Chief Executive Officer (“CEO”); the Chief Financial Officer (“CFO”); and the three next most highly compensated members of our executive management team.
Our NEOs for 2012 were as follows:
| • | Paul D. House, Executive Chairman, President and CEO |
| • | Cynthia J. Devine, CFO |
| • | David F. Clanachan, Chief Operating Officer (“COO”) |
| • | William A. Moir, Chief Brand and Marketing Officer (“CMO”) |
| • | Roland M. Walton, President, Tim Hortons Canada |
Approach to Executive Compensation
Our executive compensation program is designed to:
| • | align the interests of our shareholders with our executive officers by tying short- and long-term incentive compensation payouts to the achievement of corporate performance (“pay-for-performance”) as well as share price appreciation; |
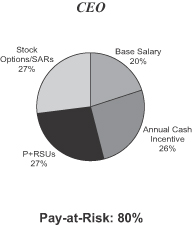
| • | provide over 70% of total compensation in the form of performance-based pay (i.e., “pay-at-risk”) with payouts linked to the achievement of financial objectives that are aligned with our strategic plan; |
| • | attract and retain high-performing executive officers necessary to drive the continued achievement of strong results and sustainable shareholder value; and |
| • | balance appropriate levels of risk and reward in relation to our overall business strategies, and to not encourage our executive officers to take unnecessary or excessive risks. |
The Human Resource and Compensation Committee (“HRCC”) regularly monitors market and executive compensation trends, and in accordance with current best practices and the Tim Hortons culture, our compensation programs have the following characteristics:
| • | base salaries for our executive officers are generally targeted at the 25th percentile of our selected comparator group and total compensation is generally compared to the 75th percentile; |
| • | we require our CEO to hold equity valued at five (5) times base salary, and, for our other NEOs, three (3) times base salary; |
| • | all performance-based pay includes “clawback” or recoupment provisions that allow us to recover compensation paid on the basis of certain errors or misconduct; |
| • | our change in control entitlements are “double trigger” (i.e., change in control and termination of employment must occur before any benefits are paid); |
| • | we have an anti-hedging provision prohibiting our executive officers from participating in speculative activity related to the corporation’s equity; and |
| • | beginning in 2013, our shareholders will have a “say-on-pay”, providing shareholders with an opportunity to cast an annual, non-binding, advisory vote on the corporation’s approach to executive compensation. |
16
Table of Contents
2012 NEO Compensation—Highlights
In 2012, compensation for our NEOs was impacted by the following:
| • | Results of a comprehensive study conducted in 2010 that involved a comparative assessment of compensation for our executive officers against certain Canadian and U.S. peer companies. |
| • | In May 2011, Mr. House, who was then the Executive Chairman, was appointed by the Board to replace the former President and CEO, Mr. Donald B. Schroeder, until a new President and CEO was appointed. In August 2011, the Board determined that for so long as Mr. House is serving as President and CEO, his compensation should be substantially similar to that of his predecessor. Mr. House continues to serve as our President and CEO. |
| • | In August 2012, we announced a new organizational structure to position the corporation for future growth that consists of a strong corporate centre and Canadian, U.S. and International business units. We expect the corporate reorganization will facilitate the execution of strategic initiatives as we continue to grow our business and streamline decision-making across the corporation. As part of this reorganization and our continued search for a permanent President and CEO, the following changes were implemented in 2012: |
| • | The Board appointed Mr. Clanachan as the COO of the corporation and Mr. Walton as President, Tim Hortons Canada. In addition, Ms. Devine, in her role as CFO, was given additional accountability for our supply chain operations. Compensation for each of Mr. Clanachan and Ms. Devine was increased at that time to reflect their additional accountabilities and responsibilities. |
| • | The corporation entered into an employment agreement with Mr. Moir extending through August 31, 2014. Pursuant to the agreement, Mr. Moir will continue to serve as CMO until a successor has been appointed, but not past August 31, 2014. |
| • | With a view to providing stability throughout the CEO transition period, the corporation entered into retention agreements with each of the NEOs, excluding Mr. House. In order to qualify for a retention payment, each participant must remain continuously employed by the corporation, through and including the date that is nine months following the date that an individual commences permanent employment as President and CEO. |
Summary of 2012 Performance and Compensation Payouts
The corporation achieved same-store sales growth in both the Canadian and U.S. markets, despite a challenging economic climate that led to constrained discretionary consumer spending and intensified competition, and achieved other substantial, qualitative objectives including: enhancing our brand identity positioning efforts in the U.S.; the launch of new product offerings; entering the single-serve, on-demand North American coffee market; continuing to increase our capacity-building efforts; and continuing international expansion in the Gulf Cooperation Council.
Performance remained strong against our key financial performance metrics, however we fell just short of targeted performance against our Operating Income or Earnings Before Interest and Taxes (“EBIT”) and Net Income performance objectives, after certain adjustments described below were made. The following compares our performance in 2012 against our key financial objectives and resulting short-term annual cash incentive (Executive Annual Performance Plan or “EAPP”) and performance-conditioned restricted stock units (“P+RSU”) awards:
| 2012 Performance Objective at Target |
Adjusted
Actual Results |
Performance Against Target |
EAPP Payout | P+RSU Payout | ||||||||||
| EBIT |
$614.6 million | $ | 606.1 million | 98.6% | 93.8% | 93.1% | ||||||||
| Net Income |
$419.8 million | $ | 416.2 million | 99.2% | ||||||||||
17
Table of Contents
See “Appendix A” for a reconciliation of Adjusted Operating Income (EBIT) for Compensation Determinations and Adjusted Net Income for Compensation Determinations, which are non-GAAP financial measures.
The HRCC determined that the impact of expenses related to the corporate reorganization and other charges described under “Appendix A” should be eliminated for the purpose of determining performance-based compensation for the NEOs. For additional detail regarding the impact of 2012 performance and these adjustments on executive compensation, see “2012 Compensation Program Details and Impact of 2012 Performance” below.
2013 NEO Compensation—Highlights
The setting of 2013 target compensation for our NEOs was determined based on the following:
| • | In 2012, the HRCC, with the assistance of independent compensation consultant Mercer (Canada) Limited (“Mercer”), undertook a comprehensive review (the “2012 study”) of our executive compensation programs, including performance metrics and other plan design features. In addition, NEO positions were benchmarked against market data of Canadian and U.S. companies, with a view to continue benchmarking the corporation’s compensation market position. |
| • | In February 2013, the HRCC determined to make no further changes to NEO compensation beyond the adjustments already made in connection with the reorganization described above due to challenging macroeconomic and operating conditions in early 2013. NEO compensation may be reviewed and potentially adjusted based on the results of the 2012 study in the second half of 2013. |
| • | In February 2013, the HRCC also determined that the first of the stepped changes to the corporation’s incentive compensation plans in connection with the reorganization should be made. The HRCC approved modifications to the short-term incentive program such that performance objectives are aligned with our new corporate centre/business unit structure. As such, the performance objectives for executive officers under the EAPP: (i) will include a component for business unit performance based on our executive officers’ respective roles in the organization, and (ii) EBIT will be the sole corporate performance factor (rather than EBIT and Net Income, as used previously). For further details, see “NEO Compensation Determinations for 2013” below. EBIT will continue to be the 2013 performance objective for long-term equity incentive compensation. |
18
Table of Contents
Compensation Philosophy
The HRCC has adopted a compensation philosophy that reflects the Tim Hortons culture and the most significant goals for our executive compensation programs. Our compensation philosophy also includes the HRCC’s approach to, and analysis of, risks associated with our executive compensation programs. Presented in the table below are the fundamental objectives of our compensation philosophy and achievement against those objectives:
| Objective | Purpose | Achievement | ||
| Alignment to Shareholders | Align the interests of our shareholders and executive officers by implementing compensation programs that tie a substantial majority of total executive compensation to business performance (“pay-for-performance”) without encouraging excessive risk-taking. | • Over 70% of our NEOs’ compensation is performance-based and not guaranteed.
• Our share ownership guidelines require the CEO to accumulate and hold shares equal to five times base salary, and the other NEOs equal to three times base salary.
• In 2012, the corporation’s performance was solid but we fell short of achieving our target financial performance objectives of EBIT and Net Income. As a result, despite achievement of certain annual qualitative objectives, NEOs received 93.8% of their respective target short-term incentive payment, and 93.1% of their respective target P+RSU award. This downward impact on compensation reflects alignment between the interests of our shareholders and our executive officers.
| ||
| Attracting and Retaining Key Talent |
Attract and retain high-performing executive officers to drive the continued achievement of strong results and sustainable shareholder value. |
• Although the corporation is in the process of seeking a successor to Mr. House as President and CEO, the tenure of our current NEOs continues to provide a high degree of stability within the executive team, with a combined total of over 90 years of service with the corporation. As the Board continues its search for a new President and CEO, the HRCC deemed it advisable to enter into retention agreements with each of the NEOs and an employment agreement with Mr. Moir. See “Retention Agreements” and “Employment Agreement with CMO” for details.
• All NEOs have held different positions and been promoted to increasing levels of responsibility over their respective tenures.
• Based on the limited number of changes over an extended period of time, the HRCC has concluded that our executive compensation programs have been an effective component of our talent retention efforts for our NEOs.
| ||
19
Table of Contents
General Compensation Principles and Guidelines
The HRCC uses the following principles to guide its executive compensation decisions:
| • | Base Salaries Targeted at 25th Percentile: base salaries, intended to provide a stable source of income for our executives, are generally targeted at the 25th percentile of our selected comparator group, consistent with our “pay-for-performance” philosophy. |
| • | Total Compensation Targeted at 75th Percentile: our executive officer compensation is compared to the 75th percentile of total compensation of our selected comparator group, based on our historical strong performance and growth. |
| • | Pay-at-Risk: approximately 70% of total compensation for our NEOs, with a higher proportion for the CEO, will be “pay-at-risk” in the form of performance-based compensation (annual short-term cash incentives and long-term equity incentives) and, therefore, actual compensation may vary from the target based on performance. |
| • | Short-Term Cash Incentives: short-term cash incentive awards are a significant element of executive compensation, and are subject to the achievement of established performance objectives. |
| • | Long-Term Equity Incentives: long-term equity incentive compensation constitutes a significant component of executive compensation, with CEO compensation more heavily weighted towards long-term equity incentive compensation than the other NEOs; the type of long-term equity awards granted also reflects our “pay-for-performance” philosophy (see “2012 Compensation Program Components”). |
| • | Monitor Compensation Trends: the HRCC monitors market and executive compensation trends and makes appropriate changes to our executive compensation plans and policies accordingly. |
Compensation Review Process
HRCC—Relevant Experience and Committee Responsibilities
The HRCC is currently comprised of five directors—Wayne C. Sales, M. Shan Atkins, Moya M. Greene, the Hon. Frank Iacobucci and John A. Lederer—each of whom is independent and has direct and relevant experience in executive compensation, as well as the skills and expertise that enable him or her to make decisions regarding the suitability of the corporation’s compensation policies and practices. Mr. Sales is a director of SUPERVALU and has also acted as President and Chief Executive Officer from July 2012 until February 2013. Previously, he served as President and Chief Executive Officer, and then Vice-Chairman, of Canadian Tire Corporation Limited. Ms. Atkins is the chair of the compensation committee of The Pep Boys—Manny, Moe and Jack. Ms. Greene has financial expertise with respect to executive compensation and is also a member of the corporation’s Audit Committee. In addition, in her capacity as Chief Executive Officer at the Royal Mail, Ms. Greene is responsible for making recommendations regarding the design and implementation of executive compensation programs. The Hon. Mr. Iacobucci is the former chair of the salary and organization committee of Torstar Corporation. Mr. Lederer has had extensive senior management experience, including as chief executive officer of large public and private companies, gaining extensive insight in executive compensation in such roles. See Item 10—“Directors, Executive Officers and Corporate Governance” of this Form 10-K/A for more detailed biographical information concerning members of the HRCC.
The HRCC is responsible for determining and making recommendations to the Board regarding executive compensation. Among other duties, the HRCC: oversees and administers the compensation programs for our executive officers, including the NEOs; determines all elements of the compensation of the NEOs, other than the Executive Chairman, President and CEO, for whom it provides compensation recommendations to the Board; makes recommendations to the Board regarding the implementation of short-term incentive plans, long-term equity-based plans, and other benefits, policies and practices applicable to executive officers; and determines the appropriate comparator group(s) for benchmarking. All of the members of the Board are independent except for Mr. House, who is not involved in discussions on or review of his own compensation.
20
Table of Contents
To meet these responsibilities, the HRCC:
| • | reviews annual financial and other business goals and objectives established by the CEO and evaluates the performance of the NEOs and other executive officers against these goals and objectives; |
| • | considers input from executive officers and other members of senior management and, from time to time at its discretion, independent advisors; |
| • | establishes performance objectives and payout curves for the short-term incentive and long-term equity compensation plans; |
| • | makes award and grant determinations under equity compensation plans; and |
| • | monitors governance, best practices, and trends in executive compensation. |
See “Human Resource and Compensation Committee” in this Form 10-K/A for additional information regarding the HRCC’s responsibilities.
The following is an overview of the process by which the HRCC receives relevant information and makes compensation determinations.
Executive Officers and Senior Management
Typically, the CEO provides insight and input to the HRCC on all significant compensation determinations that affect the NEOs, other executive officers, and the corporation at large. The CEO also shares his views on succession planning for the CEO role (and CEO direct-report roles). The CEO’s input is critical in reviewing NEO compensation due to the CEO’s direct day-to-day involvement with the executive officers, as a result of which he is in the best position to assess their respective performance. The CEO’s assessment includes an annual review of whether such officers may be short- or long-term successors to the CEO role and whether successors are available for direct-report roles to the respective executive officers. See “Human Resource and Compensation Committee” in this Form 10-K/A for additional details regarding the corporation’s succession planning process and programs.
The Executive Vice-President, Human Resources and other members of senior management also provide input on compensation levels and mix, compensation policies, programs, and administration as well as supporting analysis (e.g., tally sheets and other tools) utilized in setting compensation.
Independent Compensation Consultant
The HRCC has the discretion to retain independent consultants, at the corporation’s expense. Since August 2011, the HRCC has engaged Mercer as its independent compensation consultant. In this role, Mercer provided the following services:
| • | market data, benchmarking, and analysis; |
| • | independent evaluation of proposals, data, and analysis prepared by our senior management; and, |
| • | commentary on executive compensation principles, trends, and best practices. |
In the course of performing its services, Mercer received instructions from, and consulted on a regular basis with, the HRCC Chair and senior management, including members of our Human Resources department. While the HRCC takes the information and advice provided by its independent compensation consultant into consideration, the HRCC is ultimately responsible for its own decisions and recommendations to the Board.
None of our directors or NEOs has any affiliation or relationship with Mercer.
21
Table of Contents
The HRCC considered various factors in considering Mercer’s independence, including, but not limited to: the amount of fees received by Mercer from the corporation as a percentage of Mercer’s total revenue; Mercer’s policies and procedures that are designed to prevent conflicts of interest; and the existence of any business or personal relationship that could impact Mercer’s independence. Mercer has also determined that it was independent from management and confirmed this in a written statement delivered to the HRCC Chair. In light of the foregoing policies and established practices, the HRCC considers Mercer to be fully independent of management of the corporation.
The HRCC has a pre-approval policy identifying the procedures for approving all services performed by Mercer in advance, as well as the corresponding fees for such services, with the objective of confirming that such services would not impair Mercer’s independence. With respect to the fees for other services provided to the corporation by Mercer, in evaluating any impact on Mercer’s independence, the HRCC considered that the executive compensation consulting group of Mercer that provided services to the HRCC is not influenced by, nor has any of its compensation tied to, the performance of the other business groups within Mercer that provided services to the corporation. The total fees for other services provided are an insignificant part of the total revenues earned by Mercer.
The following table sets forth for 2012 and 2011, respectively: (i) the aggregate fees, billed by Mercer for services related to determining compensation for any of the corporation’s directors and executive officers, and (ii) the aggregate fees billed for all other services provided by Mercer, or any of its affiliates:
| 2012 | 2011 | |||||||
| HRCC Consulting Fees |
$ | 190,775 | $ | 55,818 | (2) | |||
| Fees for All Other Services Provided to the Corporation(1) |
$ | 435,172 | $ | 431,099 | ||||
|
|
|
|
|
|||||
| Total |
$ | 625,947 | $ | 486,917 | ||||
| (1) | All Other Services included compensation surveys unrelated to executive compensation, and pension, benefits, and other consulting services, as well as fees paid to Marsh, an affiliate of Mercer, as the corporation’s insurance broker. |
| (2) | Reflects partial year only as appointment was effective August 2011. |
Benchmarking and Comparator Group Considerations
The HRCC uses benchmarking data as one of many tools to confirm whether our executive compensation is consistent with our compensation philosophy. In particular, the HRCC assesses whether base salary levels generally align with the 25th percentile, and total target compensation aligns with the 75th percentile, of our comparator group.
The HRCC considers the comparison of our executive compensation programs and respective pay levels to those of other similarly situated peer companies as an important factor in setting compensation for our executive officers for both general pay and performance-based pay levels. The HRCC’s current intent is to conduct a comprehensive compensation benchmarking study for our executive officers every two or three years.
To assist in setting compensation for our executive officers, a comprehensive compensation study was undertaken in 2010 (the “2010 study”) on our behalf by the HRCC’s previous independent consultant, Meridian Compensation Partners Inc., formerly Hewitt Associates (“Hewitt”). The list of comparator companies included in the 2010 study was reviewed by the HRCC and management against a list of selection criteria so that the pool represented the most appropriate and relevant comparators based on factors such as size, operating scope, geographical reach, and various other financial considerations. Additionally, the HRCC attempted to include companies in the food and beverage, retail, and consumer product industries, to reflect the types of companies with which the corporation competes for talent. Due to our size (i.e., revenues and headcount) relative to other food and beverage companies in Canada, there is a lack of directly comparable Canadian companies in our industry. As such, the final comparator group for the 2010 study also included companies from a broader general industry group. In addition, although the comparator group noted below contains retail organizations that are subsidiaries of U.S. or global companies, they were not generally included in comparing our NEOs’ compensation due to differences in external accountabilities and strategic responsibilities. They were, however, included in making compensation determinations for our broader executive population.
22
Table of Contents
Listed below is the Canadian comparator group used for the 2010 study. The Canadian comparator group was the primary market reference used by the HRCC in making compensation determinations for our NEOs for 2011 and 2012.
| Canadian Comparator Group | ||||
| Boston Pizza International Canada Bread Company Ltd. Canadian National Railway Company Canadian Tire Corporation Canfor Corporation Cara Operations Ltd. Cineplex Entertainment LP Finning International Inc. General Mills Canada Ltd. Home Depot Canada Inc. |
Hudson’s Bay Company Loblaw Companies Limited Lowe’s Companies Canada, ULC Maple Leaf Foods Inc. McDonalds Restaurants of Canada Ltd. Molson Coors (Canada) Ltd. PepsiCo Foods Canada Priszm Brands Income Fund Quebecor Inc. Reitmans (Canada) Limited |
Rogers Communications Corp. Rogers Cable and Wireless Inc. RONA Inc. Sears Canada Inc. Shoppers Drug Mart Corp. Starbucks Coffee Canada TELUS Corporation Wal-Mart Canada Corp. Winners Merchants International LP |
In addition to the Canadian market data for the 2010 study, the HRCC also reviewed compensation data for a “blended North American comparator group” that was created by averaging the results of the Canadian comparator group and the U.S. comparator group set forth below. The blended North American data provided a secondary point of reference, primarily for operational roles, in light of our expanding U.S. presence and the growing need to recruit for senior executive talent on a North American basis. The U.S. data included more public companies from the food and beverage industry due to the more significant number of large quick service restaurant companies in the U.S. as compared to Canada.
| U.S. Comparator Group | ||||
| Abercrombie & Fitch Co. Ann Taylor, Inc. AutoZone, Inc. The Bon-Ton Stores, Inc. Brinker International, Inc. Burger King Corp. Campbell Soup Company Chipotle Mexican Grill, Inc. Chiquita Brands International, Inc. Darden Restaurants, Inc. Del Monte Foods Company |
Denny’s Corporation Dole Food Company, Inc. Dunkin’ Brands, Inc. Eddie Bauer LLC General Mills, Inc. H.J. Heinz Company The Hershey Company Hormel Foods Company Kellogg Company Krispy Kreme Doughnuts, Inc. McCormick & Company, Inc. |
McDonald’s Corporation Molson Coors Brewing Company Nestle USA OfficeMax Incorporated Panera Bread Papa John’s International Ross Stores, Inc. Sara Lee Corporation Starbucks Coffee Company Williams-Sonoma, Inc. Yum Brands, Inc. |
References to comparator groups in this Form 10-K/A mean the relevant companies in the 2010 Canadian and 2010 U.S. Comparator Groups. In addition, the HRCC reviews data of other peer companies, from time to time, as part of its analysis.
In 2012, the HRCC, with the assistance of Mercer, undertook a comprehensive review of our short- and long-term incentive programs, including performance metrics and other plan design features. In addition, compensation for NEO positions were benchmarked against market data from a new comparator group of American and Canadian companies, with a view to benchmarking the corporation’s compensation market position and compensation mix. This data was not utilized for making 2013 compensation determinations because no changes have been made thereto as of the date of this Form 10-K/A, as described below under “NEO Compensation Determinations for 2013”. However, NEO compensation may be reviewed and potentially adjusted based on the results of the 2012 study in the second half of 2013.
23
Table of Contents
Tools and Additional Factors Considered
In addition to benchmarking, the HRCC considers the following additional tools and factors, on an annual basis, when making compensation decisions.
| Performance of Business Goals and Objectives | •
•
• |
An internal review of our performance compared to our financial targets under the short- and long-term incentive programs, as well as compared to other financial and non-financial business goals and objectives established by the corporation.
An external review of our performance against a set of standard financial performance measures, such as revenues, same-store sales, operating income, and others, as compared to external quick service restaurants in North America.
The individual contributions of the NEOs in supporting our annual goals and objectives and, collectively, the contributions of the executive management team members in supporting those goals and objectives.
| ||
| Tally Sheets | •
•
• |
Tally sheets for each NEO setting out each element of target compensation for the upcoming year, as well as targeted and actual compensation received for the previous five years. Also included is the value of current and previous equity awards, the value of all retirement benefits, perquisites, and change in control benefits.
The tally sheets enable the HRCC to review all elements of NEO compensation independently to confirm alignment with our compensation philosophy and related guidelines.
The HRCC also uses the tally sheets in connection with compensation determinations for the upcoming year, and in connection with change in control agreements, special awards of RSUs and changes in retirement benefits.
| ||
| Internal Pay Equity Analysis | •
•
|
An internal equity review illustrating the difference in compensation between the CEO and other NEOs as a group for each of base salary, short-term incentive targets, and long-term incentive compensation is used by the HRCC to confirm that the differential is appropriate.
An internal pay equity analysis of CEO compensation against the next highest paid officers at certain of our quick service restaurant competitors is also reviewed for benchmarking purposes. | ||
24
Table of Contents
2012 Compensation Program Components
Base salary, short-term incentives, long-term equity-based incentives and retirement benefits are the most significant elements of our executive compensation program and, on an aggregate basis, they are intended to substantially satisfy our program’s overall objectives.
| Component | Purpose | Performance Period |
Vesting Period | Pay-at-Risk Profile* | ||||
| Base Salary | Provide a stable source of annual income | N/A | N/A | None | ||||
|
Short-term (Annual) Cash Incentive (EAPP) |
Provide incentive payments for achieving annual performance objectives | 1 Year | N/A | Moderate | ||||
|
Performance- Conditioned Restricted Stock Units (P+RSUs) |
Reward achievement of annual performaznce objectives and provide incentives to create value for the corporation over the long-term, as well as provide a meaningful retention incentive | 1 Year (prior to grant) |
Cliff vest (30 months after grant) |
Moderate/ High | ||||
| Stock Options/ Stock Appreciation Rights (Options/ SARs) |
Reward for increases in our long-term stock performance (direct alignment with shareholders), and provide a meaningful retention incentive | Up to 7 years | One-third vesting annually | High | ||||
|
Retirement Benefits (DCPP and Savings Plan) |
Provide a competitive level of retirement savings and reward continued service | N/A |
• DCPP contributions
• Savings
Plan |
Low |
| * | Determined based on consideration of the plan design features of each compensation plan or program. |
The charts below show the relative mix of the targeted executive compensation components for 2012, which highlights our “pay-for-performance” compensation approach whereby a substantial portion of executive compensation is pay-at-risk. For a discussion of actual executive compensation delivered for 2012 and the portion of pay-at-risk, see below under “2012 Compensation Program Details and Impact of 2012 Performance”.
|
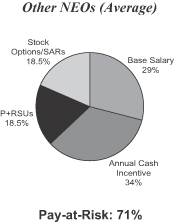
|
Note: As described below, due to the interim nature of Mr. House’s service as CEO and his concurrent service as a director, he received a RSU award instead of a stock option/SAR award for 2012.
25
Table of Contents
NEO Compensation Determinations for 2012
Approach to NEO Compensation
Prior to 2011, our NEO (excluding the CEO) compensation philosophy and design provided that each NEO would receive substantially the same level of each element of total compensation. This approach was based on our belief that, regardless of the functional area of expertise, the role of each NEO was equally critical to our strategic management and decision-making.
While a team-based approach and behavior is still considered key to our success, beginning in 2011, NEO positions were individually benchmarked and the corporation began a gradual transition toward setting compensation based on each individual role. Each NEO role now has its own market comparators for base salary and short- and long-term incentive amounts. This approach to setting NEO target compensation is consistent with the results of the 2010 study, and with other roles within the corporation that are benchmarked to individual roles in the relevant market. Each NEO’s individual compensation is now compared to external market data for that respective role. The HRCC also considers, among other things, role accountability, experience, and performance of the individual. Going forward, we believe this is the appropriate manner by which to set compensation levels.
Before determining target compensation for 2012 for all of the NEOs, the HRCC considered the prior year performance of the respective NEOs, the corporation’s strong financial performance in 2011, the achievement of our other business goals and objectives, analysis derived from the tally sheets and internal pay equity review, increases in base salaries made to other employees of the corporation generally, the results of the 2010 study, and goals and objectives presented for 2012. The HRCC also considered the changes made to the long-term incentive targets for the NEOs in 2011, the planned review of market data in 2012, and the desire that a potential new CEO have input on the compensation of his or her direct reports. The HRCC determined that targeting 2012 total target compensation for the NEOs at approximately the 75th percentile of the Canadian comparator group was supported by our historical strong performance and growth over several years. In addition, in February 2012, the HRCC believed that establishing an EBIT performance objective for the short-term and long-term incentive programs representing significant growth for 2012 would require strong performance from all of our executives to meet the objective. Executive compensation discussed below represents amounts established in February 2012 based on 2011 performance, and, for two of our NEOs, amounts established in August 2012 in consideration for their increased responsibilities.
CEO
Following the departure of the former President and CEO, Mr. Donald B. Schroeder, in May 2011, Mr. House, the corporation’s Executive Chairman, was appointed as President and CEO until a successor is appointed, and remains in that position as of the date of this Form 10-K/A. It remains the view of the HRCC and the Board that for so long as Mr. House is serving as President and CEO, his compensation should be substantially similar to that of his predecessor except that, due to the expected short-term nature of Mr. House’s tenure as President and CEO, coupled with the fact that prior to his appointment his compensation was structured to be more aligned with non-employee director compensation, the Board concluded that long-term compensation in the form of stock options with tandem SARs would not be appropriate. Mr. House had been awarded RSUs for the long-term incentive equity award prior to his appointment and the HRCC determined it would be appropriate to continue that practice for the reasons described above.
26
Table of Contents
| Paul D. House, Executive Chairman, President and CEO | ||||||||||||||||||||

|
Paul D. House joined the corporation as Vice President of Marketing in 1985 and occupied various senior management positions leading to his appointment in January 1993 as Chief Operating Officer. He then became President and Chief Operating Officer in 1995, and Chief Executive Officer in November 2005. Mr. House was named Chairman of the Board in February 2007. He was a director on the Wendy’s® Board from 1998 through February 2007. Mr. House is a member of the Board of Directors of the Tim Horton Children’s Foundation and serves on the Board of Trustees of Brock University, as well as the Advisory Board for Brock University Business School. Mr. House joined Dairy Queen® Canada in 1972 and held various management positions with that company, including Vice-President of Canadian Operations, responsible for the business in Canada. Mr. House holds a B.A. in Economics from McMaster University. On March 1, 2008, Mr. House became Executive Chairman of the corporation’s Board of Directors. Effective as of May 24, 2011, Mr. House was appointed to serve as the President and CEO of the corporation. | |||||||||||||||||||
| 2012 Compensation Determinations: | ||||||||||||||||||||
| In February 2012, in recognition of Mr. House’s effective leadership, the strengthening of the corporation’s competitive position, the creation of a strong foundation for future growth opportunities, and his demonstration of an extremely high level of commitment to employees, restaurant owners, and the communities in which we operate, the Board approved the following compensation for Mr. House in 2012: base salary of $772,500; performance-based, short-term incentive award under the EAPP of $1,000,000 at “target” performance for the portion of the year served as President and CEO; and, long-term incentive award granted in May 2012, in an aggregate amount of $2,050,000 under the corporation’s 2012 Plan, consisting of: (i) $1,050,000 delivered through P+RSUs, adjusted by the 2011 performance factor of 105%, which cliff vest 30 months after the date of grant; and (ii) $1,000,000 delivered as time-vested RSUs, vesting over a 30-month period in three equal installments. It was also determined that Mr. House would be eligible for a cash payment in lieu of a corporate contribution to the Executive Retirement Savings Plan for the portion of the year he served as President and CEO.
| ||||||||||||||||||||
| From an internal pay equity perspective, Mr. House’s 2012 target compensation was approximately 2.6 times that of the other NEOs (on average), which continued to be in line with internal pay equity multiples for external comparable companies. | ||||||||||||||||||||
| Target Compensation: | ||||||||||||||||||||
| Cash Compensation | Equity Compensation | |||||||||||||||||||
| Year |
Salary | Annual Incentive |
P+RSU Grant Value |
Stock Option/ SAR Grant Value |
Total Direct Compensation |
% of Compensation “At Risk” | ||||||||||||||
| 2012 |
$ | 772,500 | $ | 1,000,000 | $ | 1,000,000 | $1,000,000 | $3,772,500 | 80% | |||||||||||
|
2011(1) |
$ | 750,000 | $ | 1,000,000 | $ | 1,000,000 | $1,000,000 | $3,750,000 | 80% | |||||||||||
|
(1) For the portion of the year served as President and CEO. | ||||||||||||||||||||
In 2011, the HRCC determined that Mr. House would be eligible for a long-term equity incentive award in an aggregate amount of $2.0 million at target, prorated for the portion of the year Mr. House served as President and CEO in 2011, consisting of: (i) $1.0 million at target delivered through P+RSUs to be granted in 2012 after the end of the 2011 performance period; and (ii) $1.0 million delivered as time-vested RSUs, reduced in value by the May 2011 RSU award of $200,000 previously granted to Mr. House, also to be granted in 2012. On February 23, 2012, consistent with the Board’s historical practice of making compensation decisions annually in February, and in recognition of the fact that, since May 2011, Mr. House assumed immediate accountability for the success of the corporation as its President and CEO and exhibited strong performance in that role, the Board approved a change to Mr. House’s 2011 compensation, such that the 2011 long-term equity incentive compensation described above ($2.0 million at target) would not be
27
Table of Contents
prorated. This means that Mr. House received the full (not prorated) long-term incentive award for the 2011 plan year, less the value of the $200,000 RSU award previously granted to him in his capacity as Executive Chairman. These equity awards were made on February 28, 2012 for 2011 performance and compensation.
The HRCC felt it was appropriate to revisit the original determinations made in August 2011 to recognize that Mr. House has served as President and CEO longer than originally anticipated and, during this period, both his individual performance and corporate performance have been strong. The HRCC also considered that the date of Mr. House’s appointment on May 24, 2011 occurred just one week after the regular annual grant date of May 17, 2011. If Mr. House had been appointed as President and CEO prior to the grant date in 2011, the February 2012 awards would likely have been made on the appointment date (or regular annual grant date) and treated similarly to the awards made to the other NEOs in May 2011 (i.e., one-half reported as 2010 performance-based compensation and one-half reported as 2011 compensation). This treatment is consistent with the forward-looking nature of our long-term incentive awards (i.e., P+RSUs) and the HRCC’s historical administrative practice that grant amounts reflect the amount of equity compensation established for the executive immediately prior to the grant date. As a result of the foregoing determination, a P+RSU award of $1,050,000, which will cliff vest 30 months after the date of grant, and a RSU award of $800,000 vesting over a 30-month period in three equal installments, were made to Mr. House in February 2012.
Executive Chairman
Upon his appointment as President and CEO in May 2011, Mr. House ceased receiving compensation in his capacity as Executive Chairman, and he received compensation as President and CEO, as noted above. Mr. House does not receive any additional compensation as Executive Chairman or as director while he is serving as President and CEO.
Other NEOs
As noted above, in previous years, the HRCC believed that a team approach to compensation for the NEOs was appropriate. However, in order to better attract and retain high performing executive officers by aligning executive pay with market data for each individual role, commencing in 2011 the HRCC reviewed the total target compensation for each NEO, as compared to companies in the relevant comparator groups reviewed as part of the 2010 study, as well as considered the individual’s role, experience, and performance in order to determine the appropriate compensation for each NEO. As a result, starting in 2011 and continuing in 2012, the corporation began a gradual transition away from team-based compensation.
Target compensation for the NEOs set in February 2012 originally remained the same in 2012 as was in place for 2011, with the exception of increases to base salaries of 3%, which was consistent with the average base salary increases implemented for salaried employees of the corporation. In August 2012, the compensation for Ms. Devine and Mr. Clanachan, respectively, was adjusted given the additional responsibilities added to their roles.
28
Table of Contents
The following tables provide biographical information for our NEOs, further information regarding 2012 compensation determinations, and a three-year summary of target compensation.
| Cynthia J. Devine, Chief Financial Officer | ||||||||||||||
|
|
Cynthia J. Devine joined the corporation in 2003 as Senior Vice President of Finance and Chief Financial Officer, responsible for overseeing accounting, financial reporting, investor relations, financial planning and analysis, treasury, internal audit, tax and information systems for the corporation. She was promoted to Executive Vice President of Finance and Chief Financial Officer in April 2005. As of May 1, 2008, Ms. Devine was appointed as Chief Financial Officer and assumed additional accountability for the corporation’s manufacturing operations and vertical integration strategy. These manufacturing operations include Fruition, Fruits and Fills, a fondant and fills facility, and the Maidstone Coffee coffee manufacturing operations in Ancaster, Ontario and Rochester, New York. As of August 2012, Ms. Devine also assumed accountability for the corporation’s supply chain. Prior to joining the corporation, Ms. Devine served as Senior Vice President, Finance for Maple Leaf Foods®, a large Canadian food processing company, and from 1999 to 2001, held the position of Chief Financial Officer for Pepsi-Cola® Canada. Ms. Devine, a Canadian Chartered Accountant, holds an Honours Business Administration degree from the Richard Ivey School of Business at the University of Western Ontario. Ms. Devine was a member of the Board of Directors of ING Direct® Canada until December 2012 and became a member of the Board of Directors of Empire Company Limited in early 2013. In August 2011, Ms. Devine was elected as a Fellow of the Canadian Institute of Chartered Accountants for contributions to the Chartered Accountant profession. | |||||||||||||
| 2012 Compensation Determinations: | ||||||||||||||
| The specific changes to the 2012 target compensation of Ms. Devine, which reflected her market position primarily against the Canadian comparator group due to the nature of her role, were as follows: in February 2012, her 2012 annual base salary was set at $412,000 (representing an increase of $12,000), and, in August 2012, to reflect the additional responsibilities she undertook as part of the reorganization, her base salary was increased to $450,000 (representing an increase of $38,000); annual short-term incentive award opportunity under the EAPP of $500,000 at target (the same as 2011); and, long-term incentive award opportunity under the 2012 Plan of $600,000 at target (the same as 2011). Under this new arrangement, the total 2012 targeted compensation for Ms. Devine was $1,550,000, of which approximately 71% was “at risk”. | ||||||||||||||

| Target Compensation: | ||||||||||||||||||||
| Cash Compensation | Equity Compensation | |||||||||||||||||||
| Year |
Salary | Annual Incentive |
P+RSU Grant Value |
Stock Option/ SAR Grant Value |
Total Direct Compensation |
% of Compensation “At Risk” | ||||||||||||||
| 2012 |
$ | 450,000 | (1) | $500,000 | $ | 300,000 | $300,000 | $1,550,000 | 71% | |||||||||||
| 2011 |
$ | 400,000 | $500,000 | $ | 300,000 | $300,000 | $1,500,000 | 73% | ||||||||||||
| 2010 |
$ | 383,500 | $500,000 | $ | 206,541 | $206,541 | $1,296,582 | 70% | ||||||||||||
|
(1) Effective as of August 2012. Prior to that date, base salary was $412,000 effective March 2012. | ||||||||||||||||||||
29
Table of Contents
| David F. Clanachan, Chief Operating Officer | ||||||||||||

|
David F. Clanachan joined the corporation in 1992 and held various positions in the Operations Department until he was promoted to the position of Vice President, Operations—Western Ontario in 1997. Prior to that time, he was a Director of Operations for an international food company, with approximately 12 years of experience in the industry. In August 2001, he was promoted to the position of Executive Vice President of Training, Operations Standards and Research & Development and to Chief Operations Officer, United States and International, in May 2008. As of August 8, 2012, Mr. Clanachan was appointed as Chief Operating Officer and has executive accountability for all of the corporation’s operating businesses, including Canada, the United States and International. Mr. Clanachan holds a Bachelor of Commerce degree from the University of Windsor. Mr. Clanachan serves on the School of Hospitality and Tourism, Management Policy Advisory Board for the University of Guelph and as a director of the Canadian Hospitality Foundation. | |||||||||||
| 2012 Compensation Determinations: | ||||||||||||
| Mr. Clanachan’s 2012 target compensation, which reflected his market position against the blended North American comparator group to include companies that most closely matched the role of Chief Operations Officer, U.S. and International, was originally established in February 2012 as follows: annual base salary of $412,000 (representing an increase of $12,000); annual short-term incentive award opportunity under the EAPP of $500,000 at target (the same as 2011); and, long-term incentive award opportunity under the 2012 Plan of $500,000 at target (the same as 2011). However, upon the appointment to the position of Chief Operating Officer in August 2012, to reflect his additional responsibilities, Mr. Clanachan’s target compensation was adjusted as follows: annual base salary of $450,000 (representing an increase of $38,000); annual short-term incentive award opportunity under the EAPP of $500,000 (the same as 2011) and, long-term incentive award opportunity under the 2012 Plan of $600,000 at target (representing an increase of $100,000). As a result of the appointment, Mr. Clanachan also received a long-term incentive award of $100,000 in August 2012. Under this new arrangement, the total 2012 targeted compensation for Mr. Clanachan was $1,550,000, of which approximately 71% was “at risk”. | ||||||||||||
| Target Compensation: | ||||||||||||||||||
| Cash Compensation | Equity Compensation | |||||||||||||||||
| Year |
Salary | Annual Incentive |
P+RSU Grant Value |
Stock Option/ SAR Grant Value |
Total Direct Compensation |
% of Compensation “At Risk” | ||||||||||||
| 2012 |
$ | 450,000 | (1) | $500,000 | $ | 300,000 | (2) | $300,000(2) | $1,550,000 | 71% | ||||||||
| 2011 |
$ | 400,000 | $500,000 | $ | 250,000 | $250,000 | $1,400,000 | 71% | ||||||||||
| 2010 |
$ | 383,500 | $500,000 | $ | 206,541 | $206,541 | $1,296,582 | 70% | ||||||||||
|
(1) Effective as of August 2012. Prior to that date, base salary was $412,000 effective March 2012. (2) Effective as of August 2012. | ||||||||||||||||||
30
Table of Contents
| William A. Moir, Chief Brand and Marketing Officer | ||||||||||||||
|
|
William A. Moir joined the corporation in 1990 as Vice President of Marketing, and was promoted to Executive Vice President of Marketing in 1997. As of May 1, 2008, Mr. Moir was appointed as Chief Brand and Marketing Officer, and as the President of the Tim Horton Children’s Foundation and assumed responsibility for research and development, aligning product research and innovation programs with the corporation’s brand and marketing activities. Prior to joining the corporation, Mr. Moir gained extensive marketing management experience, holding key positions with K-Tel®, Shell Oil® and Labatt Breweries®. He is a director and past Chairman of the Coffee Association of Canada, a director of The Trillium Health Centre Foundation, a director of the Baycrest Foundation, as well as the President of, and a member of the Board of Directors of, the Tim Horton Children’s Foundation. Mr. Moir holds an Honours Business degree from the University of Manitoba. | |||||||||||||
| 2012 Compensation Determinations: | ||||||||||||||
| Mr. Moir’s 2012 target compensation was set as follows: annual base salary of $412,000 (representing an increase of $12,000); annual short-term incentive opportunity under the EAPP of $500,000 (the same as 2011); and, long-term incentive award opportunity under the 2012 Plan of $500,000 at target (the same as 2011). Under this arrangement, the total 2012 targeted compensation for Mr. Moir was $1,412,000, of which approximately 71% was “at risk”. In August 2012, the corporation entered into an employment agreement with Mr. Moir extending through August 31, 2014. See “Employment Agreement with CMO” for more details. | ||||||||||||||

| Target Compensation: | ||||||||||||||||||||
| Cash Compensation | Equity Compensation | |||||||||||||||||||
| Year |
Salary | Annual Incentive |
P+RSU Grant Value |
Stock Option/ SAR Grant Value |
Total Direct Compensation |
% of Compensation “At Risk” | ||||||||||||||
| 2012 |
$ | 412,000 | $500,000 | $ | 250,000 | $250,000 | $1,412,000 | 71% | ||||||||||||
| 2011 |
$ | 400,000 | $500,000 | $ | 250,000 | $250,000 | $1,400,000 | 71% | ||||||||||||
| 2010 |
$ | 383,500 | $500,000 | $ | 206,541 | $206,541 | $1,296,582 | 70% | ||||||||||||
| Roland M. Walton, President, Tim Hortons Canada | ||||||||||||||
|
|
Roland M. Walton joined the Company in 1997 as Executive Vice President of Operations, responsible for operations in both Canada and the U.S. and was appointed as Chief Operations Officer, Canada, in May 2008. As of August 8, 2012, Mr. Walton was appointed as President, Tim Hortons Canada. Mr. Walton directly oversees operations, restaurant development, and growth strategy for the Canadian segment and also assumed responsibility for operations standards and training for the Tim Hortons brand. His restaurant industry experience includes Wendy’s Canada, Pizza Hut® Canada and Pizza Hut USA. In 1995, Mr. Walton held the position of Division Vice President for Pizza Hut USA’s Central Division. Mr. Walton holds a Bachelor of Commerce degree from the University of Guelph. | |||||||||||||
| 2012 Compensation Determinations: | ||||||||||||||
| Mr. Walton’s 2012 target compensation, which reflected the market position against the blended North American comparator group to include companies that most closely match the role of Chief Operations Officer, Canada, was as follows: annual base salary of $412,000 (representing an increase of $12,000); annual short-term incentive award opportunity under the EAPP of $500,000 at target (the same as 2011); and, long-term incentive award opportunity under the 2012 Plan of $500,000 at target (the same as 2011). Mr. Walton’s target compensation remained unchanged when he assumed the role of President, Tim Hortons Canada in August 2012. Under this arrangement, the total 2012 targeted compensation for Mr. Walton was $1,412,000, of which approximately 71% was “at risk”. | ||||||||||||||

31
Table of Contents
| Target Compensation: | ||||||||||||||||||||
| Cash Compensation | Equity Compensation | |||||||||||||||||||
| Year |
Salary | Annual Incentive |
P+RSU Grant Value |
Stock Option/ SAR Grant Value |
Total Direct Compensation |
% of Compensation “At Risk” | ||||||||||||||
| 2012 |
$ | 412,000 | $500,000 | $ | 250,000 | $250,000 | $1,412,000 | 71% | ||||||||||||
| 2011 |
$ | 400,000 | $500,000 | $ | 250,000 | $250,000 | $1,400,000 | 71% | ||||||||||||
| 2010 |
$ | 383,500 | $500,000 | $ | 206,541 | $206,541 | $1,296,582 | 70% | ||||||||||||
Performance-based or variable pay delivered through our EAPP and P+RSU programs constitutes the substantial majority of compensation for our NEOs. The determination of actual EAPP payouts and P+RSU awards is made by comparing actual EBIT and Net Income performance (as may be adjusted) against payout curves that have a range of established payouts from minimum to maximum levels, as set forth below in “2012 Compensation Program Details and Impact of 2012 Performance”. We also consider options/SARs awarded to our executives to be “at risk” depending on performance in that our stock price must increase for these awards to have value.
2012 Compensation Program Details and Impact of 2012 Performance
Base Salaries
As noted above under “General Compensation Principles and Guidelines”, our executive compensation philosophy provides, as a guideline, that base salaries for the corporation’s executive officers will be set at approximately the 25th percentile of the applicable comparator group. As noted above, in February 2012, base salaries for the NEOs were increased by 3%, similar to the increases in base salaries made to other employees of the corporation generally. In addition, each individual’s role, experience, and performance were taken into consideration when establishing base salaries for 2012. Setting base salaries at the 25th percentile is consistent with our philosophy of weighting compensation heavily towards performance-based awards, such that the level of total compensation is based on the corporation’s performance, while also providing our executives with a stable source of annual income. See the section above for details on the 2012 base salaries for each of our NEOs.
Short-Term Incentives (or Annual Cash Bonus)—the Executive Annual Performance Plan
Our short-term (annual) incentive compensation program for executive officers is known as the Executive Annual Performance Plan (“EAPP”). Awards under the EAPP are “at risk” because the corporation must achieve annual financial performance objectives established by the HRCC in order for the executive officers to receive any payments under the EAPP. The HRCC believes that the annual cash incentive award should constitute a substantial portion of executive compensation to support our “pay-for-performance” philosophy and because our business tends to work on shorter performance cycles, thus making annual incentive awards effective at matching compensation to our performance. Additionally, given the relatively low level of our executive base salaries, we believe that strong short-term cash incentive compensation assists us to retain, motivate, and attract talented executives.
The two performance objectives established under the EAPP in 2012 were operating income, or EBIT, as to 75% of the award, and Net Income, as to 25% of the award. The HRCC believed that EBIT best reflects the financial health and performance of our business and also is a key performance measure used by other quick service restaurant companies, which allows for general comparability of performance. The HRCC also believed that Net Income was an appropriate measure as it reflected overall earnings performance and requires management to be responsible for, and manage every line item on, our Consolidated Statement of Operations. Additionally, in making its decision regarding the appropriate performance objectives, the HRCC also considered the following factors relative to EBIT and Net Income:
| • | each executive officer believes that he or she can meaningfully contribute to the achievement of these performance objectives; |
32
Table of Contents
| • | maintaining the consistency of the objectives over a number of years allows for more accurate measurement and comparison of, and reward for, the desired performance from year-to-year; |
| • | EBIT is used in our incentive plans for other employees, and thus, the interests of our entire organization are aligned to achieve the same goals; and, |
| • | they are not overly complex metrics and are easily understood, providing for clear “line-of-sight”. |
Each year, the HRCC establishes a payout curve with “target”, “threshold”, and “maximum” amounts, and incremental amounts between the “threshold” and “maximum” amounts, for the EBIT and Net Income performance objectives. Payouts range along the curve depending upon the corporation’s financial performance against the targets, with payouts corresponding to incremental performance above or below target performance. The payout curve is a linear (formulaic) scale, which matches corporate performance with the final payout, subject to the following threshold/minimum and maximum payouts. The EBIT payout curve that applied to the short-term incentive program also applied to the long-term P+RSU program.
The following table sets forth the 2012 performance objectives, actual EBIT and Net Income performance (as adjusted) and resulting EAPP payout:
| Performance Objectives | Actual Performance(2) | |||||||||
| ($ millions) % of Target |
Below Threshold (< 90%) |
Threshold / Minimum (90%)(1) |
Target (100%) |
Maximum (110%) |
||||||
| EBIT (75% weighting) |
< $553.1 | $553.1 | $614.6 | $676.1 | $606.1 (98.6%) | |||||
| Net Income (25% weighting) |
< $377.8 | $377.8 | $419.8 | $461.8 | $416.2 (99.2%) | |||||
| Resulting EAPP Payout |
No payout | 50% of target | 100% of target | 150% of target | 93.8% of target | |||||
| (1) | The HRCC may set the threshold/minimum performance objective at the lesser of 90% of current year target and actual prior year (as may be adjusted) EBIT and Net Income, recognizing that performance should be rewarded during difficult years, such that if prevailing macroeconomic and business conditions affected achievement of targeted performance objectives disproportionately, but the corporation nonetheless achieved or exceeded prior-year actual results, then payouts should be made. |
| (2) | The EBIT and Net Income amounts set forth under Actual Performance are adjusted non-GAAP measures. The HRCC may make adjustments to actual EBIT/Net Income results for comparison to performance against the established performance objectives under the EAPP program, as it may determine in its discretion, either prior to or after the end of the performance period. Unless the HRCC was to determine otherwise, the adjustments applied to the EBIT results under the EAPP also apply to the EBIT results under the P+RSU program. See “Appendix A” for Reconciliation of Adjusted Operating Income (EBIT) for Compensation Determinations and Adjusted Net Income for Compensation Determinations, which are non-GAAP financial measures. |
The following table sets forth target and actual payouts under the EAPP made to the NEOs for 2012 performance:
| Target EAPP | Performance Curve Payout Percentage |
Actual Payout | |||||||||||||
| Paul D. House |
$1,000,000 | 93.8% | $938,000 | ||||||||||||
| Cynthia J. Devine |
$ 500,000 | 93.8% | $469,000 | ||||||||||||
| David F. Clanachan |
$ 500,000 | 93.8% | $469,000 | ||||||||||||
| William A. Moir |
$ 500,000 | 93.8% | $469,000 | ||||||||||||
| Roland M. Walton |
$ 500,000 | 93.8% | $469,000 | ||||||||||||
Achievement of EBIT Performance Objective. As described herein, EBIT performance is the primary driver of performance-based compensation under the EAPP and P+RSU programs. For the five years prior to 2012, we generally
33
Table of Contents
met the target amounts for EBIT performance, as may have been adjusted in accordance with the terms of the EAPP, but we did not achieve the maximum objectives. In 2012, we fell just short of the target objective. Between 2008 and 2012, inclusive, our EBIT performance ranged from 95.9% to 101.3% of target.
Achievement of Net Income Performance Objective. Net Income was the secondary driver of performance-based compensation under the EAPP program for 2012. For the five years prior to 2012, we generally met the target amounts for Net Income performance, as may have been adjusted in accordance with the terms of the EAPP, but we did not achieve the maximum objectives. In 2012, we fell just short of the target objective. Between 2008 and 2012, inclusive, our Net Income performance ranged from 99.2% to 101.2% of target.
The HRCC believes that the EAPP effectively continues to deliver short-term incentive compensation in a manner consistent with our compensation philosophy. See below under “NEO Compensation—Alignment to Corporate Performance (Pay-for-Performance Linkage)”.
The HRCC may make adjustments to awards in the event actual performance goals are not met. If warranted, the HRCC may increase or reduce the size of the payout and also has the discretion not to award a payout. The HRCC considers the use of discretion to be a factor that mitigates the risk of unintended consequences of executive compensation determinations made earlier in the performance year.
The HRCC reviews the corporation’s performance objectives annually and, in early 2013, following the HRCC’s comprehensive review of its short-term plan design, supported by Mercer, determined that for the 2013 year, the performance objectives used to measure the short-term incentive amounts paid to NEOs will be changed. See “NEO Compensation Determinations for 2013” for additional details.
Long-Term Incentives
Consistent with our compensation philosophy, equity-based incentive compensation granted under our LTI Plans (described in more detail below) constitutes the largest part of the CEO’s total compensation and a significant portion of the total compensation for our executive officers. Our equity incentive awards are generally intended to accomplish the following main objectives:
| • | align our financial and share price performance with the level of compensation realized by executive officers; |
| • | foster the long-term retention of executive officers; |
| • | assist in building share ownership of executive officers to increase alignment with long-term shareholder interests; |
| • | focus on the execution of longer-term strategic plans which form part of our annual financial and non-financial goals and objectives; |
| • | attract and motivate key employees; |
| • | reward participants for performance in relation to the creation of shareholder value; and |
| • | deliver competitive levels of compensation, consistent with our compensation philosophy. |
Currently, our equity incentive compensation consists of P+RSUs and stock options with tandem SARs. The P+RSUs and options/SARs each represent 50% of the total value of the target equity incentive awards. The HRCC believes that this balanced use of two vehicles strengthens the link between pay and performance and, therefore, is more consistent with our compensation philosophy and more effectively aligns our executives’ interests with those of our shareholders than reliance on just one type of equity award. This is also aligned with market practice on the average mix of long-term incentive compensation at TSX60 companies. The HRCC believes that the use of these types of awards supports our executive retention objective by providing both mid-term (P+RSUs) and long-term (options/SARs) incentives.
34
Table of Contents
Both the P+RSUs and options/SARs grants are based on specific dollar values. The actual number of P+RSUs granted is determined by dividing the dollar value of the award by the closing price of our common shares on the TSX on the trading day immediately preceding the grant date. The number of options/SARs to be granted is determined by dividing the dollar value of the award by the option value calculated using the Black-Scholes valuation methodology. The HRCC believes that a value-based approach to equity incentive grants is more appropriate than a fixed-number grant because the initial dollar value of the P+RSUs and options/SARs is fixed on the date of grant and, therefore, the number of P+RSUs or options/SARs awarded is equal to the amount of compensation the HRCC had determined to award on the grant date. Previous grants of P+RSUs and options/SARs are not taken into account when awarding new grants. For additional detail, see Notes (2) and (3) of the “Summary Compensation Table” under “Executive and Director Compensation”.
P+RSUs
The annual level of P+RSUs awarded is dependent upon the achievement of performance targets in the fiscal year prior to the year of grant. Upon the performance conditions being met, P+RSUs are awarded as standard, time-vested restricted stock units which vest in 30 months (i.e., “cliff” vest) and have dividend equivalent rights (“DERs”). No DERs accrue during the performance period for P+RSUs. DERs begin to accrue only after the performance condition is satisfied and P+RSUs are granted.
In February of each year, the HRCC sets the performance objectives for the P+RSUs to be granted in the following year. Based on the same factors considered in establishing the performance measures for the EAPP, the HRCC considers operating income, or EBIT, as to 100% of the award, to be the most appropriate performance objective for the P+RSU grants. The level of P+RSUs granted is based on a one-year performance target, rather than multiple year targets, primarily because our relatively short business cycle makes a shorter performance period more effective in linking compensation to performance. Because the P+RSUs “cliff” vest, they also have a strong retention benefit. See below for a discussion of (i) the relevant payout curve for the P+RSU program, and (ii) the achievement of the EBIT performance objective for purposes of P+RSU awards. As part of its comprehensive review of the corporation’s short- and long-term incentive plan design, in 2013 the HRCC intends to consider whether new and/or additional performance objectives should be used for performance-based awards.
The HRCC’s established administrative practice is that P+RSU awards are backward-looking in terms of the corporation’s performance target, which is applied to the original grant amount determined at the time the performance target is set. However, P+RSUs are also forward-looking in that they have a 30-month “cliff” vesting schedule, which, absent certain exceptions, effectively requires a forward service period of 30 months prior to vesting and settlement. Based on these considerations, the actual grant reflects the amount of equity compensation established for the executive immediately prior to the grant date. This includes the impact of any adjustments to equity incentive compensation (upward or downward) that occurred after the end of the prior-year performance period.
The following table sets forth the 2012 performance objectives, actual EBIT performance (as adjusted) and resulting P+RSU award:
| Performance Objectives | Actual Performance(1) | |||||||||
| ($ millions) % of Target |
Below Threshold (< 90%) |
Threshold / Minimum (90%) |
Target (100%) |
Maximum (110%) |
||||||
| EBIT (100% weighting) |
< $553.1 | $553.1 | $614.6 | $676.1 | $606.1 (98.6%) | |||||
| Resulting P+RSU Award |
No payout | 50% of target | 100% of target | 150% of target | 93.1% of target | |||||
| (1) | See “Appendix A” for Reconciliation of Adjusted Operating Income (EBIT) for Compensation Determinations, which is a non-GAAP financial measure. |
35
Table of Contents
Based on the foregoing, the following table sets forth the actual P+RSU awards to be granted to the NEOs in May 2013, based on 2012 performance:
| Original Target | Performance Curve Payout Percentage |
Actual Award | |||||||||||||
| Paul D. House |
$1,000,000 | 93.1% | $931,000 | ||||||||||||
| Cynthia J. Devine |
$ 300,000 | 93.1% | $279,300 | ||||||||||||
| David F. Clanachan |
$ 300,000 | 93.1% | $279,300 | ||||||||||||
| William A. Moir |
$ 250,000 | 93.1% | $232,750 | ||||||||||||
| Roland M. Walton |
$ 250,000 | 93.1% | $232,750 | ||||||||||||
Options/SARs
Stock options with tandem SARs are designed to reward our executive officers for increases in our stock price over long periods of time. Issuing options with tandem SARs provides the option holder with the choice of receiving either our common shares (by exercising the option) or cash (by exercising the SAR), in each case with the value dependent upon the price of our common shares at the time of exercise. Upon the exercise of options, the related SARs are surrendered to the corporation and cancelled to the extent of the number of options exercised. Upon the exercise of SARs, the related options are surrendered to the corporation and cancelled to the extent of the number of SARs exercised. The options/SARs vest in equal proportions over three years and expire after seven years; however, the term is shortened upon death, disability, retirement, or termination. Additionally, because of their completely forward-looking nature, they provide longer-term incentives in years when our performance results in lower (or no) short-term cash incentive or P+RSU awards.
Options/SARs represent alignment with shareholder interests as they have no value if our share price does not increase (unlike RSUs and P+RSUs), but will increase (or decrease) in value directly in relation to increases (or decreases) in our share price during the exercise period.
All equity awards are made in accordance with our equity grant and settlement policy. Refer to the “Governance Policies and Related Items” for additional details regarding this policy.
Included in the table below are the value of the 2012 option/SAR awards made to the NEOs in May 2012. Option/SAR awards to be granted to the NEOs in May 2013 will be based on the equity incentive values for 2013 compensation established in February 2013 and will be as set forth in the table below.
| Actual Option/SAR Grants | ||||||||||
| NEO |
May 2012 Award | May 2013 Award | ||||||||
| Paul D. House(1) |
n/a | n/a | ||||||||
| Cynthia J. Devine |
$300,000 | $300,000 | ||||||||
| David F. Clanachan(2) |
$300,000 | $300,000 | ||||||||
| William A. Moir |
$250,000 | $250,000 | ||||||||
| Roland M. Walton |
$250,000 | $250,000 | ||||||||
| (1) | As noted above under “NEO Compensation Determinations for 2012”, Mr. House was awarded RSUs in lieu of stock options/SARs. In May 2012, Mr. House received an RSU award of $1,000,000, and in May 2013 he will receive an RSU award of $1,000,000. |
| (2) | Mr. Clanachan received an option/SAR award in May 2012 of $250,000. Upon his appointment as Chief Operating Officer in August 2012, he received an additional option/SAR award of $50,000, for a total award in 2012 of $300,000. |
36
Table of Contents
Retirement Benefits
Our retirement plans are designed to provide a competitive level of retirement savings to executive officers and to reward them for continued service with us. The retirement program for our executive officers consists of our defined contribution pension plan (the “DCPP”), which covers all full-time employees, and our Personal Supplemental Executive Retirement Savings Plan (the “Savings Plan”), which covers executive officers and certain other members of senior management.
Defined Contribution Pension Plan
All of our Canadian employees, including executive officers, are required to participate in our Canadian DCPP after they have completed 12 months of continuous service with us. Employees are required to contribute to the DCPP an amount equal to 2% of base salary, and we contribute an amount equal to 5% of base salary. Participants may also make voluntary additional contributions, which we will match up to a maximum of an additional 1% of base salary. All contributions made under the DCPP are subject to legislated maximum limits (for 2012, $23,820 per individual in the aggregate for both employer and employee contributions). Effective July 1, 2012, the Pension Benefits Act in Ontario was amended to provide immediate vesting of pension benefits, including both participant and employer contributions. Amounts may be withdrawn prior to retirement if the employee ceases to be employed by us and otherwise in accordance with Canadian laws and regulations governing the DCPP.
Personal Supplemental Executive Retirement Savings Plan
The purpose of the Savings Plan is to provide participants with additional compensation, which the participants will direct to be held and invested in accordance with the terms of the Savings Plan. Only individuals who are below 69 years of age are eligible to receive additional compensation under the Savings Plan. Participants who have more than three years of service with us are considered vested participants. Under the Savings Plan, vested participants must direct us to pay compensation received under the Savings Plan to: (i) a non-registered account, (ii) a Tax Free Savings Account (“TFSA”), or (iii) a Registered Retirement Savings Plan (“RRSP”). These accounts are administered by a third-party financial institution, and the amounts held in such accounts are invested in permitted investments at the direction of the respective participant. As a result, the design of the Savings Plan allows the participants to achieve certain tax efficiencies as well as control the investments of their funds. The corporation and participants will agree to pay to, or transfer amounts out of, the vested account upon the occurrence of specified events, including termination, disability or death of a participant, or in certain other circumstances.
After the completion of the plan year, the corporation will make contributions to the Savings Plan at a rate of 12% of earnings (base salary and annual incentive paid during the plan year), less DCPP contributions from the corporation. The contribution rate was selected based on data provided by pension specialists at Hewitt who, based on general industry design considerations, confirmed that 12% was a market competitive contribution rate for these types of programs. All annual payments made to participants under the Savings Plan will be subject to applicable tax withholdings, unless directed to an RRSP. Also, all income earned on permitted investments, other than in an RRSP or TFSA, will be taxable annually to the participant.
Until vesting occurs, the Savings Plan contributions will accrue in notional accounts for the respective executives. Vesting occurs once a participant has completed three years of service, or earlier if: a participant dies, becomes disabled, is terminated after the age of 65, a change in control occurs, or in certain other circumstances, including as otherwise determined by the HRCC. All of our NEOs are fully vested in the Savings Plan, having met the three-year service requirement.
Executive Benefits and Perquisites
We use limited amounts of executive benefits and perquisites to provide our NEOs with a competitive total compensation package that allows them to focus on their daily responsibilities and the achievement of the corporation’s objectives. The perquisites provided to executive officers consist of executive medical benefits, life and accidental death
37
Table of Contents
and dismemberment insurance premiums, and use of a company car program and personal use of our corporation’s airplane in limited circumstances (see below). The value of these benefits, except for the medical benefits, is included as taxable income to the executive. The HRCC does not believe that perquisites and other benefits should represent a significant portion of the compensation package of the executive officers. The amounts reported for perquisites represent the aggregate incremental cost of providing the benefit and not the value of the benefit to the recipient. See the “Summary Compensation Table” under “Executive and Director Compensation” for additional information regarding the perquisites we provide to our NEOs.
We have a policy limiting the personal use of our aircraft by executive officers and directors to the following circumstances: (i) the spouse or partner and other family members (as well as other officers and/or employees) may accompany an executive officer or director who is traveling on our aircraft for a business purpose, if space permits; and (ii) the executive officers, spouses or partners, and other family members, may use the aircraft in the event of medical emergencies or other extreme hardships.
NEO Compensation Determinations for 2013
Before determining target compensation for 2013 for all of the NEOs, the HRCC considered the corporation’s financial performance in 2012, the extent of achievement of our other business goals and objectives, analysis derived from the tally sheets and internal pay equity review, and the challenging macroeconomic and operating conditions in early 2013.
In February 2013, the Board determined that Mr. House should receive the same compensation in 2013 as in 2012. The HRCC, upon recommendation from the CEO, decided to maintain NEO compensation at the 2012 target levels. NEO compensation may be reviewed and potentially adjusted based on the results of the 2012 study in the second half of 2013.
Modifications to EAPP in 2013
In 2012, the HRCC, with the assistance of Mercer, undertook a comprehensive review of our executive compensation programs. A custom survey of short-term and long-term incentive (“STI” and “LTI”) plans, co-sponsored by Tim Hortons, was conducted and results included the general prevalence of various types of STI and LTI plans, their respective performance metrics, and total target compensation mix.
The HRCC also developed a set of guiding principles to support STI modifications for 2013 and beyond. These principles included: (i) supporting the corporation’s new organizational structure and reinforcing functional and individual accountability; (ii) introducing business unit measures; and, (iii) maintaining flexibility to consider the adoption of top-line financial metrics and more corporate and business unit level operational or strategic objectives (in addition to financial metrics) in future years.
Based on the results of the custom survey as well as the guiding principles noted above, in February 2013, the HRCC approved the following modifications to the 2013 EAPP for the NEOs:
| • | A shift to EBIT as the single measure for Tim Hortons Inc. (“THI”) financial performance, thus removing Net income as a measure from the EAPP. The HRCC determined that EBIT should be the sole metric for 2013 because each executive officer has the ability to contribute to the achievement of EBIT, while Net Income is within the control of only a small number of officers. EBIT performance is also the objective that determines incentive payments for our employees at-large and has been for a number of years. Over this time period, our financial performance has been strong, and the HRCC has therefore concluded that EBIT has been an effective performance objective. |
| • | The performance of Mr. Walton as President, Tim Hortons Canada will be partially measured by the financial performance of his business unit (i.e., 30% weighting on Business Unit performance and 70% weighting on THI performance as outlined above). The Business Unit performance metric will also be EBIT for the Canadian business. |
38
Table of Contents
| • | Performance of the remaining NEOs will be measured using a blend of THI and Business Unit results to reinforce accountability for the health and growth of our Canadian and U.S. businesses among the executive team. |
The following table outlines the changes to the EAPP performance metrics and weightings for 2013 for the NEOs:
| Named Executive Officer | 2012 EAPP | 2013 EAPP | ||
| CEO, CFO, COO, CMO |
THI EBIT – 75% THI Net Income – 25% |
EBIT: THI – 70% Canada – 15% US – 15% | ||
| President, Tim Hortons Canada |
EBIT: THI – 70% Canada – 30% |
The modifications outlined above represent a stepped approach to changes to the EAPP that the Board deemed appropriate in light of the new organizational structure and reinforcement of functional accountability among the NEOs. Since the reorganization was not completed until early in 2013 and because a new CEO should have the opportunity to provide input into the final plan design as part of its comprehensive review of the corporation’s short- and long-term incentive plan design, in 2013 the HRCC intends to consider whether new and/or additional performance objectives should be used for performance-based awards, and whether other modifications to the EAPP should be made.
Written Change in Control (Employment) Agreements and Post-Employment Covenants
In September 2006, the HRCC requested that Hewitt review market practices and general industry precedents to determine whether the change in control agreements that our executive officers had when the corporation was owned by Wendy’s International, Inc. were consistent with current market practice. Based on Hewitt’s review and recommendations, the HRCC recommended that our Board adopt change in control agreements for each of the NEOs containing provisions the HRCC believed, based on the information provided by Hewitt, were consistent with typical benefits offered under change in control agreements by general industry companies.
Change in control agreements were provided to our NEOs in 2006 to facilitate the stability of our leadership during the course of a change in control transaction, which is a time of increased uncertainty for our NEOs and other employees. The benefits are intended to allow these officers to make reasonable decisions about potential changes in ownership that are in the best interests of our shareholders. Change in control transactions frequently result in job losses to executive officers and, therefore, the HRCC believes that appropriate change in control benefits encourage the ongoing commitment of executive officers to the best interests of shareholders during such times. As mentioned above, these benefits also help to ensure stability and continuity of management as the change in control transaction is implemented and beyond. Furthermore, based on Hewitt’s review and recommendations, the HRCC believed that these types of change in control benefits are typical for large public companies and are, therefore, intended to provide our NEOs with benefits similar to those obtainable at comparable companies, which serves to further our objective of attracting and retaining high-performing talent. Other than these change in control agreements, as provided under the terms of the LTI Plans, and Mr. Moir’s employment agreement (as described below under “Employment Agreement with CMO”), we do not have any individual agreements with our NEOs that guarantee continued employment or that establish payments on termination of employment.
Our change in control agreements have the following provisions:
| (i) | a “double trigger” is required before any benefits are paid, meaning both a change in control and termination of employment need to occur before any benefits are paid; |
| (ii) | severance equal to two times base salary and short-term incentive awards for NEOs; and, |
39
Table of Contents
| (iii) | employment protection for no more than two years following a change in control. |
The corporation’s change in control agreement with Mr. House previously provided for a change in control payment of three times cash compensation, plus certain additional benefits for a period of three years following a termination of employment. With a view to aligning to market practice and the other NEOs, Mr. House’s change in control agreement was amended in March 2012 to decrease his change in control payment from three times to two times cash compensation, and to reduce his entitlement to additional benefits from three years to two years.
In February 2010, Mr. House entered into a post-employment covenant agreement containing non-compete, non-solicitation, confidentiality, and related covenants. The change in control agreement for Mr. House was amended to incorporate these additional covenants as well.
Retention Agreements
On August 8, 2012, the corporation entered into retention agreements (“retention agreements”) with each of the NEOs and other senior officers of the corporation, excluding Mr. House, to provide for a lump-sum cash payment (“retention award”) to each of them if such NEO remains continuously and actively employed by the corporation, on a full-time basis, through and including the date that is nine months following the date a successor to Mr. House commences employment (“retention payment date”). With respect to Mr. Moir, he must remain continuously employed as CMO through and including the retention payment date in order to receive the retention award.
Under the terms of the retention agreements, if the employment of a NEO is terminated, for any reason whatsoever, prior to the retention payment date, then such NEO shall not be entitled to the retention award.
The corporation entered into the retention agreements with a view to providing stability to the corporation, the NEOs, and certain other members of senior management during a period of transition with respect to the CEO position. If the terms of their retention agreements are satisfied, then the NEOs will be entitled to a payment on the retention payment date that is equal to the respective NEO’s annual base salary as of the date of the retention agreement.
The following table outlines the amount of the retention payment for each NEO:
| Retention Award | |||||
| Cynthia J. Devine |
$450,000 | ||||
| David F. Clanachan |
$450,000 | ||||
| William A. Moir |
$412,000 | ||||
| Roland M. Walton |
$412,000 | ||||
Employment Agreement with CMO
On August 8, 2012, the corporation entered into an employment agreement with Mr. Moir, effective August 8, 2012 and extending through August 31, 2014 (“employment period”). Pursuant to the agreement, Mr. Moir agreed to continue to serve as CMO until a successor to the CMO role has been appointed, and he has also agreed to support the orderly transition of the CMO role by assisting in the search for, and working for a period of time with, his successor, at the election of the CEO. After the successor to the CMO role is appointed, it is anticipated that Mr. Moir will continue to serve as the corporation’s executive team leader for the corporation’s sustainability and responsibility program, including the coffee partnership program, as well as the President of the Tim Horton Children’s Foundation, until the end of the employment period. He will also continue to contribute to various other strategic initiatives and programs involving the Tim Hortons brand during the employment period, at the request of the CEO.
40
Table of Contents
Mr. Moir shall receive the same compensation during the employment period as he received immediately prior to the commencement of the employment period (i.e., his 2012 compensation), subject to any increases approved by the HRCC. Mr. Moir’s participation in the corporation’s short-term and long-term compensation plans and benefit plans during the employment period shall be the same as his participation immediately prior to the commencement of the employment period, subject to any modifications made by the HRCC, in its discretion, that apply to all NEOs.
At the end of the employment period, Mr. Moir will be considered to have retired from the corporation for the purposes of all compensation, benefit and pension plans, programs and policies, unless the corporation elects to continue his employment.
If Mr. Moir’s employment is terminated by the corporation (except for a termination for cause, or due to disability or death), prior to the end of the employment period, then all of the payments, grants and benefits that Mr. Moir would have been entitled to for the remainder of the employment period shall be paid (including the cash equivalent thereto for equity grants and other benefits), to Mr. Moir as full and final payment of all amounts owed as a result of such termination. If Mr. Moir terminates his employment prior to the end of the employment period (other than as a result of death), then the corporation will pay Mr. Moir the value of the remainder of the payments and benefits that Mr. Moir would have been entitled to through the end of the employment period, except that any long-term incentive grants which had not been granted as of the termination date shall not be made. In this event, Mr. Moir will be deemed to have retired for purposes of unvested equity under the stock incentive plans. In the event that Mr. Moir’s employment is terminated following a change in control of the corporation while Mr. Moir is serving as CMO, then the terms of his change in control agreement shall apply. If a change in control occurs during the employment period while Mr. Moir is no longer serving as CMO, then Mr. Moir’s termination shall be governed by the provisions of his employment agreement as if the change in control had not occurred. Refer to “Termination and Change in Control Benefits” for further details.
Mr. Moir also entered into an employment (and post-employment) covenants agreement with the corporation on August 8, 2012, pursuant to which he has agreed to comply with certain covenants relating to non-competition, non-solicitation, confidentiality, non-disparagement and others.
Governance Policies and Related Items
Share Ownership Policy for Executive Officers
The HRCC periodically reviews the share ownership guidelines for our officers to confirm they remain appropriate in light of market trends and best practices. The share ownership guidelines were established after consideration of market data of Canadian retail (and other) companies and certain U.S. peer companies. We believe that share ownership further aligns the goals and interests of all of our officers, particularly our NEOs, with those of our shareholders.
In February 2013, we increased the share ownership level for the President and CEO to five times base salary to reflect market data for the North American market. As indicated in the table below, the guidelines require our executives to accumulate and hold shares (including vested, but unexercised options) equal to a multiple of their base salaries. The guidelines also provide that disciplinary action may be taken in the event a NEO does not achieve compliance with the guidelines within four years from the date of hire.
| Executive Level |
Stock Ownership Guideline | |
| President and CEO |
5 x Base Salary | |
| Other NEOs |
3 x Base Salary | |
| Executive Vice Presidents/Senior Vice Presidents |
1 x Base Salary | |
| Vice Presidents |
$80,000 |
41
Table of Contents
The stock ownership guidelines do not apply to officers who are within five years of a planned retirement as we do not currently impose “hold to” or “through” retirement under our guidelines. However, RSUs and options/SARs continue to vest in accordance with their normal vesting schedules, such that vesting of these awards does not accelerate upon retirement. Our share ownership guidelines also strictly prohibit our officers from entering into any transaction that would operate as a hedge against an officer’s share ownership position. Compliance with the guidelines is reviewed by the HRCC annually.
In February 2013, the HRCC reviewed the degree to which individuals have satisfied the applicable ownership guidelines as well as the appropriateness of the applicable guideline for each executive level. As of the end of 2012, all of our NEOs were in compliance with our stock ownership guidelines. The following table indicates NEO holdings as compared to the share ownership guidelines.
| Name |
Guideline | Value of Common Shares Held(1) |
Value of Vested Unexercised Options(1) |
Value of Total Ownership(1) |
Actual Ownership Multiple |
|||||||||||||||
| Paul D. House(2) |
5x | $9,003,544 | $1,852,501 | $10,856,045 | 14.1 | |||||||||||||||
| Cynthia J. Devine |
3x | $4,477,785 | $ 641,962 | $ 5,119,747 | 11.4 | |||||||||||||||
| David F. Clanachan |
3x | $2,779,634 | $ 288,066 | $ 3,067,700 | 6.8 | |||||||||||||||
| William A. Moir |
3x | $7,274,223 | $1,352,394 | $ 8,626,617 | 20.9 | |||||||||||||||
| Roland M. Walton |
3x | $3,797,615 | $1,351,698 | $ 5,149,313 | 12.5 | |||||||||||||||
| (1) | Amounts are based on the average price for our common shares on the TSX over the 2012 calendar year ($51.39). |
| (2) | Effective February 1, 2013, the share ownership guideline for the CEO was increased from 4x Base Salary to 5x Base Salary. The value of common shares held for Mr. House is as of December 31, 2012 and differs from the value on page 7, which is reported as of March 12, 2013 and includes RSUs that vested on March 1, 2013. |
Risk-Taking Analysis
On an annual basis, or more frequently as circumstances require, the HRCC considers whether our executive compensation programs incentivize any inappropriate risk-taking. Because annual performance-based incentives play a large role in our executive compensation programs, it is important that these incentives do not result in our NEOs taking actions that may conflict with the corporation’s long-term interests. No substantial changes occurred with respect to our compensation plans and programs during 2012 that impacted the HRCC’s risk assessment in a significant way and, in early 2013, the HRCC concluded that our compensation programs continue to be designed and administered with the appropriate balance of risk and reward in relation to our overall business strategies, and do not encourage executives to take unnecessary or excessive risks.
As a result of the new organizational structure, the HRCC developed guiding principles to support short-term incentive plan modifications in 2013. As described above under “Modifications to EAPP in 2013” in February 2013, the HRCC decided that the first of the planned modifications should relate to performance objectives for our executive officers under our EAPP, such that performance will be based solely on EBIT for 2013 and will now include a component for business unit performance.
The HRCC believes that EBIT best reflects the financial health and performance of our business and also is a key performance measure used by other quick service restaurant companies, which allows for general comparability of performance. In addition, as noted below under “NEO Compensation—Alignment to Corporate Performance (Pay-for-Performance Linkage)”, aggregate NEO compensation has remained relatively flat over the five year period ending in 2012, while EBIT has steadily increased. The HRCC believes that these results support that EBIT as a performance objective is effective in delivering compensation to our executive officers over time in a manner consistent with our pay-for-performance philosophy and in a manner that represents alignment with long-term shareholder value.
Net Income reflects overall earnings performance and requires management to be responsible for, and manage every line item on, our Consolidated Statement of Operations; however, in considering the EAPP modifications in 2013, the HRCC noted that only a small number of executive officers (and not all NEOs) have the ability to impact Net Income, because
42
Table of Contents
the tax and interest line-items on our financial statements are within the control of a small number of officers. Accordingly, the HRCC considered that EBIT should be the sole corporate performance metric for the EAPP in 2013 for executive officers, as these officers all have the ability to contribute to the achievement of EBIT. Furthermore, with a view to further aligning pay-to-performance, the HRCC considered that the EAPP performance metrics should reflect the results of the corporate reorganization, which provided for greater responsibilities at the business unit level.
The HRCC has considered whether these amendments would encourage inappropriate risk-taking and has concluded that, for the reasons described below, the corporation’s short-term incentive plan continues to be designed and administered with the appropriate balance of risk and reward in relation to our overall business strategies, and does not encourage executives to take unnecessary or excessive risks. The HRCC believes that the transition from EBIT (as to 70%) and Net Income (as to 30%) as the corporate performance metrics towards EBIT as the sole corporate performance objective would not serve to increase the potential for inappropriate risk-taking because, as noted above, all executive officers have the ability to contribute to the achievement of EBIT, while only a small number of executive officers (and not all NEOs) have the ability to impact Net Income making EBIT less susceptible to the impact of individual behaviors. Also, Net Income was a small component of the overall program and the impact of Net Income performance was considerably outweighed by EBIT, and therefore its removal will not have a significant impact on risk analysis. Furthermore, the addition of another performance measure, namely segmented business unit EBIT performance, more directly aligns executive compensation with the operating income of the underlying business, which will reduce incentives to take risks that do not further business interests.
In making these determinations, the HRCC considered the following key elements of our compensation programs.
Performance Objectives and HRCC Review
In connection with the adoption of the annual target performance objectives for 2012 and 2013, the HRCC considered the extent to which annual performance metrics as opposed to multi-year targets, could potentially incentivize unnecessary or inappropriate risk-taking or short-term decision-making. The HRCC concluded that the absence of multiple-year performance objectives did not lead to the assumption of undue risk. The potential for short-term decisions to drive excessive compensation is limited because the performance awards are subject to “caps” or maximum amounts of compensation that can be received in the event the corporation’s performance exceeds established performance targets. This minimizes any incentive to enter into large transactions for the purpose of attempting to generate substantial short-term gains. In addition, consistent declines in budgeted target growth due to short-term decision-making would be visible to the HRCC and Board through the annual budget review and establishment of annual performance objectives. Therefore, short-term decisions resulting in increased compensation in the current year would impact the budget and performance objectives for the following year.
In addition, the HRCC retains discretion to make adjustments to minimize the impact of extraordinary events or circumstances so that the compensation paid to executives more closely matches underlying operating performance. For example, in 2012, the corporation began implementing a new organizational structure which resulted in termination costs and professional fees related to the reorganization. The corporation also incurred CEO transition costs related primarily to an employment agreement and retention agreements with certain senior executives (as described above). The HRCC considered the net impact of these reorganization and transition expenses and made adjustments to minimize the net impact of these expenses on compensation because the HRCC believed it was appropriate to do so given the relative magnitude of the expenses, the extraordinary nature of the reorganization and CEO transition (which are unrelated to underlying operating performance), and the inability of executives to control the occurrence of these events. The HRCC’s ability to review the amount of performance awards and the underlying factors driving the amount of such awards prior to payment thereof, as was done in 2012, acts as another means by which risks inherent in the design of compensation plans are mitigated.
43
Table of Contents
Other Factors Mitigating Risk in Compensation Programs
In addition to the metrics selected for performance-based compensation, discussed above, the HRCC believes that certain of our other tools and policies mitigate an incentive to take excessive risks by limiting the amount of benefit that could be obtained by executives through undue focus on short-term results and/or through excessive risk-taking. These tools and policies include:
| • | the balance between short-and long-term incentives within the NEOs’ total target compensation; |
| • | the vesting period which applies to long-term incentives (e.g., P+RSU awards do not vest for 30 months, so a gain in the short-term would not be immediately realizable); |
| • | an annual review of the corporation’s short-and long-term incentive plans and corresponding targets and milestones to assess continued relevance and applicability; |
| • | consideration of qualitative as well as quantitative performance factors in determining short-and long-term compensation payouts and in the setting of future compensation, including minimum and maximum performance thresholds; and, actual results are measured against pre-approved financial metrics that are clearly defined, directly linked to our financial performance, and capped at 150% of target value; |
| • | stock ownership policies; |
| • | an anti-hedging policy which prohibits the corporation’s directors, executive officers and other insiders from participating in speculative activity related to the corporation’s equity; |
| • | not accelerating the vesting of equity awards upon retirement; |
| • | recoupment or “clawback” policy that allows us to recover compensation paid on the basis of certain errors or misconduct; |
| • | the continued monitoring of benchmarking data, including data from the comprehensive 2010 study, to confirm whether our executive compensation is consistent with our compensation philosophy; |
| • | the continued monitoring of internal pay equity to ensure a proper balance of risk and reward with lower-tier officers; |
| • | utilizing tally sheets to monitor trends and unusual impacts on compensation over a number of years; and |
| • | our equity award program has a “double trigger” prior to payout upon a change in control. |
Say on Pay Policy
In 2012, the Board adopted a policy to provide its shareholders with an opportunity to cast an annual, non-binding, advisory vote on the corporation’s approach to executive compensation. This policy reflects the Board’s belief that the corporation’s shareholders should have the opportunity to express their views of the overall objectives, philosophy, and principles the Board has used to make executive compensation decisions. The policy will be reviewed by the HRCC on an annual basis to confirm that it is effective in achieving its objectives. While shareholders will provide their collective advisory vote, the Board and the HRCC remain fully responsible for their compensation decisions.
The results of the shareholder advisory vote will be disclosed as part of the report on voting results for our shareholder meetings. As it is an advisory vote, the results will not be binding. However, the corporation welcomes feedback and dialogue with its shareholders to understand their views regarding, and the corporation’s approach to, executive compensation matters. The Board will consider both shareholder feedback, as well as the results of the vote, as appropriate, when considering future compensation policies, procedures, and decisions.
Recoupment or “Clawback” Policy
Since 2009, we have had in place a Recoupment Policy Relating to Performance-Based Compensation (the “Recoupment Policy”). The Recoupment Policy provides that if our consolidated financial statements are required to be
44
Table of Contents
restated for any reason other than a change in accounting policy with retroactive effect, our Board will review all performance-based compensation awarded to or earned by our senior executives (and certain other employees) for all fiscal periods materially affected by the restatement, provided that the Recoupment Policy shall apply to all such compensation awarded or paid on or after February 19, 2009. If the Board determines that performance-based compensation was paid based on the achievement of financial results that were subsequently corrected as part of a restatement, and a lower incentive payment or award would have been made based on the restated financial results, then the Board will, to the extent permitted by applicable law, seek recoupment from those subject to the Recoupment Policy. Recoupment will be sought for the extent of such performance-based compensation as the Board deems appropriate, after a review of all relevant facts and circumstances.
Equity Grant and Settlement Policy
The HRCC has adopted an equity grant and settlement policy to reflect best practices and confirm internal policies and procedures. This policy provides for, among other things, specific parameters that apply to all grants and settlements of equity compensation awards, as well as hedging activities undertaken by the corporation at the time of the award and/or settlement thereof. The general purpose of the policy is that no exercise price, settlement value, or grant-date value of any equity award made by the corporation and, that no entry into or settlement of hedging transactions in connection with such equity awards, is subject to, or at risk of, any manipulation by any director or member of management. This policy is also intended to avoid using a stock price for determination of equity grants or settlement amounts on a date when we are arguably in possession of material, undisclosed information that is not reflected in the market price of our common shares. Otherwise, grants would not be reflective of our intent to assign an appropriate value-based award. In furtherance of the policy, specific practices were adopted and must be followed when grants and settlements of equity-based awards are made and when hedging activities by the corporation are undertaken in connection therewith. In particular, the HRCC believes that establishing fixed grant and settlement dates, as well as establishing hedging practices, in advance to the extent possible, will maintain the integrity of the award, settlement, and hedging process. Accordingly, grant and settlement dates of equity-based compensation awards to non-employee directors and employees are predetermined, as set forth in the policy, as are the dates of corresponding hedging activities. In addition, certain other administrative and internal control measures were confirmed as part of the adoption of the policy, including an override by the HRCC if certain events or circumstances should occur or arise.
Tax Treatment of Certain Equity Compensation
Holders of our options/SARs can exercise their stock options to receive common shares or exercise the SAR and receive a cash payment, in each case with the value dependent upon the price of our common shares at the time of exercise. In Canada, the cash payment upon exercise of the SAR is taxable income to the employee. Canadian tax legislation provides that either the Canadian employer or the Canadian employee may claim a deduction for cash payments arising on the exercise of the SAR feature, but not both. In each of 2010, 2011 and 2012, the corporation made annual elections to forgo its corporate tax deduction in Canada to enable Canadian employees to receive favorable tax treatment on an exercise of the SAR feature in those years.
Other Matters
As a foreign private issuer in the U.S., we are not required to disclose executive compensation according to the requirements of Regulation S-K that apply to U.S. domestic issuers, and we are otherwise not required to adhere to the U.S. requirements relative to certain other proxy disclosures and requirements. Therefore, our executive compensation and other proxy disclosures will be in compliance with Canadian requirements, which are, in most respects, substantially similar to the U.S. rules. We do generally attempt to comply with the spirit of the U.S. executive compensation and other proxy rules when possible and to the extent that they do not conflict, in whole or in part, with required Canadian corporate or securities requirements or disclosure.
45
Table of Contents
Performance Graph
The following graph compares the yearly percentage change in Tim Hortons cumulative total shareholder return on the TSX and NYSE as measured by (i) the change in the corporation’s share price from December 28, 2007 to December 28, 2012, and (ii) the reinvestment of dividends at the closing price on the dividend payment date, against the cumulative total return of the S&P/TSX Composite Index, S&P/TSX Consumer Discretionary Index, and S&P 500. The information provided under the heading “Performance Graph” shall not be considered “filed” for purposes of Section 18 of the Exchange Act or incorporated by reference in any filing under the Securities Act or the Exchange Act, whether made before or after the date hereof and irrespective of any general incorporation language in any such filing.
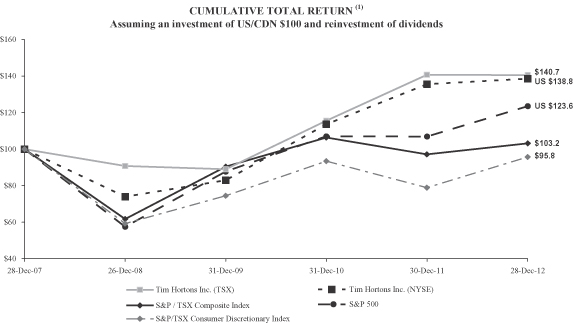
| 28-Dec-07 | 26-Dec-08 | 31-Dec-09 | 31-Dec-10 | 30-Dec-11 | 28-Dec-12 | |||||||||||||||||||||||||
| S&P/TSX Composite Index (Cdn.$)(2) |
$100.0 | $61.9 | $90.6 | $106.5 | $ 97.2 | $103.2 | ||||||||||||||||||||||||
| S&P/TSX Consumer Discretionary Index (Cdn.$)(2) |
$100.0 | $59.4 | $74.5 | $ 93.5 | $ 79.0 | $ 95.8 | ||||||||||||||||||||||||
| S&P 500 (U.S.$) |
$100.0 | $57.6 | $87.8 | $107.1 | $107.0 | $123.6 | ||||||||||||||||||||||||
| Tim Hortons Inc. (TSX) |
$100.0 | $90.8 | $89.1 | $115.6 | $140.9 | $140.7 | ||||||||||||||||||||||||
| Tim Hortons Inc. (NYSE) |
$100.0 | $74.0 | $83.1 | $113.8 | $135.7 | $138.7 | ||||||||||||||||||||||||
| (1) | The majority of Tim Hortons operations, income, revenues, expenses, and cash flows are in Canadian dollars, and the corporation reports financial results in Canadian dollars. As a result, our Canadian-dollar earnings per share may be translated to U.S. dollars by investors, analysts and others. Fluctuations in the foreign exchange rates between the U.S. and Canadian dollar can affect Tim Hortons share price. See “Risk Factors” in Part 1A of our Form 10-K for the fiscal year ended December 30, 2012, filed with the SEC on February 21, 2013, as amended by this Form 10-K/A. The primary cause of the appreciation in the U.S. dollar share price relative to the Canadian share price during 2009, 2010 and 2012 is the percentage by which Canadian dollar appreciated against the U.S. dollar as noted below. Conversely, in 2008 and 2011, the Canadian dollar depreciated relative to the U.S. dollar by the percentages set forth below causing the opposite effect, resulting in a decline in the U.S. dollar share price as a result of currency fluctuations that are not directly attributable to changes in Tim Hortons underlying business or financial condition aside from the impact of foreign exchange. |
46
Table of Contents
| Year |
F/X Change Cdn.$ compared to US$ | |
| 2007 |
+16% | |
| 2008 |
-23% | |
| 2009 |
+13% | |
| 2010 |
+5% | |
| 2011 |
-2% | |
| 2012 |
+2% |
| (2) | Since September 29, 2006, Tim Hortons has been included in the S&P/TSX Composite Index and the S&P/TSX Consumer Discretionary Index. |
NEO Compensation—Alignment to Corporate Performance (Pay-for-Performance Linkage)
Total Shareholder Return
As set forth in the graph above, in our last five fiscal years, the corporation’s share price on the TSX has increased 40.7% assuming the reinvestment of dividends. During this period, aggregate NEO compensation as reflected in the Summary Compensation Table has been in the range of $10.1 million to $12.0 million, which provides substantial support for our pay-for-performance philosophy. In 2012, the corporation fell short of meeting the target performance objectives, which resulted in lower than target EAPP payouts (at 93.8% of target) and lower than target P+RSU awards in May 2013 (at 93.1% of target) for the NEOs, reflecting alignment with lower corporate performance. In 2008, the application of our pay-for-performance philosophy was also demonstrated as total compensation delivered to the NEOs was impacted by lower than target EAPP payouts (at 80% of target) and no P+RSU grant in 2009 due to not achieving the performance objectives set for 2008. This coincides with and aligns to the drop in cumulative total shareholder return value during 2008 as outlined in the graph above. Over 2010 and 2011, our financial performance, after excluding certain significant events, was strong, which was reflected in the improvement of the corporation’s share price over this period and through our EAPP and P+RSU awards being above target at 105%. The majority of our performance-based compensation (EAPP payouts (75%) and P+RSUs (100%)) during this period was based on our operating income, or EBIT performance. As such, we have provided below a comparison of aggregate NEO compensation to the corporation’s EBIT performance.
Operating Income (EBIT) Performance
The following graph compares aggregate annual compensation paid to our NEOs from fiscal 2008 to fiscal 2012 to actual reported EBIT as disclosed in our Form 10-K for the fiscal year ended December 30, 2012, under “Selected Financial Data”. As outlined on the graph, aggregate NEO compensation has remained relatively flat over this period while reported EBIT has steadily increased. The increase in EBIT in fiscal 2010 reflects the impact of the gain on the sale of our 50% joint venture interest in Maidstone Bakeries which was excluded from compensation determinations for our NEOs. During the past five years, Reported EBIT has increased by 24%, while aggregate NEO compensation as a percentage of reported EBIT, has remained relatively flat from 2.1% in 2008 to 1.7% in 2012. We believe that these results, coupled with the analysis discussed above with respect to total shareholder return, support our conclusion that EBIT as a performance objective is effective in delivering compensation to our executives over time in a manner consistent with our pay-for-performance philosophy and in a manner that represents alignment with long-term shareholder value.
47
Table of Contents
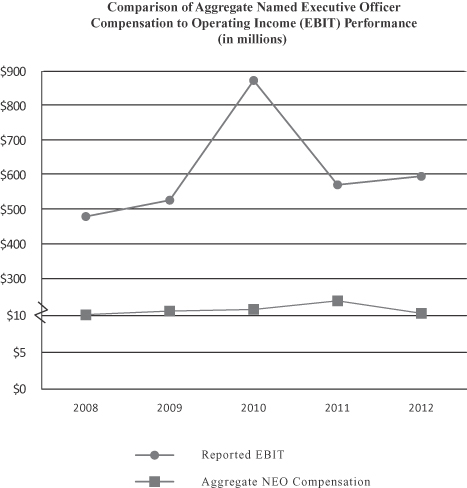
| 2008 | 2009 | 2010 | 2011 | 2012 | ||||||||||||||||
| Aggregate NEO Compensation (in millions)(1) |
$ | 10.1 | $ | 10.6 | $ | 10.8 | $ | 12.0 | $ | 10.3 | ||||||||||
| Reported EBIT(in millions)(2) |
$ | 478.4 | $ | 525.6 | $ | 872.2 | (3) | $ | 569.5 | $ | 594.5 | |||||||||
| NEO Compensation as a % of EBIT |
2.1 | % | 2.0 | % | 1.2 | %(3) | 2.1 | % | 1.7 | % | ||||||||||
| (1) | NEO compensation is based on the NEOs for each applicable year. Aggregate NEO compensation includes base salary, short-term (annual cash) incentive, grant-date value of equity awards, and other compensation, as reported in the Summary Compensation Table and includes the impact of the 2011 long-term incentive awards delivered in 2012 to Mr. House. For comparison purposes, Mr. House has been included in the amounts even though he was not a NEO in 2010. The former CEO, Mr. Donald B. Schroeder is included as a NEO in 2008 to 2011; however, his severance payment and consulting fees have been excluded from Aggregate NEO Compensation in 2011. |
| (2) | Operating Income or EBIT as reported in our Form 10-K for the fiscal year ended December 30, 2012, under “Item 6. Selected Financial Data”. |
| (3) | Reported 2010 EBIT and resulting NEO Compensation as a percentage of EBIT reflect the gain on the sale of our 50% joint venture interest in Maidstone Bakeries, as well as other significant events that occurred in 2010. If we had eliminated the impact of these events, NEO Compensation as a percentage of EBIT would have been 2.0%. |
48
Table of Contents
APPENDIX A
Reconciliation of 2012 Adjusted Operating Income for Compensation Determinations and
2012 Adjusted Net Income for Compensation Determinations, Non-GAAP Financial Measures
Adjusted Operating Income (EBIT) for Compensation Determinations and Adjusted Net Income for Compensation Determinations are non-GAAP measures used for determining EAPP payouts and P+RSU awards (see table below). Adjusted Operating Income (EBIT) for Compensation Determinations excludes operating income attributable to Variable Interest Entities (“VIEs”), which consists of operating income derived from restaurants consolidated pursuant to applicable accounting rules and from our advertising funds. Prior to the adoption of an accounting standard at the beginning of 2010, operating income was, for the most part, unaffected by VIEs. However, adoption of this accounting standard requires the consolidation of VIEs of which we are considered to be the primary beneficiary, and we believe should not be included in determining corporate performance for compensation purposes.
Adjusted Operating Income for Compensation Determinations excludes operating income attributable to VIEs, as described above, corporate reorganization expenses, and recoveries of asset impairment and closure costs. The corporate reorganization expenses include termination costs, professional fees, and accruals for an employment agreement and retention agreements associated with the CEO transition.
Adjusted Net Income for Compensation Determinations excludes the corporate reorganization costs, recoveries of asset impairment and closure costs, and a tax adjustment representing a lower effective tax rate than originally budgeted. The HRCC and Management believe that Adjusted Operating Income for Compensation Determinations and Adjusted Net Income for Compensation Determinations provide important information for comparison purposes to prior periods and for purposes of evaluating the corporation’s operating income performance without the effects of specific items, noted above, which have a disproportionate impact on the overall performance of our consolidated business.
These non-GAAP measures are not intended to replace the presentation of our financial results in accordance with GAAP. The corporation’s use of the terms Adjusted Operating Income for Compensation Determinations, and Adjusted Net Income for Compensation Determinations may differ from similar measures reported by other companies.
For compensation purposes, these non-GAAP financial measures more closely reflect our operating performance to which the corporation seeks to align executive compensation by removing what we consider to be disproportional impacts of unusual or non-operating transactions on the overall performance of our corporation’s business and, therefore, on executive compensation that is based on the corporation’s financial results.
Reconciliation of 2012 Adjusted Operating Income for Compensation Determinations
and 2012 Adjusted Net Income for Compensation Determinations (Non-GAAP Measures)
| (in millions) | ||||
| Reported Operating Income (EBIT). |
$ | 594.5 | ||
| Less: Operating Income (EBIT) attributable to VIEs |
(6.9 | ) | ||
| Reported Operating Income attributable to Tim Hortons Inc. |
587.6 | |||
| Add: Corporate reorganization expenses |
18.9 | |||
| Less: Recovery of asset impairment and closure costs |
(0.4 | ) | ||
|
|
|
|||
| Adjusted Operating Income (EBIT) for Compensation Determinations |
606.1 | |||
| (in millions) | ||||
| Reported Net Income attributable to Tim Hortons Inc. |
402.9 | |||
| Add: Corporate reorganization expenses, net of tax |
15.3 | |||
| Less: Recovery of asset impairment and closure costs, net of tax |
(0.3 | ) | ||
| Less: Tax Adjustment |
(1.7 | ) | ||
|
|
|
|||
| Adjusted Net Income for Compensation Determinations |
416.2 | |||
49
Table of Contents
EXECUTIVE AND DIRECTOR COMPENSATION
Summary Compensation Table
The following table lists all elements of compensation directly or indirectly awarded to, earned by, or paid or payable by the corporation to each NEO for the fiscal years ended 2012, 2011 and 2010.
| Name and Principal Position |
Year | Salary ($)(1) |
Share- Based Awards ($)(2) |
Option Based Awards ($)(3) |
Non-Equity Incentive Plan Compensation ($) |
Pension Value ($)(5) |
All Other Compensation ($)(6) |
Total Compensation ($)(7) |
||||||||||||||||||||||||||||
| Annual Incentive Plans(4) |
Long- Term Incentive Plans |
|||||||||||||||||||||||||||||||||||
| Paul D. House Executive Chairman, President and Chief Executive Officer |
2012 | $ | 769,027 | $ | 1,931,000 | $ 0 | $938,000 | $0 | $17,014 | $266,032 | $3,921,073 | |||||||||||||||||||||||||
| 2011 | $ | 583,069 | $ | 2,900,000 | $ 0 | $645,107 | $0 | $16,407 | $153,595 | $4,298,178 | ||||||||||||||||||||||||||
| 2010 | $ | 373,071 | $ | 200,000 | $175,000 | $210,000 | $0 | $16,036 | $ 35,326 | $1,009,433 | ||||||||||||||||||||||||||
| Cynthia J. Devine Chief Financial Officer |
2012 | $ | 425,055 | $ | 279,300 | $300,000 | $469,000 | $0 | $17,014 | $132,508 | $1,622,877 | |||||||||||||||||||||||||
| 2011 | $ | 397,393 | $ | 315,000 | $300,000 | $526,500 | $0 | $16,407 | $126,724 | $1,682,024 | ||||||||||||||||||||||||||
| 2010 | $ | 381,802 | $ | 315,000 | $206,541 | $525,000 | $0 | $16,036 | $120,756 | $1,565,135 | ||||||||||||||||||||||||||
| David F. Clanachan Chief Operating Officer |
2012 | $ | 425,055 | $ | 329,300 | $300,000 | $469,000 | $0 | $17,014 | $150,748 | $1,691,117 | |||||||||||||||||||||||||
| 2011 | $ | 397,393 | $ | 262,500 | $250,000 | $526,500 | $0 | $16,407 | $137,303 | $1,590,103 | ||||||||||||||||||||||||||
| 2010 | $ | 381,802 | $ | 262,500 | $206,541 | $525,000 | $0 | $16,036 | $155,128 | $1,547,007 | ||||||||||||||||||||||||||
| William A. Moir Chief Brand and Marketing Officer |
2012 | $ | 410,147 | $ | 232,750 | $250,000 | $469,000 | $0 | $17,014 | $154,462 | $1,533,373 | |||||||||||||||||||||||||
| 2011 | $ | 397,393 | $ | 262,500 | $250,000 | $526,500 | $0 | $16,407 | $123,401 | $1,576,201 | ||||||||||||||||||||||||||
| 2010 | $ | 381,802 | $ | 262,500 | $206,541 | $525,000 | $0 | $16,036 | $158,500 | $1,550,379 | ||||||||||||||||||||||||||
| Roland M. Walton President, Tim Hortons Canada |
2012 | $ | 410,147 | $ | 232,750 | $250,000 | $469,000 | $0 | $17,014 | $132,311 | $1,511,222 | |||||||||||||||||||||||||
| 2011 | $ | 397,393 | $ | 262,500 | $250,000 | $526,500 | $0 | $16,407 | $128,548 | $1,581,348 | ||||||||||||||||||||||||||
| 2010 | $ | 381,802 | $ | 262,500 | $206,541 | $525,000 | $0 | $16,036 | $148,739 | $1,540,618 | ||||||||||||||||||||||||||
| (1) | For 2011, Mr. House’s base salary for his role as Executive Chairman was decreased to $300,000 but was subsequently increased to $750,000, reflecting his appointment to the additional roles of President and CEO effective May 24, 2011. Mr. House’s 2012 base salary was increased to $772,500 effective March 1, 2012. Mr. House did not receive any additional compensation for his service as a director. |
| For 2012, the base salaries for Ms. Devine and Mr. Clanachan were increased to $412,000 from $400,000 as of March 1, 2012, and subsequently increased to $450,000 in August 2012 in recognition of their increased responsibilities. For 2012, the base salaries for Messrs. Moir and Walton were increased to $412,000 from $400,000 as of March 1, 2012. |
| (2) | Amounts shown represent the grant-date fair value of P+RSU/RSUs which are valued based on the closing price of our common shares on the TSX on the trading day immediately preceding the grant date. The 2012 amounts represent P+RSUs earned in respect of 2012 performance to be awarded in May 2013. |
| In February 2012, Mr. House received a P+RSU award of $1,050,000 and an RSU award of $800,000, both of which were earned in respect of 2011 performance and reflected the time he served in the role as President and CEO in 2011. These February 2012 awards reflected Mr. House’s contribution as President and CEO since the time of his appointment in May 2011, which occurred just one week after the regular annual grant date of May 17, 2011. If Mr. House had been appointed as President and CEO prior to the grant date in 2011, the February 2012 awards would likely have been made on May 17, 2011, as was the case for the other NEOs and treated similarly (i.e., one-half reported as 2010 performance-based compensation and one-half reported as 2011 compensation). This treatment is consistent with the forward-looking nature of our long-term incentive awards (i.e., P+RSUs) and the Committee’s historical administrative practice that grant amounts reflect the amount of equity compensation established for the executive immediately prior to the grant date. Mr. House continued his service with the corporation as of the May 2012 grant date, and also received a P+RSU award of $1,050,000, reflective of the 2011 performance factor, for a total award of $2,900,000. In addition, instead of an option/SAR award, due to the interim nature of Mr. House’s service as CEO and his concurrent service as a director, Mr. House received an RSU award of $1,000,000 in May 2012 which is reflected as 2012 compensation, consistent with how stock options are reported for the other NEOs. |
50
Table of Contents
| Mr. Clanachan received an RSU award of $50,000 in August 2012 in recognition of his increased responsibilities, and will receive a P+RSU award in May 2013 of $279,300, earned in respect of 2012 performance, for a total award for the 2012 year of $329,300. |
| Accounting Treatment: The period over which the P+RSUs are expensed differs depending upon whether the grantee is retirement-eligible. If the grantee is retirement-eligible, then the expense period is shorter than those that are not retirement-eligible. That is, the accounting expense for P+RSUs is determined by spreading the compensation award value set forth in the table above equally over the number of months in the period starting from the date the performance target is set for a particular award (in February) through either (i) the date of grant (May of the following year) for retirement-eligible participants—a total of 15 months; or, (ii) the end of the 30-month vesting period for those participants that are not retirement eligible—a total of 45 months. We do not have accelerated vesting of awards upon retirement; however, the accounting rules require that P+RSUs be fully expensed on the date of grant for retirement-eligible participants because they have satisfied all performance conditions and are subject only to time vesting restrictions. |
| (3) | Amounts shown represent the grant-date fair value of stock options with tandem SARs. For compensation purposes, the number of options/SARs granted was determined using a Black-Scholes valuation methodology with the following variables: |
| 2012 | 2011 | 2010 | ||||||||||
| Maturity Date or Term |
7 years | 7 years | 7 years | |||||||||
| Risk-free Interest Rate |
1.65 | % | 2.82 | % | 3.02 | % | ||||||
| Expected Dividends |
1.70 | % | $ | 0.68 | $ | 0.52 | ||||||
| Share Price Volatility |
21.6 | % | 25.67 | % | 23.37 | % | ||||||
|
|
|
|
|
|
|
|||||||
| Black-Scholes Value |
$ | 10.88 | $ | 11.23 | $ | 8.18 | ||||||
| Exercise Price |
$ | 54.95 | $ | 45.76 | $ | 35.23 | ||||||
| The option/SARs granted to Mr. Clanachan on August 14, 2012 were based on an exercise price of $50.24 and a Black-Scholes value of $9.85 (maturity date or term: 7 years; risk-free interest rate: 1.57%; expected dividend yield: 1.70%; and share price volatility: 21.5%). The option/SARs granted to Mr. Moir on August 16, 2011 were based on an exercise price of $45.84 and a Black-Scholes value of $10.06 (maturity date or term: 7 years; risk-free interest rate: 2.5%; expected dividends: $0.68; and share price volatility: 23.25%). To determine the number of option/SARs, we reduce the intended compensation value (the numerator) by a factor that considers the impact of vesting and other plan design features that are also considered in the calculation of the Black-Scholes value (the denominator). The HRCC chose the Black-Scholes valuation methodology for determining the appropriate number of options/SARs to grant based on the intended compensation value because it is a long-standing and common valuation methodology used by public companies. As such, its use facilitates benchmarking studies intended to yield market comparisons of compensation, making it equitable to both the corporation and our executives. |
| Accounting Treatment: The grant-date fair value determined for compensation purposes will differ from the accounting fair value disclosed in our financial statements. The main difference for option/SAR grants is the use of a shorter maturity date or term for accounting purposes, which also impacts variables such as the risk-free interest rate and share price volatility for accounting purposes. Further, we determine the compensation expense associated with options/SARs based on different Black-Scholes values for retirement-eligible and non-retirement-eligible participants due to the much shorter term, for accounting purposes, for retirement-eligible participants and the resulting impact on the Black-Scholes value. The grant date accounting value for grants of options with tandem SARs was based on the following Black-Scholes values by year for retirement-eligible NEOs (Mr. Moir) and non-retirement-eligible NEOs, respectively: $7.60 and $9.37 ($8.21 for the additional August grant for Mr. Clanachan) (2012); $7.62 ($6.21 for the additional August grant for Mr. Moir) and $8.87 (2011); and $6.04 and $7.49 (2010). As such, the accounting value of the option/SAR awards granted to the NEOs, retirement-eligible and non-retirement-eligible, respectively, on an aggregate basis, were as follows for each year: $166,037 and $694,686 (2012); $803,910 and $600,774 (2011); and $611,133 and $517,978 (2010). |
51
Table of Contents
| (4) | Non-equity incentive plan compensation reflects annual cash incentive compensation earned by each NEO under the EAPP. The annual incentive compensation awarded to Mr. House for 2011 was prorated for the portion of time he served as President and CEO in 2011. Under the EAPP, the NEOs may earn annual cash awards based on their achievement of pre-established annual performance objectives. These objectives may include a variety of financial performance metrics for our corporation as a whole or for an operating unit, or individual performance metrics. Corporate and operating unit objectives may include: (i) earnings per share, (ii) Net Income or earnings (which may be expressed as earnings before specified items), (iii) return on assets, (iv) return on invested capital, (v) revenue, (vi) operating income (EBIT), (vii) cash flow, (viii) total shareholder return, or (ix) any combination of these measures. Individual performance metrics may include financial or non-financial metrics, targets, goals or objectives. Performance objectives may be absolute, or relative to prior performance or to the performance of one or more other companies or external indices, and may be expressed as a progression within a specified range. For 2010, 2011, and 2012, these performance objectives included operating income or EBIT (as to 75% of the award), and Net Income (as to 25% of the award). The payouts for 2012 were at 93.8% of target, compared with 105.3% of target in 2011 and 105% of target in 2010. For details on 2012 EBIT and Net Income, and the adjustments made prior to the determination of payouts under the EAPP, refer to the CD&A. |
| (5) | These amounts represent employer contributions to the company-wide defined contribution pension plan (refer to the “Defined Contribution Plans Table” below). No above-market or preferential earnings on non-qualified deferred contribution plans were paid or credited in 2012, 2011 or 2010. We do not maintain or otherwise contribute to any defined benefit or other actuarial plans. |
| (6) | The amounts shown in this column are comprised of the items listed in the table below. All of these items are treated as taxable benefits to the NEO with the exception of the executive medical benefit. |
| Year | Company Car |
Life Insurance Coverage |
Executive Medical |
Contributions to Savings Plan |
Service Awards |
DERs on RSUs/ P+RSUs |
Other | Total | ||||||||||||||||||||||||||||
| Paul D. House |
2012 | $18,582 | $1,697 | $1,595 | $ 0 | $ 0 | $60,131 | $ | 184,027 | $ | 266,032 | |||||||||||||||||||||||||
| 2011 | $20,405 | $1,215 | $ 0 | $ 0 | $ 0 | $ 5,669 | $ | 126,306 | $ | 153,595 | ||||||||||||||||||||||||||
| 2010 | $20,919 | $1,215 | $1,595 | $ 0 | $4,772 | $ 6,825 | $ | 0 | $ | 35,326 | ||||||||||||||||||||||||||
| Cynthia J. Devine |
2012 | $19,409 | $2,618 | $ 0 | $ 97,172 | $ 0 | $13,309 | $ | 0 | $ | 132,508 | |||||||||||||||||||||||||
| 2011 | $20,356 | $2,657 | $1,595 | $ 94,280 | $ 0 | $ 7,836 | $ | 0 | $ | 126,724 | ||||||||||||||||||||||||||
| 2010 | $21,035 | $2,657 | $1,890 | $ 89,781 | $ 0 | $ 5,393 | $ | 0 | $ | 120,756 | ||||||||||||||||||||||||||
| David F. Clanachan |
2012 | $22,139 | $2,618 | $ 0 | $ 97,172 | $2,931 | $12,143 | $ | 13,745 | $ | 150,748 | |||||||||||||||||||||||||
| 2011 | $19,376 | $2,657 | $ 0 | $ 94,280 | $ 0 | $ 7,249 | $ | 13,741 | $ | 137,303 | ||||||||||||||||||||||||||
| 2010 | $18,107 | $2,657 | $ 0 | $116,235 | $ 0 | $ 5,393 | $ | 12,736 | $ | 155,128 | ||||||||||||||||||||||||||
| William A. Moir |
2012 | $18,122 | $2,618 | $1,928 | $ 95,383 | $ 0 | $11,720 | $ | 24,691 | $ | 154,462 | |||||||||||||||||||||||||
| 2011 | $17,458 | $2,657 | $1,928 | $ 94,280 | $ 0 | $ 7,078 | $ | 0 | $ | 123,401 | ||||||||||||||||||||||||||
| 2010 | $29,957 | $2,657 | $1,595 | $116,235 | $2,663 | $ 5,393 | $ | 0 | $ | 158,500 | ||||||||||||||||||||||||||
| Roland M. Walton |
2012 | $18,289 | $2,618 | $2,380 | $ 95,383 | $1,916 | $11,725 | $ | 0 | $ | 132,311 | |||||||||||||||||||||||||
| 2011 | $22,434 | $2,657 | $1,928 | $ 94,280 | $ 0 | $ 7,249 | $ | 0 | $ | 128,548 | ||||||||||||||||||||||||||
| 2010 | $21,974 | $2,657 | $2,480 | $116,235 | $ 0 | $ 5,393 | $ | 0 | $ | 148,739 | ||||||||||||||||||||||||||
| The values for the company car were determined on the basis of aggregate incremental costs of the lease payment, gas costs, and maintenance costs for the vehicle. Executive medical costs are the actual costs to us of executive medical assessments paid for by us. The value associated with DERs on unvested RSUs and P+RSUs on the payment date is included in “All Other Compensation” and not included in the grant-date fair value associated with the underlying P+RSU award set forth in the “Share-Based Awards” column of the Summary Compensation Table. |
| Amounts in the “Other” column above include the following: Mr. House: $152,682 received as a cash payment in lieu of a corporate contribution to the Executive Retirement Savings Plan for 2012 ($113,338 for 2011) and transportation costs of $31,345 (inclusive of tax costs) ($12,968 in 2011). This amount reflects allocated costs of the corporation’s employee that provides executive and other transportation services for the corporation and the variable costs associated with the corporation’s vehicle. For Mr. Clanachan: $13,745 in 2012, $13,741 in 2011, and $12,736 in 2010 for tax preparation |
52
Table of Contents
| (inclusive of tax costs as Mr. Clanachan is required to work in the U.S. and obligated to file U.S. tax returns and, therefore, the corporation does not require Mr. Clanachan to be responsible for the costs associated with his tax return preparation). For Mr. Moir: $24,691 in 2012 for legal fees per his employment agreement. |
| In 2011, the corporation changed the method for measuring the benefit associated with guests flying with executives for business purposes to reflect that there is no incremental cost to the company when the primary purpose of the trip is business-related. As a result of the policy change, there is no reported value for the personal use of the aircraft for any executive during the prior three years. The corporation does not pay its NEOs any amounts in respect of taxes (grossed-up amounts) on income imputed to them for non-business aircraft usage. Over the past three years, there has been very limited personal use of the aircraft and only in connection with business use. |
| (7) | CEO Compensation: The increase in Mr. House’s total compensation in 2011 resulted from his appointment as President and CEO in May 2011, including the impact of the timing of 2011 long-term incentive awards delivered in 2012. For additional commentary regarding the compensation of Mr. House, see “NEO Compensation Determinations for 2012”. |
| Other NEO Compensation: In 2012, compensation for the NEOs decreased from 2011 due to the EAPP payout at 93.8% of target and the P+RSU award at 93.1% of target. Mr. Clanachan’s compensation increased in 2012 due to his additional responsibilities as Chief Operating Officer. |
53
Table of Contents
Incentive Plan Awards
Outstanding Share-Based Awards and Option-Based Awards
The following table lists all option-based or share-based awards outstanding as of December 30, 2012 that have been made to the NEOs of the corporation.
| Option-Based Awards | Share-Based Awards(6) | |||||||||||||||||||||||||||
| Name |
Grant Date | Number of securities underlying unexercised Options (#)(1) |
Option exercise price ($)(2) |
Option expiration date |
Value of unexercised in-the-money Options ($)(3) |
Number of shares or units of shares that have not vested (#)(4) |
Market or payout value of share- based awards that have not vested ($)(5) |
|||||||||||||||||||||
| Paul D. House |
May 15, 2012 | n/a | n/a | n/a | n/a | 37,769 | $1,832,190 | |||||||||||||||||||||
| Feb 28, 2012 | n/a | n/a | n/a | n/a | 35,581 | $1,726,018 | ||||||||||||||||||||||
| May 17, 2011 | n/a | n/a | n/a | n/a | 4,492 | $ 217,884 | ||||||||||||||||||||||
| May 18, 2010 | 19,532 | $35.23 | May 15, 2017 | $ 259,385 | — | — | ||||||||||||||||||||||
| May 15, 2009 | 40,783 | $28.87 | May 15, 2016 | $ 800,978 | No grant | No grant | ||||||||||||||||||||||
| May 15, 2008 | 39,393 | $33.02 | May 15, 2015 | $ 610,198 | — | — | ||||||||||||||||||||||
|
|
|
|
|
|
|
|
|
|||||||||||||||||||||
| Total | 99,708 | $1,670,561 | 77,842 | $3,776,092 | ||||||||||||||||||||||||
| Cynthia J. Devine |
May 15, 2012 | 26,216 | $54.95 | May 15, 2019 | — | 5,803 | $ 281,513 | |||||||||||||||||||||
| May 17, 2011 | 25,399 | $45.76 | May 15, 2018 | $ 69,847 | 7,074 | $ 343,180 | ||||||||||||||||||||||
| May 18, 2010 | 23,052 | $35.23 | May 15, 2017 | $ 306,131 | — | $ — | ||||||||||||||||||||||
| May 15, 2009 | 15,362 | $28.87 | May 15, 2016 | $ 301,710 | No grant | No grant | ||||||||||||||||||||||
|
|
|
|
|
|
|
|
|
|||||||||||||||||||||
| Total | 90,029 | $ 677,688 | 12,877 | $ 624,693 | ||||||||||||||||||||||||
| David F. Clanachan |
Aug 14, 2012 | 4,827 | $50.24 | May 15, 2019 | — | 1,004 | $ 48,680 | |||||||||||||||||||||
| May 15, 2012 | 21,847 | $54.95 | May 15, 2019 | — | 4,836 | $ 234,611 | ||||||||||||||||||||||
| May 17, 2011 | 21,166 | $45.76 | May 15, 2018 | $ 58,206 | 5,895 | $ 285,992 | ||||||||||||||||||||||
| May 18, 2010 | 23,052 | $35.23 | May 15, 2017 | $ 306,131 | — | — | ||||||||||||||||||||||
|
|
|
|
|
|
|
|
|
|||||||||||||||||||||
| Total | 70,892 | $ 364,337 | 11,735 | $ 569,283 | ||||||||||||||||||||||||
| William A Moir |
May 15, 2012 | 21,847 | $54.95 | May 15, 2019 | — | 4,836 | $ 234,610 | |||||||||||||||||||||
| Aug 16, 2011 | 4,107 | $45.84 | May 15, 2018 | $ 10,966 | 1,019 | $ 49,415 | ||||||||||||||||||||||
| May 17, 2011 | 17,487 | $45.76 | May 15, 2018 | $ 48,089 | 4,871 | $ 236,282 | ||||||||||||||||||||||
| May 18, 2010 | 23,052 | $35.23 | May 15, 2017 | $ 306,130 | — | — | ||||||||||||||||||||||
| May 15, 2009 | 30,762 | $28.87 | May 15, 2016 | $ 604,166 | No grant | No grant | ||||||||||||||||||||||
| May 15, 2008 | 20,189 | $33.02 | May 15, 2015 | $ 312,728 | — | — | ||||||||||||||||||||||
|
|
|
|
|
|
|
|
|
|||||||||||||||||||||
| Total | 117,444 | $1,282,079 | 10,726 | $ 520,307 | ||||||||||||||||||||||||
| Roland M. Walton |
May 15, 2012 | 21,847 | $54.95 | May 15, 2019 | — | 4,836 | $ 234,610 | |||||||||||||||||||||
| May 17, 2011 | 21,166 | $45.76 | May 15, 2018 | $ 58,206 | 5,896 | $ 285,992 | ||||||||||||||||||||||
| May 18, 2010 | 23,052 | $35.23 | May 15, 2017 | $ 306,130 | — | — | ||||||||||||||||||||||
| May 15, 2009 | 30,762 | $28.87 | May 15, 2016 | $ 604,166 | No grant | No grant | ||||||||||||||||||||||
| May 15, 2008 | 20,189 | $33.02 | May 15, 2015 | $ 312,728 | — | — | ||||||||||||||||||||||
|
|
|
|
|
|
|
|
|
|||||||||||||||||||||
| Total | 117,016 | $1,281,230 | 10,732 | $ 520,602 | ||||||||||||||||||||||||
| (1) | Represents the number of outstanding options/SARs granted to the NEOs since 2008. The options/SARs vest in equal installments on the first, second, and third anniversaries of the grant date and expire on the seventh anniversary of the grant date, absent death, disability, retirement, or termination. In March 2009, the HRCC reviewed the practice of including a tax premium assumption in the Black-Scholes methodology for valuing options/SARs and determined to discontinue the practice, which resulted in a lower Black-Scholes value. As a result, approximately 40% more options/SARs were granted in 2009 than if the tax premium assumption had continued to be applied. |
54
Table of Contents
| (2) | For grants made in 2009 and 2008, the exercise price is the mean of the high and low stock price of our common shares on the TSX (the “fair market value” as defined under the 2006 Plan) on the date of grant. In October 2009, the exercise price of options/SARs granted became the closing price of our common shares as reported on the TSX for the trading day immediately preceding the grant date (also “fair market value” under the 2006 Plan). |
| (3) | The value of unexercised, in-the-money options is equal to the difference between the exercise price and the closing price of our common shares on the TSX on December 28, 2012 of $48.51. |
| (4) | Represents the number of P+RSUs and/or RSUs granted to the NEOs that had not vested as of December 30, 2012, plus unvested dividend equivalent rights (“DERs”). Each NEO automatically accumulates additional RSUs on outstanding RSUs each time we pay a dividend on our common shares to shareholders. In 2012, dividends were declared quarterly at a rate of $0.21 per share (or per RSU). These additional RSUs vest at the same time as the underlying RSUs to which they relate. The value of these DERs is set forth in the Components of All Other Compensation Table in Note (6) to the Summary Compensation Table. DERs do not accrue until after the performance condition is satisfied and the P+RSUs are granted (as RSUs). |
| P+RSUs, based on the financial results of the prior completed fiscal year, were not granted in May 2009 as the 2008 EBIT performance target was not met. |
| (5) | The market or payout value of share-based awards is based on the closing price of our common shares on the TSX on December 28, 2012 of $48.51. |
| (6) | The NEOs currently do not have any vested share-based awards that have not been paid out or distributed. |
Incentive Plan Awards—Value Vested or Earned During the Year
The following table lists, with respect to each NEO, the value of all option-based and share-based awards that have vested, and all non-equity incentive plan compensation earned, during the fiscal year ended December 30, 2012.
| Name |
Option- based awards— Value vested during the year ($)(1) |
Share- based awards— Value vested during the year ($)(2) |
Non-equity incentive plan compensation— Value earned during the year ($)(3) |
|||||||||
| Paul D. House |
$482,928 | $235,847 | $938,000 | |||||||||
| Cynthia J. Devine |
$496,755 | $278,344 | $469,000 | |||||||||
| David F. Clanachan |
$483,788 | $278,344 | $469,000 | |||||||||
| William A. Moir |
$484,993 | $278,344 | $469,000 | |||||||||
| Roland M. Walton |
$483,788 | $278,344 | $469,000 | |||||||||
| (1) | Represents the total value of options/SARs that vested in 2012 based on the closing price of our common shares on the TSX on the business day immediately preceding the vesting date (May 14, 2012) of $54.95. One-third of the options/SARs granted on May 17, 2011, two-thirds of the options/SARs granted on May 18, 2010, and 100% of the options/SARs granted on May 15, 2009, have vested. None of the options/SARs granted in 2012 had vested as of January 1, 2013. Based on the December 28, 2012 closing share price on the TSX of $48.51, the value of option-based awards that vested in 2012 was $353,452 for Mr. House, $326,714 for Ms. Devine, $323,117 for Mr. Moir and $322,833 for Messrs. Clanachan and Walton. |
| (2) | Consists of awards of P+RSUs made in May 2010 which vested 100% in November 2012 at a settlement price of $45.75. |
| (3) | Represents the total value of annual cash incentive awards under the EAPP for 2012 at a payout of 93.8%. These amounts are also reported in the Summary Compensation Table. |
55
Table of Contents
Defined Contribution Plans Table
The table below shows the accumulated value at the beginning and end of the fiscal year ended December 30, 2012 for each NEO participating in the DCPP. Contributions for the Savings Plan are not included in this table, but are described below and reported in the Summary Compensation Table under the heading “All Other Compensation”.
| Name |
Accumulated value at start of year ($) |
Compensatory ($)(1) |
Accumulated value at year end ($)(2) |
|||||||||
| Paul D. House |
$610,692 | $17,014 | $668,392 | |||||||||
| Cynthia J. Devine |
$188,235 | $17,014 | $228,191 | |||||||||
| David F. Clanachan |
$329,849 | $17,014 | $383,816 | |||||||||
| William A. Moir |
$398,483 | $17,014 | $465,676 | |||||||||
| Roland M. Walton |
$345,321 | $17,014 | $376,632 | |||||||||
| (1) | Represents contributions made by the corporation to each NEO’s account under the DCPP during 2012. |
| (2) | Represents actual accumulated value of corporate and employee contributions and investment gains/losses as of December 30, 2012. |
For additional information on the DCPP, see “Retirement Benefits”.
Personal Supplemental Executive Retirement Savings Plan
As described under “Retirement Benefits”, after each plan year we contribute to the Savings Plan an amount for each participant who was actively employed by us on December 31 and was less than 69 years old. The participants in the Savings Plan are not permitted to make contributions to the plan. All NEOs in the Savings Plan are fully vested. Contributions made by the corporation to the NEOs’ accounts under the Savings Plan are directed to a vested account, and the amounts held in such accounts will be invested in permitted investments at the direction of the respective participant.
The table below shows the accumulated value at the beginning and end of the fiscal year ended December 30, 2012 for each NEO participating in the Savings Plan.
| Name |
Accumulated value at start of year ($) |
Compensatory ($)(1) |
Accumulated value at year end ($)(2) |
|||||||||
| Paul D. House(3) |
$ 0 | $ 0 | $ 0 | |||||||||
| Cynthia J. Devine |
$ 82,654 | $50,525 | $140,912 | |||||||||
| David F. Clanachan |
$129,900 | $52,722 | $196,369 | |||||||||
| William A. Moir |
$124,891 | $50,525 | $189,792 | |||||||||
| Roland M. Walton |
$135,953 | $50,525 | $198,667 | |||||||||
| (1) | Represents contributions made during 2012 by the corporation to each NEO’s account under the Savings Plan. Actual contributions made to the Savings Plan, as reflected in this column, were net of required withholding taxes that are the responsibility of each NEO unless directed to an RRSP. These contributions (on a gross basis) have been included in the Summary Compensation Table under the heading “All Other Compensation” for the year in which the compensation was earned. |
| (2) | Represents actual accumulated net value of corporate contributions investment gains/losses as of December 30, 2012. |
| (3) | Mr. House is not a participant in the Savings Plan. He received a cash equivalent payment of $113,338 ($60,738 net of all required tax withholdings) in February 2012 in lieu of a contribution to the Savings Plan. |
56
Table of Contents
General Description of the Tim Hortons 2012 Stock Incentive Plan
The 2012 Plan is an omnibus plan, designed to allow for a broad range of equity-based compensation awards, which affords flexibility to compensate management and employees. We believe equity compensation aligns the interests of employees with the interests of our other shareholders. The purpose of the 2012 Plan is to strengthen the corporation by providing an incentive to key employees of the corporation, and its subsidiaries, thereby encouraging them to devote their abilities and industry to the success of the corporation.
Key employees may include not only our executive officers but also other officers or employees who are able to contribute significantly to our success and growth.
Summary
The 2012 Plan provides for equity compensation awards in the form of stock options, restricted stock, stock appreciation rights, DERs, performance shares, performance units, share awards, and stock units (collectively, “Awards”) to eligible employees and non-employee directors of Tim Hortons Inc. or its subsidiaries.
The 2012 Plan authorizes up to a maximum of 2,900,000 common shares (representing 1.9% of our issued and outstanding common shares as of March 25, 2013) for grants of Awards. Common shares that have never been subject to awards granted under the 2006 Plan (described below) and remain available to be granted under the 2006 Plan as of May 10, 2012 (the “Effective Date”), as well as common shares that are subject to outstanding awards granted under the 2006 Plan but that are forfeited or otherwise cease to be subject to such awards following the Effective Date (other than to the extent they are exercised for or settled in vested and non-forfeitable common shares) shall be transferred to and may be made available as Awards under the 2012 Plan, provided that the aggregate number of common shares authorized for grants of Awards under the 2012 Plan shall not exceed 2,900,000 common shares. Accordingly, notwithstanding that the terms of the 2006 Plan shall continue to govern awards previously granted under the 2006 Plan, following the Effective Date: (i) no further awards will be made under the 2006 Plan, and (ii) an aggregate maximum of 2,900,000 common shares will be authorized under both the 2006 Plan and the 2012 Plan. As of December 30, 2012 and March 25, 2013, respectively, under the 2012 Plan, there were outstanding equity awards covering 395,644 common shares and 392,536 common shares, each of which represents less than 1% of our issued and outstanding common shares on that date. As of March 25, 2013, under both the 2012 Plan and the 2006 Plan, there were outstanding equity awards covering an aggregate of 1,400,131 common shares, which represents less than 1% of our issued and outstanding common shares on that date. The corporation’s practice has been to deliver common shares purchased through the facilities of the TSX to grantees upon the exercise of their equity awards, which does not have a dilutive effect on shareholders. Since the public company reorganization in 2009, no common shares have been issued from treasury to settle equity awards issued under the 2006 Plan or the 2012 Plan. Should the corporation alter its current practice such that common shares are issued from treasury upon a grantee’s exercise or settlement of outstanding equity awards issued under the 2006 Plan and the 2012 Plan, then a maximum of 1,400,131 common shares (representing less than 1% of our issued and outstanding common shares as at March 25, 2013) may be issued in the future, pursuant to currently outstanding equity awards.
The common shares issued to settle Awards under the 2012 Plan may be authorized but unissued shares, shares which have been acquired by or on behalf of a trust established by the corporation (or a subsidiary thereof) and held for future delivery, or shares acquired by delivery of cash to a broker to acquire shares on behalf of eligible participants, or any combination thereof. To the extent any Award expires, is cancelled, is settled in cash, or is otherwise terminated without having been exercised or payment having been made in respect of the Award, the common shares subject to that Award will be available for other Awards. Upon settlement of a stock appreciation right in common shares, the excess of the number of shares covered by the stock appreciation right over the number of common shares so issued in settlement may again be made available for other Awards. In addition, in connection with the granting of DERs, the number of shares available for Awards shall not be reduced, unless shares are issued in settlement of a DER, in which case the number of shares available for issuance under the 2012 Plan shall be reduced by the number of shares so issued.
57
Table of Contents
The 2012 Plan sets forth a number of limitations regarding the issuance of Awards to participants, including:
| (i) | no more than 50% of the common shares issued under the 2012 Plan may be issued from treasury; |
| (ii) | no more than an aggregate of 1,000,000 common shares may be made the subject of incentive stock options; |
| (iii) | the aggregate number of common shares that may be made the subject of Awards granted to non-employee directors shall not exceed 0.25% of our issued and outstanding common shares at the time of the Award, and the aggregate value of Awards granted to any one non-employee director in any calendar year shall not exceed $100,000; |
| (iv) | no more than 250,000 common shares may be made subject to options, stock appreciation rights or performance awards that are meant to qualify as performance-based compensation within the meaning of Section 162(m)(4)(C) of the Internal Revenue Code (“162(m) Awards”) granted in any calendar year to any U.S. resident grantee; |
| (v) | the aggregate dollar amount of cash and the fair market value of shares that may be made the subject of 162(m) Awards (at the time of issuance of such award) granted in any calendar year to any U.S. resident grantee shall not exceed U.S.$4,000,000 in any calendar year; |
| (vi) | the number of shares issuable to all insiders, on an aggregate basis, at any time, under all security-based compensation arrangements, may not exceed 10% of our issued and outstanding common shares; and, |
| (vii) | the number of shares issuable to all insiders, on an aggregate basis, within any one year period, under all security-based compensation arrangements, may not exceed 10% of our issued and outstanding common shares. |
For the purposes of the 2012 Plan, “fair market value” of the common shares on any relevant date is equal to the closing price of the common shares on the TSX or, if the HRCC elects on or prior to such date, the NYSE, on the trading day immediately preceding such date.
As with the 2006 Plan, we currently expect to deliver common shares acquired through the facilities of the TSX to grantees upon the exercise of their Awards. To date, no common shares have been issued from treasury to settle equity awards issued under the 2012 Plan (or, since 2009, the 2006 Plan). Should we alter this current practice such that common shares are issued from treasury upon a grantee’s exercise or settlement of outstanding equity awards granted under the 2012 Plan, then a maximum of 1,450,000 common shares (representing less than 1% of our issued and outstanding common shares as at March 25, 2013) may be issued in the future to settle Awards.
Awards Available under the 2012 Plan
Restricted Stock. The 2012 Plan provides for Awards of restricted stock, which will contain such restrictions, terms and conditions as the HRCC shall determine. Unless the HRCC determines otherwise, the grantee of an Award of restricted stock will have the right to vote the shares and to receive all dividends and other distributions on the shares prior to vesting.
Stock Units. The HRCC may make Awards of stock units under the 2012 Plan, which will represent the right of the grantee to receive a payment upon the vesting of the stock unit or on any later date specified by the HRCC, equal to the fair market value of common shares as of the date the stock unit was granted, the vesting date or any other date as determined by the HRCC at the time the stock unit was granted.
Stock Options. The 2012 Plan provides for both incentive stock options as defined under Section 424 of the Internal Revenue Code and non-qualified stock options. The 2012 Plan provides that the purchase price for all common shares covered by each option granted cannot be less than 100% of the fair market value of the common shares on the date of grant, and such amount must be paid in full at the time of exercise by cash, cheque, bank draft, or by tender of other property acceptable to the HRCC. Alternatively, a grantee may elect a “sell and cover” exercise, whereby options are exercised and enough shares are sold to cover the full amount of the option exercise price and applicable taxes, which amounts are paid to the corporation, with the grantee retaining the remaining shares.
58
Table of Contents
The HRCC has the authority to determine the term of an option, up to a maximum of ten years (subject to the limitations described above). Furthermore, the HRCC may, subsequent to the granting of any option, extend the exercise period thereof, but it shall not be extended beyond the earlier of the latest date upon which the option could have expired by its original terms, or the tenth anniversary of the grant date of the option. Under our insider trading and window trading policies, the directors, officers, and certain employees of the corporation and its subsidiaries are not permitted to trade in our securities outside of specified “trading windows”. Unless otherwise set forth in an option agreement, if an option (other than an incentive stock option) expires outside of a trading window, then the expiration of the term of the option shall be the later of: (i) the date the option would have expired by its original terms, or (ii) the end of the tenth trading day of the immediately succeeding trading window. In no event, however, shall the option expire later than the tenth anniversary of the date of grant of the option. At any time after an option becomes exercisable, the HRCC has the right, in its sole discretion and without the consent of an optionee, to cancel the option and pay to the grantee the excess of the fair market value of the common shares covered by the option over the option exercise price at the date the HRCC provides written notice of its intention to exercise the right. Such amount may be paid in cash, in common shares or a combination thereof, as the HRCC may determine. To the extent payment is made in common shares, the number of such common shares will be determined by dividing the amount of the payment to be made by the fair market value of the common shares on the date of the notice of election to the optionee.
Stock Appreciation Rights. A stock appreciation right (“SAR”) may be granted under the 2012 Plan either alone or in conjunction with an option. A SAR related to an option generally terminates upon the expiration, forfeiture or exercise of the related option, and is exercisable only to the extent that the related option is exercisable. The HRCC will determine the exercisability, vesting and duration of a SAR unrelated to an option, provided that the maximum term of a SAR may not exceed ten years. Upon the exercise of a SAR related to an option, the related option will be canceled to the extent of the number of shares for which the SAR is exercised, and, upon the exercise of an option issued in conjunction with a SAR, the related SAR will be canceled to the extent of the number of shares for which the option is exercised. Upon exercise of a SAR, the grantee will receive, in the discretion of the HRCC, cash, common shares, or a combination of both in an amount determined by multiplying: (i) the excess of the fair market value of common shares on the date the SAR was exercised over the option price (or, for SARs unrelated to an option, over the fair market value of the common shares on the date the SAR was granted), by (ii) the number of shares as to which the SAR is being exercised.
Performance Shares. Performance shares are common shares issued to eligible individuals under the 2012 Plan, which shares will become vested on the terms, conditions and satisfaction of performance objectives as the HRCC may determine. Unless the HRCC determines otherwise, the grantee of an Award of performance shares will have the right to vote the performance shares and to receive all dividends and other distributions on the performance shares prior to vesting.
Performance Units. The HRCC may grant performance units to eligible individuals under the 2012 Plan. The value of a performance unit may be denominated in common shares or a specified dollar amount. Each performance unit will represent the right to receive, in the case of share-denominated units, the fair market value of a share (or a percentage thereof (which may be more than 100%) depending on the level of performance objective attainment) on the date the performance unit was granted, the date the performance unit became vested or any other date specified by the HRCC or, in the case of dollar-denominated units, the specified dollar amount (or a percentage thereof (which may be more than 100%) depending on the level of performance objective attainment). At the time of grant, the HRCC may place a limitation on the maximum amount payable in respect of a vested performance unit. Payment may be made in common shares, cash, or a combination thereof, including restricted stock if the HRCC so determines at the time of grant.
Dividend Equivalent Rights. DERs may be granted in conjunction with an Award or as a separate Award. Grantees of DERs will be entitled to receive payments in single or multiple installments, as determined by the HRCC, equivalent to all or some portion of the cash dividends payable with respect to common shares (as specified in the applicable Award agreement). Payments may be made in cash, common shares, or a combination thereof. Amounts payable in respect of DERs may be payable currently or, if applicable, deferred until the lapsing of restrictions on the DERs or until the vesting, exercise, payment, settlement or other lapse of restrictions on the Award to which the DERs relate.
59
Table of Contents
Share Awards. The HRCC may grant an Award of common shares as additional compensation for services rendered or in lieu of cash or other compensation to which an eligible employee or non-employee director is entitled.
Administration
The 2012 Plan is administered by the HRCC. As noted above under “Human Resource and Compensation Committee”, each member of the HRCC is a non-employee director (within the meaning of SEC Rule 16b-3). The HRCC has the authority to determine the individuals to whom, and the time or times at which, Awards will be granted, the number of common shares to be subject to each Award, the terms and conditions of each Award, and the treatment of Awards granted to eligible individuals during leaves of absence. In its discretion but subject to applicable law, the HRCC may delegate to one or more persons any administrative or ministerial duties or non-material determinations under the 2012 Plan and any determinations under the 2012 Plan that do not relate to executive officers.
The HRCC cannot make any adjustment (other than in connection with a stock dividend, recapitalization, or other transaction where an adjustment is permitted or required under the terms of the 2012 Plan) or amendment where the adjustment or amendment would reduce or have the effect of reducing the exercise price of an option or stock appreciation right previously granted under the 2012 Plan, whether through amendment, cancellation, replacement grants or other means, unless our shareholders have approved the adjustment or amendment.
The 2012 Plan provides that the HRCC will determine the appropriate adjustments, if any, to outstanding Awards and the shares available for future Awards in connection with an increase or reduction in the number of shares, or any change (including in the case of a spin-off, dividend or other distribution in respect of shares, a change in value) in the shares or exchange of shares for a different number or kind of shares or other securities of the corporation or another corporation, by reason of a recapitalization, merger, consolidation, stock split, repurchase of shares, change in corporate structure or otherwise (a “Change in Capitalization”). If the grantee of an Award is entitled to new, additional or different shares of our securities or any other corporation by reason of a Change in Capitalization, the new, additional or different shares will be subject to all of the conditions, restrictions and performance criteria that were applicable to the common shares subject to the Award prior to the Change in Capitalization.
In the event we are involved in a liquidation, dissolution, merger or consolidation of the corporation, or an acquisition of all of the issued and outstanding shares by any person, unless such acquisition is a non-control transaction, outstanding Awards will be treated as provided for in the agreement entered into in connection with the transaction or, if not so provided in the agreement, grantees will be entitled to receive the same consideration that each holder of one of our common shares was entitled to receive in the transaction in respect of a common share. However, the consideration will remain subject to all of the conditions, restrictions and performance criteria which were applicable to the Awards prior to the transaction.
Additional Terms of the 2012 Plan
Change in Control. The 2012 Plan provides that, except as otherwise provided in an Award agreement or another agreement between the grantee and the corporation (or a subsidiary thereof), in the event that, within 24 months following the occurrence of a “change in control”, a grantee’s employment is terminated without cause or a grantee terminates his or her employment for good reason, then all options and SARs outstanding on the termination date, whether or not exercisable, will become immediately exercisable, the restrictions applicable to outstanding restricted stock will lapse, and stock units will become fully vested. In addition, all restrictions on outstanding performance shares and restricted stock that are intended to be performance awards will lapse, and outstanding performance units and stock units that are intended to be performance units, will become vested, in each case as if all performance objectives had been satisfied at the highest level by us and the grantee. In addition, regarding performance units and stock units that are intended to be performance awards, the grantee will be entitled to receive a cash payment within 60 days after the change in control in respect of the performance units and stock units that are intended to be performance awards, that become vested as a result of a change in control.
60
Table of Contents
Termination of Employment. The 2012 Plan contains provisions concerning the treatment of Awards upon termination of employment. These provisions will apply unless otherwise set forth in an applicable Award agreement, or unless otherwise determined by the HRCC at any time prior to or after the applicable grantee’s termination of employment, with the consent of the grantee.
Under the 2012 Plan provisions, if a grantee dies or becomes disabled, the grantee’s options and SARs will become immediately exercisable and may be exercised for a period of four years following death or disability (but in no event beyond the maximum term of the option or SAR). The grantee’s performance awards will remain outstanding, and the grantee or the grantee’s estate will be entitled to a pro rata portion of the payment otherwise payable in respect of the performance awards on the date the performance awards would have been paid if the grantee had remained employed with us or a subsidiary. Finally, the grantee’s restricted stock and stock units that are not intended to be performance awards will become immediately vested.
If a grantee’s employment is terminated by reason of such individual’s retirement, the grantee’s options and SARs will remain outstanding for a period of four years (but in no event beyond the maximum term of the option or SAR) and unvested options and SARs will continue to vest in accordance with their applicable vesting schedule. The grantee’s performance awards will remain outstanding, and the grantee will be entitled to a pro rata portion of the payment otherwise payable in respect of the Award on the date the performance awards would have been paid if the grantee had remained employed with us or a subsidiary. Finally, the grantee’s restricted stock that are not intended to be performance awards will become immediately vested, and unvested stock units that are not intended to be performance awards will continue to vest in accordance with their applicable vesting schedules.
If a grantee’s employment is terminated without cause in connection with a sale or other disposition of a subsidiary, the grantee’s options and SARs will remain outstanding for one year (but in no event beyond the maximum term of the option or SAR) and unvested options and SARs will become immediately vested on the termination date. The grantee’s performance awards will remain outstanding, and the grantee will be entitled to a pro rata portion of the payment otherwise payable in respect of the Award on the date the performance awards would have been paid if the grantee had remained employed with us or a subsidiary. Finally, the grantee’s restricted stock and stock units that are not intended to be performance awards will become immediately vested.
If a grantee’s employment terminates for any reason other than those described above, all Awards the grantee holds will be forfeited immediately unless otherwise determined by the HRCC at any time prior to or after termination with the grantee’s consent, except any vested options or SARs the grantee holds will remain exercisable for a period of 90 days following termination of employment or, in the event such grantee dies during such 90 day period, remain exercisable for a period of one year following the termination date but, in no event, beyond the maximum term of the option or SAR.
Forfeiture for Misconduct. If a grantee has used for profit or disclosed to unauthorized persons our or our subsidiaries’ confidential information or trade secrets, breached any contract with or violated any fiduciary obligation to us or our subsidiaries, or engaged in unlawful trading in our securities or securities of another company based on information gained as a result of that grantee’s employment or directorship with us or our subsidiaries, all Awards the grantee holds will automatically be forfeited, unless the HRCC determines otherwise.
Transferability. Awards granted under the 2012 Plan are generally non-transferable and, in the case of options and SARs, may be exercised, during a grantee’s lifetime, only by the grantee. However, in the case of options, if the grantee becomes incapacitated or if the option agreement so provides, the optionee’s legal representative or estate may exercise the option or SAR.
Recoupment Policy Relating to Performance-Based Compensation. All Awards or any proceeds therefrom, granted under the 2012 Plan are subject to the corporation’s (or an affiliate of the corporation’s) right to reclaim, or require forfeiture of, such payments or other amounts in the event of a financial restatement in accordance with the corporation’s Recoupment Policy Relating to Performance-Based Compensation adopted by the HRCC, as amended from time to time; or in accordance with the terms of any separate agreement between a grantee and the corporation or any affiliate of the corporation. See “Recoupment or Clawback Policy”, above.
61
Table of Contents
Plan Amendment Provision. Under the 2012 Plan, the corporation may amend, suspend, discontinue or terminate the 2012 Plan and any outstanding Awards, in whole or in part, at any time without notice to or approval by shareholders, provided, however that the following amendments to the 2012 Plan or outstanding equity awards would require the approval of both the Board and the corporation’s shareholders, unless the change results from application of the adjustment provisions of the 2012 Plan: (i) an increase in the maximum number of common shares that may be made the subject of Awards under the plan; (ii) any adjustment (other than in connection with a stock dividend, recapitalization or other transaction where an adjustment is permitted or required under the terms of the 2012 Plan) or amendment that reduces or would have the effect of reducing the exercise price of an option or SAR previously granted under the 2012 Plan, whether through amendment, cancellation or replacement grants, or other means; (iii) an increase in the express limits on certain Awards that may be made to non-employee directors and insiders under the 2012 Plan; (iv) an extension of the term of an outstanding option or SAR beyond the expiration date thereof, except as expressly set forth in the 2012 Plan for certain Awards that expire outside of an established trading window; (v) an amendment that would permit options granted under the 2012 Plan to be transferable or assignable other than for normal estate settlement purposes; and (vi) any amendment to the 2012 Plan amendment provisions, which is not an amendment made to maintain continued compliance with applicable laws or regulations, or amendments of a “housekeeping” nature. In addition to the foregoing, no change to an outstanding Award under the 2012 Plan that will materially adversely impair the rights of the grantee may be made without the consent of the grantee, unless made to maintain continued compliance with applicable laws or regulations. Examples of amendments that may be made without shareholder approval include: (i) maintaining continuing compliance with applicable laws, regulations, requirements, rules or policies of any governmental authority or stock exchange; (ii) amendments of a “housekeeping” nature, which include amendments to eliminate any ambiguity or correct or supplement any provision; (iii) changing the vesting provision of the 2012 Plan or any Award; (iv) changing the termination provisions of any Award that does not entail an extension beyond the original expiration date thereof; (v) adding a cashless exercise feature payable in securities, whether or not such feature provides for a full deduction of the number of underlying securities from the plan reserve and any amendment to a cashless exercise provision; (vi) adding a form of financial assistance and any amendment to a financial assistance provision that has been adopted; (vii) changing the process by which a grantee who wishes to exercise an Award may do so; and (viii) delegating any or all of the powers of the HRCC to administer the 2012 Plan to officers of the corporation.
Term. The 2012 Plan shall terminate and no Award may be granted or made after the tenth anniversary of the date the 2012 Plan was approved by shareholders (i.e., May 10, 2022), provided that incentive stock options may not be granted after February 23, 2022.
General Description of the Tim Hortons 2006 Stock Incentive Plan
The 2006 Plan is an omnibus plan that was designed to allow us to compensate employees in a variety of ways through a broad range of equity-based awards. The terms of the 2006 Plan are substantially similar to the 2012 Plan. As of December 30, 2012 and March 25, 2013, respectively, under the 2006 Plan, there were outstanding equity awards covering 1,088,304 common shares and 1,007,595 common shares, each of which represents less than 1% of our issued and outstanding common shares on that date. As noted above, following the Effective Date: (i) no further awards were made under the 2006 Plan (although the terms of the 2006 Plan will continue to govern awards granted prior to the Effective Date), and (ii) an aggregate maximum of 2,900,000 common shares are authorized under both the 2006 Plan and the 2012 Plan.
62
Table of Contents
Equity Compensation Plan Information
The following table sets forth, as of the end of the corporation’s last fiscal year: (a) the number of securities that could be issued upon exercise of all outstanding options/SARs and vesting of all outstanding RSUs under the corporation’s equity compensation plans, (b) the weighted average exercise price of outstanding options/SARs under such plans, and (c) the number of securities remaining available for future issuance under such plans, excluding securities that could be issued upon the exercise of outstanding options/SARs or the settlement of outstanding RSUs.
Equity Compensation Plan Information
| Plan Category |
Number of securities to be issued upon exercise of outstanding options, warrants and rights(1) (a) |
Weighted-average exercise price of outstanding options, warrants and rights(2) (b) |
Number of securities remaining available for future issuance under equity compensation plans (excluding securities reflected in column (a)) (c) | |||
| Equity compensation plans approved by securityholders |
1,483,948 | $40.73 | 1,416,052 | |||
| Equity compensation plans not approved by securityholders |
N/A | N/A | N/A | |||
|
|
|
| ||||
| Total |
1,483,948 | $40.73 | 1,416,052 | |||
|
|
|
| ||||
|
|
|
|
| (1) | Included in the 1,483,948 total number of securities in column (a) above are: (i) 312,241 RSUs, including RSUs issued as a result of P+RSUs (consisting of 162,846 and 149,395 RSUs under the 2006 Plan and the 2012 Plan, respectively), subject to vesting requirements, and dividend equivalent rights associated with the RSUs, and (ii) 1,171,707 stock options and related SARs (consisting of 925,458 and 246,249 stock options and SARs under the 2006 Plan and the 2012 Plan, respectively). Of the 1,171,707 options/SARs outstanding at December 30, 2012, only 593,554 were exercisable as of that date due to vesting requirements. Historically, SARs have been cash-settled and related options cancelled, and RSUs have been settled by way of an open market purchase by an agent of Tim Hortons on behalf of the eligible employee or by way of disbursement of shares from the TDL RSU Employee Benefit Plan Trust. |
| (2) | The average exercise price in this column is based only on stock options and related SARs because RSUs (including P+RSUs) have no “exercise price” required to be paid by the recipient upon vesting and settlement. Under the corporation’s equity grant and settlement policy, the exercise price of options/SARs is equal to the market price for such securities as of the grant date (set as the closing price of our common shares on the TSX on the business day immediately preceding the grant date). Although there is no purchase price for RSUs, the number of RSUs awarded is also determined based on the grant-date market value, as determined under the equity grant and settlement policy. |
Before making annual equity awards, the HRCC considers the impact of the new awards on such factors as dilution and overhang, as well as the burn rate of annual grants against the number of total common shares outstanding. As set forth in the table below, management considers that the corporation’s dilution, overhang, and burn rates are low by industry standards.
| Equity Award Factor |
% as of December 30, 2012 | |
| Dilution—total number of equity awards outstanding divided by the total number of common shares outstanding |
0.97% | |
| Overhang—total number of equity awards available to grant plus equity awards outstanding, divided by total number of common shares outstanding |
1.89% | |
| Burn Rate—number of equity awards issued in 2012, divided by the total number of common shares outstanding |
0.29% |
The corporation has entered into award agreements in connection with each of its RSUs (including P+RSUs) and option/SAR awards.
63
Table of Contents
Termination and Change in Control Benefits
As described under “Written Change in Control (Employment) Agreements and Post-Employment Covenants”, other than the change in control agreements with our NEOs and the employment agreement with Mr. Moir (refer to “Employment Agreement with CMO”), we do not have any employment or other agreements or arrangements that provide for payments to be made to the officers following or in connection with a termination of their employment, and we do not have a formal severance policy for the NEOs. However, the NEOs will receive certain benefits under our compensation plans and programs upon termination of employment, including in connection with a change in control, as described below. We would also be required to pay severance in accordance with applicable law upon termination of a NEO’s employment without cause.
Long-Term Incentive Plans (“LTI Plans”)
The LTI Plans (i.e. 2012 and 2006 Stock Incentive Plans) contain provisions concerning the treatment of awards upon termination of employment, including a change in control, which apply unless the HRCC determines otherwise in a separate agreement with the NEO. These provisions are as follows:
| Awards |
Termination due to Death/Disability |
Retirement | Other Termination | Change in Control(1) | ||||
| RSU (including P+RSUs) |
• Vest immediately |
• Remain outstanding
• Continue to vest in accordance with their applicable vesting schedules |
• Unvested—Forfeited, unless otherwise determined by the HRCC at any time prior to or after termination |
• If Award granted before May 2010, all restrictions on the exercise or vesting of awards lapse whether or not the executive officer remains employed by us or any successor corporation after the change in control
• If Award granted subsequent to May 2010, Award vests in accordance with normal vesting schedules after a change in control, unless a termination of employment occurs (i.e., “double trigger”) within 24 months
| ||||
| Options/SARs |
• Immediately exercisable
• May be exercised within the earlier of four years from termination or the maximum term of the option/SAR |
• Vested—Remain exercisable
• Unvested—Continue to vest in accordance with the original vesting schedule, and remain exercisable within the earlier of four years from termination or the maximum term of the option/SAR |
• Vested—Remain exercisable for 90 days, subject to extension, if expiration of the 90-day period occurs outside of the trading window
• Unvested—Forfeited, unless otherwise determined by the HRCC at any time prior to or after termination
|
|||||
| (1) | The definition of “change in control” in the LTI Plans is substantially the same as in our change in control agreements (for details, refer to “Applicable Definitions and Certain Implications” below). |
64
Table of Contents
EAPP
Under the EAPP, absent a change in control (see below), annual cash incentives are not payable unless the NEO is employed by us on the date that the payment is made (usually in February of each year). However, subject to the HRCC’s discretion, if the NEO’s employment is terminated by reason of death, disability, or retirement after the NEO reaches the age of 60 with ten years of continuous service with us prior to the end of the year for which the incentive is to be paid, he or she may be entitled to a pro rata portion (or 100%, if termination occurs after the end of the year) of the cash incentive otherwise payable for that year, when paid.
The EAPP provides that, upon the occurrence of a change in control of our corporation, the cash incentive payable to each NEO in the year of the change in control will be the greatest of: (i) the cash incentive payment received by the executive officer in the fiscal year prior to the year in which the change in control occurs, (ii) the cash incentive that would be payable in the year of the change in control assuming that the target level of performance was obtained, and (iii) the cash incentive that would be payable in the year of the change in control based on our corporation’s actual performance for that year through the date of the change in control. The definition of “change in control” in the EAPP (see below) is substantially the same as in our change in control agreements. For NEOs whose employment is terminated without cause or by the NEO for good reason in connection with a change in control, the cash incentives under the EAPP will be paid as if they had remained employed through the usual payment date under the EAPP. The definitions of “cause” and “good reason” in the EAPP are similar to those in our change in control agreements. Any payments made under the EAPP as a result of a change in control will reduce the amount payable under the NEO’s change in control agreement as short-term incentive compensation for the year in which termination occurs. The HRCC believes the approach to setting minimum guaranteed EAPP payments in the event of a change in control (as described above) is appropriate because change in control transactions can result in increased costs to us, which might adversely affect our financial results and thus the awards that would otherwise be payable to the NEOs under the EAPP, regardless of our business performance. The HRCC believes that such factors should not adversely affect cash incentive payments to be paid in the year of the change in control. See “EAPP Payout” under the Payments Following a Termination of Employment table below for quantification of these payments, which will be the same as those provided under the change in control agreements (but not duplicated) in the year in which termination occurs.
Personal Supplemental Executive Retirement Savings Plan
Absent a change in control and the occurrence of certain other events, distributions under the Savings Plan may be made after vested participants retire from employment after: (i) having attained age 60 and completed at least ten years of service, or (ii) having attained age 65. Participants are also entitled to receive distributions under the plan (after vesting requirements have been met) if: (i) their employment is terminated for any reason, (ii) they die or become disabled, (iii) they are terminated after a change in control, or (iv) other circumstances designated by the HRCC have occurred. Under the Savings Plan, participants become 100% vested in benefits accrued to them if there is a “change in control”, which is defined somewhat differently in the Savings Plan than under the change in control agreements. However, similar to the change in control agreements, payments under the Savings Plan are not triggered unless an executive’s employment is terminated following a change in control (i.e., a “double trigger”). Additionally, under both the EAPP and the Savings Plan, if a NEO’s employment is terminated without cause prior to a change in control but the executive officer can reasonably demonstrate that the termination: (i) was at the request of a third party who had indicated an intention or taken steps reasonably calculated to effect a change in control, or (ii) otherwise arose in connection with, or in anticipation of, a change in control, the termination will be treated as if it occurred after a change in control, if a change in control actually occurs.
Under the Savings Plan, a change in control means:
| • | the direct or indirect acquisition of a majority of the voting shares of our corporation or our subsidiary, The TDL Group Corp. (“TDL”), by an unaffiliated entity; |
| • | the merger or amalgamation of our corporation or TDL into an unaffiliated entity, the effect of which is that a majority of the voting shares of our corporation or TDL are acquired, directly or indirectly, by an unaffiliated entity; |
65
Table of Contents
| • | the acquisition of all or substantially all of the assets of our corporation or TDL by an unaffiliated entity; or |
| • | with respect to any participant who is and continues to be employed by a person other than our corporation or TDL, such employer ceases to be an affiliate of our corporation for any reason whatsoever. |
Notwithstanding the foregoing, the following events are deemed not to constitute a change in control under the Savings Plan:
| • | the amalgamation or merger of our corporation, TDL or an affiliate with our corporation, TDL or an affiliate; |
| • | the dissolution of our corporation, TDL or an affiliate into our corporation, TDL or an affiliate; or |
| • | the acquisition of all or substantially all of the assets or voting shares of our corporation, TDL or an affiliate by an affiliate. |
Payments Following a Termination of Employment
The following table sets forth the aggregate amounts our NEOs would have received upon a termination of employment if such termination occurred on December 30, 2012. References to Termination for “Cause” or “Without Cause” in the table below are actions that may be taken by the corporation. References to Termination Following a Change in Control for “Good Reason” in the table below are actions that may be taken by the NEOs. See the definitions, and certain related implications, provided after the table below for additional information.
As noted above, under applicable law, we may be required to pay severance to executives upon a termination by us without cause, in addition to the amounts set forth in the table below. These amounts would be negotiated on a case-by-case basis and would vary depending upon the executive’s tenure, date of separation from service with us, and other factors. As such, we have not attempted to quantify those amounts.
| Death or Disability |
Retirement/ Resignation |
Termination For Cause |
Termination Without Cause |
Termination Following a Change in Control (Without Cause or For “Good Reason”) | |||||||||||||||||||||
| Paul D. House(1) |
$ | 5,468,950 | $5,468,950 | $668,392 | $5,468,950 | $9,557,267 | |||||||||||||||||||
| Cynthia J. Devine(2) |
$ | 1,708,578 | $ 466,275 | $466,275 | $ 466,275 | $3,960,334 | |||||||||||||||||||
| David F. Clanachan(3) |
$ | 1,856,489 | $ 677,358 | $677,358 | $ 677,358 | $4,108,245 | |||||||||||||||||||
| William A. Moir(4) |
$ | 1,881,572 | $3,633,267 | $750,851 | $4,633,267 | $4,048,523 | |||||||||||||||||||
| Roland M. Walton(5) |
$ | 1,801,133 | $ 670,682 | $670,682 | $ 670,682 | $3,968,084 | |||||||||||||||||||
| (1) | For Mr. House, amount for “Death or Disability”, “Retirement/Resignation” and “Termination Without Cause” represents: $938,000 (EAPP Payout); $3,862,558 (Equity); and, $668,392 (DCPP Balance). Amount for “Termination For Cause” represents $668,392 (DCPP Balance) only. Amount for “Termination Following a Change in Control” represents: $1,000,000 (EAPP Payout); $3,862,558 (Equity); $668,392 (DCPP Balance); $3,545,000 (Cash Severance); and, $481,317 (Other Benefits). |
| (2) | For Ms. Devine, amount for “Death or Disability” represents: $469,000 (EAPP Payout); $773,302 (Equity); $97,172 (Savings Plan Current Year Contribution); and, $369,103 (Savings Plan and DCPP Balance). Amount for “Retirement/Resignation”, “Termination For Cause”; and “Termination Without Cause” represents: $97,172 (Savings Plan Current Year Contribution); and, $369,103 (Savings Plan and DCPP Balance). Amount for “Termination Following a Change in Control” represents: $526,500 (EAPP Payout); $773,302 (Equity); $97,172 (Savings Plan Current Year Contribution); $369,103 (Savings Plan and DCPP Balance); $1,913,667 (Cash Severance); and, $280,589 (Other Benefits). |
| (3) | For Mr. Clanachan, amount for “Death or Disability” represents: $469,000 (EAPP Payout); $710,131 (Equity); $97,172 (Savings Plan Current Year Contribution); and, $580,185 (Savings Plan and DCPP Balance). Amount for |
66
Table of Contents
| “Retirement/Resignation”, “Termination For Cause”; and “Termination Without Cause” represents: $97,172 (Savings Plan Current Year Contribution); and, $580,185 (Savings Plan and DCPP Balance). Amount for “Termination Following a Change in Control” represents: $526,500 (EAPP Payout); $710,131 (Equity); $97,172 (Savings Plan Current Year Contribution); $580,185 (Savings Plan and DCPP Balance); $1,913,667 (Cash Severance); and, $280,589 (Other Benefits). |
| (4) | For Mr. Moir, amount for “Death or Disability” represents: $469,000 (EAPP Payout); $661,721 (Equity); $95,383 (Savings Plan Current Year Contribution); and, $655,468 (Savings Plan and DCPP Balance). Amount for “Retirement/Resignation” represents: $469,000 (EAPP Payout); $661,721 (Equity); $95,383 (Savings Plan Current Year Contribution); $655,468 (Savings Plan and DCPP Balance); and, per Mr. Moir’s employment agreement, he is entitled to payments that he would have received if he continued his employment until August 31, 2014, which as of December 30, 2012 are as follows: $686,138 (Base Salary); $832,877 (EAPP Payout); $182,282 (Savings Plan Contribution); $12,398 (Benefits); and, $38,000 (Car Allowance). Amount for “Termination For Cause” represents: $95,383 (Savings Plan Current Year Contribution); and, $655,468 (Savings Plan and DCPP Balance). Amount for “Termination Without Cause” represents: $469,000 (EAPP Payout ); $661,721 (Equity); $95,383 (Savings Plan Current Year Contribution); $655,468 (Savings Plan and DCPP Balance); and, per Mr. Moir’s employment agreement, he is entitled to payments that he would have received if he continued his employment until August 31, 2014, which as of December 30, 2012 are as follows: $686,138 (Base Salary); $832,877 (EAPP Payout); $182,282 (Savings Plan Contribution); $12,398 (Benefits); $38,000 (Car Allowance); and, $1,000,000 (Equity Grant). Amount for “Termination Following a Change in Control” represents: $526,500 (EAPP Payout); $661,721 (Equity); $95,383 (Savings Plan Current Year Contribution); $655,468 (Savings Plan and DCPP Balance); $1,837,667 (Cash Severance); and, $271,785 (Other Benefits). |
| (5) | For Mr. Walton, amount for “Death or Disability” represents: $469,000 (EAPP Payout); $661,451 (Equity); $95,383 (Savings Plan Current Year Contribution); and, $575,299 (Savings Plan and DCPP Balance). Amount for “Retirement/Resignation”, “Termination For Cause”; and “Termination Without Cause” represents: $95,383 (Savings Plan Current Year Contribution); and, $575,299 (Savings Plan and DCPP Balance). Amount for “Termination Following a Change in Control” represents: $526,500 (EAPP Payout); $661,451 (Equity); $95,383 (Savings Plan Current Year Contribution); $575,299 (Savings Plan and DCPP Balance); $1,837,667 (Cash Severance); and, $271,785 (Other Benefits). |
For the purposes of the above table:
“EAPP Payout” under the EAPP after “Termination Without Cause” or “Termination For Good Reason” following a change in control, reduces dollar for dollar any amount payable in respect of the short-term incentive payment in the year of termination under the change in control agreements such that there is no duplication of payment. The EAPP establishes a minimum short-term incentive payment under the EAPP for the year in which the change in control occurs. Reported amounts reflect amounts discussed in the Summary Compensation Table.
“Equity” means P+RSU/Options/SARs. The value of the unvested P+RSUs is based on the closing price of our common shares of $48.51 on the TSX on December 28, 2012. The value of unexercised, unvested, in the money options/SARs is based on the difference (or spread) between the exercise prices and the closing price of our common shares on the TSX on December 28, 2012 of $48.51, multiplied by the number of unvested options/SARs.
Included in the amounts set forth under “Termination Following a Change in Control” (“Without Cause” or for “Good Reason”), is the total value of all unvested equity awards as of December 30, 2012. “Savings Plan Current Year Contribution” represents gross contribution under the Savings Plan for the 2012 plan year made after December 31st of that year. The actual contribution by the corporation was net of all applicable withholding taxes unless directed to an RRSP. Reported amounts reflect amounts included in All Other Compensation in the Summary Compensation Table.
“Savings Plan and DCPP Balance” represents accumulated Savings Plan and DCPP amounts as of December 31st to which the NEOs are entitled in the event of termination for any reason, including following a change in control (i.e., the change in control does not result in additional payments relative to these accumulated balances).
67
Table of Contents
“Cash Severance” with respect to a termination following a change in control for each NEO consists of:
| • | a lump sum payment equal to the greater of: (i) two times the current year’s base salary, and (ii) two times the average base salary for the current year and the two prior years; and, |
| • | a lump sum payment equal to the greater of: (i) two times the current year’s target cash incentive payment under the EAPP and (ii) two times the average target cash incentive payment for the current year and the two prior years. |
Lump sums are to be paid out within 10 days of the termination date, except that, to the extent that Mr. Clanachan is subject to the taxation laws of the United States and is a “specified employee” within the meaning of Section 409A of the Internal Revenue Code and the Treasury Regulations promulgated thereunder, he will not receive any of such sums until the first business day of the seventh month following his termination date.
“Other Benefits” with respect to a termination following a change in control for each NEO consist of:
| • | a lump sum payment equal to the present value of the employer contributions the NEO would have accrued under the Savings Plan and DCPP for the two years following the change in control. Various assumptions were required in connection with determining these values, including future base salaries remaining at 2013 levels, achievement of cash incentives at “target” for 2013 and 2014 fiscal years, employer contributions to the DCPP remaining at 2013 levels, and the use of the long-term bond rate to determine present value; |
| • | continuation of life insurance and other medical and health insurance for the two years following termination; and, |
| • | payment of a monthly car allowance for the two years following termination based on a pre-determined amount for the car, gas, maintenance and insurance for the grade level of the executive officer, as established by us from time to time. |
Executives who are approved as retirement-eligible can receive EAPP awards and receive their unvested P+RSUs and options/SARs, which will continue to vest over the scheduled vesting period, upon voluntary retirement. Accordingly, we have included these amounts in the table above under the description “Retirement/Resignation” and “Termination Without Cause” (by the corporation). Ms. Devine and Messrs. Clanachan and Walton are not currently retirement-eligible; consequently, no amounts are shown as being payable pursuant to the EAPP and the LTI Plan for termination under those circumstances.
Pursuant to the change in control agreements, a NEO’s right to terminate his or her employment for “good reason” is not affected by his or her incapacity due to physical or mental illness.
Termination without “good reason” by a NEO may include retirement or resignation. NEOs who are retirement-eligible, however, may be able to receive EAPP awards if the HRCC approves.
Applicable Definitions and Certain Implications
Under our change in control agreements, a “change in control” is defined as the occurrence of any of the following events:
| • | an acquisition by any person or group of persons of shares representing more than 30% of our outstanding shares entitled to vote generally for the election of directors (excluding acquisitions made by us or a subsidiary of ours, an employee benefit plan or trust forming a part thereof established for the benefit of our employees or our subsidiaries, or any person in connection with the foregoing); |
| • | the directors who as of September 28, 2009 (the “Incumbent Board”) cease for any reason to constitute at least 70% of the directors (provided that if the election or nomination for election by shareholders of any new director |
68
Table of Contents
| was approved by at least two-thirds of the Incumbent Board, such new director shall be considered a member of the Incumbent Board, and provided further that no director will be considered a member of the Incumbent Board if he or she initially assumed office as a result of an actual or threatened proxy contest); |
| • | the consummation of a merger, consolidation or reorganization with or into our corporation or in which our securities are issued, unless such transaction is a “Non-Control Transaction”. A Non-Control Transaction is one where: (i) our shareholders before such transaction hold at least 70% of the voting power of the corporation surviving the transaction in substantially the same proportion as their ownership of voting power before the transaction; (ii) the members of the Incumbent Board immediately before such transaction constitute at least two–thirds of the board of the surviving corporation; and, (iii) no person other than our corporation, a subsidiary of ours, an employee benefit plan or trust for the benefit thereof, or any person who immediately before such transaction had beneficial ownership of at least 30% of the voting power of our corporation, has beneficial ownership of more than 30% of the voting power of the surviving corporation; |
| • | the complete liquidation or dissolution of our corporation; or, |
| • | the sale or other disposition of all or substantially all of our assets to any person (other than to a subsidiary of ours). |
Mr. Clanachan’s change in control agreement was amended effective January 1, 2009 for compliance with the requirements of Section 409A of the Internal Revenue Code, if and only to the extent applicable. As a result, to the extent Section 409A applies, the definition of “change in control” in Mr. Clanachan’s agreement deviates in certain respects from the definition set forth above.
Termination Without Cause or For Good Reason
Under the change in control agreements, a NEO will receive the benefits noted in the above table if we (or a successor corporation) terminate the NEO’s employment without cause or if the NEO terminates his or her employment with us (or a successor corporation) for “good reason”. “Good reason” means the occurrence after a change in control of any of the following events or conditions:
| • | a change in the NEO’s status, title, position or responsibilities which, in the NEO’s reasonable judgment, does not represent a promotion from his or her status, title, position or responsibilities in effect immediately prior thereto; |
| • | the assignment to the NEO of any duties and responsibilities which, in the NEO’s reasonable judgment, are inconsistent with his or her status, title, position, or responsibilities; |
| • | any removal of the NEO from or failure to reappoint or reelect him or her to any such positions (except in connection with a termination for disability, cause, as a result of his or her death, or by the NEO other than for good reason); |
| • | a reduction in the NEO’s base salary; |
| • | we (or a successor corporation) require the NEO to be based more than 50 kilometers from the NEO’s business office location immediately prior to the change in control (except for reasonably required business travel that is not materially greater than such travel requirements prior to the change in control); |
| • | the failure to provide the NEO with compensation and benefits substantially similar (in terms of benefit levels and/or reward opportunities) to those provided prior to the change in control or the taking of any action by the employer that would directly or indirectly materially reduce any benefit or deprive the NEO of any material benefit enjoyed by him or her prior to the change in control; or, |
| • | any material breach by us (or a successor corporation) of the change in control agreement. |
69
Table of Contents
Termination For Cause
If a NEO is terminated for cause at any time, the NEO will receive only his or her base salary and accrued vacation pay to the termination date, plus any other benefits or compensation that have been earned or become payable prior to that date.
Under the change in control agreements, “cause” means that the NEO:
| • | willfully and continually fails to substantially perform his or her duties to us (other than a failure resulting from the NEO’s incapacity due to physical or mental illness) for at least 14 days after we have notified the NEO that he or she is not substantially performing such duties; |
| • | willfully engages in conduct that is demonstrably and materially injurious to us; or |
| • | otherwise materially breaches his or her employment agreement with us, including by voluntarily terminating employment with us. |
A NEO’s action or failure to act will be “willful” if the NEO acts (or fails to act) without good faith and without a reasonable belief that the action or failure to act was in our best interest.
Payments Upon Death
If a NEO dies during the two years following a change in control, the NEO’s beneficiaries will be entitled to receive his or her base salary and accrued vacation pay through the date of death, plus any other benefits or compensation that have been earned or become payable prior to that date. The NEOs’ beneficiaries would also be entitled to receive a pro rata portion of any cash incentives or other incentive awards the NEO would have received if he or she had continued employment until the end of the year, payable at the same time such cash incentives or awards are payable to other employees.
Other Provisions
The change in control agreements also contain non-competition covenants for the term of the NEOs’ employment with us and further impose confidentiality obligations on the NEOs both during and after termination of their employment. The NEOs will also be required to pre-clear with us any trades in our securities for one year after termination of their employment to confirm compliance with our insider trading policies and applicable law. The Executive Chairman and President and CEO, Mr. House, has also entered into a post-employment covenant agreement. Mr. Moir has also entered into an employment agreement and a post-employment covenant agreement. See “Written Change in Control (Employment) and Post-Employment Covenants” for additional details.
70
Table of Contents
Director Compensation
The Board has approved a compensation program for our directors that rewards directors, through retainers and meeting fees, for the time and effort they are expected to spend on corporation matters. Additionally, our director compensation program places a significant emphasis on aligning the interests of directors with the interests of our shareholders by requiring compliance with stock ownership guidelines and providing that two-thirds of the directors’ annual retainer be paid in equity, until such stock ownership guidelines are achieved.
Under our director compensation program, during 2012, all of our directors received, in addition to meeting fees and any committee retainers, an annual cash retainer of $30,000 and an additional $60,000 annual retainer that must be taken as equity until the director stock ownership guidelines are satisfied. The committee retainer is $3,000 per year for serving as a member of a committee, other than as Chair. The Audit Committee Chair and HRCC Chair retainer fees are $15,000 per year and $12,000 per year, respectively, and the retainer for the Chair of the Nominating Committee, when not also serving as Lead Director, is $8,000 per year. The annual retainer for the Lead Director, who also serves as the Chair of the Nominating Committee, is $108,000 per year, reflecting the increased workload and relative contribution of the Lead Director over time, with particular emphasis on, and consideration of, Board leadership of succession planning, oversight of strategic and business planning, and significant direct involvement with senior members of management. Meeting fees are currently $1,500 per meeting ($750 for telephonic meetings).
Until stock ownership guidelines are achieved, directors must receive their annual equity retainer ($60,000) in DSUs granted pursuant to our Non-Employee Director Deferred Stock Unit Plan. DSUs are notional shares that track the value of our common shares and are settled in cash based on the value of our common shares on the TSX upon the director’s separation of service with us. DERs accompany the DSUs. DERs represent the right to receive an amount of additional DSUs equal to the cash dividends that would be paid if the DSUs held by a director were common shares. Directors may elect to receive their Board retainers, committee retainers, and meeting fees (and, after stock ownership guidelines are achieved, their equity retainer) in cash, DSUs, or a combination of both.
The following table sets forth the compensation paid to or earned by the independent members of the Board for the fiscal year ended December 30, 2012. All of the share-based awards represent DSUs which vest upon grant, but do not settle until a director’s separation from service with us.
| Director |
Fees Earned ($)(1) |
Share-Based Awards ($)(2)(4) |
Sub-Total ($) |
All Other Compensation ($)(3)(4) |
Total ($) |
|||||||||||||||
| M. Shan Atkins |
$114,750 | $ 0 | $114,750 | $ 8,718 | $123,468 | |||||||||||||||
| Michael J. Endres |
$ 0 | $117,000 | $117,000 | $ 13,425 | $130,425 | |||||||||||||||
| Moya M. Greene |
$ 24,750 | $ 90,000 | $114,750 | $ 9,808 | $124,558 | |||||||||||||||
| The Hon. Frank Iacobucci |
$129,750 | $ 90,000 | $219,750 | $ 23,314 | $243,064 | |||||||||||||||
| John A. Lederer |
$ 0 | $113,250 | $113,250 | $ 15,586 | $128,836 | |||||||||||||||
| David H. Lees |
$ 0 | $114,000 | $114,000 | $ 15,474 | $129,474 | |||||||||||||||
| Ronald W. Osborne |
$ 45,000 | $ 60,000 | $105,000 | $ 8,157 | $113,157 | |||||||||||||||
| Wayne C. Sales |
$ 0 | $123,750 | $123,750 | $ 15,452 | $139,202 | |||||||||||||||
| Catherine L. Williams(5) |
$ 0 | $ 51,000 | $ 51,000 | $ 1,973 | $ 52,973 | |||||||||||||||
|
|
|
|||||||||||||||||||
| Total: | $1,185,157 | |||||||||||||||||||
| (1) | Amounts listed under “Fees Earned” represent cash payments made to directors, in accordance with their elections. |
| (2) | Amounts listed under “Share-Based Awards” represent the amount of fees awarded in DSUs in accordance with each director’s election. |
| (3) | These amounts represent the value, as at the date dividends were paid, of DERs that accumulated on each director’s outstanding DSUs during 2012 as a result of the 2012 quarterly dividends of $0.21 per common share paid in March, June, September, and December. |
71
Table of Contents
| (4) | DSUs vest upon grant, but are not payable until a director’s separation from service with us. Amounts in the table below represent the value of all DSUs that have vested during 2012, using the values of such awards on the date of grant. These values represent the combination of amounts in the “Share-Based Awards” column and the “All Other Compensation” column in the table above. The amounts will vary among the directors based on their respective compensation elections, as described above. |
| Director |
Total Value of DSUs Vested During the Year | |
| M. Shan Atkins |
$ 8,718 | |
| Michael J. Endres |
$130,425 | |
| Moya M. Greene |
$ 99,808 | |
| The Hon. Frank Iacobucci |
$113,314 | |
| John A. Lederer |
$128,836 | |
| David H. Lees |
$129,474 | |
| Ronald W. Osborne |
$ 68,157 | |
| Wayne C. Sales |
$139,202 | |
| Catherine L. Williams |
$ 52,973 |
| (5) | Ms. Williams resigned as a director of the corporation effective as of May 10, 2012. As a result, we paid her $551,323.84 in May 2012, representing the accumulated value of vested DSUs as of the date of her separation from service with us. |
The fees noted above and the DERs represent all payments to our directors in 2012, other than reasonable expense reimbursements. We did not provide for any amounts to be set aside as retirement benefits for our directors. No director who is also an officer of the corporation (i.e., Mr. House) receives any compensation for his or her service as a director.
Director Stock Ownership Guidelines
Under our Governance Guidelines, directors are required to maintain stock ownership (which, for this purpose, includes DSUs) with a value equal to three times their annual cash and equity retainers for Board service (currently $90,000, for a total of $270,000). Once the stock ownership guidelines have been met, directors may elect to receive their annual equity retainers ($60,000) in cash, DSUs, or a combination of both. Our guidelines allow directors five years after their initial appointment to achieve the required ownership level. As of March 25, 2013, all of our directors had holdings in excess of the stock ownership guidelines requirements.
The HRCC reviews compliance with our stock ownership guidelines for directors annually, most recently in early 2013. In addition, the HRCC periodically reviews the appropriateness of the levels and other considerations for director stock ownership guidelines, with the most recent review in early 2013. As a result of this review, the HRCC determined that the existing level and related terms for director stock ownership guidelines were appropriate, with no amendments required. More detail regarding our stock ownership guidelines for directors is contained in our Governance Guidelines, which are available on our corporate and investor website at www.timhortons-invest.com.
Our insider trading and window trading policies provide that directors are strictly prohibited from engaging in any hedging or monetization transactions, or from pledging any of their securities as collateral.
72
Table of Contents
| Item 12. | Security Ownership of Certain Beneficial Owners and Management and Related Stockholder Matters |
Equity Compensation Plan Information
See Item 11 – “Executive and Director Compensation—Equity Compensation Plan Information” for information regarding our equity compensation plans.
Voting Securities and Their Principal Holders
The following table sets forth information with respect to the shareholders known to us, based on our review of public filings as of March 25, 2013, to own beneficially, directly or indirectly, or exercise control or direction over, more than 5% of the issued and outstanding common shares of the corporation:
| Title of Class |
Name and Address of Beneficial Holder |
Amount and Nature of Beneficial Ownership/Control /Direction |
Percent of Class | |||
| Common Shares |
FMR LLC and a joint filer(1) 82 Devonshire Street Boston, MA 02109 |
15,280,859(1) | 9.96%(2) | |||
| Common Shares |
T. Rowe Price Associates, Inc.(3) 100 E. Pratt Street Baltimore, MD 21202 |
7,843,515(3) | 5.11%(2) |
| (1) | Information based solely on the Schedule 13G/A filed with the SEC on February 14, 2013 by FMR LLC (“FMR”). Fidelity Management & Research Company (“Fidelity”), 82 Devonshire Street, Boston, Massachusetts 02109, a wholly-owned subsidiary of FMR and an investment adviser registered under Section 203 of the Investment Advisers Act of 1940, is the beneficial owner of 14,277,632 common shares as a result of acting as investment adviser to various investment companies (the “funds”). The ownership of one fund, Fidelity Contrafund, amounted to 11,216,732 common shares. Fidelity Contrafund has its principal business office at 82 Devonshire Street, Boston, Massachusetts 02109. |
| Edward C. Johnson 3d and FMR, through its control of Fidelity, and the funds each has sole power to dispose of the 14,277,632 common shares owned by the funds. Members of the family of Mr. Johnson, Chairman of FMR, are the predominant owners, directly or through trusts, of 49% of the voting power of FMR and, as a result of a shareholders’ voting agreement, may be deemed, under the Investment Company Act of 1940, to form a controlling group with respect to FMR. |
| Neither FMR nor Mr. Johnson has the sole power to vote or direct the voting of the shares owned directly by the funds, which power resides with the funds’ Boards of Trustees. Fidelity carries out the voting of the shares under written guidelines established by the funds’ Boards of Trustees. |
| Strategic Advisers, Inc., 82 Devonshire Street, Boston, MA 02109, a wholly-owned subsidiary of FMR and an investment adviser registered under Section 203 of the Investment Advisers Act of 1940, provides investment advisory services to individuals. As such, FMR’s beneficial ownership includes 1,343 common shares beneficially owned through Strategic Advisers, Inc. |
| Pyramis Global Advisors, LLC (“PGALLC”), 900 Salem Street, Smithfield, Rhode Island, 02917, an indirect wholly-owned subsidiary of FMR and an investment adviser registered under Section 203 of the Investment Advisers Act of 1940, is the beneficial owner of 931,460 common shares as a result of its serving as investment adviser to institutional accounts, non-U.S. mutual funds, or investment companies registered under Section 8 of the Investment Company Act of 1940 owning such shares. Mr. Johnson and FMR, through its control of PGALLC, each has sole dispositive power over 931,460 common shares and sole power to vote or to direct the voting of 931,460 common shares owned by the institutional accounts or funds advised by PGALLC. |
| Pyramis Global Advisors Trust Company (“PGATC”), 900 Salem Street, Smithfield, Rhode Island, 02917, an indirect wholly-owned subsidiary of FMR and a bank as defined in Section 3(a)(6) of the Securities Exchange Act, is the beneficial owner of 70,424 common shares as a result of its serving as investment manager of institutional accounts owning such shares. Mr. Johnson and FMR, through its control of Pyramis Global Advisors Trust Company, each has sole dispositive power over 70,424 common shares and sole power to vote or to direct the voting of 2,000 common shares owned by the institutional accounts managed by PGATC. |
73
Table of Contents
| (2) | Based on 153,404,839 common shares outstanding as of March 25, 2013 (including the 314,334 common shares held by The TDL RSU Employee Benefit Plan Trust). |
| (3) | Information based solely upon a Schedule 13G filed with the SEC on February 12, 2013 by T. Rowe Price Associates, Inc. |
Security Ownership of Management
The following table sets forth, as of March 25, 2013, information with respect to common shares beneficially owned by each director or named executive officer (“NEO”) of the corporation, by each proposed nominee for election as a director of the corporation, and by all of our directors and executive officers as a group:
| Title of Class |
Name and address of beneficial holder(1) |
Common Shares currently held(2) |
Common Shares that can be acquired within 60 days(3) |
Total beneficial ownership |
Percent of Class | |||||||||
| Common Shares |
Paul D. House | 177,789 | 99,708 | 277,497 | * | |||||||||
| M. Shan Atkins |
1,000 | — | 1,000 | * | ||||||||||
| Michael J. Endres |
52,832 | (4) | — | 52,832 | * | |||||||||
| Moya M. Greene |
— | — | — | * | ||||||||||
| The Hon. Frank Iacobucci |
6,633 | — | 6,633 | * | ||||||||||
| John A. Lederer |
15,120 | — | 15,120 | * | ||||||||||
| David H. Lees |
6,650 | (5) | — | 6,650 | * | |||||||||
| Ronald W. Osborne |
3,000 | (6) | — | 3,000 | * | |||||||||
| Wayne C. Sales |
12,030 | — | 12,030 | * | ||||||||||
| Cynthia J. Devine |
87,133 | 64,085 | 151,218 | * | ||||||||||
| David F. Clanachan |
54,089 | (7) | 46,054 | 100,143 | * | |||||||||
| William A. Moir |
141,549 | 95,321 | 236,869 | * | ||||||||||
| Roland M. Walton |
73,898 | 95,396 | 169,294 | * | ||||||||||
| All directors and executive officers as a group |
667,702 | 451,590 | 1,119,292 | * | ||||||||||
| * | Represents beneficial ownership of less than 1% of our outstanding common shares. |
| (1) | The business address for all of the directors and executive officers is Tim Hortons Inc., 874 Sinclair Road, Oakville, Ontario, Canada, L6K 2Y1, or Tim Hortons USA Inc., 4150 Tuller Road, Unit 236, Dublin, Ohio, 43017, U.S.A., as applicable. |
| (2) | The amounts reflected in this column include common shares owned directly or indirectly for which there is voting and/or investment power, including shared voting and/or investment power. Amounts reflected in this column do not include common shares acquired by executive officers with dividends paid March 19, 2013 pursuant to the Direct Share Purchase and Dividend Reinvestment Plan. See immediately below under “Ownership of Deferred Stock Units by Directors” for a listing of the number of deferred stock units (“DSUs”) owned by each director as of March 25, 2013, which are not included in the table above. |
| (3) | Amounts reflected in this column include: (i) common shares issuable or deliverable to settle restricted stock units (including restricted stock units received automatically pursuant to settlement of dividend equivalent rights) held by executive officers under the Tim Hortons Inc. 2006 Stock Incentive Plan (the “2006 Plan”), and the Tim Hortons Inc. 2012 Stock Incentive Plan (the “2012 Plan”, and collectively with the 2006 Plan, the “LTI Plans”), up to and including the May 2013 vesting of restricted stock units and dividend equivalent rights; and (ii) vested stock options with tandem stock appreciation rights (“SARs”) issued under the LTI Plans held by executive officers, including those that vest in May 2013. We have included for this purpose the gross amount of shares deliverable, but actual shares received will be less as a result of the payment of applicable withholding tax. Additionally, as required, we have provided the number of stock options with tandem SARs that may be acquired without reduction for the value of the exercise price. For additional information regarding outstanding restricted stock units and stock options with tandem SARs held by executive officers, see “Incentive Plan Awards” and Notes 2 and 3 to the Summary Compensation Table under “Executive and Director Compensation”. |
74
Table of Contents
| (4) | Includes 40,000 common shares held in two trusts, and over which Mr. Endres has voting and investment power. |
| (5) | Common shares are held jointly by Dr. Lees and his spouse with whom he shares voting and investment power. |
| (6) | Common shares are held jointly by Mr. Osborne and his spouse with whom he shares voting and investment power. |
| (7) | Certain of the common shares beneficially owned by Mr. Clanachan are held in accounts in respect of which he has shared voting and investment power with his spouse. |
For the purpose of this table, the term “executive officer” has the meaning ascribed to it under Rule 405 promulgated under the Securities Act of 1933, as amended (the “1933 Securities Act”), and National Instrument 51-102—Continuous Disclosure Obligations. The information with respect to beneficial ownership is based upon information furnished by each director or executive officer or information contained in insider reports publicly available on the System for Electronic Disclosure by Insiders.
Ownership of Deferred Stock Units by Directors
The following table sets forth the number of DSUs held by our non-employee directors as of March 25, 2013. These DSUs are not included in the number of common shares beneficially owned by directors set forth in the table above. DSUs are notional units that track the value of our common shares, with the value determined upon a director’s separation from service with us and, are ultimately, settled in cash. One DSU is equivalent in value to one common share, and DSUs carry dividend equivalent rights (“DERs”). We include DSUs in determining compliance with our stock ownership guidelines for directors. For additional information regarding outstanding DSUs held by directors, see “Executive and Director Compensation—Director Compensation”.
| Director |
Number of Deferred Stock Units | ||||
| M. Shan Atkins |
10,691 | ||||
| Michael J. Endres |
17,782 | ||||
| Moya M. Greene |
13,005 | ||||
| The Hon. Frank Iacobucci |
28,875 | ||||
| John A. Lederer |
20,387 | ||||
| David H. Lees |
20,221 | ||||
| Ronald W. Osborne |
10,627 | ||||
| Wayne C. Sales |
20,340 | ||||
75
Table of Contents
| Item 13. | Certain Relationships and Related Transactions, and Director Independence |
TRANSACTIONS INVOLVING RELATED PARTIES
Under our Governance Guidelines, the Board, after consulting with legal counsel, if necessary, determines whether conflicts of interest exist between us and any of our directors on a case-by-case basis. Directors are not permitted to vote on any issue in which they have a personal interest and are expected to disclose actual or potential conflicts to the Nominating Committee, which evaluates the matter and reports its assessment to the Board. In addition, not less than annually, each director affirms the existence or absence of any actual or potential conflicts.
Certain Transactions Involving Officers and Directors
A trust for the benefit of Paul D. House, our Executive Chairman, President and CEO, is the sole stockholder of a company that purchased a shopping center property in Tottenham, Ontario, Canada from an unrelated third party in 1998. As part of the shopping centre purchase transaction, the company now leases a Tim Hortons restaurant to one of our subsidiaries. The remaining term of the lease is two years, with two five-year renewal terms. The amount of rent paid by us to the company in fiscal 2012 was $63,000, which will also be the amount of yearly rent for the remaining two years of the original term of the lease. In our opinion, the terms of this lease are no less favourable than we could have obtained from an unrelated third party.
No person who has been a director or executive officer of the corporation at any time since the beginning of the last fiscal year, nor any proposed nominee for election as a director of the corporation, nor any associate or affiliate of any of the foregoing, has any material interest, directly or indirectly, by way of beneficial ownership of securities or otherwise, in any matter to be acted upon other than the election of directors.
Review, Approval or Ratification of Transactions with Related Parties
The Board has delegated to the Audit Committee responsibility for reviewing related party transactions. The Audit Committee has adopted a written policy pursuant to which all transactions in excess of $75,000 per fiscal year, between us or any of our direct or indirect subsidiaries, and: (i) any director or officer thereof or nominee for director thereof; (ii) any “immediate family member” of a director or officer thereof or nominee for director or officer thereof; (iii) any entity (A) in which any of the foregoing individuals has a direct or “indirect” legal or beneficial ownership interest (other than an interest that arises solely as a result of such individual’s ownership of less than 5% of the outstanding shares of a publicly traded entity), or (B) which employs any of the foregoing individuals; or, (iv) any registered or beneficial holders of greater than 5% of the total number of outstanding shares of the corporation, shall be submitted to the Audit Committee for consideration of “all relevant facts and circumstances” prior to the consummation of the transaction.
As used in the Audit Committee’s policy, the following terms have the meanings as set forth below:
“all relevant facts and circumstances” shall include, but not be limited to, the following: the nature of the related person’s interest in the transaction; the material terms of the transaction, including whether the terms of the transaction are fair to the corporation and on the same basis as would apply if the related transaction did not involve a related party; the significance of the transaction to the related person and also, if applicable, to the person or entity that is a party to the transaction; the significance of the transaction to the corporation; whether the transaction would impair the judgment of a director or executive officer to act in the best interests of the corporation; compliance with all applicable laws; and any other matters, facts, events or circumstances the Audit Committee deems appropriate;
“immediate family member” shall include: a spouse, parents, step-parents, children, step-children, siblings, aunts, uncles, nieces, nephews, cousins, mothers and fathers-in-law, sons and daughters-in-law, and brothers and sisters-in-law, including for purposes of this definition any person (other than a tenant or employee) sharing the household of an officer, director, director-nominee, employee, or any registered or beneficial holders of greater than 5% of the total number of outstanding shares of the corporation; and
“indirect” interests shall include, among other things, interests in trusts, companies or other entities which have transactions or relationships with the corporation or any of its subsidiaries (ownership of a nominal amount of another corporation’s publicly traded stock is excluded).
76
Table of Contents
Members of the Audit Committee with an interest in a transaction do not participate in the review of the transaction by the Audit Committee, and a majority vote of the disinterested members of the Audit Committee is required to approve any such transaction. If we become aware of a related party transaction that has not been approved under the policy, the matter is referred to the Audit Committee. The Audit Committee will consider “all relevant facts and circumstances” and may ratify or cause the revision or termination of the transaction. The Audit Committee reports to the Board on any significant related party transactions reviewed.
DIRECTOR INDEPENDENCE
Applicable Governance Requirements and Guidelines
The Governance Guidelines express our Board’s goal that a substantial majority of our directors satisfy the independence requirements set forth in the Governance Guidelines (the “Independence Requirements”). The Independence Requirements incorporate the listing standards of the NYSE and the rules of the CSA. The Governance Guidelines also set forth additional requirements, including that directors have no “business conflict” with the corporation. The Governance Guidelines further require that all members of the Audit Committee, the HRCC, and the Nominating Committee satisfy the Independence Requirements. Each member of the HRCC also must be a “non-employee director”, as such term is defined in Rule 16b-3 under the Exchange Act, and an “outside director”, as described under Section 162(m) of the Internal Revenue Code of 1986, as amended (the “Internal Revenue Code”). Members of the Audit Committee must also satisfy the heightened independence standards for service on audit committees established by the SEC and the rules of the CSA.
In making the affirmative determination, in February 2013, that all of our directors were independent in accordance with the Independence Requirements, except for Mr. House, the Nominating Committee and the Board considered all relevant facts and circumstances, not merely from the standpoint of the director, but also from that of any person or organization with which the director has an affiliation or association.
The independence determinations of the Nominating Committee and the Board for the director-nominees set forth herein included consideration of the following:
| • | Michael J. Endres. Mr. Endres serves on the board of directors of Huntington Bancshares, Inc. (“Huntington”). Huntington, either directly, or indirectly through affiliates or subsidiaries, provides certain banking services to us in the United States. Mr. Endres is also a member of the board of trustees of OhioHealth Corporation (“OhioHealth”), a lessor of two restaurant sites to one of the corporation’s subsidiaries. The Board concluded that Mr. Endres is not affected by his service as a Huntington director or as a trustee of OhioHealth because he is not involved in day-to-day activities of these entities and does not have any direct responsibility with respect to arrangements between these entities and us. Additionally, Mr. Endres has agreed to recuse himself from participating in meetings of the Huntington board of directors, OhioHealth’s board of trustees, and our Board if such participation would, or is reasonably likely to, present a conflict of interest. |
| • | John A. Lederer. In 2010, Mr. Lederer became the President and Chief Executive Officer of US Foods, a food distribution enterprise which also supplies quick service restaurants in the U.S. The Board considered whether Mr. Lederer’s position with US Foods would have an impact on his independence and, after review, the Board concluded that Mr. Lederer’s independence would not be affected by his relationship with US Foods. Mr. Lederer has agreed to recuse himself from participating in meetings of the US Foods board of directors and our Board if such participation would, or is reasonably likely to, present a conflict of interest. |
77
Table of Contents
| • | Ronald W. Osborne. Mr. Osborne has been the Chairman of the board of directors of Postmedia Network Canada Corp. and its subsidiary Postmedia Network Inc. (collectively, “Postmedia”) since July 2010, and is a member of the board of trustees of RioCan Real Estate Investment Trust (“RioCan”). Until resigning in May 2012, Mr. Osborne was a director of Sun Life Financial Inc. (“Sun Life”), serving as Sun Life’s Chairman until November 30, 2011. Postmedia’s operations consist of publishing properties formerly owned by Canwest Global Communications Corporation. As such, we may from time to time in the ordinary course purchase advertising space in one or more of the publications owned by Postmedia. RioCan is the lessor of various restaurant sites to the corporation’s subsidiaries. Sun Life provides the corporation with administration services for various retirement benefit plans and programs and also leases restaurant space in one downtown Toronto location to one of the corporation’s subsidiaries. The Board concluded that Mr. Osborne’s independence would not be affected by his directorships with Postmedia or RioCan, or his prior relationship with Sun Life, because, as a director or former director, he is not or was not involved in the day-to-day operating activities of these companies and does not or did not have any direct responsibility with respect to the agreements between these companies and us. Additionally, Mr. Osborne has agreed to recuse himself from participating in meetings of Postmedia or RioCan, and/or our Board if such participation would, or is reasonably likely to, present a conflict of interest. |
| • | Wayne C. Sales. Mr. Sales was Chairman of the Board of SUPERVALU INC., a grocery retailer and distributor (“SUPERVALU”) from June 2010 until March 2013, and he continues to serve on its board of directors. From July 2012 until February 2013, Mr. Sales also served as President and Chief Executive Officer of SUPERVALU. The Board considered whether Mr. Sales’ position with SUPERVALU would have an impact on his independence and, after review, the Board concluded that Mr. Sales’ independence would not be affected by his relationship with SUPERVALU. Mr. Sales has agreed to recuse himself from participating in meetings of the SUPERVALU board of directors and our Board if such participation would, or is reasonably likely to, present a conflict of interest. |
The Governance Guidelines provide that, before accepting another directorship, a director should consider whether that service will compromise his or her ability to perform his or her responsibilities to our corporation. The Board’s Governance Guidelines currently limit the number of public company boards on which our directors may serve concurrently to four other public company boards, in addition to our Board, without the prior approval of the Nominating Committee. The director also must consult with the Chair of the Nominating Committee to confirm that such new position does not create a conflict of interest with the corporation or otherwise affect the independence of the director. The Board does not have an express policy prohibiting interlocking or overlapping service by directors on more than one Board; however, interlocking relationships of directors are considered at the time of appointment of directors, either to our Board or another (interlocking) board, to confirm that no conflict of interest or impact on independence would arise due to the interlocking relationship. Additionally, no member of the Audit Committee may serve on more than three audit committees, including the Audit Committee of our Board, without Board approval. The Governance Guidelines also provide that neither the Executive Chairman nor the CEO may accept a position as a director of another public company without the consent of our Board.
Policy of Service on Board of Tim Horton Children’s Foundation. In May 2008, the Nominating Committee and Board determined that it would be in the corporation’s best interest to confirm prudent utilization of financial and other support provided by us to the Tim Horton Children’s Foundation (the “Foundation”), and, in furtherance of the corporation’s other interests associated with the Foundation, for an independent member of the Board of Directors of the corporation to also serve on the board of directors of the Foundation. The Nominating Committee and Board determined that such simultaneous service would not create a conflict of interest or impair the independence of our Board members under the Independence Requirements and, in connection therewith, the Board adopted the Policy Regarding Independence Considerations of Service on the Board of the Tim Horton Children’s Foundation. As set forth in this Policy, the
78
Table of Contents
Nominating Committee and Board based their independence determination primarily on the following factors: the corporation and its employees and restaurant owners have provided (for over 30 years), and intend to continue to provide, substantial financial and other support (e.g., accounting, legal, and a variety of other services), to the Foundation; the Foundation and the corporation are closely linked in terms of community presence and association such that the various programs and activities of the Foundation have the potential to directly affect the corporation’s brand and reputation; and, service on the Foundation’s board by one of the corporation’s independent directors is not anticipated to affect in any significant manner the nature or scope of the corporation’s ongoing support of, or involvement with, the Foundation. After the adoption of this Policy by the Board, Mr. Lederer was appointed to the board of directors of the Foundation in May 2008, and he continues to serve on that board.
Executive Sessions
Pursuant to the Company’s Governance Guidelines, unless waived by all independent directors, the independent directors schedule and hold regular executive sessions (without management present) at every Board and committee meetings. The Lead Director, The Hon. Frank Iacobucci, presides at executive sessions of the independent directors, except where the principal matters to be considered are within the scope of authority of one of the other committee chairs.
Communications with the Board of Directors
Shareholders and other interested parties may communicate with the Board of Directors or one or more directors by sending a writing addressed to the Board or to any one or more directors in care of Secretary, Tim Hortons Inc., 874 Sinclair Road, Oakville, Ontario, Canada, L6K 2Y1, in an envelope clearly marked “Shareholder and/or Other Interested Party Communication – Direct to Board of Directors” or by indicating instead the name of the specific director. The Secretary’s office will forward all such correspondence unopened to either The Hon. Frank Iacobucci, the Lead Director of the Board, or to another independent director as the Board of Directors may specify from time to time, or to the director specifically named on the outside of the envelope, if applicable. Additionally, the Board (or a committee thereof) periodically reviews the corporation’s disclosure policy to address corporate communications with shareholders, employees, regulatory authorities and the media.
79
Table of Contents
| Item 14. | Principal Accounting Fees and Services |
Audit and Other Service Fees
The following table sets forth the aggregate fees billed or expected to be billed for professional services rendered by our independent auditor, PricewaterhouseCoopers LLP (“PwC”), for 2012 and 2011, respectively (and out-of-pocket costs incurred in connection with these services):
| 2012 (in thousands) |
2011 (in thousands) |
|||||||
| Audit fees(1) |
$1,630 | $1,612 | ||||||
| Audit-related fees(2) |
398 | 497 | ||||||
| Tax fees(3) |
126 | 46 | ||||||
| All other fees(4) |
28 | 10 | ||||||
|
|
|
|
|
|||||
| Total |
$2,182 | $2,165 | ||||||
|
|
|
|
|
|||||
| (1) | Includes services rendered for the audit of our annual consolidated financial statements included in our annual reports on Form 10-K for 2012 and 2011, respectively; review of the consolidated financial statements included in our quarterly reports on Form 10-Q in 2012 and 2011, respectively; and, other audit services normally provided by PwC in connection with statutory and regulatory filings or engagements. |
| (2) | Includes assurance and related services reasonably related to the performance of the audit or review of our financial statements not reported as “audit fees”. Audit-related fees also include fees for accounting research, as well as audit and accounting services provided to our advertising funds that collect and administer funds contributed for use in advertising and promotional programs for our corporation and restaurant owners. In addition, these amounts include fees for the audit or review of the financial statements of certain of our subsidiaries and our pension funds, consultations with management as to the accounting or disclosure treatment of certain transactions and/or events, and the actual or potential impact of final or proposed accounting rules and standards. |
| (3) | For 2012 and 2011, these fees were for services related primarily to tax planning in connection with subsidiary reorganizations, transaction specific tax implications, and submissions to government authorities. |
| (4) | Includes use of PwC software by our employees for accounting research and financial reporting disclosure. |
80
Table of Contents
Audit Committee Pre-Approval of Audit and Permissible Non-Audit Services
The Audit Committee has adopted a policy under which audit and non-audit services to be rendered by our independent auditor are pre-approved. Under this policy, prior to the engagement of the independent auditor for any audit or permissible non-audit services, the engagement (i.e., services and fees) must be approved pursuant to our pre-approval policy or otherwise specifically approved by the Audit Committee. The pre-approval policy provides that the annual audit, review, or attestation engagement terms and fees are subject to the specific pre-approval of the Audit Committee. Additionally, Audit Committee approval is required, in advance, for any changes in terms, conditions, and fees resulting from modifications to audit scope, or other matters. The pre-approval policy also delineates the specific audit-related services, tax services, and other services that have been or may be approved by the Audit Committee on the basis that the performance of such services would not impair the independence of the auditor. Any other permissible services not delineated in the pre-approval policy must be separately pre-approved by the Audit Committee. The pre-approval policy also describes those services that are prohibited and may not be performed by our independent auditor. The pre-approval policy expressly prohibits the Audit Committee from delegating to management the Audit Committee’s responsibilities for pre-approving audit and non-audit services performed by our independent auditor.
No services were provided by our independent auditor in 2012 that were approved by the Audit Committee under SEC Regulation S-X Rule 2-01(c)(7)(i)(C) or National Instrument 52-110—Audit Committees, Section 2.4, which addresses certain de minimis services that may be approved by the Audit Committee after such services have been performed.
81
Table of Contents
| Item 15. | Exhibits, Financial Statement Schedules |
(b) Exhibits filed with this report are listed in the Index to Exhibits beginning on page 84.
82
Table of Contents
Pursuant to the requirements of Section 13 or 15(d) of the Securities Exchange Act of 1934, the Registrant has duly caused this report to be signed on its behalf by the undersigned, thereunto duly authorized.
| TIM HORTONS INC. | ||||||
| By: | /S/ PAUL D. HOUSE |
3/26/13 | ||||
| Paul D. House | ||||||
| President and Chief Executive Officer | ||||||
Pursuant to the requirements of the Securities Exchange Act of 1934, this report has been signed below by the following persons on behalf of the Registrant and in the capacities and on the dates indicated.
|
/S/ PAUL D. HOUSE |
3/26/13 |
/S/ CYNTHIA J. DEVINE |
3/26/13 | |||||
| Paul D. House Director, Executive Chairman of the Board and President and Chief Executive Officer |
Cynthia J. Devine Chief Financial Officer and Principal Accounting Officer |
|||||||
| /S/ M. SHAN ATKINS* |
3/26/13 | /S/ MICHAEL J. ENDRES* |
3/26/13 | |||||
| M. Shan Atkins, Director | Michael J. Endres, Director | |||||||
| /S/ MOYA M. GREENE* |
3/26/13 |
/S/ FRANK IACOBUCCI* |
3/26/13 | |||||
| Moya M. Greene, Director | Frank Iacobucci, Lead Director | |||||||
| /S/ JOHN A. LEDERER* |
3/26/13 |
/S/ DAVID H. LEES* |
3/26/13 | |||||
| John A. Lederer, Director | David H. Lees, Director | |||||||
| /S/ RONALD W. OSBORNE* |
3/26/13 | /S/ WAYNE C. SALES* |
3/26/13 | |||||
| Ronald W. Osborne, Director | Wayne C. Sales, Director | |||||||
| *By: | /S/ PAUL D. HOUSE |
3/26/13 | ||||||
| Paul D. House | ||||||||
| Attorney-in-Fact | ||||||||
83
Table of Contents
TIM HORTONS INC. AND SUBSIDIARIES
INDEX TO EXHIBITS
| Exhibit |
Description |
Where found | ||
| 2(a) | Agreement and Plan of Merger, dated August 6, 2009, by and among the Registrant, THI Mergeco Inc., and Tim Hortons Inc. | Incorporated herein by reference to Annex A of the definitive proxy statement of Tim Hortons Inc. filed with the Commission on August 17, 2009 (File No. 001-32843). | ||
| 3(a) | Articles of Incorporation of the Registrant, as amended | Incorporated herein by reference to Exhibit 3.1 to the Current Report on Form 8-K of Tim Hortons Inc. filed with the Commission on September 28, 2009 (File No. 000-53793). | ||
| 3(b) | By-Law No. 1 of the Registrant | Incorporated herein by reference to Annex C of the definitive proxy statement of Tim Hortons Inc. filed with the Commission on August 17, 2009 (File No. 001-32843). | ||
| 4(a) | Shareholder Rights Plan Agreement, dated August 6, 2009, between the Registrant and Computershare Trust Company of Canada, as Rights Agent | Incorporated herein by reference to Annex D of the definitive proxy statement of Tim Hortons Inc. filed with the Commission on August 17, 2009 (File No. 001-32843). | ||
| 4(b) | Trust Indenture, dated June 1, 2010, by and between the Registrant and BNY Trust Company of Canada, as trustee | Incorporated herein by reference to Exhibit 4.1 to the Current Report on Form 8-K of the Registrant filed with the Commission on June 1, 2010 (File No. 001-32843). | ||
| 4(c) | First Supplemental Trust Indenture, dated June 1, 2010, by and between the Registrant and BNY Trust Company of Canada, as trustee | Incorporated herein by reference to Exhibit 4.2 to the Current Report on Form 8-K of the Registrant filed with the Commission on June 1, 2010 (File No. 001-32843). | ||
| 4(d) | First (Reopening) Supplemental Trust Indenture, dated December 1, 2010, by and between the Registrant and BNY Trust Company of Canada, as trustee | Incorporated herein by reference to Exhibit 4.1 to the Current Report on Form 8-K of the Registrant filed with the Commission on December 1, 2010 (File No. 001-32843). | ||
| 4(e) | Supplement to Guarantee, dated December 1, 2010, from The TDL Group Corp. | Incorporated herein by reference to Exhibit 4.2 to the Current Report on Form 8-K of the Registrant filed with the Commission on December 1, 2010 (File No. 001-32843). | ||
| 10(a) | Senior Revolving Credit Facility Agreement, dated as of December 13, 2010, among the Registrant and The TDL Group Corp., as borrowers, and certain lenders and agents named therein | Incorporated herein by reference to Exhibit 10.1 to the Current Report on Form 8-K of the Registrant filed with the Commission on December 16, 2010 (File No. 001-32843). | ||
| 10(b) | Amendment to Senior Revolving Credit Facility Agreement, dated as of January 26, 2012, among the Registrant and The TDL Group Corp., as borrowers, and certain lenders and agents named herein | Incorporated herein by reference to Exhibit 10.1 to the Current Report on Form 8-K of the Registrant filed with the Commission on February 1, 2012 (File No. 001-32843). | ||
| *10(c) | Form of Indemnification Agreement for directors, officers and others, as applicable | Incorporated herein by reference to Exhibit 10.2 to the Current Report on Form 8-K of the Registrant filed with the Commission on September 28, 2009 (File No. 000-53793). | ||
| *10(d) | Form of Employment Agreement, as amended, by and among The TDL Group Corp., the Registrant and Paul D. House | Incorporated herein by reference to Exhibit 10.3 to the Current Report on Form 8-K of the Registrant filed with the Commission on September 28, 2009 (File No. 000-53793). | ||
| *10(e) | Form of First Amendment to Employment Agreement by and among The TDL Group Corp., the Registrant and each of Paul D. House and Donald B. Schroeder | Incorporated herein by reference to Exhibit 10(z) to Amendment No. 1 to the Annual Report on Form 10-K for the fiscal year ended January 3, 2010 filed with the Commission on April 1, 2010 (File No. 001-32843). | ||
84
Table of Contents
| Exhibit |
Description |
Where found | ||
| *10(f) | Second Amendment to Employment Agreement, dated March 22, 2012, by and between The TDL Group Corp., the Registrant and Paul D. House | Incorporated herein by reference to Exhibit 10.1 to the Current Report on Form 8-K of the Registrant filed with the Commission on March 23, 2012 (File No. 001-32843). | ||
| *10(g) | Severance Agreement and Final Release, effective as of May 31, 2011, by and between Tim Hortons Inc. and Donald B. Schroeder | Incorporated herein by reference to Exhibit 10.1 to the Current Report on Form 8-K of the Registrant filed with the Commission on June 6, 2011 (File No. 001-32843). | ||
| *10(h) | Form of Employment Agreement by and among The TDL Group Corp., the Registrant and each of Cynthia J. Devine, William A. Moir and Roland M. Walton, respectively | Incorporated herein by reference to Exhibit 10.5 to the Current Report on Form 8-K of the Registrant filed with the Commission on September 28, 2009 (File No. 000-53793). | ||
| *10(i) | Form of First Amendment to Employment Agreement by and among The TDL Group Corp., the Registrant and each of Cynthia J. Devine, William A. Moir, Roland M. Walton and David F. Clanachan, dated effective February 24, 2010 | Incorporated herein by reference to Exhibit 10(g) to the Annual Report on Form 10-K of the Registrant filed with the Commission on March 4, 2010 (File No. 001-32843). | ||
| *10(j) | Form of Employment Agreement by and among The TDL Group Corp., the Registrant and David F. Clanachan | Incorporated herein by reference to Exhibit 10.6 to the Current Report on Form 8-K of the Registrant filed with the Commission on September 28, 2009 (File No. 000-53793). | ||
| *10(k) | Form of Retention Agreement by and between the Company and David F. Clanachan, Cynthia J. Devine, William A. Moir, Roland M. Walton and certain other members of senior management | Incorporated herein by reference to Exhibit 10.1 to the Current Report on Form 8-K of the Registrant filed with the Commission on August 9, 2012 (File No. 001-32843). | ||
| *10(l) | Letter Agreement dated as of August 8, 2012 by and between the Company and William A. Moir | Incorporated herein by reference to Exhibit 10.2 to the Current Report on Form 8-K of the Registrant filed with the Commission on August 9, 2012 (File No. 001-32843). | ||
| *10(m) | Employment (and Post-Employment) Covenants Agreement dated as of August 8, 2012 by and between the Company and William A. Moir | Incorporated herein by reference to Exhibit 10.3 to the Current Report on Form 8-K of the Registrant filed with the Commission on August 9, 2012 (File No. 001-32843). | ||
| *10(n) | 2006 Stock Incentive Plan, as amended effective February 24, 2010 | Incorporated herein by reference to Exhibit 10(h) to the Annual Report on Form 10-K of the Registrant filed with the Commission on March 4, 2010 (File No. 001-32843). | ||
| *10(o) | 2012 Stock Incentive Plan | Incorporated herein by reference to Exhibit 10.1 to the Current Report on Form 8-K of the Registrant filed with the Commission on May 10, 2012 (File No. 001-32843). | ||
| *10(p) | Executive Annual Performance Plan, as amended effective August 9, 2012 | Incorporated herein by reference to Exhibit 10(a) to the Quarterly Report on Form 10-Q of the Registrant filed with the Commission on August 9, 2012 (File No. 001-32843). | ||
| *10(q) | Amended and Restated Personal Supplemental Executive Retirement Savings Plan, as amended effective February 23, 2012 | Incorporated herein by reference to Exhibit 10(m) to the Annual Report on Form 10-K of the Registrant filed with the Commission on February 28, 2012 (File No. 001-32843). | ||
| *10(r) | Amended and Restated Non-Employee Director Deferred Stock Unit Plan effective September 28, 2009, as further amended and restated effective February 21, 2013 | Filed as Exhibit 10(r) to the Annual Report on Form 10-K for the fiscal year ended December 30, 2012 of the Registrant filed with the Commission on February 21, 2013 (File No. 001-32843). | ||
| *10(s) | Equity Plan Assignment and Assumption Agreement, dated September 25, 2009, by and between Tim Hortons Inc., and the Registrant | Incorporated herein by reference to Exhibit 10.11 to the Current Report on Form 8-K of the Registrant filed with the Commission on September 28, 2009 (File No. 000-53793). | ||
85
Table of Contents
| Exhibit |
Description |
Where found | ||
| *10(t) | Assignment, Assumption and Amendment of Tim Hortons Inc. U.S. Non-Employee Directors’ Deferred Compensation Plan, dated September 25, 2009, by and between Tim Hortons Inc. and Tim Hortons USA Inc. | Incorporated herein by reference to Exhibit 10.12 to the Current Report on Form 8-K of the Registrant filed with the Commission on September 28, 2009 (File No. 000-53793). | ||
| *10(u) | Form of Amended and Restated Deferred Stock Unit Award Agreement (Canadian) | Incorporated herein by reference to Exhibit 10.13 to the Current Report on Form 8-K of the Registrant filed with the Commission on September 28, 2009 (File No. 000-53793). | ||
| *10(v) | Form of Amended and Restated Deferred Stock Unit Award Agreement (U.S.) | Incorporated herein by reference to Exhibit 10.14 to the Current Report on Form 8-K of the Registrant filed with the Commission on September 28, 2009 (File No. 000-53793). | ||
| 10(w) | Form of Tax Sharing Agreement between Tim Hortons Inc. and Wendy’s International, Inc. dated March 29, 2006 | Incorporated herein by reference to Exhibit 10.3 to Form S-1/A filed with the Commission on February 27, 2006 (File No. 333-130035). | ||
| 10(x) | Amendment No. 1 to Tax Sharing Agreement between Tim Hortons Inc. and Wendy’s International, Inc., dated November 7, 2007 | Incorporated herein by reference to Exhibit 10(b) to Form 10-Q for the quarter ended September 30, 2007 filed with the Commission on November 8, 2007 (File No. 001-32843). | ||
| *10(y) | Form of Restricted Stock Unit Award Agreement (2010 Award) | Incorporated herein by reference to Exhibit 10(a) to Form 10-Q for the quarter ended July 4, 2010 of the Registrant filed with the Commission on August 12, 2010 (File No. 001-32843). | ||
| *10(z) | Form of Nonqualified Stock Option Award Agreement (2010 Award) |
Incorporated herein by reference to Exhibit 10(b) to Form 10-Q for the quarter ended July 4, 2010 of the Registrant filed with the Commission on August 12, 2010 (File No. 001-32843). | ||
| *10(aa) | Form of Restricted Stock Unit Award Agreement (2010 Performance Award—Named Executive Officers) | Incorporated herein by reference to Exhibit 10(aa) to Amendment No. 1 to the Annual Report on Form 10-K for the fiscal year ended January 3, 2010 filed with the Commission on April 1, 2010 (File No. 001-32843). | ||
| *10(bb) | Form of Restricted Stock Unit Award Agreement (2011 Award) | Incorporated herein by reference to Exhibit 10(a) to the Quarterly Report on Form 10-Q of the Registrant filed with the Commission on August 11, 2011 (File No. 001-32843). | ||
| *10(cc) | Form of Nonqualified Stock Option Award Agreement (2011 Award) | Incorporated herein by reference to Exhibit 10(b) to the Quarterly Report on Form 10-Q of the Registrant filed with the Commission on August 11, 2011 (File No. 001-32843). | ||
| *10(dd) | Form of Restricted Stock Unit Award Agreement (2012 Award) | Incorporated herein by reference to Exhibit 10(b) to the Quarterly Report on Form 10-Q of the Registrant filed with the Commission on August 9, 2012 (File No. 001-32843). | ||
| *10(ee) | Form of Nonqualified Stock Option Award Agreement (2012 Award) | Incorporated herein by reference to Exhibit 10(c) to the Quarterly Report on Form 10-Q of the Registrant filed with the Commission on August 9, 2012 (File No. 001-32843). | ||
| *10(ff) | Acknowledgment, dated as of October 29, 2010, by and among CillRyan’s Bakery Limited, Prophy and Fosters Star Limited | Incorporated herein by reference to Exhibit 10(y) to the Annual Report on Form 10-K for the fiscal year ended January 2, 2011 filed with the Commission on February 25, 2011 (File No. 001-32843). | ||
86
Table of Contents
| Exhibit |
Description |
Where found | ||
| 21 | Subsidiaries of the Registrant | Filed as Exhibit 21 to the Annual Report on Form 10-K for the fiscal year ended December 30, 2012 of the Registrant filed with the Commission on February 21, 2013 (File No. 001-32843). | ||
| 23 | Consent of PricewaterhouseCoopers LLP | Filed as Exhibit 23 to the Annual Report on Form 10-K for the fiscal year ended December 30, 3012 of the Registrant filed with the Commission on February 21, 2013 (File No. 001-32843). | ||
| 24 | Powers of Attorney | Filed as Exhibit 24 to the Annual Report on Form 10-K for the fiscal year ended December 30, 3012 of the Registrant filed with the Commission on February 21, 2013 (File No. 001-32843). | ||
| 31(a) | Rule 13a-14(a)/15d-14(a) Certification of Chief Executive Officer | Filed as Exhibit 31(a) to the Annual Report on Form 10-K for the fiscal year ended December 30, 3012 of the Registrant filed with the Commission on February 21, 2013 (File No. 001-32843). | ||
| 31(b) | Rule 13a-14(a)/15d-14(a) Certification of Chief Financial Officer | Filed as Exhibit 31(b) to the Annual Report on Form 10-K for the fiscal year ended December 30, 3012 of the Registrant filed with the Commission on February 21, 2013 (File No. 001-32843). | ||
| 31(c) | Rule 13a-14(a)/15d-14(a) Certification of Chief Executive Officer, relating to this Amendment No. 1 on Form 10-K/A | Filed herewith. | ||
| 31(d) | Rule 13a-14(a)/15d-14(a) Certification of Chief Financial Officer, relating to this Amendment No. 1 on Form 10-K/A | Filed herewith. | ||
| 32(a) | Section 1350 Certification of Chief Executive Officer | Filed as Exhibit 32(a) to the Annual Report on Form 10-K for the fiscal year ended December 30, 3012 of the Registrant filed with the Commission on February 21, 2013 (File No. 001-32843). | ||
| 32(b) | Section 1350 Certification of Chief Financial Officer | Filed as Exhibit 32(b) to the Annual Report on Form 10-K for the fiscal year ended December 30, 3012 of the Registrant filed with the Commission on February 21, 2013 (File No. 001-32843). | ||
| 32(c) | Section 1350 Certification of Chief Executive Officer, relating to this Amendment No. 1 on Form 10-K/A | Filed herewith. | ||
| 32(d) | Section 1350 Certification of Chief Financial Officer, relating to this Amendment No. 1 on Form 10-K/A |
Filed herewith. | ||
| 99 | Safe Harbor under the Private Securities Litigation Reform Act 1995 and Canadian securities laws | Filed herewith. | ||
| 101.INS | XBRL Instance Document. | Filed as Exhibit 101.INS to the Annual Report on Form 10-K for the fiscal year ended December 30, 3012 of the Registrant filed with the Commission on February 21, 2013 (File No. 001-32843). | ||
| 101.SCH | XBRL Taxonomy Extension Schema Document. | Filed as Exhibit 101.SCH to the Annual Report on Form 10-K for the fiscal year ended December 30, 3012 of the Registrant filed with the Commission on February 21, 2013 (File No. 001-32843). | ||
| 101.CAL | XBRL Taxonomy Extension Calculation Linkbase Document. | Filed as Exhibit 101.CAL to the Annual Report on Form 10-K for the fiscal year ended December 30, 3012 of the Registrant filed with the Commission on February 21, 2013 (File No. 001-32843). | ||
87
Table of Contents
| Exhibit |
Description |
Where found | ||
| 101.DEF | XBRL Taxonomy Extension Definition Linkbase Document. | Filed as Exhibit 101.DEF to the Annual Report on Form 10-K for the fiscal year ended December 30, 3012 of the Registrant filed with the Commission on February 21, 2013 (File No. 001-32843). | ||
| 101.LAB | XBRL Taxonomy Extension Label Linkbase Document. | Filed as Exhibit 101.LAB to the Annual Report on Form 10-K for the fiscal year ended December 30, 3012 of the Registrant filed with the Commission on February 21, 2013 (File No. 001-32843). | ||
| 101.PRE | XBRL Taxonomy Extension Presentation Linkbase Document. | Filed as Exhibit 101.PRE to the Annual Report on Form 10-K for the fiscal year ended December 30, 3012 of the Registrant filed with the Commission on February 21, 2013 (File No. 001-32843). | ||
| * | Denotes management contract or compensatory arrangement. |
The financial information contained in the XBRL-related documents is “unaudited” and/or “unreviewed.”
88