Attached files
| file | filename |
|---|---|
| 8-K - WESTFIELD FINANCIAL, INC. 8-K - Western New England Bancorp, Inc. | a50592993.htm |
Exhibit 99.1

WESTFIELD FINANCIAL INC. NASDAQ: WFD SANDLER O’NEILL & PARTNERS, LP INVESTOR MEETING MARCH 19, 2013
FORWARD – LOOKING STATEMENTS Today’s presentation may contain “forward-looking statements” which may be identified by the use of such words as “believe,” “expect,” “anticipate,” “should,” “planned,” “estimated,” and “potential.” Examples of forward-looking statements include, but are not limited to, estimates with respect to our financial condition and results of operation and business that are subject to various factors which could cause actual results to differ materially from these estimates. These factors include, but are not limited to: ?general and local economic conditions; ?changes in interest rates, deposit flows, demand for mortgages and other loans, real estate values, and competition; ?changes in accounting principles, policies, or guidelines; ?changes in legislation or regulation; and ?other economic, competitive, governmental, regulatory, and technological factors affecting our operations, pricing, products, and services. Any or all of our forward-looking statements in today’s presentation or in any other public statements we make may turn out to be wrong. They can be affected by inaccurate assumptions we might make or known or unknown risks and uncertainties. Consequently, no forward-looking statements can be guaranteed. We disclaim any obligation to subsequently revise any forward-looking statements to reflect events or circumstances after the date of such statements, or to reflect the occurrence of anticipated or unanticipated events.
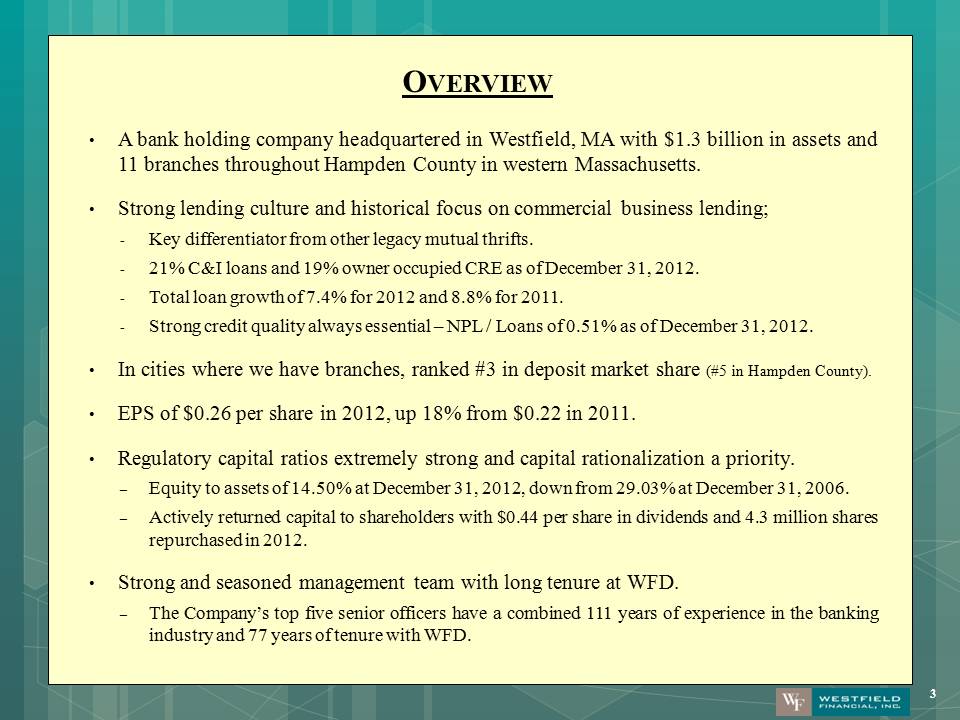
OVERVIEW A bank holding company headquartered in Westfield, MA with $1.3 billion in assets and 11 branches throughout Hampden County in western Massachusetts. Strong lending culture and historical focus on commercial business lending; -Key differentiator from other legacy mutual thrifts. -21% C&I loans and 19% owner occupied CRE as of December 31, 2012. -Total loan growth of 7.4% for 2012 and 8.8% for 2011. -Strong credit quality always essential – NPL / Loans of 0.51% as of December 31, 2012. In cities where we have branches, ranked #3 in deposit market share (#5 in Hampden County). EPS of $0.26 per share in 2012, up 18% from $0.22 in 2011. Regulatory capital ratios extremely strong and capital rationalization a priority. –Equity to assets of 14.50% at December 31, 2012, down from 29.03% at December 31, 2006. –Actively returned capital to shareholders with $0.44 per share in dividends and 4.3 million shares repurchased in 2012. Strong and seasoned management team with long tenure at WFD. –The Company’s top five senior officers have a combined 111 years of experience in the banking industry and 77 years of tenure with WFD.
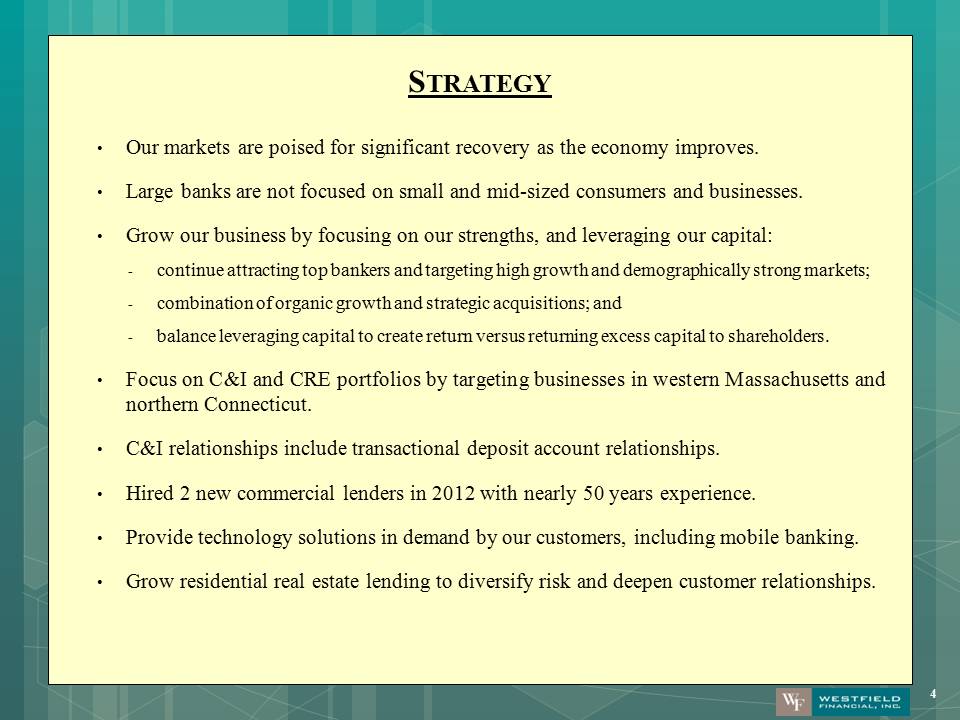
STRATEGY Our markets are poised for significant recovery as the economy improves. Large banks are not focused on small and mid-sized consumers and businesses. Grow our business by focusing on our strengths, and leveraging our capital: -continue attracting top bankers and targeting high growth and demographically strong markets; -combination of organic growth and strategic acquisitions; and -balance leveraging capital to create return versus returning excess capital to shareholders. Focus on C&I and CRE portfolios by targeting businesses in western Massachusetts and northern Connecticut. C&I relationships include transactional deposit account relationships. Hired 2 new commercial lenders in 2012 with nearly 50 years experience. Provide technology solutions in demand by our customers, including mobile banking. Grow residential real estate lending to diversify risk and deepen customer relationships.
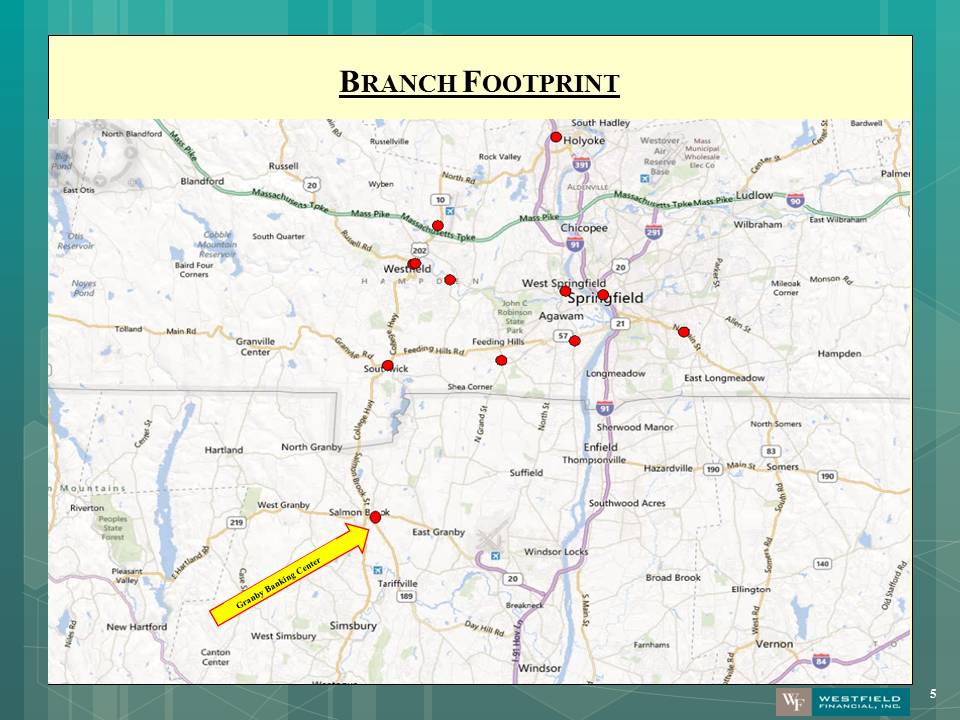
BRANCH FOOTPRINT Granby Banking Cente
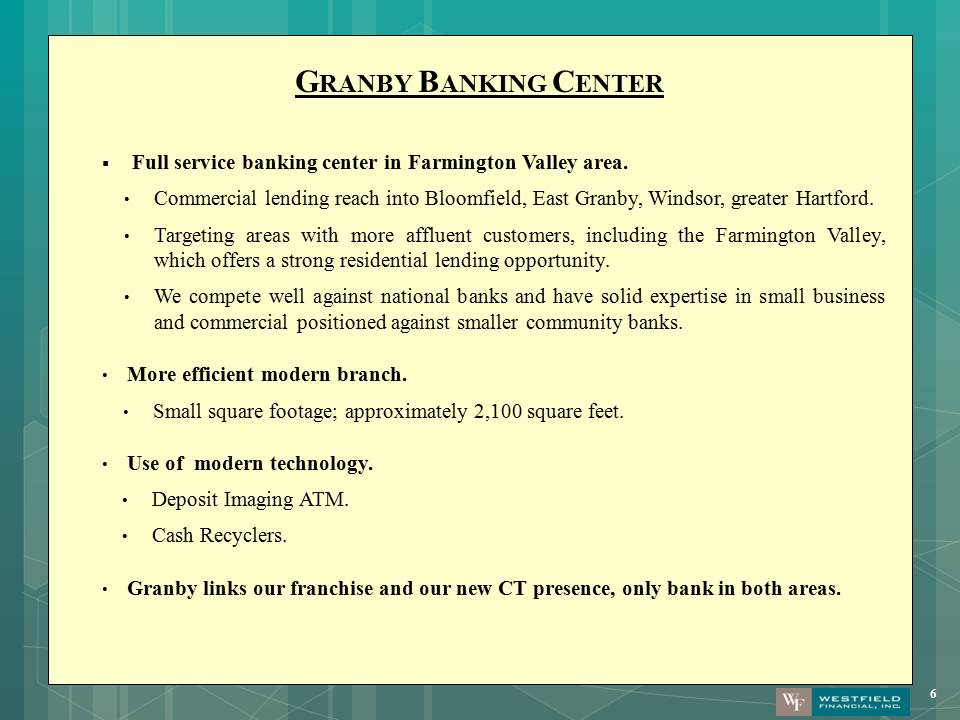
GRANBY BANKING CENTER Full service banking center in Farmington Valley area. Commercial lending reach into Bloomfield, East Granby, Windsor, greater Hartford. Targeting areas with more affluent customers, including the Farmington Valley, which offers a strong residential lending opportunity. We compete well against national banks and have solid expertise in small business and commercial positioned against smaller community banks. More efficient modern branch. Small square footage; approximately 2,100 square feet. Use of modern technology. Deposit Imaging ATM. Cash Recyclers. Granby links our franchise and our new CT presence, only bank in both areas.
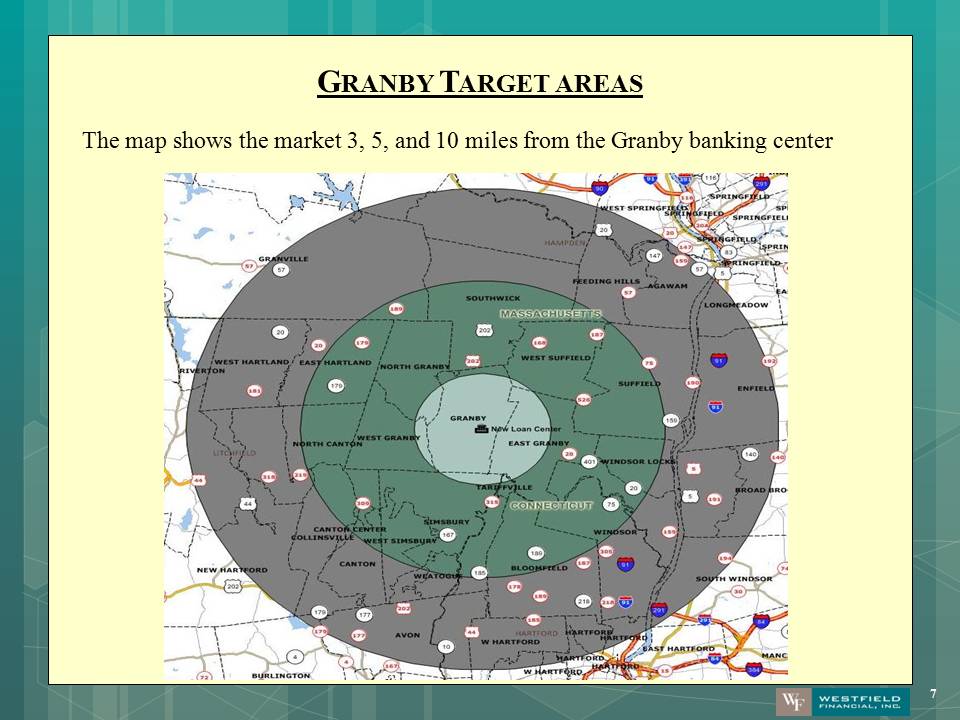
GRANBY TARGET AREAS 7 The map shows the market 3, 5, and 10 miles from the Granby banking center
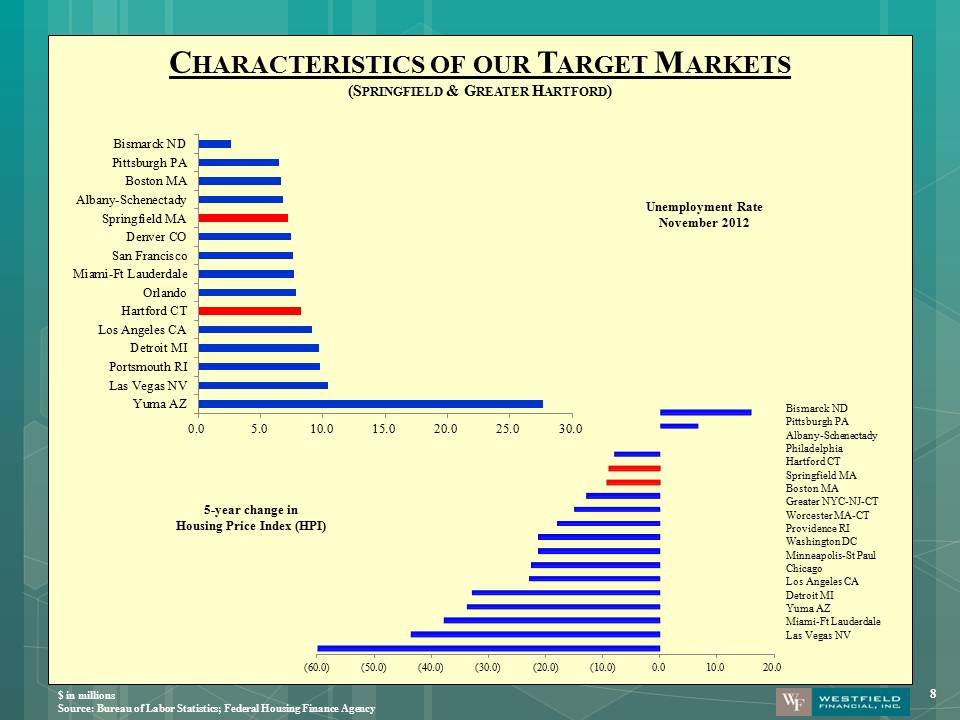
$ in millions Source: Bureau of Labor Statistics; Federal Housing Finance Agency 8 CHARACTERISTICS OF OUR TARGET MARKETS (SPRINGFIELD & GREATER HARTFORD) Unemployment Rate November 2012 (60.0)(50.0)(40.0)(30.0)(20.0)(10.0)0.010.020.0Bismarck ND Pittsburgh PA Albany-Schenectady Philadelphia Hartford CT Springfield MA Boston MA Greater NYC-NJ-CT Worcester MA-CT Providence RI Washington DC Minneapolis-St Paul Chicago Los Angeles CA Detroit MI Yuma AZ Miami-Ft Lauderdale Las Vegas NV 5-year change in Housing Price Index (HPI) 0.05.010.015.020.025.030.0Yuma AZLas Vegas NVPortsmouth RIDetroit MILos Angeles CAHartford CTOrlandoMiami-Ft LauderdaleSan FranciscoDenver COSpringfield MAAlbany-SchenectadyBoston MAPittsburgh PABismarck ND
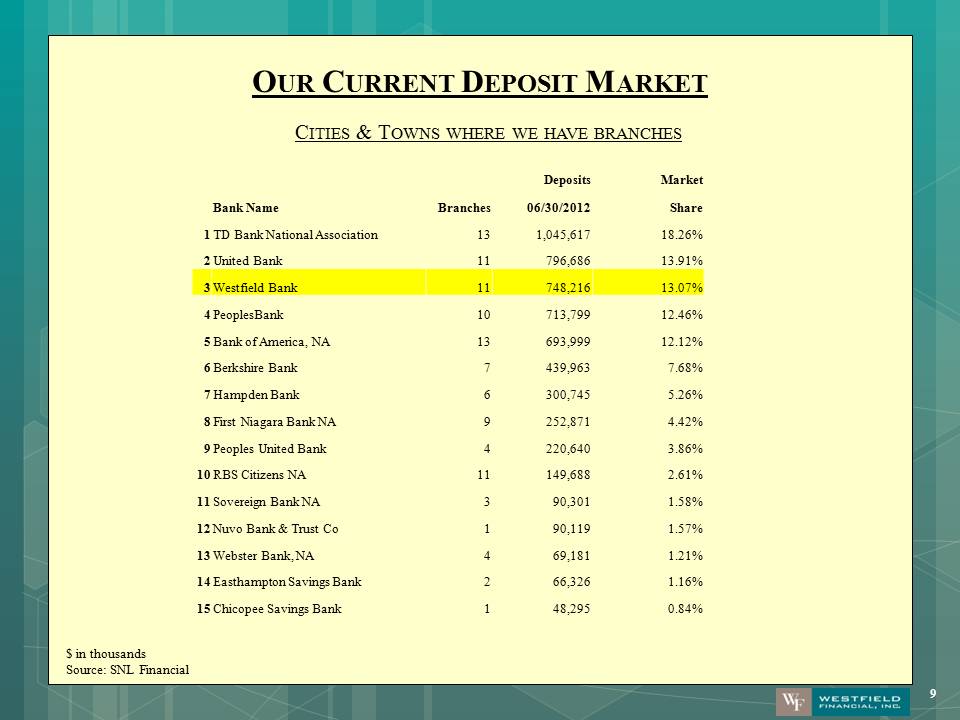
$ in thousands Source: SNL Financial 9 OUR CURRENT DEPOSIT MARKET CITIES & TOWNS WHERE WE HAVE BRANCHES Deposits Market Bank Name Branches 06/30/2012 Share 1 TD Bank National Association 13 1,045,617 18.26% 2 United Bank 11 796,686 13.91% 3 Westfield Bank 11 748,216 13.07% 4 PeoplesBank 10 713,799 12.46% 5 Bank of America, NA 13 693,999 12.12% 6 Berkshire Bank 7 439,963 7.68% 7 Hampden Bank 6 300,745 5.26% 8 First Niagara Bank NA 9 252,871 4.42% 9 Peoples United Bank 4 220,640 3.86%
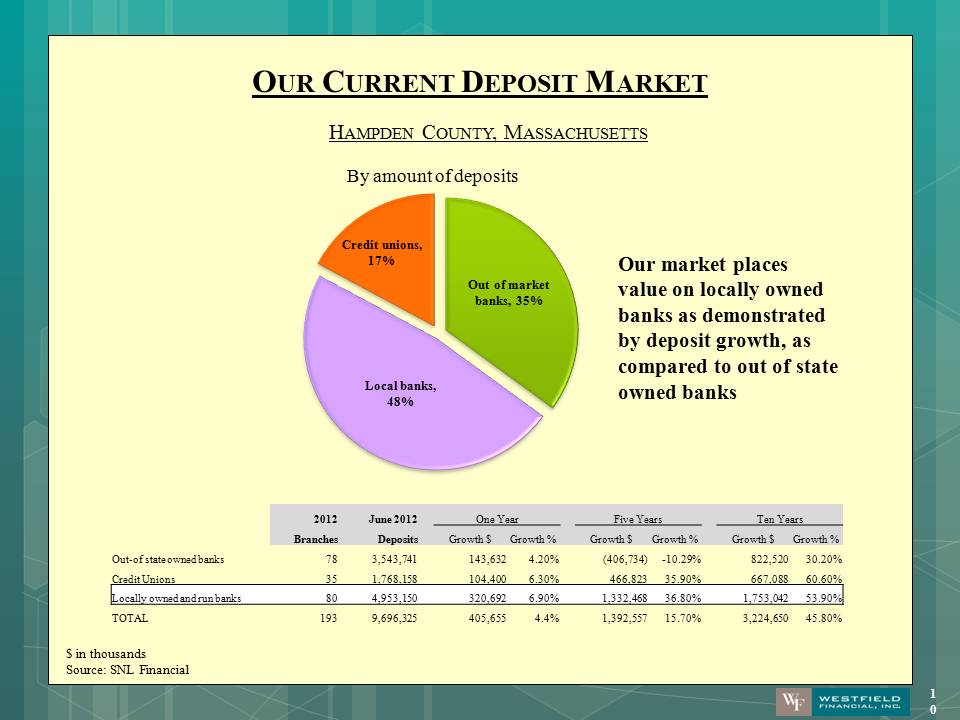
RBS Citizens NA 11 149,688 2.61% 11 Sovereign Bank NA 3 90,301 1.58% 12 Nuvo Bank & Trust Co 1 90,119 1.57% 13 Webster Bank, NA 4 69,181 1.21% 14 Easthampton Savings Bank 2 66,326 1.16% 15 Chicopee Savings Bank 1 48,295 0.84% $ in thousands Source: SNL Financial 10 OUR CURRENT DEPOSIT MARKET HAMPDEN COUNTY, MASSACHUSETTS Out of market banks, 35% Local banks, 48% Credit unions, 17% By amount of deposits 2012 June 2012 One Year Five Years Ten Years Branches Deposits Growth $ Growth % Growth $ Growth % Growth $ Growth % Out-of state owned banks 78 3,543,741 143,632 4.20% (406,734) -10.29% 822,520 30.20% Credit Unions 35 1,768,158 104,400 6.30% 466,823 35.90% 667,088 60.60% Locally owned and run banks 80 4,953,150 320,692 6.90% 1,332,468 36.80% 1,753,042 53.90% TOTAL 193 9,696,325 405,655 4.4% 1,392,557 15.70% 3,224,650 45.80% Our market places value on locally owned banks as demonstrated by deposit growth, as compared to out of state owned banks
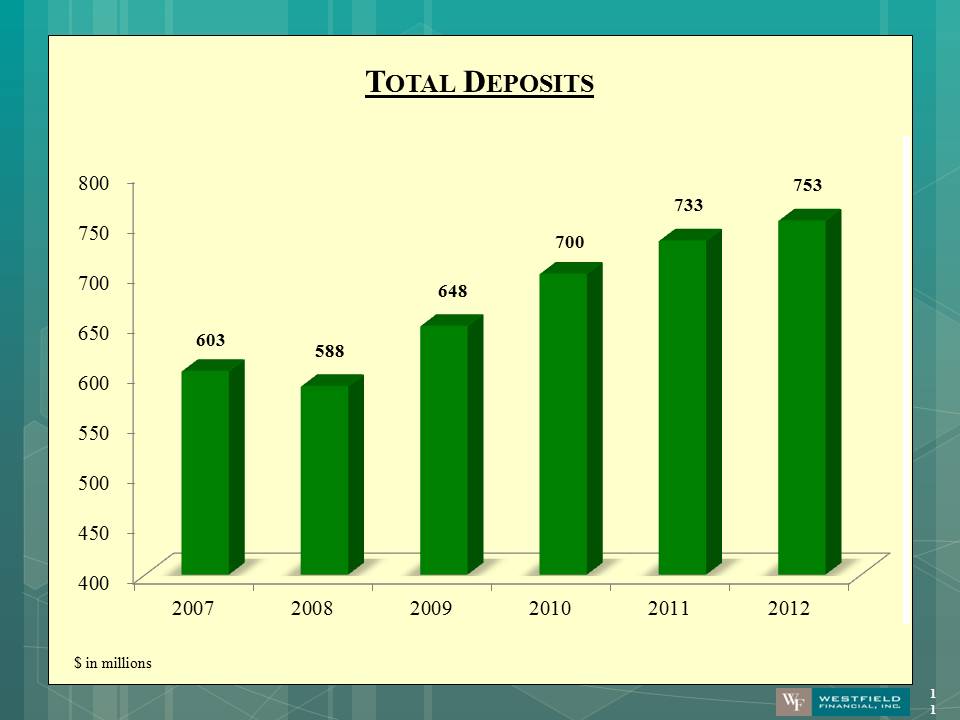
TOTAL DEPOSITS $ in millions 400450500550600650700750800200720082009201020112012603 588 648 700 733 753 December 31, 2007 December 31, 2012
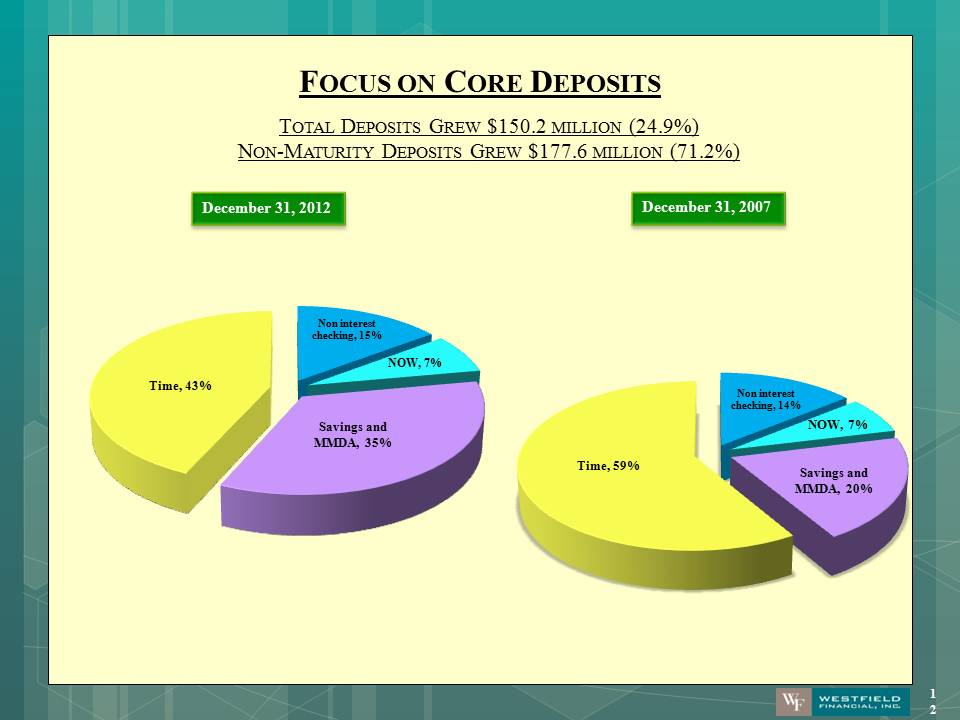
FOCUS ON CORE DEPOSITS TOTAL DEPOSITS GREW $150.2 MILLION (24.9%) NON-MATURITY DEPOSITS GREW $177.6 MILLION (71.2%) Non interest checking, 14% NOW, 7% Savings and MMDA, 20% Time, 59% Non interest checking, 15% NOW, 7% Savings and MMDA, 35% Time, 43%
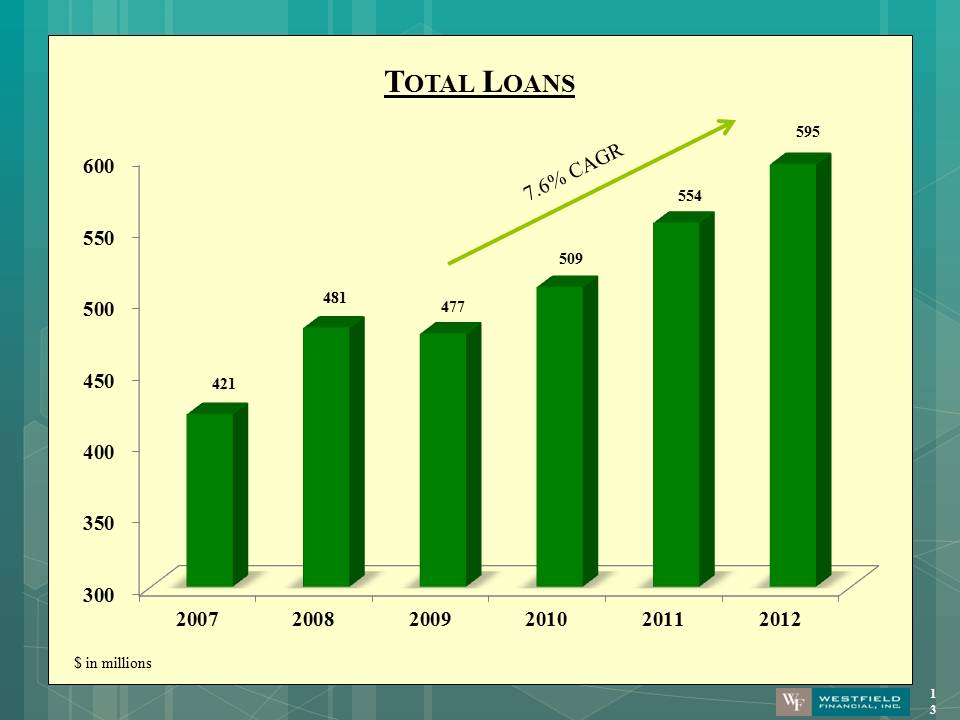
$ in millions 13 TOTAL LOANS 300350400450500550600200720082009201020112012421 481 477 509 554 595 7.6% CAGR
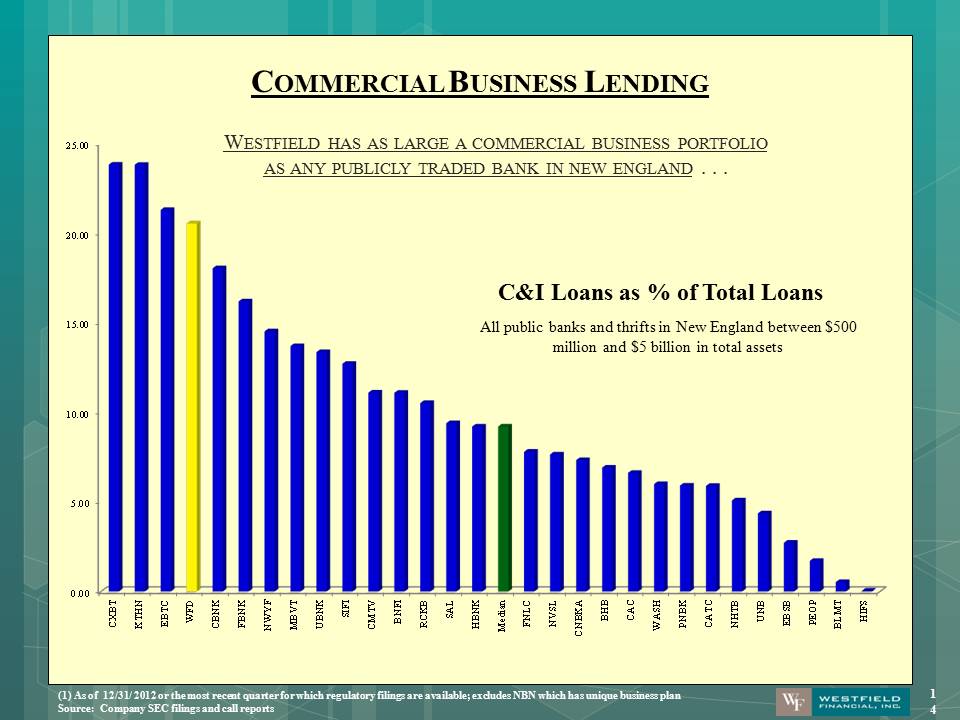
0.005.0010.0015.0020.0025.00CXBTKTHNEBTCWFDCBNKFBNKNWYFMBVTUBNKSIFICMTVBNFIRCKBSALHBNKMedianFNLCNVSLCNBKABHBCACWASHPNBKCATCNHTBNBEBSBPEOPBLMTHIFS(1) As of 12/31/ 2012 or the most recent quarter for which regulatory filings are available; excludes NBN which has unique business plan Source: Company SEC filings and call reports COMMERCIAL BUSINESS LENDING WESTFIELD HAS AS LARGE A COMMERCIAL BUSINESS PORTFOLIO AS ANY PUBLICLY TRADED BANK IN NEW ENGLAND . . . C&I Loans as % of Total Loans All public banks and thrifts in New England between $500 million and $5 billion in total assets
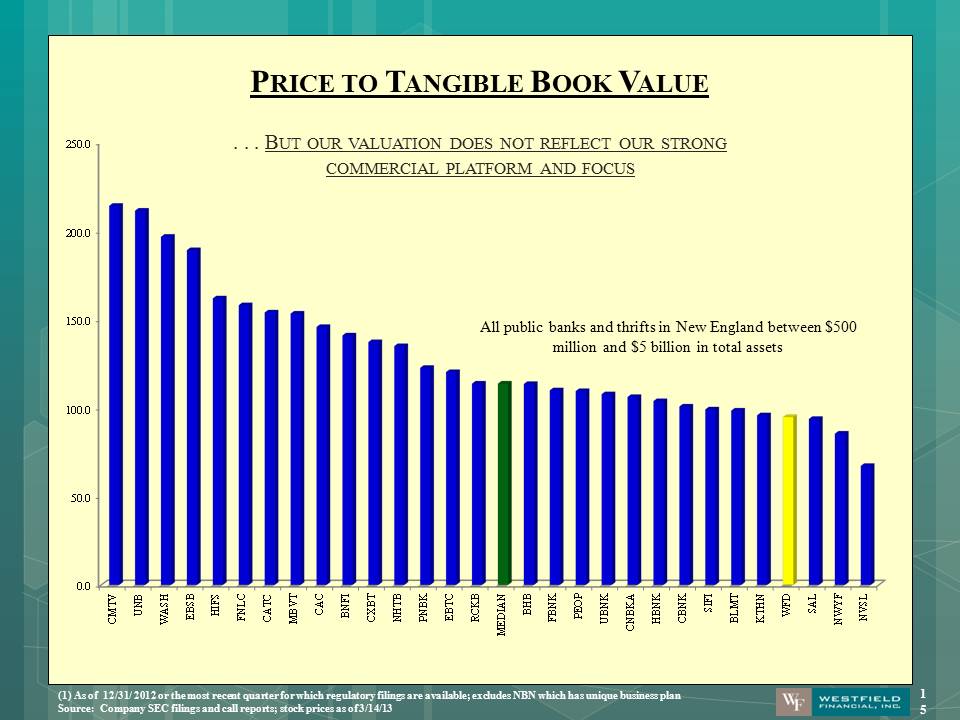
PRICE TO TANGIBLE BOOK VALUE . . . BUT OUR VALUATION DOES NOT REFLECT OUR STRONG COMMERCIAL PLATFORM AND FOCUS 15 All public banks and thrifts in New England between $500 million and $5 billion in total assets (1) As of 12/31/ 2012 or the most recent quarter for which regulatory filings are available; excludes NBN which has unique business plan Source: Company SEC filings and call reports; stock prices as of 3/14/13 0.050.0100.0150.0200.0250.0 CMTVUNBWASHEBSBHIFSFNLCCATCMBVTCACBNFICXBTNHTBPNBKEBTCRCKBMEDIANBHBFBNKPEOPUBNKCNBKAHBNKCBNKSIFIBLMTTHNWFDSALNWYFNVSL
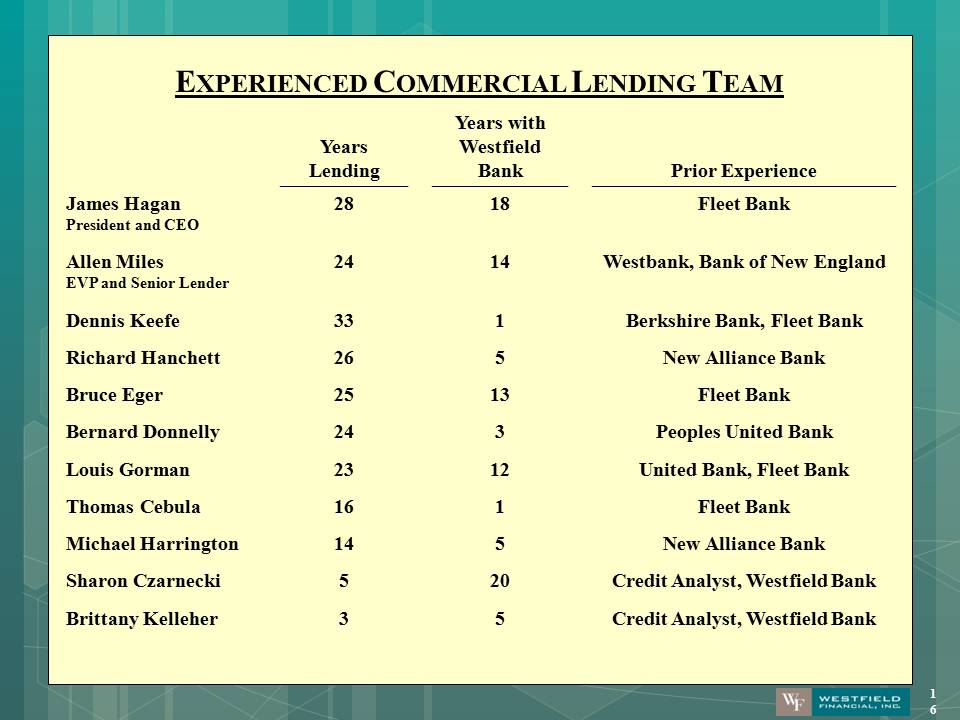
EXPERIENCED COMMERCIAL LENDING TEAM 16 Years Lending Years with Westfield Bank Prior Experience James Hagan President and CEO 28 18 Fleet Bank Allen Miles EVP and Senior Lender 24 14 Westbank, Bank of New England Dennis Keefe 33 1 Berkshire Bank, Fleet Bank Richard Hanchett 26 5 New Alliance Bank Bruce Eger 25 13 Fleet Bank Bernard Donnelly 24 3 Peoples United Bank Louis Gorman 23 12 United Bank, Fleet Bank Thomas Cebula 16 1 Fleet Bank Michael Harrington 14 5 New Alliance Bank Sharon Czarnecki 5 20 Credit Analyst, Westfield Bank Brittany Kelleher 3 5 Credit Analyst, Westfield Bank
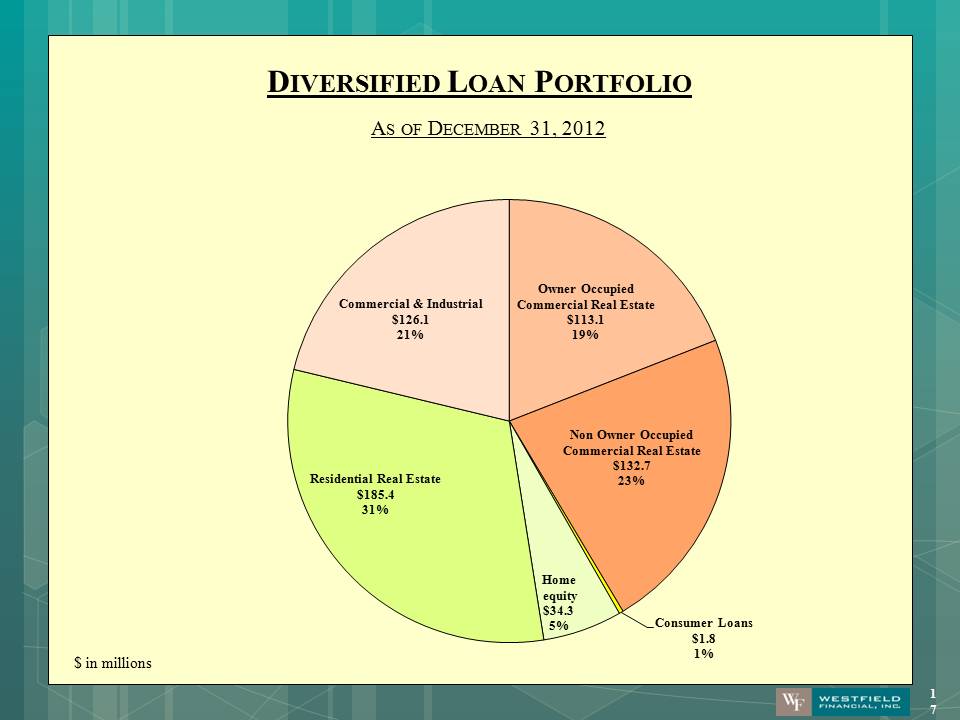
DIVERSIFIED LOAN PORTFOLIO AS OF DECEMBER 31, 2012 $ in millions Owner Occupied Commercial Real Estate $113.1 19% Non Owner Occupied Commercial Real Estate $132.7 23% Consumer Loans $1.8 1% Home equity $34.3 5% Residential Real Estate $185.4 31% Commercial & Industrial $126.1 21%
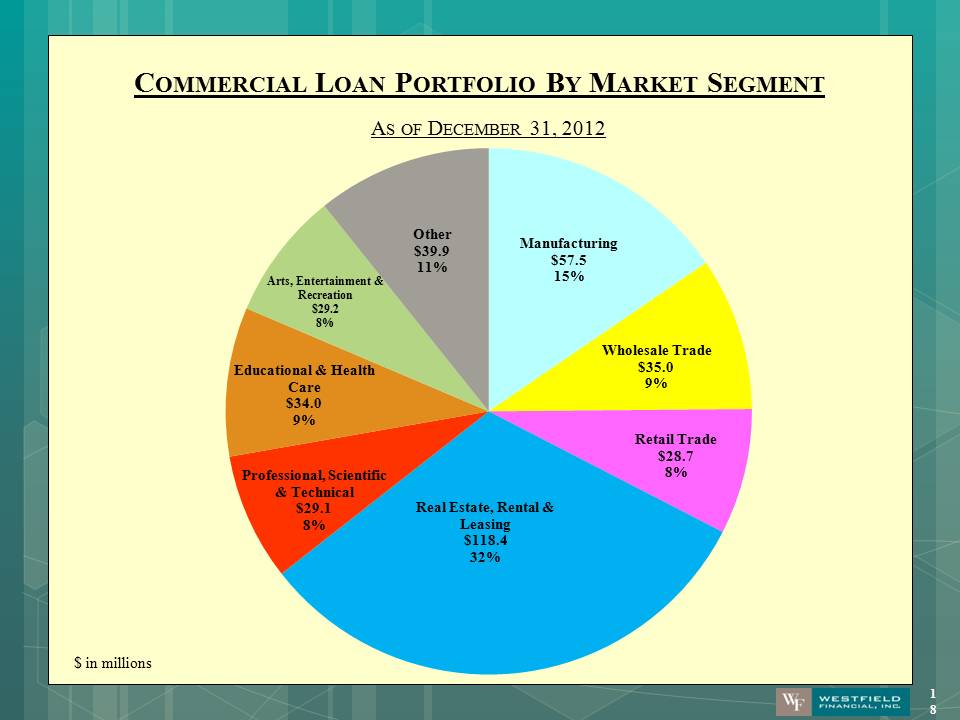
COMMERCIAL LOAN PORTFOLIO BY MARKET SEGMENT AS OF DECEMBER 31, 2012 $ in millions Manufacturing $57.5 15% Wholesale Trade $35.0 9% Retail Trade $28.7 8% Real Estate, Rental & Leasing $118.4 32% Professional, Scientific & Technical $29.1 8% Educational & Health Care $34.0 9% Arts, Entertainment & Recreation $29.2 8% Other $39.9 11%
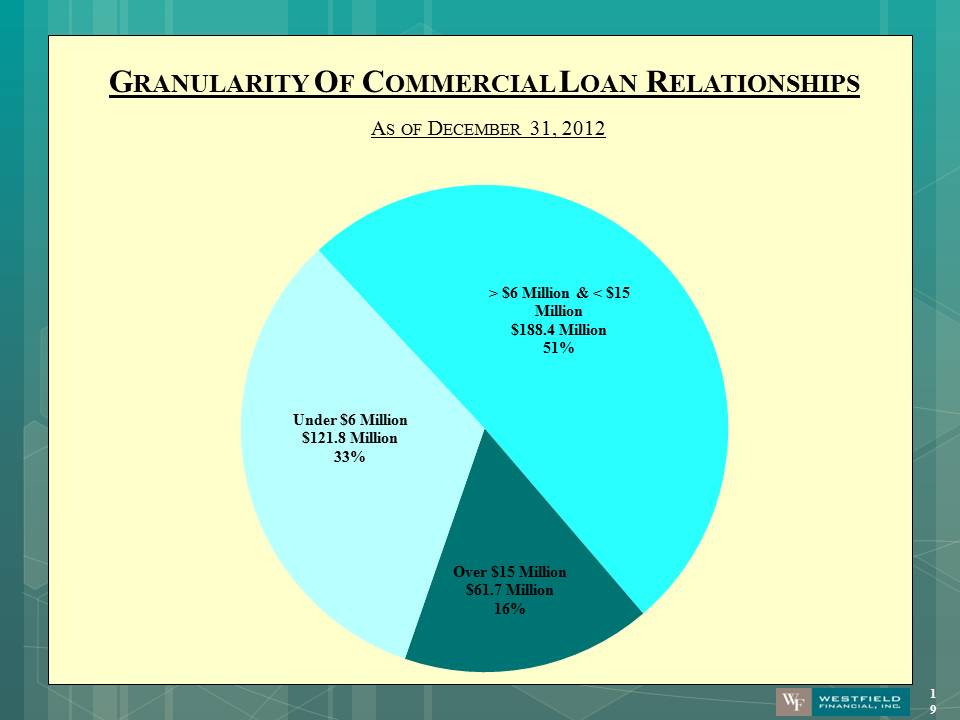
GRANULARITY OF COMMERCIAL LOAN RELATIONSHIPS AS OF DECEMBER 31, 2012 > $6 Million & < $15 Million $188.4 Million 51% Over $15 Million $61.7 Million 16% Under $6 Million $121.8 Million 33% Dec 31, 2012 Dec 31, 2011 Allowance for loan losses as a 1.31% 1.40% percentage of total loans Nonperforming loans as a 0.51% 0.53% percentage of total loans Nonperforming assets as a 0.31% 0.32% percentage of total assets
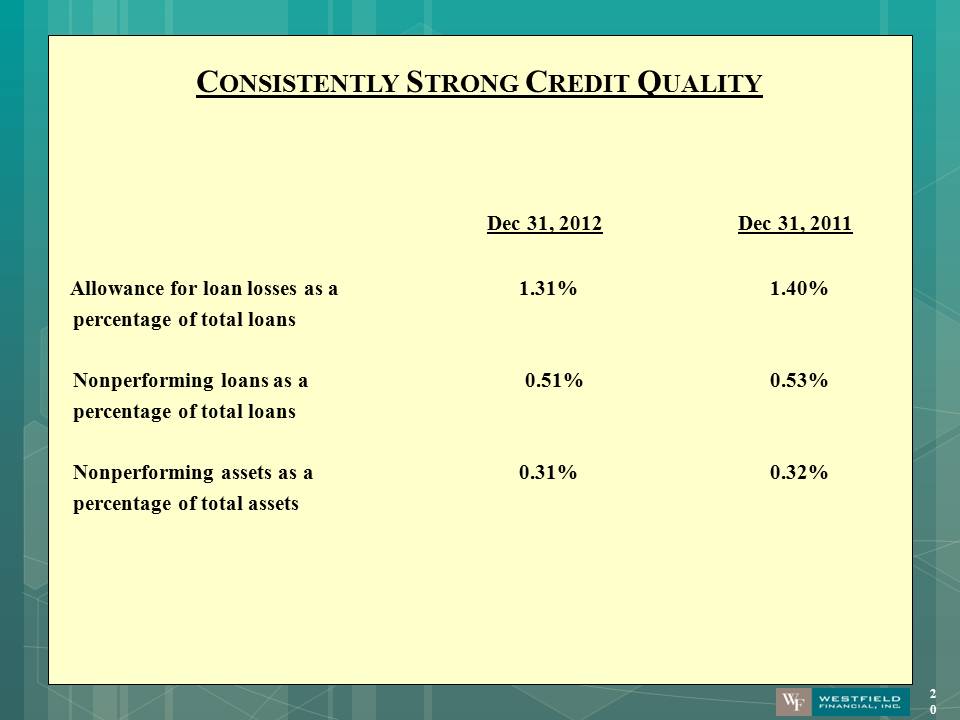
CONSISTENTLY STRONG CREDIT QUALITY Allowance for loan losses as a percentage of total loans Nonperforming loans as a percentage of total loans Nonperforming assets as a percentage of total assets Dec 31, 2012 Dec 31, 2011 1.31% 0.51% 0.31% 1.40% 0.53% 0.32%
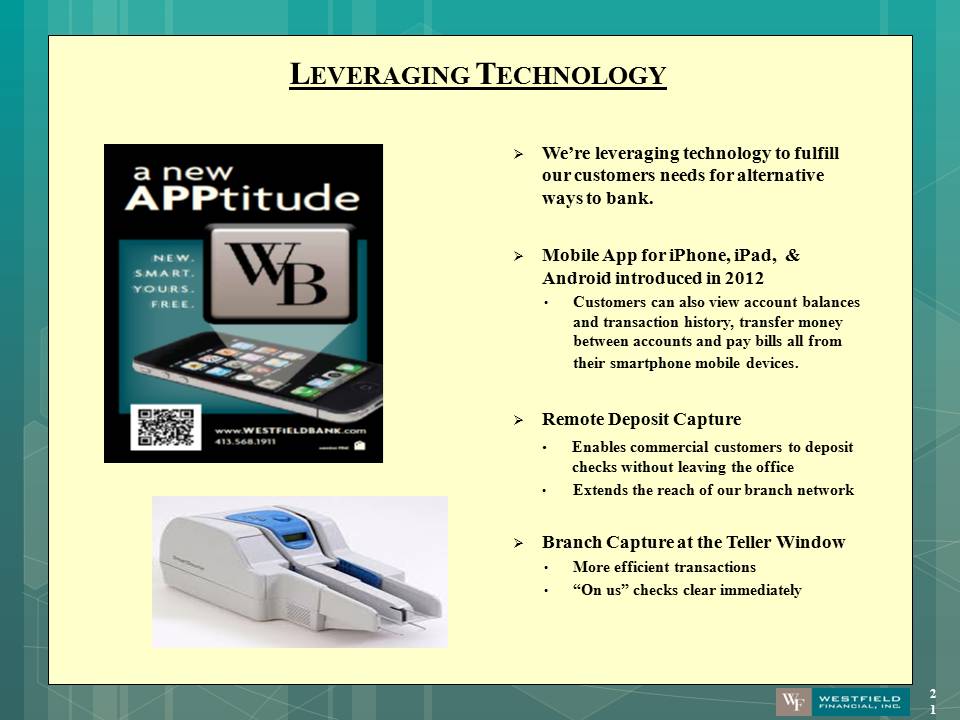
LEVERAGING TECHNOLOGY ?We’re leveraging technology to fulfill our customers needs for alternative ways to bank. ?Mobile App for iPhone, iPad, & Android introduced in 2012 Customers can also view account balances and transaction history, transfer money between accounts and pay bills all from their smartphone mobile devices. ?Remote Deposit Capture Enables commercial customers to deposit checks without leaving the office Extends the reach of our branch network ?Branch Capture at the Teller Window More efficient transactions “On us” checks clear immediately
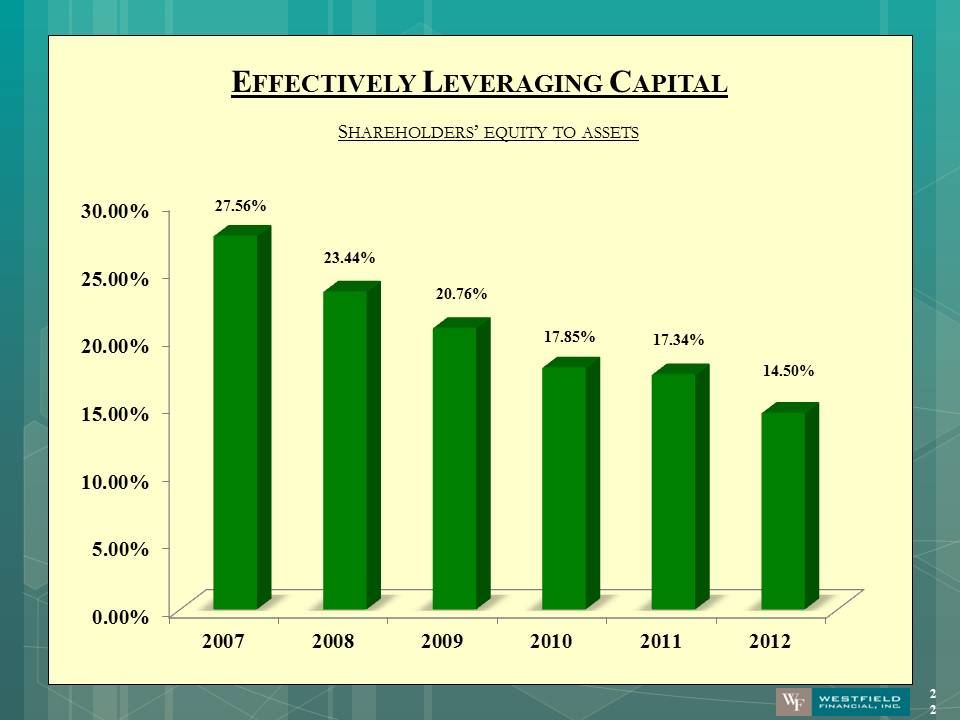
EFFECTIVELY LEVERAGING CAPITAL SHAREHOLDERS’ EQUITY TO ASSETS 0.00%5.00%10.00%15.00%20.00%25.00%30.00%20072008200920102011201227.56% 23.44% 20.76% 17.85% 17.34% 14.50%
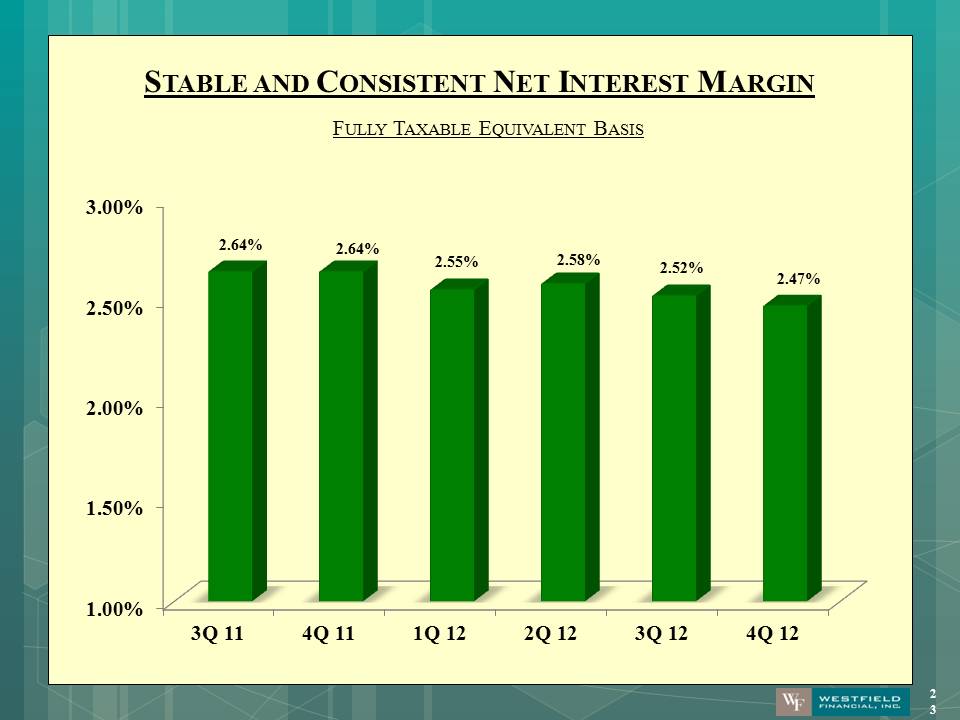
STABLE AND CONSISTENT NET INTEREST MARGIN FULLY TAXABLE EQUIVALENT BASIS 1.00%1.50%2.00%2.50%3.00%3Q 114Q 111Q 122Q 123Q 124Q 122.64% 2.64% 2.55% 2.58% 2.52% 2.47%
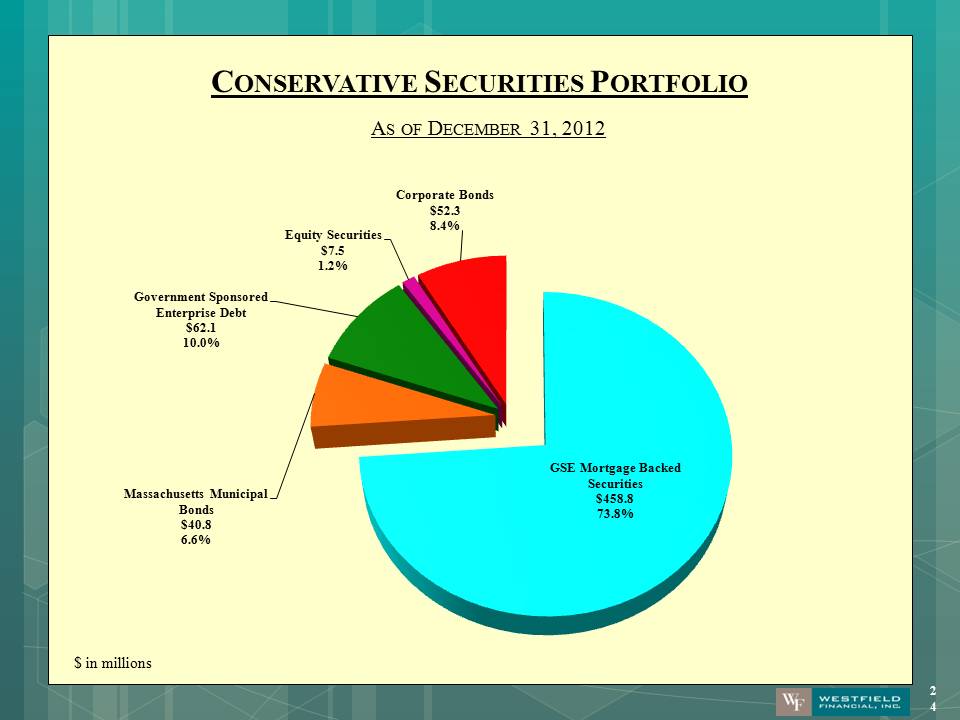
CONSERVATIVE SECURITIES PORTFOLIO AS OF DECEMBER 31, 2012 $ in millions GSE Mortgage Backed Securities $458.8 73.8% Massachusetts Municipal Bonds $40.8 6.6% Government Sponsored Enterprise Debt $62.1 10.0% Equity Securities $7.5 1.2% Corporate Bonds $52.3 8.4%
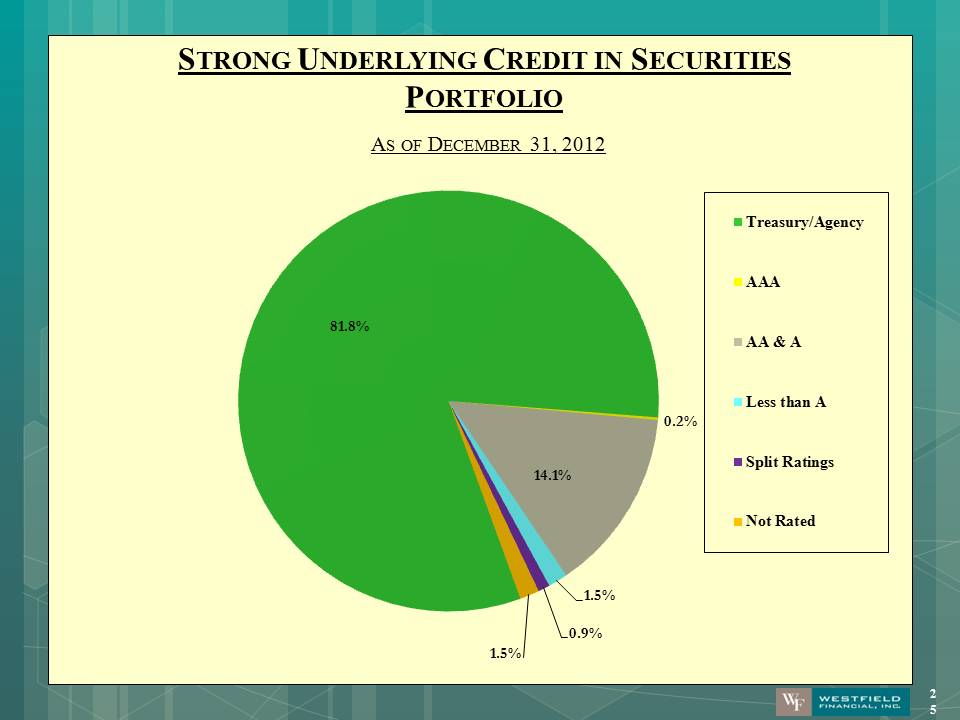
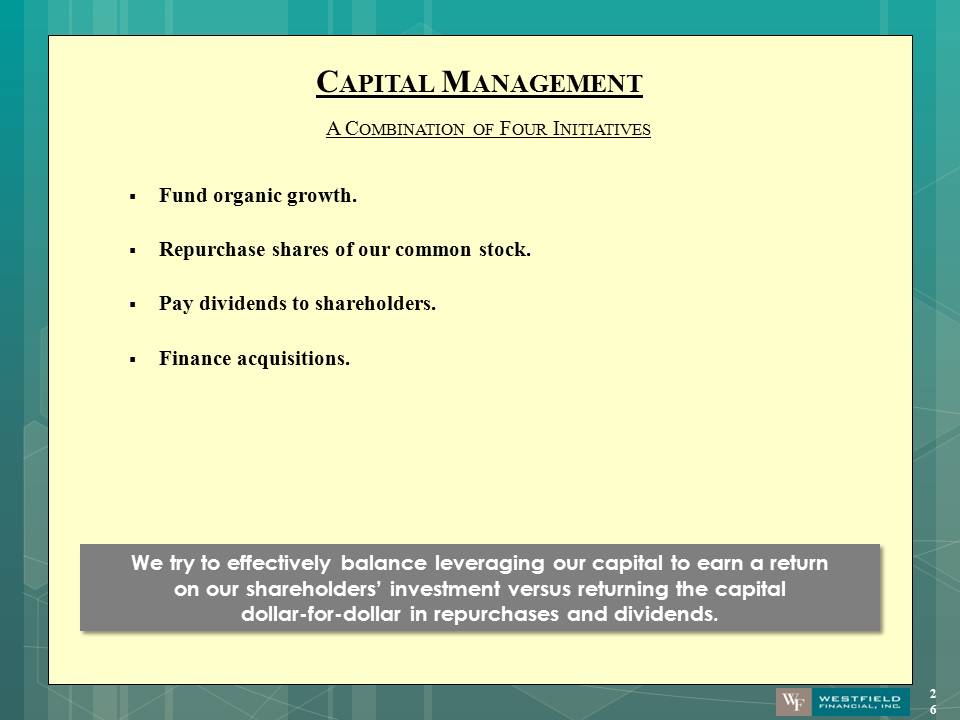
STRONG UNDERLYING CREDIT IN SECURITIES PORTFOLIO AS OF DECEMBER 31, 2012 81.8% 0.2% 14.1% 1.5% 0.9% 1.5% Treasury/AgencyAAAAA & ALess than ASplit RatingsNot Rated ?Fund organic growth. ?Repurchase shares of our common stock. ?Pay dividends to shareholders. ?Finance acquisitions.
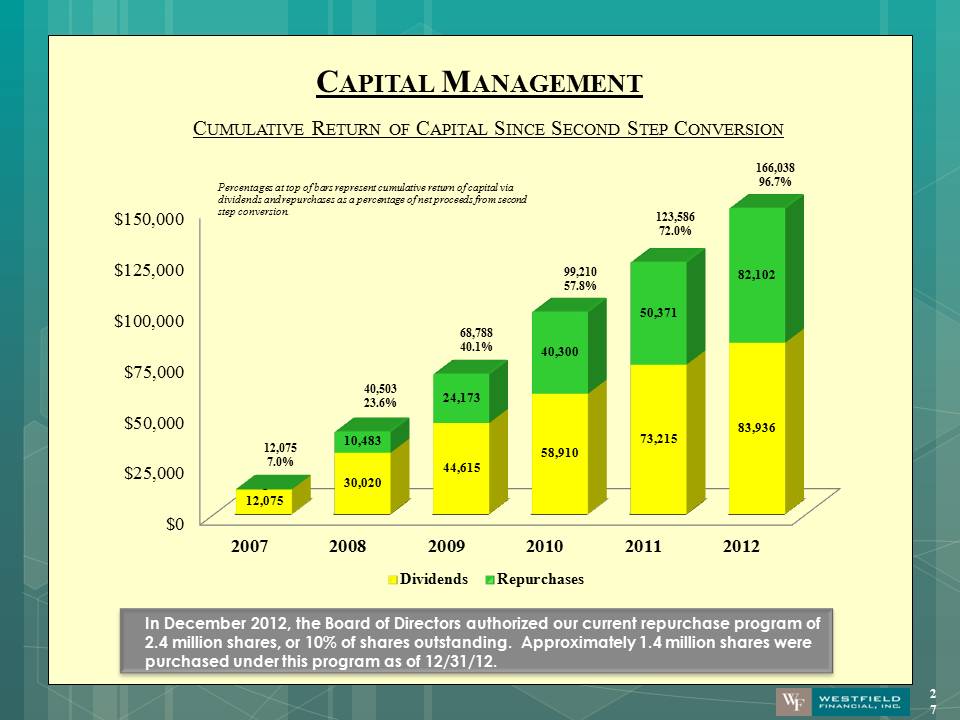
CAPITAL MANAGEMENT We try to effectively balance leveraging our capital to earn a return on our shareholders’ investment versus returning the capital dollar-for-dollar in repurchases and dividends. A COMBINATION OF FOUR INITIATIVES In December 2012, the Board of Directors authorized our current repurchase program of 2.4 million shares, or 10% of shares outstanding. Approximately 1.4 million shares were purchased under this program as of 12/31/12.
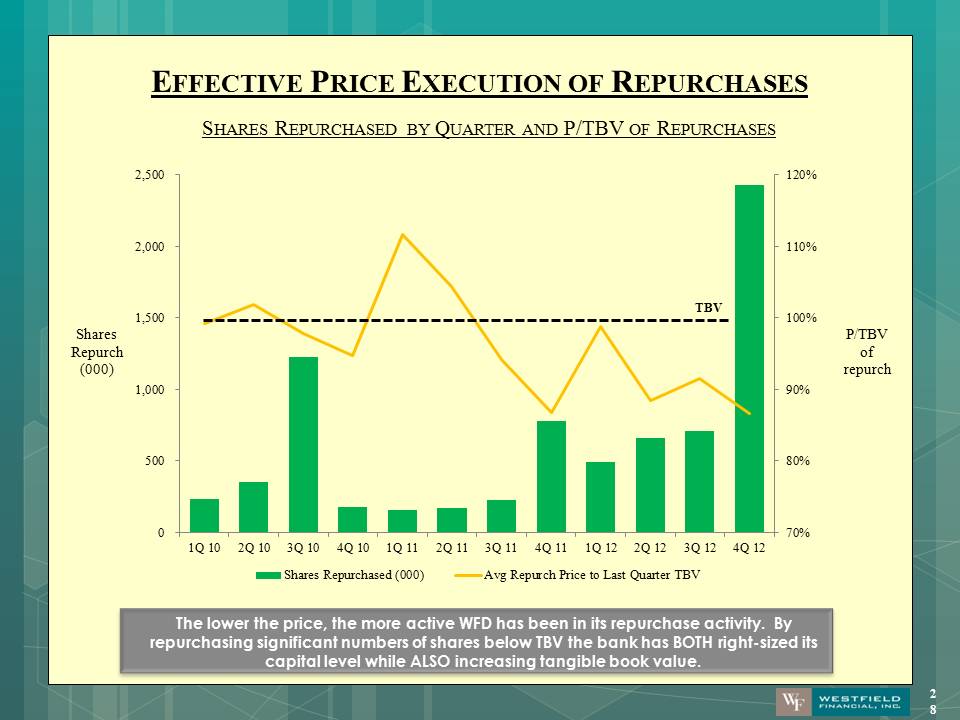
EFFECTIVE PRICE EXECUTION OF REPURCHASES SHARES REPURCHASED BY QUARTER AND P/TBV OF REPURCHASES 70%80%90%100%110%120%05001,0001,5002,0002,5001Q 102Q 103Q 104Q 101Q 112Q 113Q 114Q 111Q 122Q 123Q 124Q 12Shares Repurchased (000)Avg Repurch Price to Last Quarter TBVTBV P/TBV of repurch Shares Repurch (000)
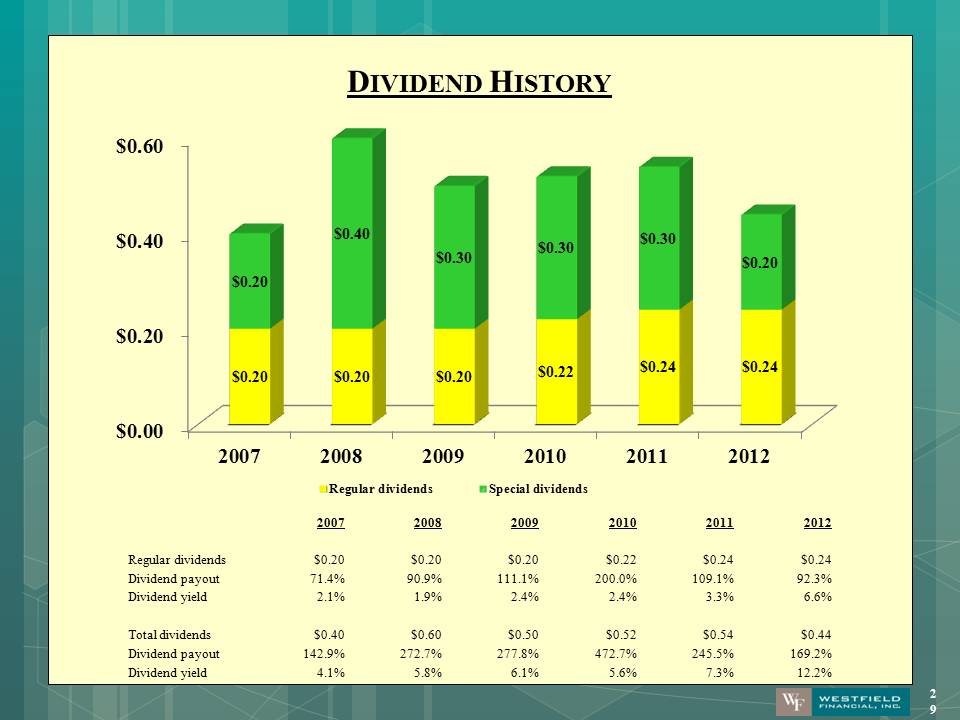
DIVIDEND HISTORY $0.00$0.20$0.40$0.60200720082009201020112012$0.20 $0.20 $0.20 $0.22 $0.24 $0.24 $0.20 $0.40 $0.30 $0.30 $0.30 $0.20 Regular dividendsSpecial dividends2007 2008 2009 2010 2011 2012 Regular dividends $0.20 $0.20 $0.20 $0.22 $0.24 $0.24 Dividend payout 71.4% 90.9% 111.1% 200.0% 109.1% 92.3% Dividend yield 2.1% 1.9% 2.4% 2.4% 3.3% 6.6% Total dividends $0.40 $0.60 $0.50 $0.52 $0.54 $0.44 Dividend payout 142.9% 272.7% 277.8% 472.7% 245.5% 169.2% Dividend yield 4.1% 5.8% 6.1% 5.6% 7.3% 12.2%
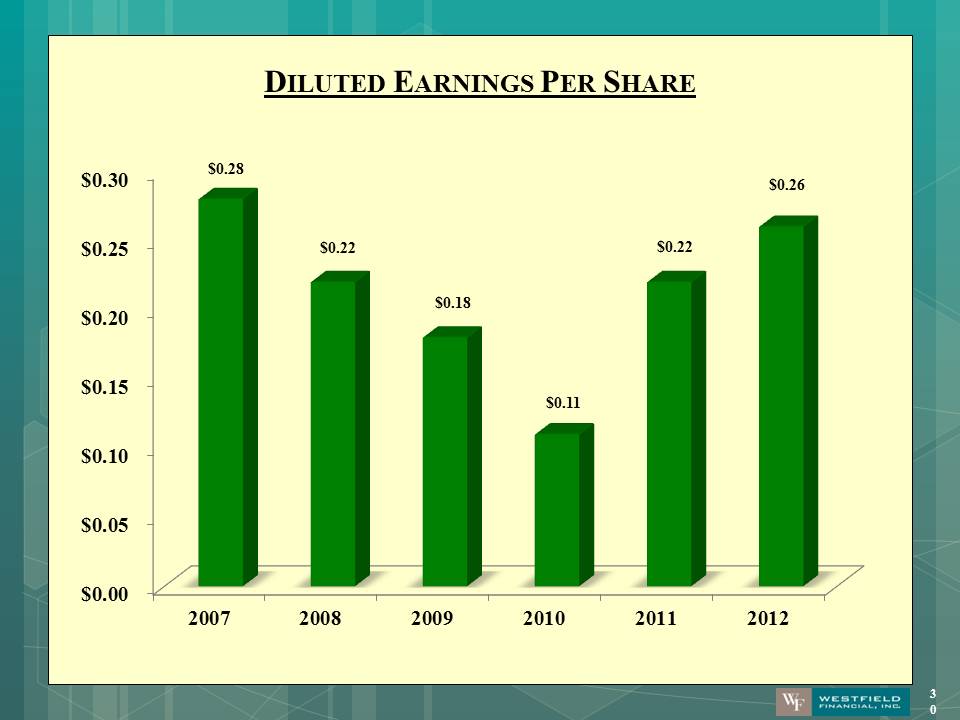
DILUTED EARNINGS PER SHARE $0.00$0.05$0.10$0.15$0.20$0.25$0.30200720082009201020112012$0.28 $0.22 $0.18 $0.11 $0.22 $0.26 * Source: SNL Financial, data as of close of business March 15, 2013.
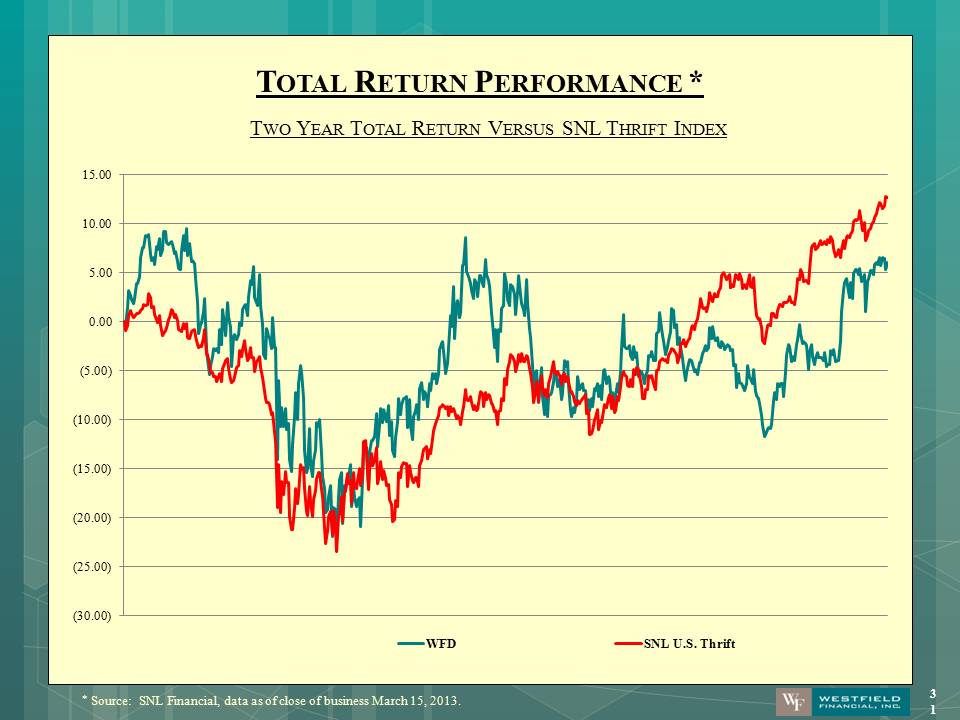
TOTAL RETURN PERFORMANCE * TWO YEAR TOTAL RETURN VERSUS SNL THRIFT INDEX (30.00)(25.00)(20.00)(15.00)(10.00)(5.00)0.005.0010.0015.00WFDSNL U.S. Thrift