Attached files
| file | filename |
|---|---|
| 8-K - 8-K - HYSTER-YALE MATERIALS HANDLING, INC. | d501195d8k.htm |
Table of Contents
Exhibit 99
Table of Contents
| 1 | ||||
| 2 | ||||
| 4 | ||||
| 15 | ||||
| 94 | ||||
| Inside Back Cover | ||||
Table of Contents
| On September 28, 2012, Hyster-Yale Materials Handling, Inc. was spun off from its former parent company to become an independent public company traded on the New York Stock Exchange under the symbol HY.
Hyster-Yale and its subsidiaries, including its operating subsidiary, NACCO Materials Handling Group, Inc., is a leading designer, engineer, manufacturer, seller and servicer of a comprehensive line of lift trucks and aftermarket parts marketed globally primarily under the Hyster® and Yale® brand names, mainly to independent Hyster® and Yale® retail dealerships. Lift trucks and component parts are manufactured in the United States, Northern Ireland, Mexico, the Philippines, The Netherlands, Italy, Japan, Vietnam, Brazil and China. |
HYSTER-YALE MAINTAINS LEADING MARKET SHARE POSITIONS IN THE AMERICAS AND WORLDWIDE
| Hyster-Yale is a leading global manufacturer of a full range of electric, warehousing and internal combustion engine lift trucks in the Americas and worldwide. The Company has an estimated installed population base of 798,000 lift trucks in operation in more than 700 industries worldwide, which generates highly profitable parts and service revenue.
The Company is focused on gaining market share as well as improving margins on new lift truck units, especially in the internal combustion engine trucks, through the introduction of new products and other strategic initiatives. The Company is strategically focused on growing its installed population base by increasing market share through these new products, which meet a broad range of market applications cost effectively, and through the enhancement of its independent dealer network and its marketing activities.
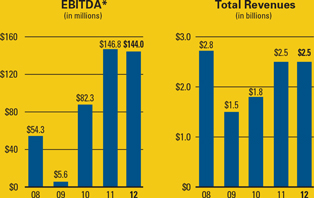
* See page 3 for the calculation of EBITDA and the discussion of non-GAAP items and the related reconciliations to U.S. GAAP measures. |
1
Table of Contents
SELECTED FINANCIAL & OPERATING DATA
| Year Ended December 31 | ||||||||||||||||||||
| 2012(1) | 2011(1) | 2010(1) | 2009(1) | 2008(1)(2) | ||||||||||||||||
| (In millions, except per share data) | ||||||||||||||||||||
| Operating Statement Data: |
||||||||||||||||||||
| Revenues |
$ | 2,469.1 | $ | 2,540.8 | $ | 1,801.9 | $ | 1,475.2 | $ | 2,824.3 | ||||||||||
| Operating profit (loss) |
$ | 111.7 | $ | 110.0 | $ | 46.1 | $ | (31.2 | ) | $ | (344.0 | ) | ||||||||
| Net income (loss) |
$ | 98.1 | $ | 82.6 | $ | 32.3 | $ | (43.2 | ) | $ | (375.8 | ) | ||||||||
| Net (income) loss attributable to noncontrolling interest |
$ | (0.1 | ) | $ | — | $ | 0.1 | $ | 0.1 | $ | (0.2 | ) | ||||||||
|
|
|
|
|
|
|
|
|
|
|
|||||||||||
| Net income (loss) attributable to stockholders |
$ | 98.0 | $ | 82.6 | $ | 32.4 | $ | (43.1 | ) | $ | (376.0 | ) | ||||||||
|
|
|
|
|
|
|
|
|
|
|
|||||||||||
| Basic earnings (loss) per share attributable to stockholders |
$ | 5.84 | $ | 4.93 | $ | 1.95 | $ | (2.60 | ) | $ | (22.70 | ) | ||||||||
|
|
|
|
|
|
|
|
|
|
|
|||||||||||
| Diluted earnings (loss) per share attributable to stockholders |
$ | 5.83 | $ | 4.91 | $ | 1.94 | $ | (2.60 | ) | $ | (22.70 | ) | ||||||||
|
|
|
|
|
|
|
|
|
|
|
|||||||||||
| Balance Sheet Data December 31: |
||||||||||||||||||||
| Cash |
$ | 151.3 | $ | 184.9 | $ | 169.5 | $ | 163.2 | $ | 58.0 | ||||||||||
| Total assets |
$ | 1,064.4 | $ | 1,117.0 | $ | 1,041.2 | $ | 914.1 | $ | 1,095.1 | ||||||||||
| Long-term debt |
$ | 106.9 | $ | 54.6 | $ | 215.5 | $ | 229.2 | $ | 229.7 | ||||||||||
| Stockholders’ equity |
$ | 341.3 | $ | 296.3 | $ | 230.7 | $ | 207.1 | $ | 154.2 | ||||||||||
| Cash Flow Data: |
||||||||||||||||||||
| Provided by (used for) operating activities |
$ | 128.7 | $ | 54.6 | $ | 47.5 | $ | 115.9 | $ | (27.3 | ) | |||||||||
| Provided by (used for) investing activities |
$ | (19.5 | ) | $ | (15.9 | ) | $ | (8.5 | ) | 5.8 | $ | (37.5 | ) | |||||||
|
|
|
|
|
|
|
|
|
|
|
|||||||||||
| Cash flow before financing activities(3) |
$ | 109.2 | $ | 38.7 | $ | 39.0 | $ | 121.7 | $ | (64.8 | ) | |||||||||
|
|
|
|
|
|
|
|
|
|
|
|||||||||||
| Provided by (used for) financing activities |
$ | (144.4 | ) | $ | (19.5 | ) | $ | (24.4 | ) | $ | (18.3 | ) | $ | 48.0 | ||||||
| Other Data: |
||||||||||||||||||||
| Cash dividend paid pre-spin to NACCO |
$ | 5.0 | $ | 10.0 | $ | 5.0 | $ | — | $ | — | ||||||||||
| Per share data: |
||||||||||||||||||||
| Cash dividends(4)(5) |
$ | 2.25 | ||||||||||||||||||
| Market value at December 31(4) |
$ | 48.80 | ||||||||||||||||||
| Stockholders’ equity at December 31(4) |
$ | 20.40 | ||||||||||||||||||
| Actual shares outstanding at December 31(4) |
16.732 | |||||||||||||||||||
| Basic weighted average shares outstanding(1) |
16.768 | 16.767 | 16.657 | 16.579 | 16.561 | |||||||||||||||
| Diluted weighted average shares outstanding(1) |
16.800 | 16.815 | 16.688 | 16.579 | 16.561 | |||||||||||||||
| Total employees at December 31 |
5,300 | 5,300 | 5,000 | 4,500 | 5,700 | |||||||||||||||
| (1) | As a result of the distribution of one share of Class A Common and one share of Class B Common for each share of NACCO Class A and NACCO Class B on September 28, 2012, the earnings per share amounts and the weighted average shares outstanding for the Company have been calculated based upon doubling the relative historical basic and diluted weighted average shares outstanding of NACCO. |
| (2) | During the fourth quarter of 2008, NACCO’s stock price significantly declined compared with previous periods and the market value of NACCO’s equity was below its book value of tangible assets and its book value of equity. NACCO performed an interim impairment test, which indicated that goodwill and certain other intangibles were impaired at December 31, 2008. Therefore, the Company recorded a non-cash impairment charge of $351.1 million during the fourth quarter of 2008. |
| (3) | Cash flow before financing activities is equal to net cash provided by (used for) operating activities less net cash provided by (used for) investing activities. |
| (4) | This information is only included for periods subsequent to the spin-off from NACCO Industries, Inc. |
| (5) | Includes an extraordinary dividend of $2.00 per share and a regular quarterly dividend of $0.25 per share paid to stockholders of the Company during the fourth quarter of 2012. |
2
Table of Contents
| Year Ended December 31 | ||||||||||||||||||||
| 2012 | 2011 | 2010 | 2009 | 2008(2) | ||||||||||||||||
| (In millions) | ||||||||||||||||||||
| Calculation of EBITDA(6) |
||||||||||||||||||||
| Net income (loss) attributable to stockholders |
$ | 98.0 | $ | 82.6 | $ | 32.4 | $ | (43.1 | ) | $ | (376.0 | ) | ||||||||
| Goodwill and other intangible assets impairment charges |
— | — | — | — | 351.1 | |||||||||||||||
| Noncontrolling interest income (loss) |
0.1 | — | (0.1 | ) | (0.1 | ) | 0.2 | |||||||||||||
| Income tax provision (benefit) |
7.0 | 18.9 | 1.8 | (3.6 | ) | 15.5 | ||||||||||||||
| Interest expense |
12.4 | 15.8 | 16.6 | 19.0 | 25.9 | |||||||||||||||
| Interest income |
(1.5 | ) | (1.8 | ) | (2.3 | ) | (2.8 | ) | (4.4 | ) | ||||||||||
| Depreciation and amortization expense |
28.0 | 31.3 | 33.9 | 36.2 | 42.0 | |||||||||||||||
|
|
|
|
|
|
|
|
|
|
|
|||||||||||
| EBITDA(6) |
$ | 144.0 | $ | 146.8 | $ | 82.3 | $ | 5.6 | $ | 54.3 | ||||||||||
|
|
|
|
|
|
|
|
|
|
|
|||||||||||
| (6) | EBITDA in this Annual Report is provided solely as a supplemental disclosure with respect to operating results. EBITDA does not represent net income, as defined by U.S. GAAP and should not be considered as a substitute for net income or net loss, or as an indicator of operating performance. The Company defines EBITDA as income before goodwill and other intangible assets impairment charges, income taxes and non-controlling interest income (loss) plus net interest expense and depreciation and amortization expense. EBITDA is not a measurement under U.S. GAAP and is not necessarily comparable with similarly titled measures of other companies. |
| (In millions, except percentage data) |
||||||||
| 2012* | 2011** | |||||||
| Calculation of Return on Capital Employed:(7) |
||||||||
| Average stockholders’ equity |
$ | 333.3 | $ | 271.7 | ||||
| Average debt |
175.9 | 229.1 | ||||||
| Average cash |
(165.2 | ) | (152.2 | ) | ||||
|
|
|
|
|
|||||
| Average capital employed, net of cash |
$ | 344.0 | $ | 348.6 | ||||
| Net income, as reported |
$ | 98.0 | $ | 82.6 | ||||
| Plus: Interest expense, net, as reported |
10.9 | 14.0 | ||||||
| Less: Income taxes on interest expense net, at 38%*** |
(4.1 | ) | (5.3 | ) | ||||
|
|
|
|
|
|||||
| Actual return on capital employed = actual net income before interest expense, net, after tax |
$ | 104.8 | $ | 91.3 | ||||
|
|
|
|
|
|||||
| Actual return on capital employed percentage(7) |
30.5 | % | 26.2 | % | ||||
|
|
|
|
|
|||||
| Actual return on equity percentage(8) |
29.4 | % | 30.4 | % | ||||
|
|
|
|
|
|||||
| (7) | Return on capital employed is provided solely as a supplemental disclosure with respect to income generation because management believes it provides useful information with respect to earnings in a form that is comparable to the Company’s cost of capital employed, which includes both equity and debt securities, net of cash. |
| (8) | Return on equity is defined as net income divided by average stockholders’ equity |
| * | 2012 Average stockholders’ equity, debt and cash are calculated using 12/31/11 and each of 2012’s quarter ends. |
| ** | 2011 Average stockholders’ equity, debt and cash are calculated using 12/31/10 and each of 2011’s quarter ends. |
| *** | Tax rate of 38% represents the Company’s target U.S. marginal tax rate compared with the effective income tax rate of 6.7% and 18.6%, in 2012 and 2011, respectively. |
3
Table of Contents
| We are delighted to be writing Hyster-Yale Materials Handling, Inc.’s first annual report as an independent public company. Although we are a new public company, we are a decades-old business with decades-old brands that have earned the trust of our customers who depend upon our products every day. | ||
|
HYSTER-YALE: A NEW PUBLIC COMPANY FOR A DECADES-OLD BUSINESS AND BRANDS THAT HAVE EARNED THE TRUST OF CUSTOMERS WHO DEPEND UPON OUR PRODUCTS EVERY DAY
| ||
|
THE HYSTER-YALE ADVANTAGE: On September 28, 2012, the materials handling business was spun off from NACCO Industries, Inc. as Hyster-Yale Materials Handling, Inc. Our leadership team is enthusiastic about driving a focused, independent company that continuously strives to be a global leader in the materials handling equipment industry with our leading brand names of Hyster® and Yale®. As an independent public company, we expect to be able to focus on serving each of our market segments and customer application needs more effectively and to respond flexibly to changing market conditions and growth markets. We now also have greater flexibility to pursue strategic growth opportunities in the materials handling industry, such as joint ventures, and have direct access to equity capital markets and enhanced flexibility in debt capital markets. Finally, and very importantly, we are strengthening the alignment of our senior management incentives with the needs and performance of the Company to ensure management is focused on achieving our long-term financial and market objectives.
| |
| Over the last decade, we have restructured our business to create a more efficient and lean organization. We have created new products and programs focused on customers’ needs to improve margins and increase unit and parts volumes. Over this period, the Company completely upgraded its comprehensive global product line, introduced new models not previously in the line and added | ||
4
Table of Contents

| ||
| A Hyster® H5.0FT Fortens® diesel powered lift truck, shown in a typical tough application of handling concrete pipes, has a lifting capacity of 11,000 pounds. | a new utility truck brand, UTILEV®. The Company’s rationalized global manufacturing footprint enables it to assemble lift trucks largely in the market of sale. As a result of enhanced throughput and a modern lean manufacturing system designed to provide flexible and efficient manufacturing capabilities, the Company now has capacity to enhance production volumes by up to 50 percent despite several plant closures. The Company has re-engineered its products to utilize common components across multiple lift truck classes to reduce costs and product complexity, improve product quality, capture procurement cost savings, increase manufacturing efficiency, and allow for faster future design modifications. In addition, supply chain management has been centralized to gain economies of scale and certain components have been outsourced, often to suppliers in low-cost countries, to reduce costs. Improvements in product development, engineering, manufacturing and the quality of sourced components have led to enhanced customer satisfaction and reduced warranty rates. Finally, the Company has strengthened its independent dealer network by enhancing service offerings, increasing the use of dual brand | |
5
Table of Contents
| ||
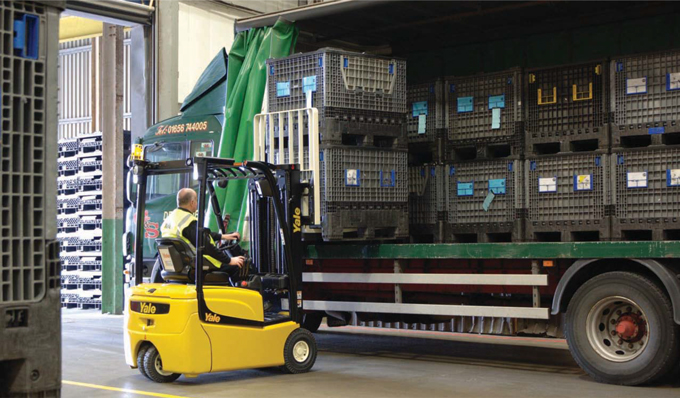
| The Yale® ERP16-VT three- wheel pneumatic-tire electric lift truck has a zero-turn radius and a lifting capacity of 3,000 to 4,000 pounds. | representation, attracting new dealers and strengthening existing dealers. As a result of these many changes, the Company has been able to deliver strong operating results in each of the past two years. Operating profit margin has risen from 2.1 percent at the prior market cycle peak in 2007 to 4.5 percent in 2012, which we believe is the mid-point of this current market cycle.
2012 FINANCIAL RESULTS: The global reach of the Company’s success through innovative products and marketing and sales programs, as well as continued market expansion in the United States and Asia-Pacific, led to strong 2012 results and generated improved operating profit margins on slightly lower sales volumes. However, as a global enterprise, the Company is susceptible to fluctuating currencies and varying market conditions in the countries in which we operate. During 2012, the euro and the Brazilian real weakened against the U.S. dollar, which reduced revenues. Additionally, as we predicted in 2011, lift truck market growth around the world moderated, with a significant decline in Europe in 2012. These unfavorable currency movements and a 3.5 percent decrease in new unit shipments, primarily | |
6
Table of Contents
|
|
driven by the decline in the European market somewhat offset by the favorable effect of price increases implemented in 2011 and early 2012, resulted in a modest decline in revenues from $2.541 billion in 2011 to $2.469 billion in 2012.
Despite the decline in revenues, net income(1) increased substantially from $82.6 million in 2011 to $98.0 million in 2012 mainly as a result of a significant tax benefit of $10.7 million from the release of certain portions of previously recorded valuation allowances related to the Company’s U.S. state and Australian deferred tax assets. Also, despite the decline in revenues, Hyster-Yale was able to increase operating profit modestly in 2012. Price increases implemented in early 2012, which more than offset material cost increases, and a shift in mix to higher-margin products and markets contributed to this increase, and were only partially offset by higher operating expenses resulting from an increase in employee-related costs and added costs to support the Company’s five strategic initiatives. Operating profit margins improved from 4.3 percent in 2011 to 4.5 percent in 2012. In 2012, the Company also generated cash flow before financing of $109.2 million, a substantial increase over the $38.7 million generated in 2011, and continued strong EBITDA(2) and return on capital employed(2) of $144 million and 30.5 percent, respectively. The Company’s cash position was $151.3 million as of December 31, 2012 after paying down debt, paying a special dividend of $2.00 per share on December 27, 2012 and paying a new regular quarterly dividend of $0.25 per share on December 14, 2012. Debt as of December 31, 2012 was $142.2 million, significantly lower than in the prior year. The Company has a conservative capital structure as demonstrated by its low debt, net of cash, and efficient working capital levels, both of which provide stability in variable market conditions and flexibility for growth.
OUTLOOK FOR 2013: Hyster-Yale is a materials handling equipment global leader with operations throughout the world. The Company’s economic engine is driven by unit volume, and its worldwide distribution strength drives these volumes and related market share. Increased volumes generate greater economies of scale, and result in more favorable operating leverage and margins in all areas of the business – product development, supply chain, manufacturing processes and quality and reliability programs – which are all currently performing at high levels and which are now focused on continuous improvement. Increased volume also results in a larger installed lift truck population base, which is the source of a profitable parts business that also improves operating profit margins. The Company continually seeks to expand market share by enhancing its product offerings and its dealer network in individual markets and strengthening sales and marketing activities to increase our installed population base, which was approximately 798,000 units at the end of 2012. | |
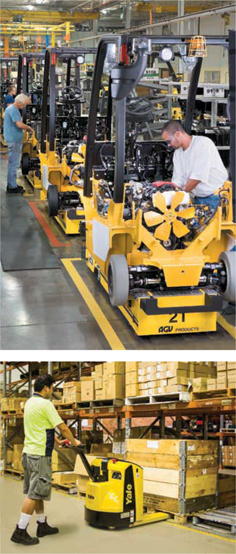
| Top – Yale® 2- to 3-ton internal combustion engine cushion tire lift trucks are assembled at the Berea, Kentucky plant. The trucks are moved through key assembly stages using automated guided vehicles (AGVs).
Bottom – The Yale MP20 is a new global pedestrian pallet truck with a lifting capacity of 4,500 pounds. |
| (1) | For purposes of this annual report, discussions about net income refer to net income attributable to stockholders. |
| (2) | See page 3 for the calculations of EBITDA and return on capital employed and the discussion of non-GAAP items and the related reconciliations to U.S. GAAP measures. |
7
Table of Contents
| For the year ended December 31, 2012, the Company’s operating profit margin was 4.5 percent, 2.5 percent lower than its operating profit margin target of 7 percent at the mid-point of the market cycle. The Company believes the gap to its target operating profit margin can be closed through two main drivers. The first driver is margin enhancement, mainly in lower capacity internal combustion engine (“ICE”) lift trucks. The key to the margin enhancement initiative is to segment the market into three groupings: premium, standard and utility, which allows the business to focus on creating and pricing products to meet the needs of these individual market segments by having the right product at the right price for the right application. | ||
|
A COMPANY COMMITTED TO IMPROVING OPERATING MARGINS BY INCREASING UNIT VOLUMES THROUGH MARKET AND SHARE GROWTH
| ||
| The second and more important driver to improving operating margins and closing the gap is increasing unit volumes through market and share growth. With increased volumes, the Company can better utilize its capacity to gain economies of scale. In 2012, while the global market size, based on orders, was down from 2011 and the Company’s unit shipments also declined, the Company’s backlog increased year over year as a result of increased bookings during the fourth quarter of 2012. The fourth quarter improvement helped the Company attain full-year market share improvements in the Americas and Asia-Pacific compared with 2011, although improvements in Europe in the latter half of the year could not offset market share lost in Europe earlier in 2012. The Company expects to build on this momentum in 2013.
The overall global market is expected to grow moderately in 2013 compared with 2012, driven primarily by increased volumes in the Americas, principally as a result of moderate growth in Brazil and Latin America, and moderate growth in the Asia-Pacific and Middle East and Africa markets. Europe is expected to continue to decline, mainly as a result of Western Europe macro-economic conditions. In the context of these market conditions and expected increases in market share as a result of new product introductions and execution of its strategic initiatives, the Company anticipates an overall increase in shipments and parts volumes in all markets in 2013 compared with 2012, with the majority of this increase driven by the Americas.
The Company anticipates moderate increases in material costs in 2013. Price increases implemented in 2012 and proposed for 2013 are expected generally to offset these anticipated higher material costs in 2013. Although commodity costs stabilized in 2012, these markets are highly volatile and remain sensitive to changes in the global economy. The Company will continue to monitor economic conditions and the resulting effects on costs to determine the need for future price increases. | ||
8
Table of Contents
| ||
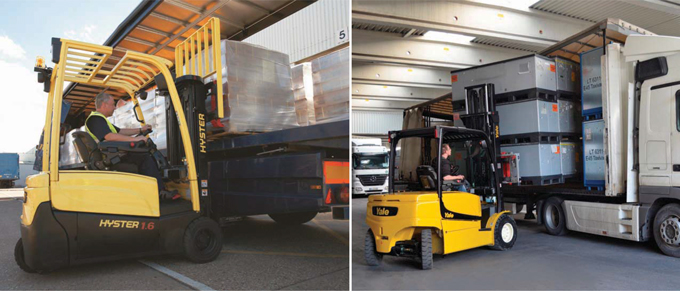
| Above Left – One of Hyster’s new electric-rider lift truck series, the Hyster® J1.6XNT three-wheel pneumatic-tire electric truck, has a lifting capacity of 3,000 to 4,000 pounds.
Above Right – One of Yale’s new electric-rider lift truck series, the Yale® ERP40-VM four-wheel pneumatic tire lift truck series, with a lifting capacity of up to 9,000 pounds, loads components in a logistics operation. |
Price increases will be implemented, as necessary, in response to rising costs, but in a manner that does not erode our competitive position.
Hyster-Yale expects a moderate decline in operating profit in 2013 compared with 2012, with lower operating profit in the first half, and especially the first quarter, of 2013 compared with the prior year somewhat offset by slight improvements in the second half of the year. An increase in operating expenses, as a result of increases in marketing and employee-related costs put in place over the course of 2012 to support the Company’s five strategic initiatives and the full year effect of incremental public company costs Hyster-Yale will incur as a stand-alone public entity, is expected to more than offset an expected increase in gross profit as a result of increased sales volumes. Net income in 2013 is expected to decline compared with 2012 as a result of the absence of the $10.7 million valuation allowance release taken in 2012, an expected higher effective income tax rate primarily because the Company will record the effect of U.S. state and Australian income taxes in 2013 and future years and primarily as a result of a shift in income from Europe to the Americas.
Full-year 2013 geographic segment results are expected to improve in the Americas segment, which includes the North America, Latin America and Brazil markets, but decrease significantly in the Europe segment, which includes the Middle East and Africa markets. Within Europe, the anticipated decline in the Western European market and the absence in 2013 of the significant benefit gained in 2012 from currency hedging are expected to contribute to the decline in the Europe | |
9
Table of Contents
| ||
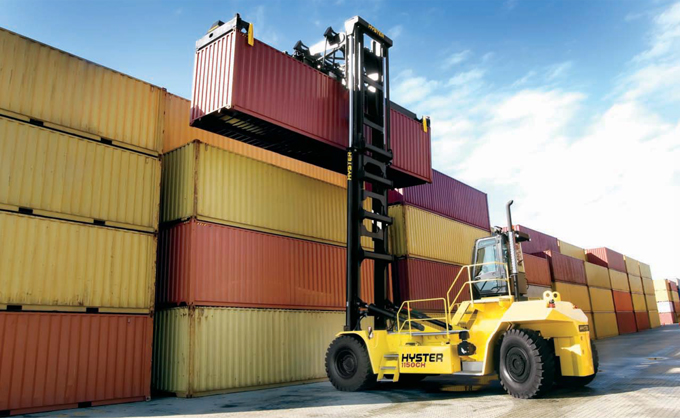
| The new low emission, Tier 4 compliant Hyster® H1050-1150HD-CH Container Handler series of masted top-pick trucks has a lifting capacity up to 88,000 pounds and can stack containers five high in the front row. | segment results. Cash flow before financing activities in 2013 is expected to decline moderately compared with 2012 as the Company anticipates an increase in capital expenditures in 2013, particularly for the construction of a new plant and related information system investments in Brazil.
LONG-TERM STRATEGIC INITIATIVES: As a leading manufacturer of a full range of lift trucks, the Company’s vision is to continue to be a leading globally integrated designer, manufacturer and marketer of a complete range of high-quality, application-tailored lift trucks, offering the lowest cost of ownership, outstanding parts and service support and the best overall value. To achieve this vision and its long-term financial target, the Company is focused on executing five key strategies: (1) understanding customer needs at the product and aftermarket levels in order to create and provide a differentiated, full range of product and service solutions for specific industry applications, (2) offering the lowest cost of ownership by utilizing | |
10
Table of Contents
| the Company’s understanding of customers’ major cost drivers and developing solutions that consistently lower cost of ownership and create a differentiated competitive position, (3) improving the Company’s warehouse market position through enhancing dealer and customer support, adding products, increasing incentives and implementing programs to increase focus on key customers, (4) enhancing independent distribution by implementing programs aimed at broadening account coverage of the market, expanding the Company’s dual-brand ownership strategy and ensuring dealer excellence in all areas of the world, and (5) expanding in Asian markets by offering products geared to the needs of these markets, enhancing distribution excellence and focusing on strategic alliances with local partners in China, India and Japan. | ||
|
FOCUSED ON UNDERSTANDING CUSTOMER NEEDS TO PROVIDE DIFFERENTIATED PRODUCT AND SERVICE SOLUTIONS WITH LOWEST COST OF OWNERSHIP
| ||
|
Above – The Hyster® P2.0S 4,000 pound capacity global Platform Pallet truck. |
The Company’s product pipeline is on track and is expected to provide a continuous stream of new product innovations and product introductions over the next several years to meet customer needs and provide the lowest cost of ownership. The products in the pipeline are also expected to enhance the Company’s competitiveness and market share. To meet specific application needs of its customers, the Company is focusing on developing utility, standard and premium products – utility trucks for low-intensity needs, especially in developing markets, standard trucks for medium-intensity applications in both the developed and developing markets and the Company’s traditional premium Fortis®, Fortens® and Veracitor® trucks for high-intensity needs in developed markets. To this end, the Company has development programs under way for its electric-rider, warehouse, internal combustion engine and big truck product lines. The electric-rider lift truck program is designed to bring a full line of newly designed products to market. The Company launched the 4- to 5-ton electric-rider truck in Europe in July 2012 and expects to launch the final model in the electric-rider lift truck program – the 4- to 5-ton cushion tire electric-rider truck – in the Americas in the first quarter of 2013. The Company also expects to introduce a new European Reach Truck for the warehouse industry in the fourth quarter of 2013.
In mid-2011, the Company began a phased introduction, beginning in certain Latin American markets, of a new range of UTILEV®-branded lift trucks, which meet the needs of lower-intensity users. This new UTILEV®-branded series of ICE utility lift trucks was gradually introduced into global markets, specifically Europe in early 2012 and North America in late 2012, and is expected to continue to gain market | |
11
Table of Contents
| position in 2013. The Company currently offers only 1- to 3-ton ICE UTILEV ® lift truck models and one model for both Hyster® and Yale® of the standard ICE lift truck for medium-duty applications. In 2013, the Company expects to begin expanding the UTILEV ® lift truck series. The Company also expects to add more trucks to the standard model series in future years. All of these new products are expected to improve revenues and enhance operating margins, as well as help increase customer satisfaction. In addition, stricter diesel emission regulations for new trucks began to go into effect in 2011 and will be fully in effect by 2015 in certain global markets. The Company has begun to launch and expects to continue to launch lift truck series over this period that will meet these new emission requirements.
The Company is manufacturing its new products in a manner that focuses on understanding its customers’ major cost drivers and developing solutions that consistently lower cost of ownership. The Company has been successful in reducing fuel consumption, a significant direct cost for its customers, on certain truck models by up to 15 percent. The Company is also introducing telemetry capabilities in its lift trucks to deliver additional information and value to its customers, allowing the customer to monitor the use of trucks to ensure they are being operated properly and serviced in a timely manner to keep maintenance costs to a minimum. | ||
|
IMPROVE PENETRATION OF THE GROWING WAREHOUSE EQUIPMENT MARKET
| ||
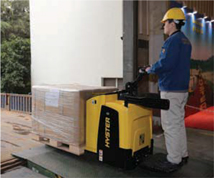
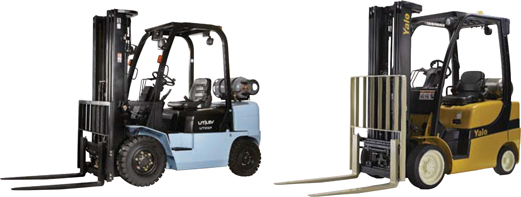
| Bottom Left – The UTILEV® brand forklift truck series, which are basic forklift trucks that meet the needs of utility users.
Bottom Right – The Yale® GC050LX internal combustion engine, standard cushion tire lift truck has a lifting capacity of 5,000 pounds and is targeted at standard applications. |
In 2012, 56 percent of the Company’s revenues were in ICE lift trucks as compared to 26 percent in electric lift trucks. As part of the Company’s efforts to further penetrate the growing warehouse equipment market and increase volumes in electric lift trucks, which dominate this market, it is focusing on upgrading its warehouse product range, helping its dealers improve their specialization in this segment and increasing coverage through direct sales to major accounts.
| |
| ||
12
Table of Contents
| ||
|
ENHANCE INDEPENDENT DISTRIBUTION AND EXPAND IN ASIAN MARKETS
| ||
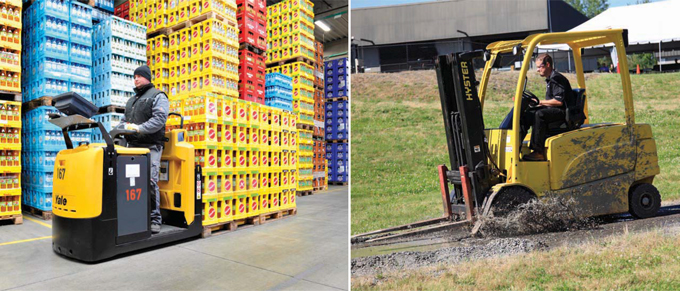
| Above Left – A Yale® MO25 low level order picker, produced in Masate, Italy, is shown operating in a beverage storage operation.
Above Right – The Hyster® J45-70XN pneumatic tire electric truck provides a “Zero Emissions” alternative for 4,500-7,000 pound capacity indoor and outdoor applications previously only serviced by internal combustion powered trucks. |
The Company continues to strengthen its distribution network by adding strong independent dealers, allowing more dual brand representation by dealers and replacing underperforming dealerships. In 2012, a large dealership in the United Kingdom changed ownership, creating the first dual-brand dealer in Europe and a stronger dealer with a greater regional presence. In addition, the Company has just introduced a certified remanufacturing strategy to its dealers that provides them with the ability to sell used equipment more effectively and enhances the Company’s aftermarket parts sales.
Finally, the Company is focused on expanding in the growing Asian market. The Company is opening a new office in Malaysia to spearhead sales efforts in the region. In addition, the Company plans to expand distribution by focusing on strategic alliances with local partners, and leverage the new standard and new utility products, which are more suited to that market, in anticipation of improving share and margins.
LOOKING FORWARD: Hyster-Yale’s strategic initiatives are only one step in its value creation strategy, which is three-fold: (1) achieve market recognition in the short-term through continued dialogue with the investor community regarding | |
13
Table of Contents
| the Company’s operations and strategy, (2) grow unit volume and market share over the next three to five years through the execution of the five strategic initiatives with the objective of achieving the Company’s financial targets and (3) gain significant aftermarket parts business in the longer term as a result of the continued increase in the Company’s installed lift truck population base.
Hyster-Yale’s Class A common stock began trading on October 1, 2012 at an opening price of $40.00 per share and has risen to a current price of approximately $50 per share. As a new focused investment option in the materials handling equipment industry, Hyster-Yale believes the execution of its value creation strategy through its five strategic initiatives, combined with its strong balance sheet, financial flexibility, expected continued strong cash position and strong returns on capital employed, can lead to a further increase in stock valuation, all of which make Hyster-Yale a compelling investment opportunity.
In addition to the regular 25 cent dividend and the special dividend of $2.00 per share, both paid in December 2012, our Board of Directors also approved the repurchase of up to $50 million of the Company’s outstanding Class A common stock. As of December 31, 2012, the Company had purchased 47,348 shares at an average price of $46.49 per share.
We have great confidence in the ability of our management team to achieve the Company’s financial and market objectives in the years ahead as our many experienced and highly motivated professionals build on the Company’s strong 2012 financial results.
¢ ¢ ¢
We would like to welcome Carolyn Corvi, J.C. Butler, Jr. and Claiborne Rankin to our Board of Directors. They join an experienced group of Directors that have served on the Board of NACCO Industries, Inc. We are privileged to have them as Directors.
Finally, we would like to take this opportunity to thank all of the Company’s customers, dealers and suppliers and all of the Hyster-Yale stockholders for their continued support. We would also like to thank all of our employees for their hard work and commitment to achieving our long-term goals. We have a strong group of employees, strong brands and a strategic plan we are excited to be executing. We look forward to our first full year as an independent public company and to the years beyond with enthusiasm.
| ||||

| ||||
14
Table of Contents
OFFICERS AND DIRECTORS
| Officers and Directors of Hyster-Yale Materials Handling, Inc. Alfred M. Rankin, Jr. Chairman, President and Chief Executive Officer Michael P. Brogan President and Chief Executive Officer, NACCO Materials Handling Group, Inc. Charles A. Bittenbender Vice President, General Counsel and Secretary Brian K. Frentzko Vice President, Treasurer Jennifer M. Langer Vice President, Controller Mary D. Maloney Associate General Counsel and Assistant Secretary Lauren E. Miller Senior Vice President, Marketing and Consulting Kenneth C. Schilling Vice President and Chief Financial Officer Suzanne S. Taylor Vice President, Deputy General Counsel and Assistant Secretary
Directors:
J.C. Butler, Jr. Senior Vice President, Finance, Treasurer and Chief Administrative Officer, NACCO Industries, Inc. Carolyn Corvi Retired Vice President and General Manager – Airplane Programs of The Boeing Company John P. Jumper President and Chief Executive Officer, SAIC, Inc. Retired Chief of Staff, United States Air Force Dennis W. LaBarre Partner, Jones Day Alfred M. Rankin, Jr. Chairman, President and Chief Executive Officer of Hyster-Yale Materials Handling, Inc. Chairman of NACCO Materials Handling Group, Inc. Chairman, President and Chief Executive Officer of NACCO Industries, Inc. Claiborne R. Rankin Manager of NCAF Management, LLC, the managing member of North Coast Angel Fund, LLC Michael E. Shannon President of MEShannon & Associates, Inc. Retired Chairman, Chief Financial and Administrative Officer of Ecolab, Inc. Britton T. Taplin Self-employed (personal investments) Eugene Wong Professor Emeritus of the University of California at Berkeley |
Officers of NACCO Materials Handling Group, Inc. Alfred M. Rankin, Jr. Chairman Michael P. Brogan President and Chief Executive Officer Charles A. Bittenbender Vice President, General Counsel and Secretary Gregory J. Breier Vice President, Tax Brian K. Frentzko Vice President, Treasurer Jennifer M. Langer Vice President, Controller Mary D. Maloney Associate General Counsel and Assistant Secretary Lauren E. Miller Senior Vice President, Marketing and Consulting Ralf A. Mock Vice President, Managing Director, Europe, Middle East and Africa Rajiv K. Prasad Vice President, Global Product Development and Manufacturing Victoria L. Rickey Vice President, Asia-Pacific Michael E. Rosberg Vice President, Global Supply Chain Kenneth C. Schilling Vice President and Chief Financial Officer Gopi Somayajula Vice President, Counterbalanced Engineering Suzanne S. Taylor Vice President, Deputy General Counsel and Assistant Secretary Colin Wilson Vice President and Chief Operating Officer, and President, Americas
Additional Executive Leadership:
Americas:
Hugo Moraes Barros President, NMHG Brazil Donald L. Chance, Jr. Vice President, President, NMHG Sales Raymond C. Ulmer Vice President, Finance Americas
Europe, Africa and Middle East: Mark H. Trivett Vice President, Finance, Europe, Middle East and Africa
Asia-Pacific: Tetsuo Sonoda President, Sumitomo NACCO Materials Handling Co., Ltd |
Table of Contents
CORPORATE INFORMATION
| Annual Meeting |
Stock Exchange Listing | |
| The Annual Meeting of Stockholders of |
The New York Stock Exchange | |
| Hyster-Yale Materials Handling, Inc. will be held |
Symbol: HY | |
| on May 8, 2013, at 9:30 a.m. at the corporate |
||
| office located at: 5875 Landerbrook Drive, |
Investor Relations Contact | |
| Cleveland, Ohio 44124 |
Investor questions may be addressed to: | |
| Investor Relations | ||
| Form 10-K |
Hyster-Yale Materials Handling, Inc. | |
| Additional copies of the Company’s |
5875 Landerbrook Drive, Suite 300 | |
| Form 10-K filed with the Securities and |
Cleveland, Ohio 44124 | |
| Exchange Commission are available free |
(440) 229-5168 | |
| of charge through Hyster-Yale’s website |
E-mail: ir@hyster-yale.com | |
| (www.hyster-yale.com) or by request to: |
||
| Investor Relations |
Hyster-Yale Materials Handling Website | |
| Hyster-Yale Materials Handling, Inc. |
Additional information on Hyster-Yale | |
| 5875 Landerbrook Drive, Suite 300 |
may be found at the corporate website, | |
| Cleveland, Ohio 44124 |
www.hyster-yale.com. The Company | |
| (440) 229-5168 |
considers this website to be one of the | |
| primary sources of information for investors | ||
| Stock Transfer Agent and Registrar |
and other interested parties. | |
| Computershare |
||
| 250 Royall Street |
Hyster Global: | |
| Canton, Massachusetts 02021 |
www.hyster.com | |
| (800) 622-6757 |
||
| Yale Global: | ||
| Legal Counsel |
www.yale.com | |
| Jones Day |
||
| North Point |
||
| 901 Lakeside Avenue |
||
| Cleveland, Ohio 44114 |
||
| Independent Registered Public |
||
| Accounting Firm |
||
| Ernst & Young LLP |
||
| 1300 Huntington Building |
||
| 925 Euclid Avenue |
||
| Cleveland, Ohio 44115 |
||
Table of Contents

5875 Landerbrook Drive, Suite 300
Cleveland, Ohio 44124
www.hyster-yale.com
An Equal Opportunity Employer