Attached files
| file | filename |
|---|---|
| 8-K - FORM 8-K - JPMORGAN CHASE & CO | jpmc2013ccarform8kpart2.htm |
| EX-99.1 - JPMORGAN CHASE & CO. PRESS RELEASE DATED MARCH 14, 2013 - JPMORGAN CHASE & CO | jpmc2013ccar2exhibit991.htm |

2 0 1 3 C C A R R E S U L T S & A N N U A L S T R E S S T E S T I N G D I S C L O S U R E March 14, 2013 CCAR & DFAST Supervisory Severely Adverse Scenario Results
Agenda Page 1 2013 Supervisory Severely Adverse Scenario Results 1 Appendix A: Capital Adequacy Assessment Processes & Risk Methodologies 6 Appendix B: DFAST Results – Bank Holding Company 14 Appendix C: DFAST Results – In-scope Bank Entities 17 2 0 1 3 C C A R R E S U L T S & A N N U A L S T R E S S T E S T I N G D I S C L O S U R E
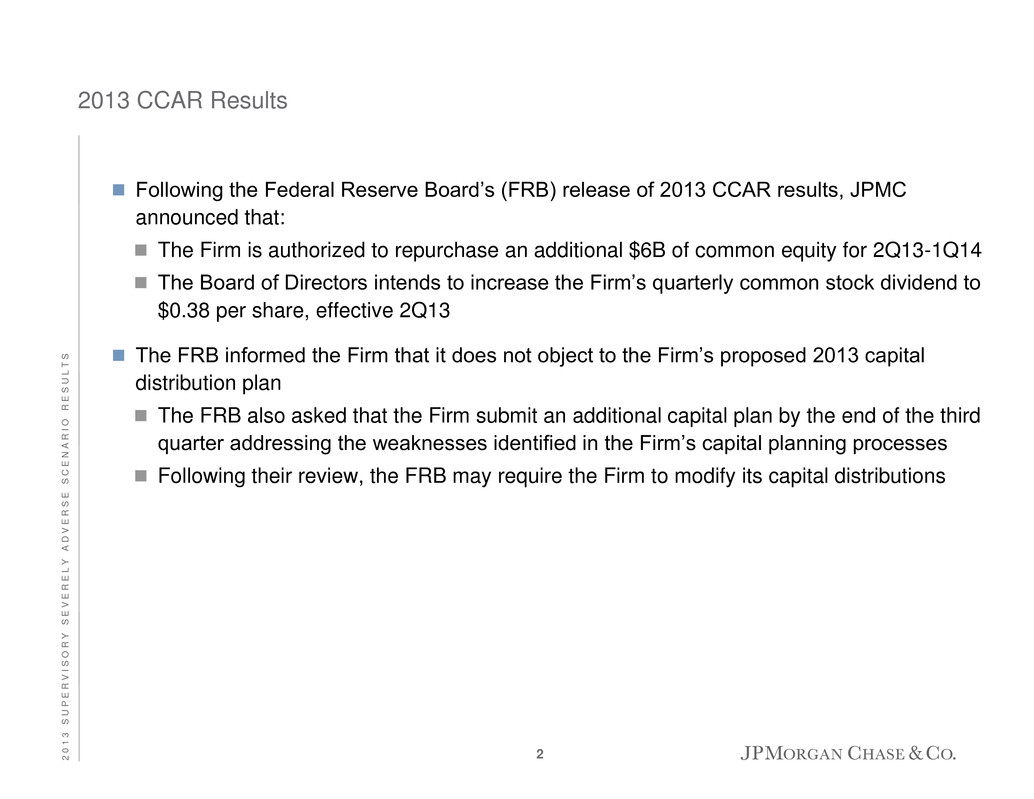
2013 CCAR Results Following the Federal Reserve Board’s (FRB) release of 2013 CCAR results, JPMC announced that: The Firm is authorized to repurchase an additional $6B of common equity for 2Q13-1Q14 The Board of Directors intends to increase the Firm’s quarterly common stock dividend to $0.38 per share, effective 2Q13 The FRB informed the Firm that it does not object to the Firm’s proposed 2013 capital distribution plan The FRB also asked that the Firm submit an additional capital plan by the end of the third quarter addressing the weaknesses identified in the Firm’s capital planning processes Following their review, the FRB may require the Firm to modify its capital distributions 2 2 0 1 3 S U P E R V I S O R Y S E V E R E L Y A D V E R S E S C E N A R I O R E S U L T S
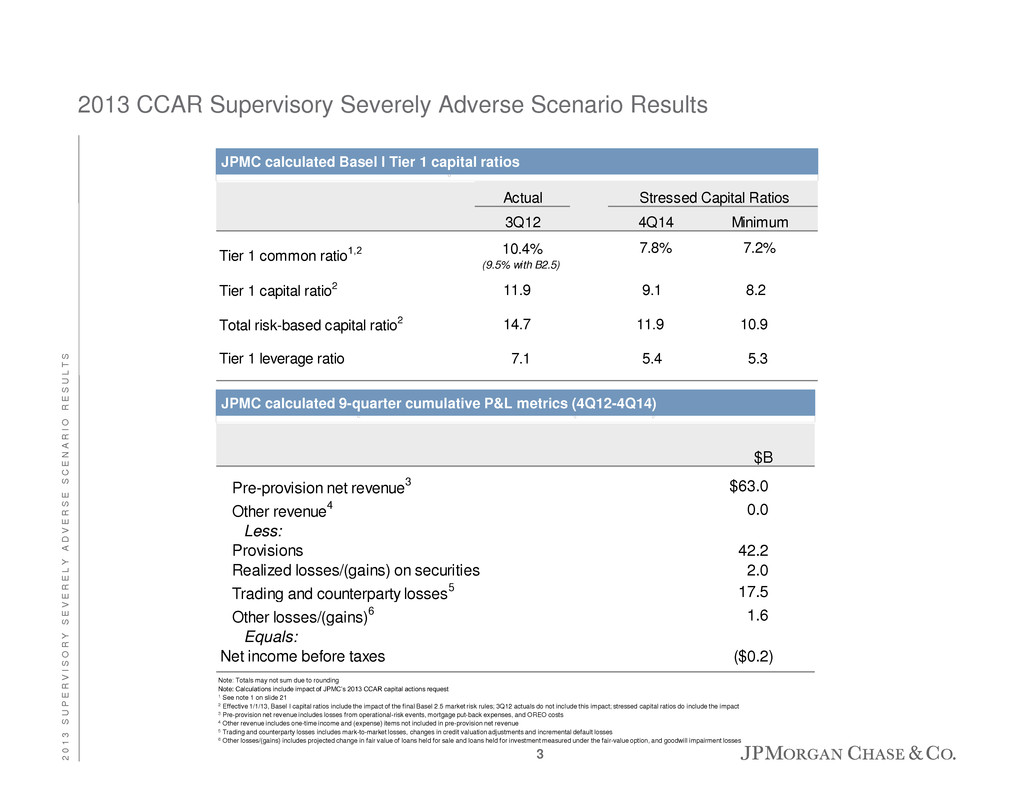
2013 CCAR Supervisory Severely Adverse Scenario Results Note: Totals may not sum due to rounding Note: Calculations include impact of JPMC’s 2013 CCAR capital actions request 1 See note 1 on slide 21 2 Effective 1/1/13, Basel I capital ratios include the impact of the final Basel 2.5 market risk rules; 3Q12 actuals do not include this impact; stressed capital ratios do include the impact 3 Pre-provision net revenue includes losses from operational-risk events, mortgage put-back expenses, and OREO costs 4 Other revenue includes one-time income and (expense) items not included in pre-provision net revenue 5 Trading and counterparty losses includes mark-to-market losses, changes in credit valuation adjustments and incremental default losses 6 Other losses/(gains) includes projected change in fair value of loans held for sale and loans held for investment measured under the fair-value option, and goodwill impairment losses Actual 3Q12 4Q14 Minimum Tier 1 common ratio1,2 10.4% (9.5% with B2.5) 7.8% 1 7.2% 1 Tier 1 capital ratio2 11.9 9.1 8.2 Total risk-based capital ratio2 14.7 11.9 10.9 Tier 1 leverage ratio 7.1 5.4 5.3 Stressed Capital Ratios JPMC calculated Basel I Tier 1 capital ratios $B Pre-provision net revenue 3 $63 0 Other revenue 4 0.0 Less: Provisions 42.2 Realized losses/(gains) on securities 2.0 Trading and counterparty losses 5 17.5 Other losses/(gains) 6 1.6 Equals: Net income before taxes ($0.2) JPMC calculated 9-quarter cumulative P&L metrics (4Q12-4Q14) 3 2 0 1 3 S U P E R V I S O R Y S E V E R E L Y A D V E R S E S C E N A R I O R E S U L T S
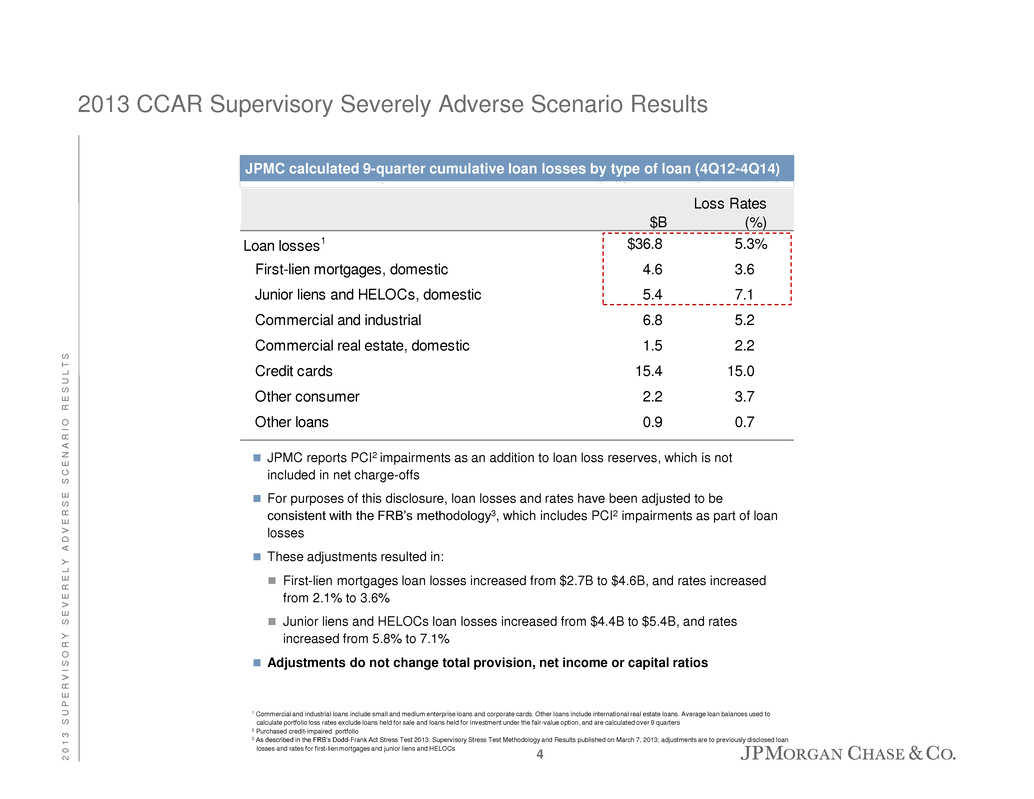
2013 CCAR Supervisory Severely Adverse Scenario Results 1 Commercial and industrial loans include small and medium enterprise loans and corporate cards. Other loans include international real estate loans. Average loan balances used to calculate portfolio loss rates exclude loans held for sale and loans held for investment under the fair-value option, and are calculated over 9 quarters 2 Purchased credit-impaired portfolio 3 As described in the FRB’s Dodd-Frank Act Stress Test 2013: Supervisory Stress Test Methodology and Results published on March 7, 2013; adjustments are to previously disclosed loan losses and rates for first-lien mortgages and junior liens and HELOCs Loan losses1 $36.8 5.3% First-lien mortgages, domestic 4.6 3.6 Junior liens and HELOCs, domestic 5.4 7.1 Commercial and industrial 6.8 5.2 Commercial real estate, domestic 1.5 2.2 Credit cards 15.4 15.0 Other consumer 2.2 3.7 Other loans 0.9 0.7 $B Loss Rates (%) JPMC calculated 9-quarter cumulative loan losses by type of loan (4Q12-4Q14) JPMC reports PCI2 impairments as an addition to loan loss reserves, which is not included in net charge-offs For purposes of this disclosure, loan losses and rates have been adjusted to be consistent with the FRB’s methodology3, which includes PCI2 impairments as part of loan losses These adjustments resulted in: First-lien mortgages loan losses increased from $2.7B to $4.6B, and rates increased from 2.1% to 3.6% Junior liens and HELOCs loan losses increased from $4.4B to $5.4B, and rates increased from 5.8% to 7.1% Adjustments do not change total provision, net income or capital ratios 4 2 0 1 3 S U P E R V I S O R Y S E V E R E L Y A D V E R S E S C E N A R I O R E S U L T S
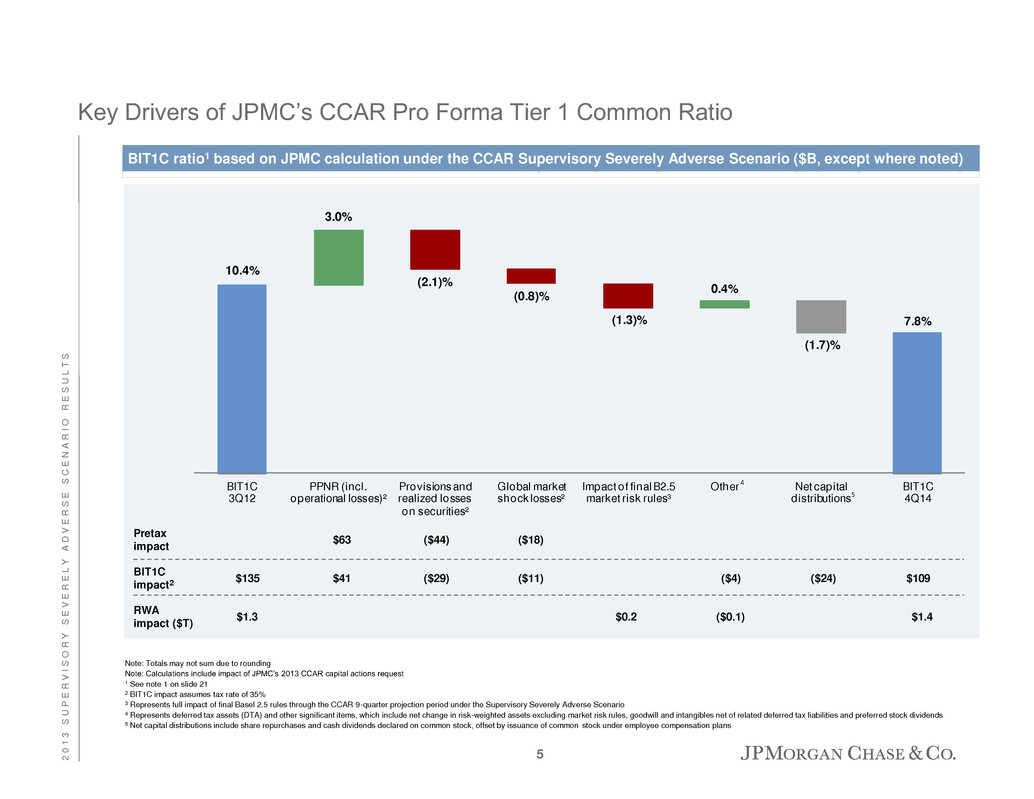
10.4% 7.8% 3.0% (2.1)% (0.8)% (1.3)% 0.4% (1.7)% BIT1C 3Q12 PPNR (incl. operational losses)² Provisions and realized losses on securities² Global market shock losses² Impact of final B2.5 market risk rules³ Other Net capital distributions BIT1C 4Q14 BIT1C impact2 $63 ($44) $109 RWA impact ($T) ($0.1)$1.3 $1.4 5 ($18) $0.2 Pretax impact $135 $41 ($29) ($11) ($4) ($24) 4 BIT1C ratio1 based on JPMC calculation under the CCAR Supervisory Severely Adverse Scenario ($B, except where noted) Key Drivers of JPMC’s CCAR Pro Forma Tier 1 Common Ratio Note: Totals may not sum due to rounding Note: Calculations include impact of JPMC’s 2013 CCAR capital actions request 1 See note 1 on slide 21 2 BIT1C impact assumes tax rate of 35% 3 Represents full impact of final Basel 2.5 rules through the CCAR 9-quarter projection period under the Supervisory Severely Adverse Scenario 4 Represents deferred tax assets (DTA) and other significant items, which include net change in risk-weighted assets excluding market risk rules, goodwill and intangibles net of related deferred tax liabilities and preferred stock dividends 5 Net capital distributions include share repurchases and cash dividends declared on common stock, offset by issuance of common stock under employee compensation plans 5 2 0 1 3 S U P E R V I S O R Y S E V E R E L Y A D V E R S E S C E N A R I O R E S U L T S
Agenda Page 6 Appendix A: Capital Adequacy Assessment Processes & Risk Methodologies 6 2013 Supervisory Severely Adverse Scenario Results 1 Appendix B: DFAST Results – Bank Holding Company 14 Appendix C: DFAST Results – In-scope Bank Entities 17 2 0 1 3 C C A R R E S U L T S & A N N U A L S T R E S S T E S T I N G D I S C L O S U R E
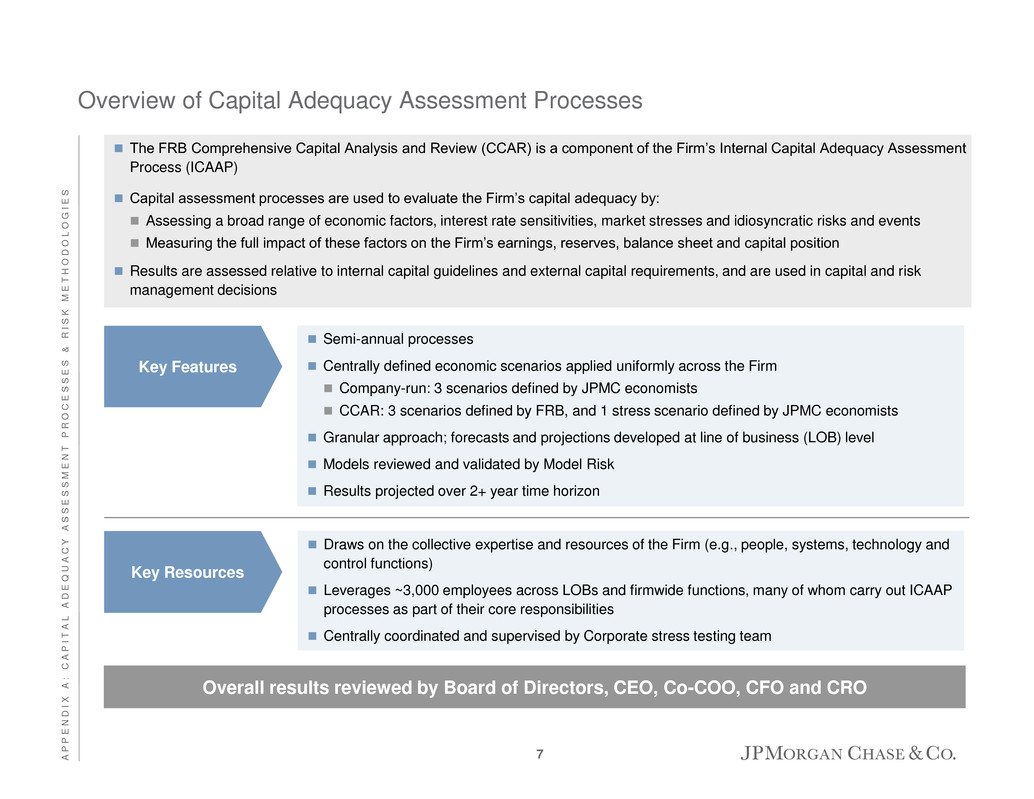
The FRB Comprehensive Capital Analysis and Review (CCAR) is a component of the Firm’s Internal Capital Adequacy Assessment Process (ICAAP) Capital assessment processes are used to evaluate the Firm’s capital adequacy by: Assessing a broad range of economic factors, interest rate sensitivities, market stresses and idiosyncratic risks and events Measuring the full impact of these factors on the Firm’s earnings, reserves, balance sheet and capital position Results are assessed relative to internal capital guidelines and external capital requirements, and are used in capital and risk management decisions Overview of Capital Adequacy Assessment Processes Semi-annual processes Centrally defined economic scenarios applied uniformly across the Firm Company-run: 3 scenarios defined by JPMC economists CCAR: 3 scenarios defined by FRB, and 1 stress scenario defined by JPMC economists Granular approach; forecasts and projections developed at line of business (LOB) level Models reviewed and validated by Model Risk Results projected over 2+ year time horizon Key Features Draws on the collective expertise and resources of the Firm (e.g., people, systems, technology and control functions) Leverages ~3,000 employees across LOBs and firmwide functions, many of whom carry out ICAAP processes as part of their core responsibilities Centrally coordinated and supervised by Corporate stress testing team Key Resources Overall results reviewed by Board of Directors, CEO, Co-COO, CFO and CRO 7 A P P E N D I X A : C A P I T A L A D E Q U A C Y A S S E S S M E N T P R O C E S S E S & R I S K M E T H O D O L O G I E S
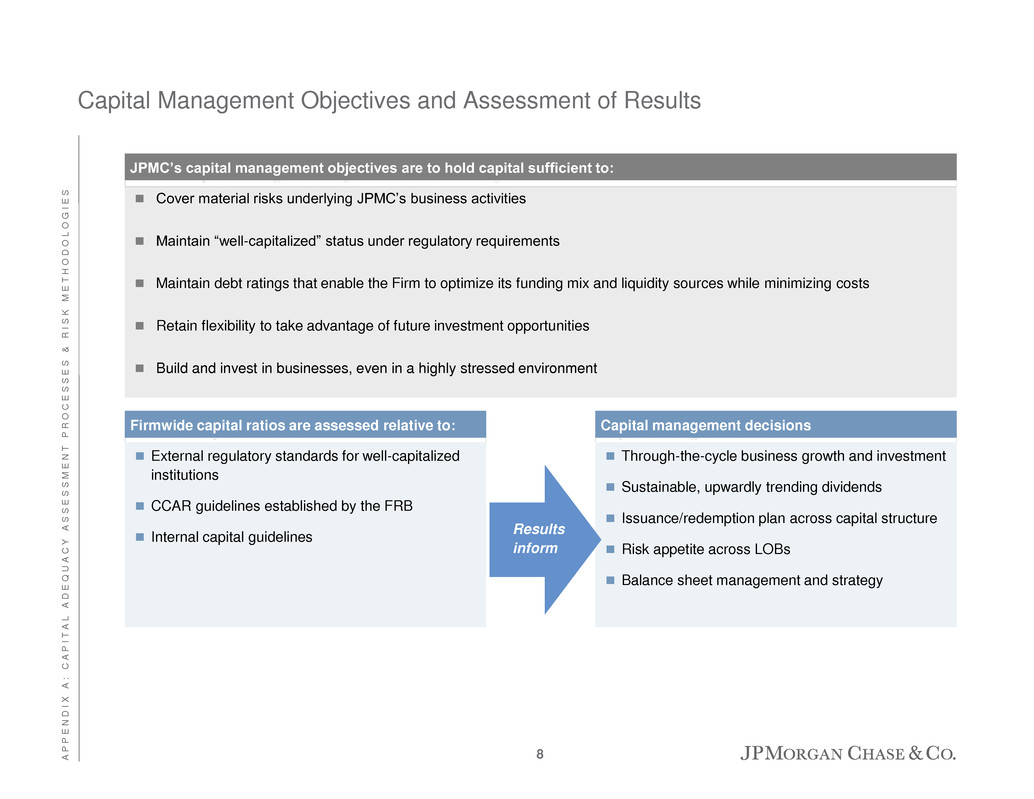
Capital Management Objectives and Assessment of Results Cover material risks underlying JPMC’s business activities Maintain “well-capitalized” status under regulatory requirements Maintain debt ratings that enable the Firm to optimize its funding mix and liquidity sources while minimizing costs Retain flexibility to take advantage of future investment opportunities Build and invest in businesses, even in a highly stressed environment JPMC’s capital management objectives are to hold capital sufficient to: Firmwide capital ratios are assessed relative to: External regulatory standards for well-capitalized institutions CCAR guidelines established by the FRB Internal capital guidelines Capital management decisions Through-the-cycle business growth and investment Sustainable, upwardly trending dividends Issuance/redemption plan across capital structure Risk appetite across LOBs Balance sheet management and strategy Results inform 8 A P P E N D I X A : C A P I T A L A D E Q U A C Y A S S E S S M E N T P R O C E S S E S & R I S K M E T H O D O L O G I E S
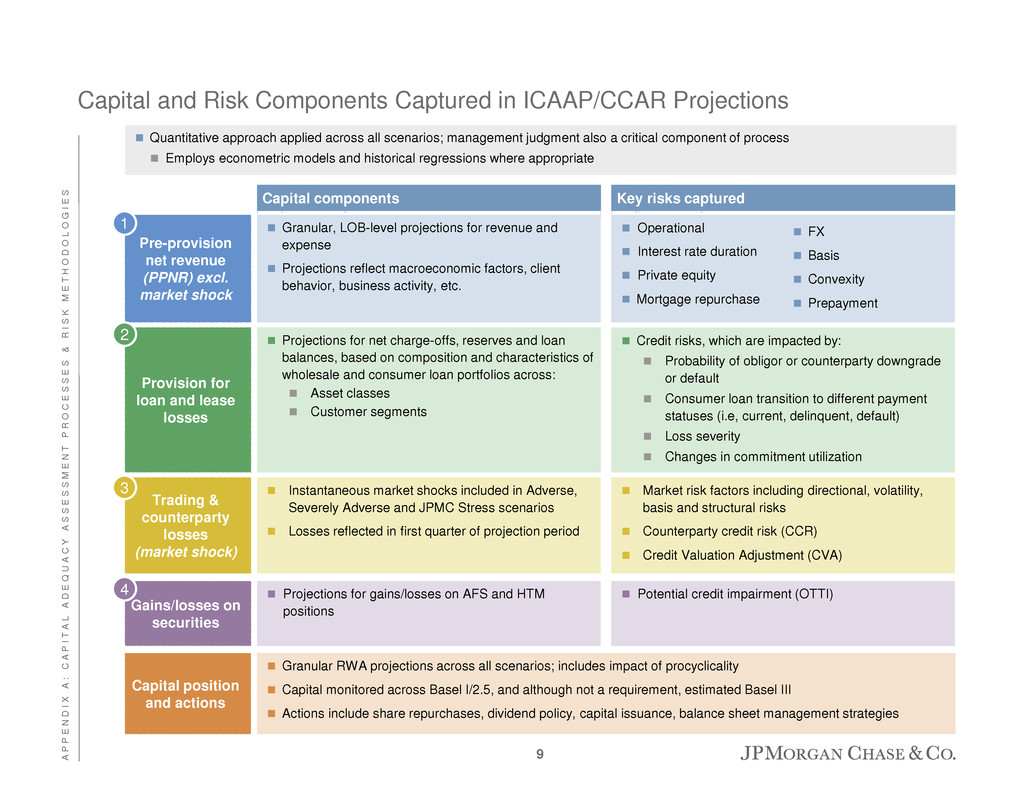
Capital components Key risks captured Capital and Risk Components Captured in ICAAP/CCAR Projections Granular, LOB-level projections for revenue and expense Projections reflect macroeconomic factors, client behavior, business activity, etc. Pre-provision net revenue (PPNR) excl. market shock Operational Interest rate duration Private equity Mortgage repurchase Projections for net charge-offs, reserves and loan balances, based on composition and characteristics of wholesale and consumer loan portfolios across: Asset classes Customer segments Provision for loan and lease losses Credit risks, which are impacted by: Probability of obligor or counterparty downgrade or default Consumer loan transition to different payment statuses (i.e, current, delinquent, default) Loss severity Changes in commitment utilization Instantaneous market shocks included in Adverse, Severely Adverse and JPMC Stress scenarios Losses reflected in first quarter of projection period Trading & counterparty losses (market shock) Market risk factors including directional, volatility, basis and structural risks Counterparty credit risk (CCR) Credit Valuation Adjustment (CVA) Projections for gains/losses on AFS and HTM positions Gains/losses on securities Potential credit impairment (OTTI) Granular RWA projections across all scenarios; includes impact of procyclicality Capital monitored across Basel I/2.5, and although not a requirement, estimated Basel III Actions include share repurchases, dividend policy, capital issuance, balance sheet management strategies Capital position and actions 1 2 3 4 Quantitative approach applied across all scenarios; management judgment also a critical component of process Employs econometric models and historical regressions where appropriate FX Basis Convexity Prepayment 9 A P P E N D I X A : C A P I T A L A D E Q U A C Y A S S E S S M E N T P R O C E S S E S & R I S K M E T H O D O L O G I E S
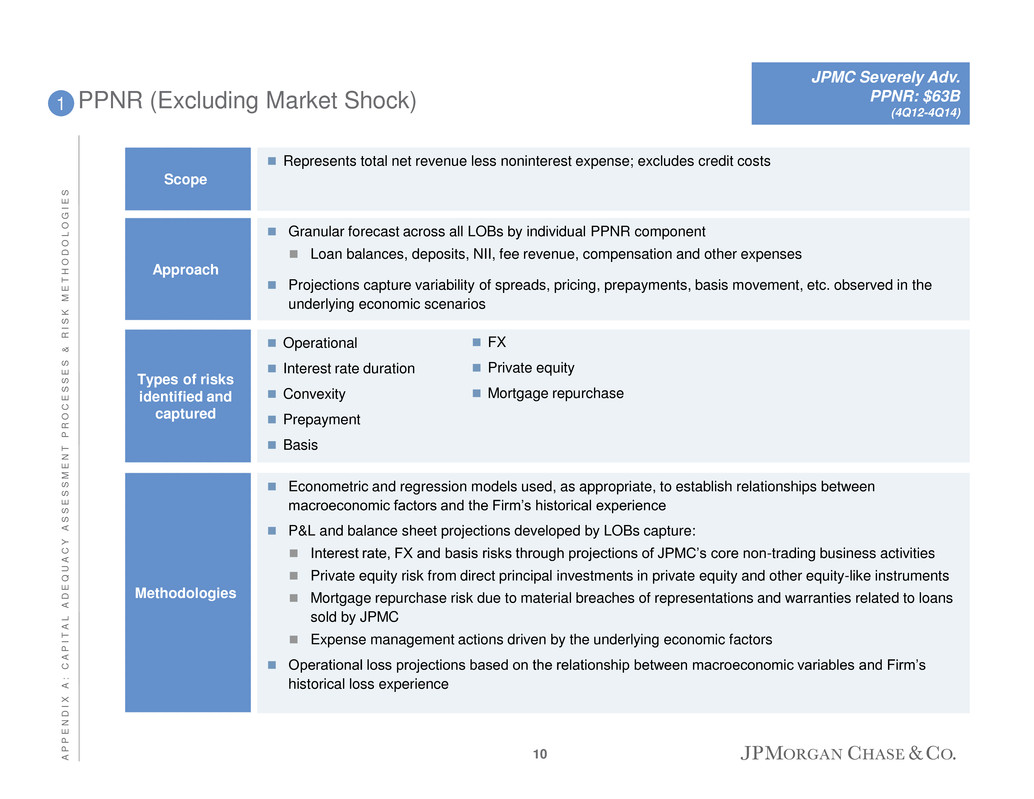
PPNR (Excluding Market Shock) Operational Interest rate duration Convexity Prepayment Basis Types of risks identified and captured 1 Econometric and regression models used, as appropriate, to establish relationships between macroeconomic factors and the Firm’s historical experience P&L and balance sheet projections developed by LOBs capture: Interest rate, FX and basis risks through projections of JPMC’s core non-trading business activities Private equity risk from direct principal investments in private equity and other equity-like instruments Mortgage repurchase risk due to material breaches of representations and warranties related to loans sold by JPMC Expense management actions driven by the underlying economic factors Operational loss projections based on the relationship between macroeconomic variables and Firm’s historical loss experience Methodologies Represents total net revenue less noninterest expense; excludes credit costs Scope Granular forecast across all LOBs by individual PPNR component Loan balances, deposits, NII, fee revenue, compensation and other expenses Projections capture variability of spreads, pricing, prepayments, basis movement, etc. observed in the underlying economic scenarios Approach FX Private equity Mortgage repurchase JPMC Severely Adv. PPNR: $63B (4Q12-4Q14) 10 A P P E N D I X A : C A P I T A L A D E Q U A C Y A S S E S S M E N T P R O C E S S E S & R I S K M E T H O D O L O G I E S
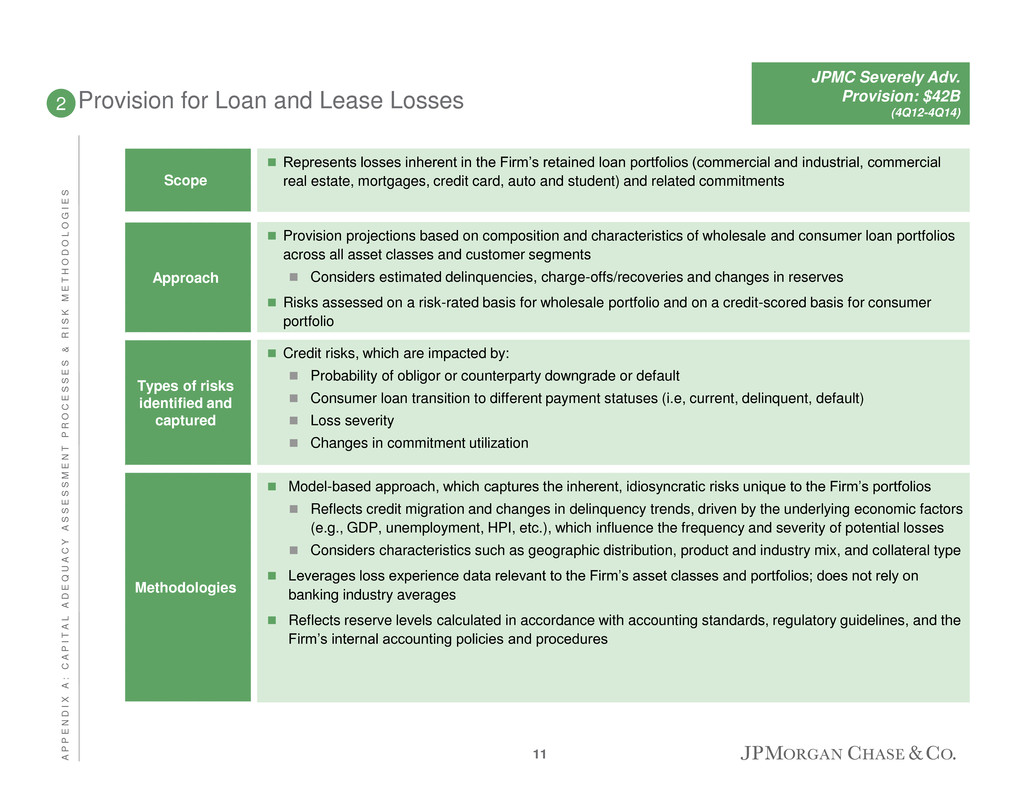
Provision for Loan and Lease Losses Credit risks, which are impacted by: Probability of obligor or counterparty downgrade or default Consumer loan transition to different payment statuses (i.e, current, delinquent, default) Loss severity Changes in commitment utilization Types of risks identified and captured 2 Model-based approach, which captures the inherent, idiosyncratic risks unique to the Firm’s portfolios Reflects credit migration and changes in delinquency trends, driven by the underlying economic factors (e.g., GDP, unemployment, HPI, etc.), which influence the frequency and severity of potential losses Considers characteristics such as geographic distribution, product and industry mix, and collateral type Leverages loss experience data relevant to the Firm’s asset classes and portfolios; does not rely on banking industry averages Reflects reserve levels calculated in accordance with accounting standards, regulatory guidelines, and the Firm’s internal accounting policies and procedures Methodologies Represents losses inherent in the Firm’s retained loan portfolios (commercial and industrial, commercial real estate, mortgages, credit card, auto and student) and related commitments Scope Provision projections based on composition and characteristics of wholesale and consumer loan portfolios across all asset classes and customer segments Considers estimated delinquencies, charge-offs/recoveries and changes in reserves Risks assessed on a risk-rated basis for wholesale portfolio and on a credit-scored basis for consumer portfolio Approach JPMC Severely Adv. Provision: $42B (4Q12-4Q14) 11 A P P E N D I X A : C A P I T A L A D E Q U A C Y A S S E S S M E N T P R O C E S S E S & R I S K M E T H O D O L O G I E S
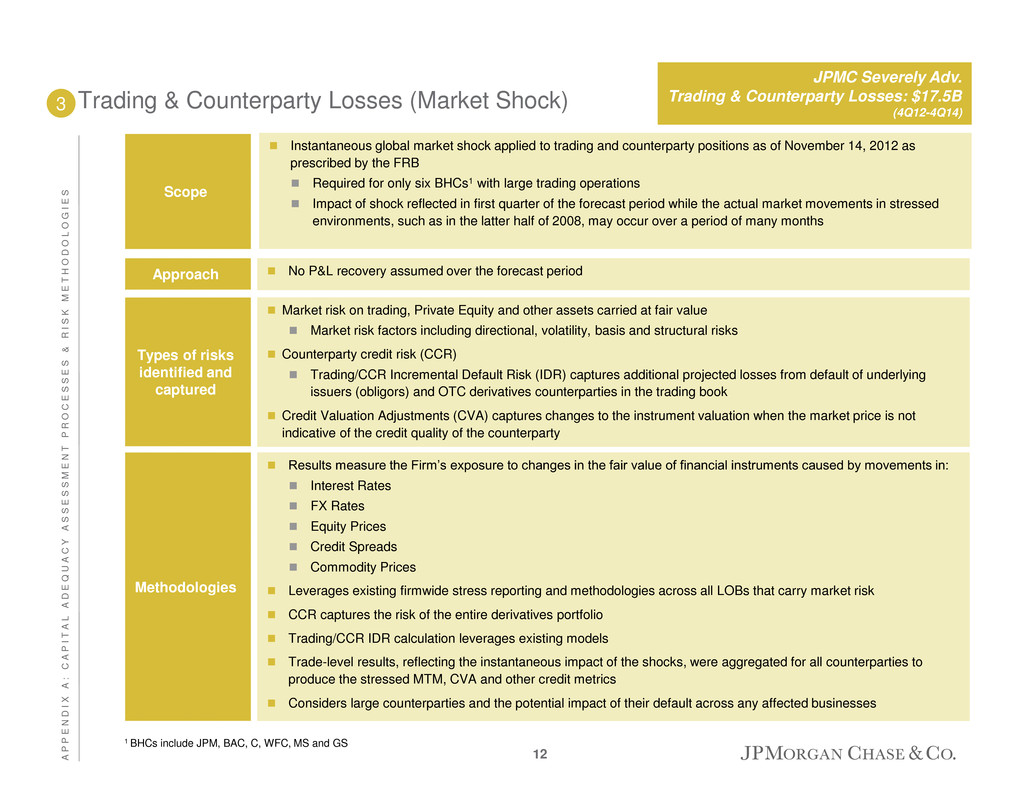
Trading & Counterparty Losses (Market Shock) Market risk on trading, Private Equity and other assets carried at fair value Market risk factors including directional, volatility, basis and structural risks Counterparty credit risk (CCR) Trading/CCR Incremental Default Risk (IDR) captures additional projected losses from default of underlying issuers (obligors) and OTC derivatives counterparties in the trading book Credit Valuation Adjustments (CVA) captures changes to the instrument valuation when the market price is not indicative of the credit quality of the counterparty Types of risks identified and captured 3 Results measure the Firm’s exposure to changes in the fair value of financial instruments caused by movements in: Interest Rates FX Rates Equity Prices Credit Spreads Commodity Prices Leverages existing firmwide stress reporting and methodologies across all LOBs that carry market risk CCR captures the risk of the entire derivatives portfolio Trading/CCR IDR calculation leverages existing models Trade-level results, reflecting the instantaneous impact of the shocks, were aggregated for all counterparties to produce the stressed MTM, CVA and other credit metrics Considers large counterparties and the potential impact of their default across any affected businesses Methodologies No P&L recovery assumed over the forecast period Approach Instantaneous global market shock applied to trading and counterparty positions as of November 14, 2012 as prescribed by the FRB Required for only six BHCs1 with large trading operations Impact of shock reflected in first quarter of the forecast period while the actual market movements in stressed environments, such as in the latter half of 2008, may occur over a period of many months Scope JPMC Severely Adv. Trading & Counterparty Losses: $17.5B (4Q12-4Q14) 1 BHCs include JPM, BAC, C, WFC, MS and GS 12 A P P E N D I X A : C A P I T A L A D E Q U A C Y A S S E S S M E N T P R O C E S S E S & R I S K M E T H O D O L O G I E S
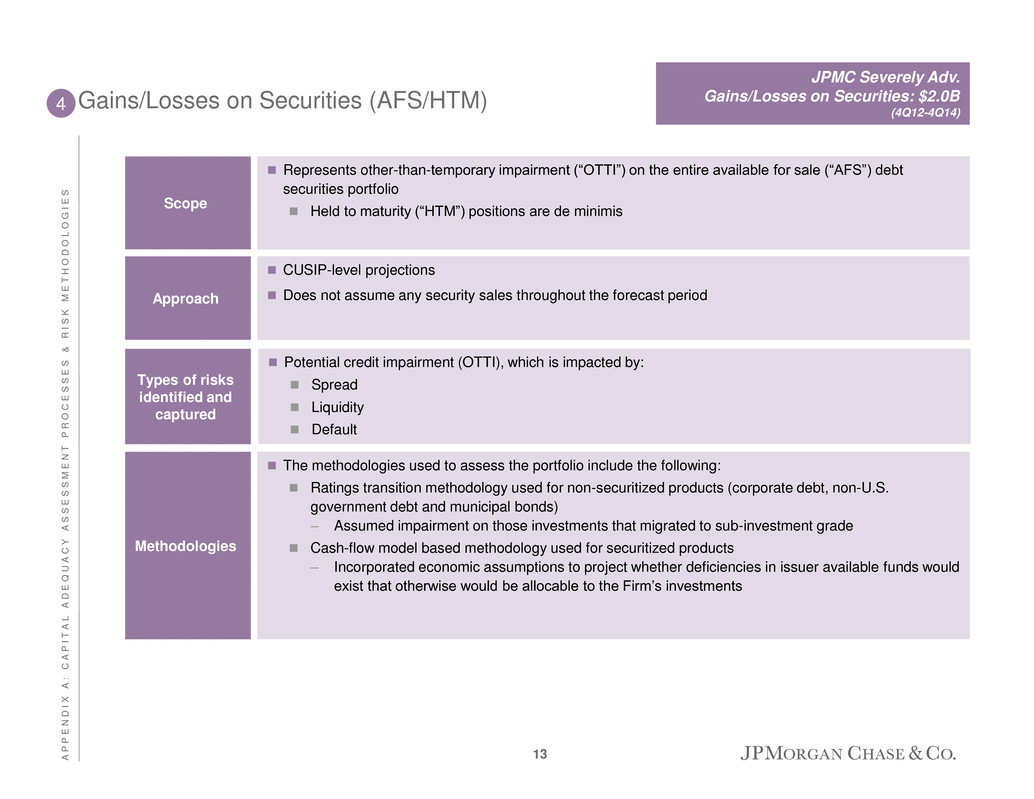
Gains/Losses on Securities (AFS/HTM) Potential credit impairment (OTTI), which is impacted by: Spread Liquidity Default Types of risks identified and captured 4 The methodologies used to assess the portfolio include the following: Ratings transition methodology used for non-securitized products (corporate debt, non-U.S. government debt and municipal bonds) – Assumed impairment on those investments that migrated to sub-investment grade Cash-flow model based methodology used for securitized products – Incorporated economic assumptions to project whether deficiencies in issuer available funds would exist that otherwise would be allocable to the Firm’s investments Methodologies CUSIP-level projections Does not assume any security sales throughout the forecast period Approach Represents other-than-temporary impairment (“OTTI”) on the entire available for sale (“AFS”) debt securities portfolio Held to maturity (“HTM”) positions are de minimis Scope JPMC Severely Adv. Gains/Losses on Securities: $2.0B (4Q12-4Q14) 13 A P P E N D I X A : C A P I T A L A D E Q U A C Y A S S E S S M E N T P R O C E S S E S & R I S K M E T H O D O L O G I E S
Agenda Page 14 Appendix B: DFAST Results – Bank Holding Company 14 2013 Supervisory Severely Adverse Scenario Results 1 Appendix A: Capital Adequacy Assessment Processes & Risk Methodologies 6 Appendix C: DFAST Results – In-scope Bank Entities 17 2 0 1 3 C C A R R E S U L T S & A N N U A L S T R E S S T E S T I N G D I S C L O S U R E
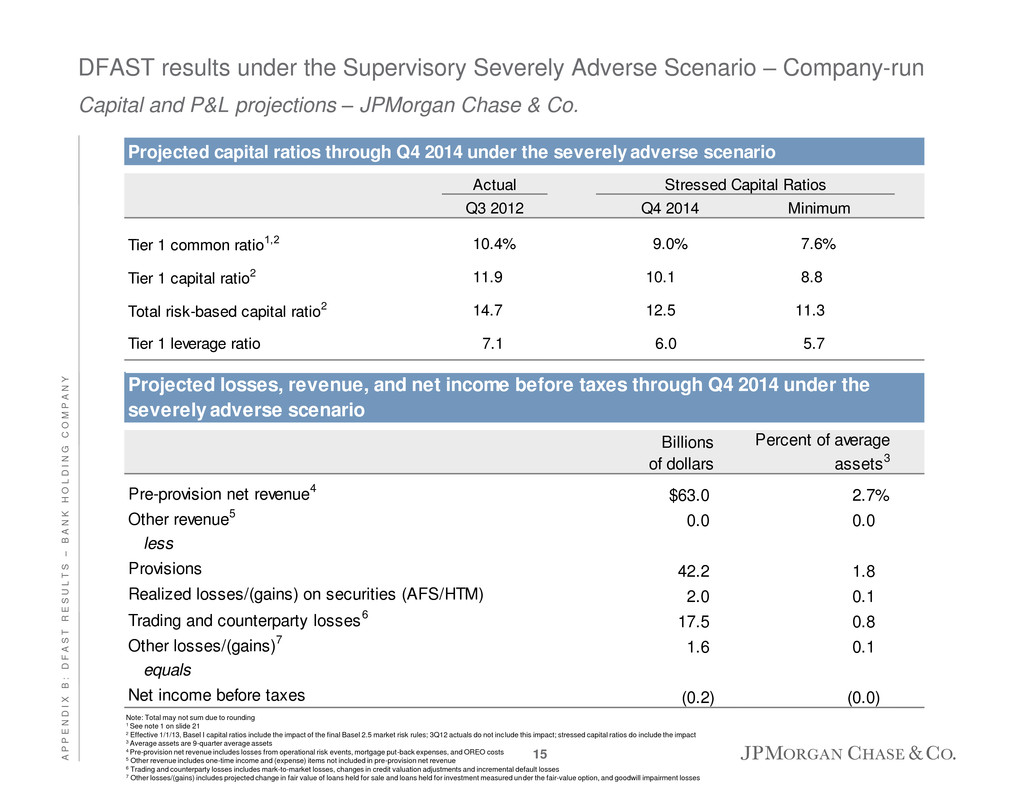
DFAST results under the Supervisory Severely Adverse Scenario – Company-run Capital and P&L projections – JPMorgan Chase & Co. Note: Total may not sum due to rounding 1 See note 1 on slide 21 2 Effective 1/1/13, Basel I capital ratios include the impact of the final Basel 2.5 market risk rules; 3Q12 actuals do not include this impact; stressed capital ratios do include the impact 3 Average assets are 9-quarter average assets 4 Pre-provision net revenue includes losses from operational risk events, mortgage put-back expenses, and OREO costs 5 Other revenue includes one-time income and (expense) items not included in pre-provision net revenue 6 Trading and counterparty losses includes mark-to-market losses, changes in credit valuation adjustments and incremental default losses 7 Other losses/(gains) includes projected change in fair value of loans held for sale and loans held for investment measured under the fair-value option, and goodwill impairment losses Billions of dollars Percent of average assets3 Pre-provision net revenue4 $63.0 2.7% Other revenue5 0.0 0.0 less Provisions 42.2 1.8 Realized losses/(gains) on securities (AFS/HTM) 2.0 0.1 Trading and counterparty losses6 17.5 0.8 Other losses/(gains)7 1.6 0.1 equals Net income before taxes (0.2) (0.0) Projected losses, revenue, and net income before taxes through Q4 2014 under the severely adverse scenario Projected capital ratios through Q4 2014 under the severely adverse scenario Actual Q3 2012 Q4 2014 Minimum Tier 1 commo ratio1,2 10.4% 9 % 7.6% Tier 1 capital ratio2 11.9 1 .1 8.8 Total risk-based capital ratio2 14.7 12.5 11.3 Tier 1 leverage ratio 7.1 6.0 5.7 Stressed Capital Ratios 15 A P P E N D I X B : D F A S T R E S U L T S – B A N K H O L D I N G C O M P A N Y

DFAST results under the Supervisory Severely Adverse Scenario – Company-run Loan loss projections – JPMorgan Chase & Co. ¹ Commercial and industrial loans include small and medium enterprise loans and corporate cards. Other loans include internat ional real estate loans. Average loan balances used to calculate portfolio loss rates exclude loans held for sale and loans held for investment under the fair-value option, and are calculated over 9 quarters 2 Purchased credit-impaired portfolio 3 As described in the FRB’s Dodd-Frank Act Stress Test 2013: Supervisory Stress Test Methodology and Results published on March 7, 2013; adjustments are to previously disclosed loan losses and rates for first-lien mortgages and junior liens and HELOCs Billions of dollars Portfolio loss rates (%) Loan losses1 $36.8 5.3% First-lien mortgages, domestic 4.6 3.6 Junior liens and HELOCs, domestic 5.4 7.1 Commercial and industrial 6.8 5.2 Commercial real estate, domestic 1.5 2.2 Credit cards 15.4 15.0 Other consumer 2.2 3.7 Other loans 0.9 0.7 Projected loan losses by type of loan, for Q4 2012–Q4 2014 under the severely adverse scenario JPMC reports PCI2 impairments as an addition to loan loss reserves, which is not included in net charge-offs For purposes of this disclosure, loan losses and rates have been adjusted to be consistent with the FRB’s methodology3, which includes PCI2 impairments as part of loan losses These adjustments resulted in: First-lien mortgages loan losses increased from $2.7B to $4.6B, and rates increased from 2.1% to 3.6% Junior liens and HELOCs loan losses increased from $4.4B to $5.4B, and rates increased from 5.8% to 7.1% Adjustments do not change total provision, net income or capital ratios 16 A P P E N D I X B : D F A S T R E S U L T S – B A N K H O L D I N G C O M P A N Y
Agenda Page 17 Appendix C: DFAST Results – In-scope Bank Entities 17 2013 Supervisory Severely Adverse Scenario Results 1 Appendix A: Capital Adequacy Assessment Processes & Risk Methodologies 6 Appendix B: DFAST Results – Bank Holding Company 14 2 0 1 3 C C A R R E S U L T S & A N N U A L S T R E S S T E S T I N G D I S C L O S U R E
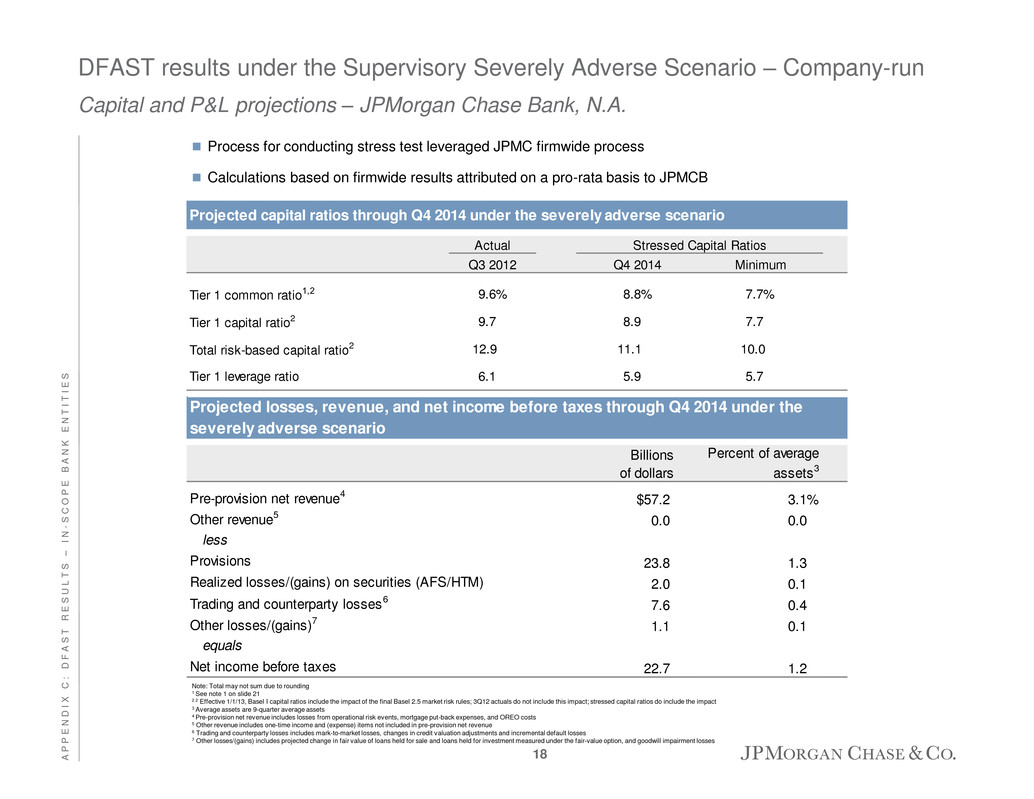
DFAST results under the Supervisory Severely Adverse Scenario – Company-run Capital and P&L projections – JPMorgan Chase Bank, N.A. Process for conducting stress test leveraged JPMC firmwide process Calculations based on firmwide results attributed on a pro-rata basis to JPMCB Billions of dollars Percent of average assets3 Pre-provision net revenue4 $57.2 3.1% Other revenue5 0.0 0.0 less Provisions 23.8 1.3 Realized losses/(gains) on securities (AFS/HTM) 2.0 0.1 Trading and counterparty losses6 7.6 0.4 Other losses/(gains)7 1.1 0.1 equals Net income before taxes 22.7 1.2 Projected losses, revenue, and net income before taxes through Q4 2014 under the severely adverse scenario Projected capital ratios through Q4 2014 under the severely adverse scenario Actual Q3 2012 Q4 2014 Minimum Tier 1 commo ratio1,2 9.6% 8.8% 7.7% Tier 1 capital ratio2 9.7 8 9 7.7 Total risk-based capital ratio2 12.9 11.1 10.0 Tier 1 leverage ratio 6.1 5 9 5.7 Stressed Capital Ratios Note: Total may not sum due to rounding 1 See note 1 on slide 21 2 2 Effective 1/1/13, Basel I capital ratios include the impact of the final Basel 2.5 market risk rules; 3Q12 actuals do not include this impact; stressed capital ratios do include the impact 3 Average assets are 9-quarter average assets 4 Pre-provision net revenue includes losses from operational risk events, mortgage put-back expenses, and OREO costs 5 Other revenue includes one-time income and (expense) items not included in pre-provision net revenue 6 Trading and counterparty losses includes mark-to-market losses, changes in credit valuation adjustments and incremental default losses 7 Other losses/(gains) includes projected change in fair value of loans held for sale and loans held for investment measured under the fair-value option, and goodwill impairment losses 18 A P P E N D I X C : D F A S T R E S U L T S – I N - S C O P E B A N K E N T I T I E S
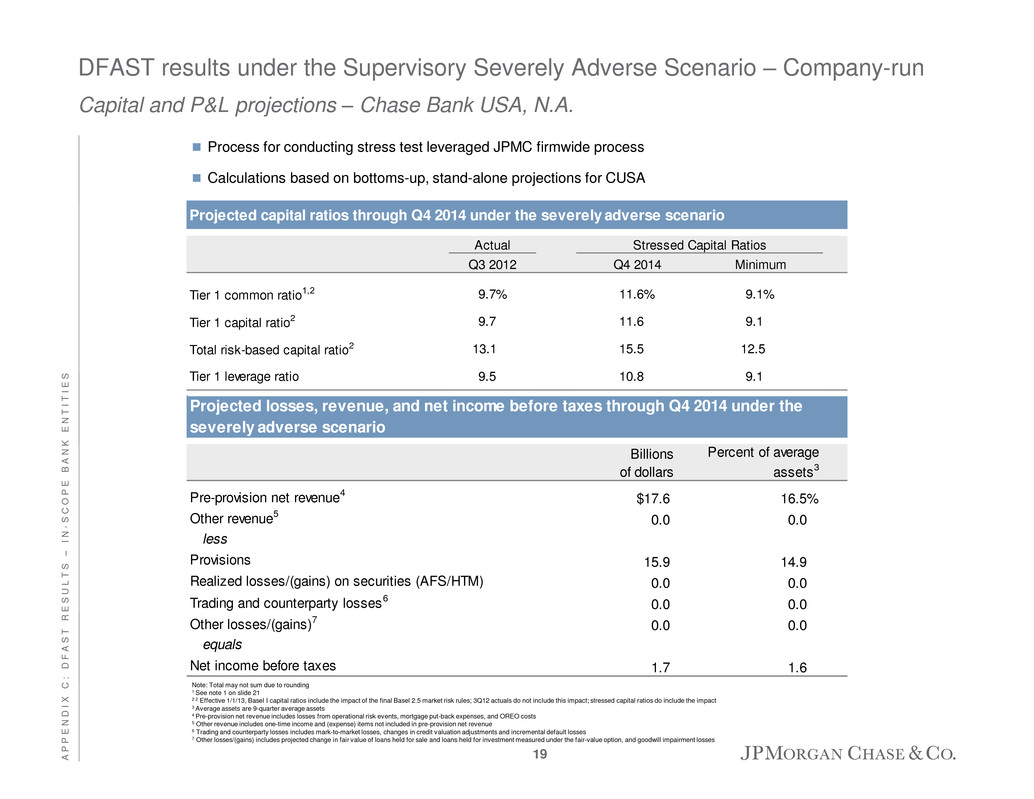
DFAST results under the Supervisory Severely Adverse Scenario – Company-run Capital and P&L projections – Chase Bank USA, N.A. Process for conducting stress test leveraged JPMC firmwide process Calculations based on bottoms-up, stand-alone projections for CUSA Billions of dollars Percent of average assets3 Pre-provision net revenue4 $17.6 16.5% Other revenue5 0.0 0.0 less Provisions 15.9 14.9 Realized losses/(gains) on securities (AFS/HTM) 0.0 0.0 Trading and counterparty losses6 0.0 0.0 Other losses/(gains)7 0.0 0.0 equals Net income before taxes 1.7 1.6 Projected losses, revenue, and net income before taxes through Q4 2014 under the severely adverse scenario Projected capital ratios through Q4 2014 under the severely adverse scenario Actual Q3 2012 Q4 2014 Minimum Tier 1 commo ratio1,2 9.7% 11.6% 9.1% Tier 1 capital ratio2 9.7 11.6 9.1 Total risk-based capital ratio2 13.1 15.5 12.5 Tier 1 leverage ratio 9.5 10.8 9.1 Stressed Capital Ratios Note: Total may not sum due to rounding 1 See note 1 on slide 21 2 2 Effective 1/1/13, Basel I capital ratios include the impact of the final Basel 2.5 market risk rules; 3Q12 actuals do not include this impact; stressed capital ratios do include the impact 3 Average assets are 9-quarter average assets 4 Pre-provision net revenue includes losses from operational risk events, mortgage put-back expenses, and OREO costs 5 Other revenue includes one-time income and (expense) items not included in pre-provision net revenue 6 Trading and counterparty losses includes mark-to-market losses, changes in credit valuation adjustments and incremental default losses 7 Other losses/(gains) includes projected change in fair value of loans held for sale and loans held for investment measured under the fair-value option, and goodwill impairment losses 19 A P P E N D I X C : D F A S T R E S U L T S – I N - S C O P E B A N K E N T I T I E S
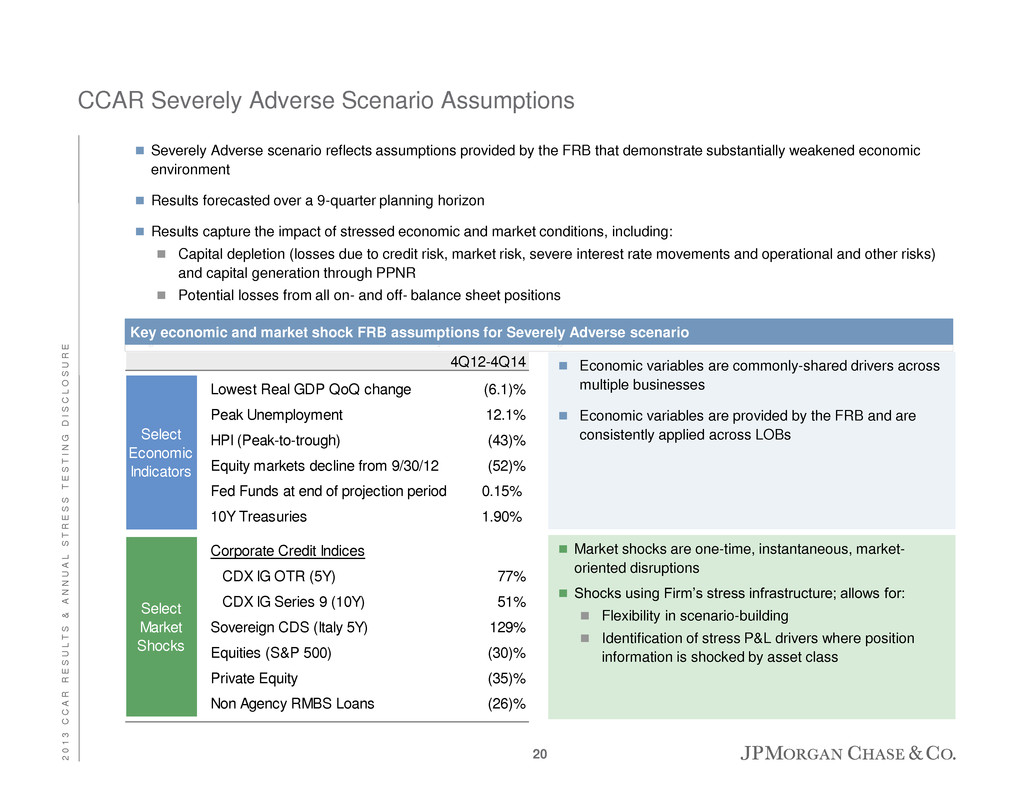
CCAR Severely Adverse Scenario Assumptions Severely Adverse scenario reflects assumptions provided by the FRB that demonstrate substantially weakened economic environment Results forecasted over a 9-quarter planning horizon Results capture the impact of stressed economic and market conditions, including: Capital depletion (losses due to credit risk, market risk, severe interest rate movements and operational and other risks) and capital generation through PPNR Potential losses from all on- and off- balance sheet positions Key economic and market shock FRB assumptions for Severely Adverse scenario Economic variables are commonly-shared drivers across multiple businesses Economic variables are provided by the FRB and are consistently applied across LOBs Market shocks are one-time, instantaneous, market- oriented disruptions Shocks using Firm’s stress infrastructure; allows for: Flexibility in scenario-building Identification of stress P&L drivers where position information is shocked by asset class 4Q12-4Q14 Lowest Real GDP QoQ change (6.1)% Peak Unemployment 12.1% HPI (Peak-to-trough) (43)% Equity markets decline from 9/30/12 (52)% Fed Funds at end of projection period 0.15% 10Y Treasuries 1.90% Corporate Credit Indices CDX IG OTR (5Y) 77% CDX IG Serie 9 (10Y) 51% Sovereign CDS (Italy 5Y) 129% Equities (S&P 500) (30)% Private Equity (35)% Non Agency RMBS Loans (26)% Select Economic Indicators Select Market Shocks 20 2 0 1 3 C C A R R E S U L T S & A N N U A L S T R E S S T E S T I N G D I S C L O S U R E
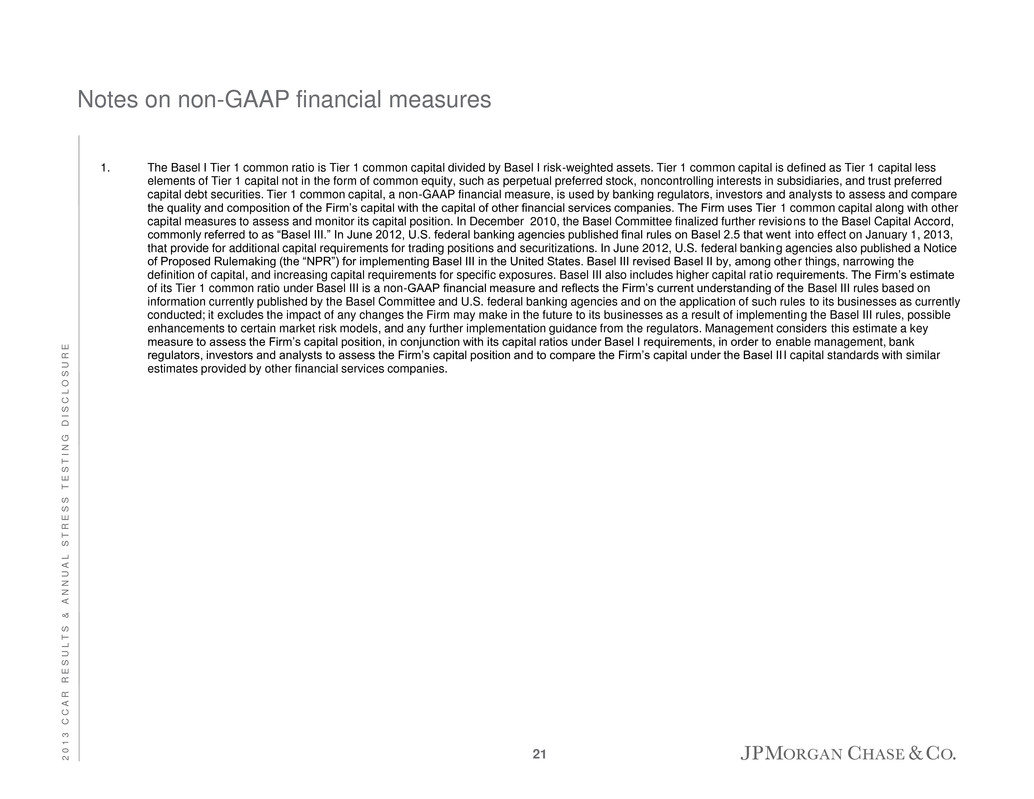
1. The Basel I Tier 1 common ratio is Tier 1 common capital divided by Basel I risk-weighted assets. Tier 1 common capital is defined as Tier 1 capital less elements of Tier 1 capital not in the form of common equity, such as perpetual preferred stock, noncontrolling interests in subsidiaries, and trust preferred capital debt securities. Tier 1 common capital, a non-GAAP financial measure, is used by banking regulators, investors and analysts to assess and compare the quality and composition of the Firm’s capital with the capital of other financial services companies. The Firm uses Tier 1 common capital along with other capital measures to assess and monitor its capital position. In December 2010, the Basel Committee finalized further revisions to the Basel Capital Accord, commonly referred to as “Basel III.” In June 2012, U.S. federal banking agencies published final rules on Basel 2.5 that went into effect on January 1, 2013, that provide for additional capital requirements for trading positions and securitizations. In June 2012, U.S. federal banking agencies also published a Notice of Proposed Rulemaking (the “NPR”) for implementing Basel III in the United States. Basel III revised Basel II by, among other things, narrowing the definition of capital, and increasing capital requirements for specific exposures. Basel III also includes higher capital ratio requirements. The Firm’s estimate of its Tier 1 common ratio under Basel III is a non-GAAP financial measure and reflects the Firm’s current understanding of the Basel III rules based on information currently published by the Basel Committee and U.S. federal banking agencies and on the application of such rules to its businesses as currently conducted; it excludes the impact of any changes the Firm may make in the future to its businesses as a result of implementing the Basel III rules, possible enhancements to certain market risk models, and any further implementation guidance from the regulators. Management considers this estimate a key measure to assess the Firm’s capital position, in conjunction with its capital ratios under Basel I requirements, in order to enable management, bank regulators, investors and analysts to assess the Firm’s capital position and to compare the Firm’s capital under the Basel II I capital standards with similar estimates provided by other financial services companies. Notes on non-GAAP financial measures 21 2 0 1 3 C C A R R E S U L T S & A N N U A L S T R E S S T E S T I N G D I S C L O S U R E

Forward-looking statements This presentation contains forward-looking statements within the meaning of the Private Securities Litigation Reform Act of 1995. These statements are based on the current beliefs and expectations of JPMorgan Chase & Co.’s management and are subject to significant risks and uncertainties. Actual results may differ from those set forth in the forward-looking statements. Factors that could cause JPMorgan Chase & Co.’s actual results to differ materially from those described in the forward-looking statements can be found in JPMorgan Chase & Co.’s Annual Report on Form 10-K for the year ended December 31, 2012, which has been filed with the Securities and Exchange Commission and is available on JPMorgan Chase & Co.’s website (http://investor.shareholder.com/jpmorganchase) and on the Securities and Exchange Commission's website (www.sec.gov). JPMorgan Chase & Co. does not undertake to update the forward-looking statements to reflect the impact of circumstances or events that may arise after the date of the forward-looking statements. 22 2 0 1 3 C C A R R E S U L T S & A N N U A L S T R E S S T E S T I N G D I S C L O S U R E
