Attached files
| file | filename |
|---|---|
| 8-K - FORM 8-K - CAPSTEAD MORTGAGE CORP | d501445d8k.htm |
Exhibit 99.1

Proven
Investment
Strategy
+
Experienced
Management

Capstead invests in a conservatively leveraged
portfolio of residential adjustable-rate
mortgage (“ARM”) securities issued and
guaranteed by Fannie Mae, Freddie Mac or
Ginnie Mae. These agency-guaranteed
mortgage securities are considered to have
limited, if any, credit risk, particularly in light
of federal government support for Fannie Mae
and Freddie Mac.
Our investment strategy is designed to
produce attractive risk-adjusted returns over
the long term, while reducing, but not
eliminating, sensitivity to changes in interest
rates. This strategy differentiates us from our
peers because ARM securities reset to more
current interest rates within a relatively short
period of time allowing for:
The recovery of financing spreads
diminished during periods of rising
interest rates, and
Smaller fluctuations in portfolio values,
and therefore book value, caused by
changes in interest rates compared with
portfolios that contain a significant
amount of fixed-rate mortgage securities.
From a credit risk perspective, the credit
quality of agency-guaranteed mortgage
securities helps ensure that fluctuations in
value due to credit risk should be limited
and financing at reasonable rates and terms
should remain available under stressed
market conditions.
1 | C a p s t e a d M o r t g a g e C o r p o r a t i o n
TO OUR STOCkHOLDeRS:
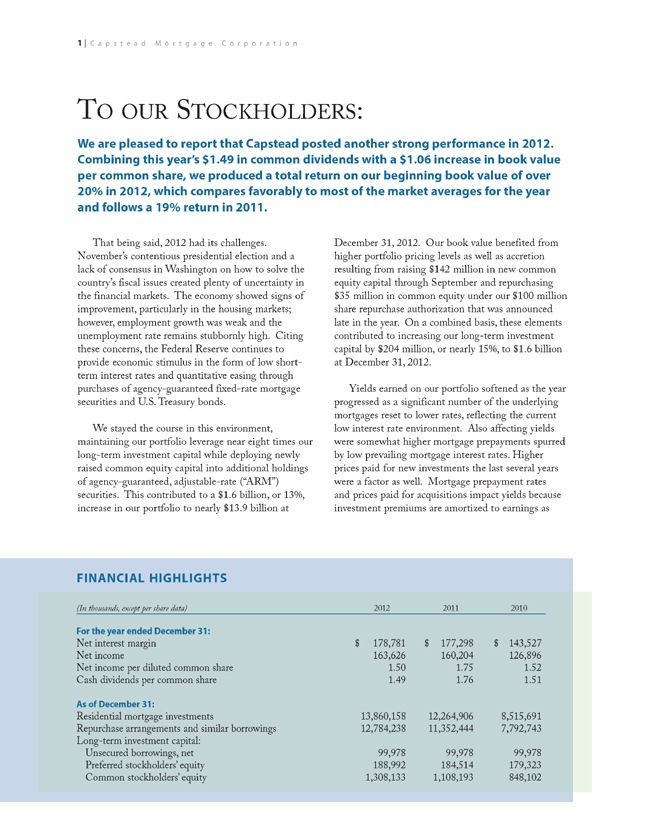
We are pleased to report that Capstead posted another strong performance in 2012.
Combining this year’s $1.49 in common dividends with a $1.06 increase in book value
per common share, we produced a total return on our beginning book value of over
20% in 2012, which compares favorably to most of the market averages for the year
and follows a 19% return in 2011.
(In thousands, except per share data) 2012 2011 2010
For the year ended December 31:
Net interest margin $ 178,781 $ 177,298 $ 143,527
Net income 163,626 160,204 126,896
Net income per diluted common share 1.50 1.75 1.52
Cash dividends per common share 1.49 1.76 1.51
As of December 31:
Residential mortgage investments 13,860,158 12,264,906 8,515,691
Repurchase arrangements and similar borrowings 12,784,238 11,352,444 7,792,743
Long-term investment capital:
Unsecured borrowings, net 99,978 99,978 99,978
Preferred stockholders’ equity 188,992 184,514 179,323
Common stockholders’ equity 1,308,133 1,108,193 848,102
FINANCIAL HIGHLIGHTS
That being said, 2012 had its challenges.
November’s contentious presidential election and a
lack of consensus in Washington on how to solve the
country’s fiscal issues created plenty of uncertainty in
the financial markets. The economy showed signs of
improvement, particularly in the housing markets;
however, employment growth was weak and the
unemployment rate remains stubbornly high. Citing
these concerns, the Federal Reserve continues to
provide economic stimulus in the form of low shortterm
interest rates and quantitative easing through
purchases of agency-guaranteed fixed-rate mortgage
securities and U.S.Treasury bonds.
We stayed the course in this environment,
maintaining our portfolio leverage near eight times our
long-term investment capital while deploying newly
raised common equity capital into additional holdings
of agency-guaranteed, adjustable-rate (“ARM”)
securities. This contributed to a $1.6 billion, or 13%,
increase in our portfolio to nearly $13.9 billion at
December 31, 2012. Our book value benefited from
higher portfolio pricing levels as well as accretion
resulting from raising $142 million in new common
equity capital through September and repurchasing
$35 million in common equity under our $100 million
share repurchase authorization that was announced
late in the year. On a combined basis, these elements
contributed to increasing our long-term investment
capital by $204 million, or nearly 15%, to $1.6 billion
at December 31, 2012.
Yields earned on our portfolio softened as the year
progressed as a significant number of the underlying
mortgages reset to lower rates, reflecting the current
low interest rate environment. Also affecting yields
were somewhat higher mortgage prepayments spurred
by low prevailing mortgage interest rates.Higher
prices paid for new investments the last several years
were a factor as well. Mortgage prepayment rates
and prices paid for acquisitions impact yields because
investment premiums are amortized to earnings as
2 | C a p s t e a d M o r t g a g e C o r p o r a t i o n
yield adjustments over the life of the portfolio.
Meanwhile, our overall borrowing rates were flat year
over year, as higher market rates for short-term
borrowings offset benefits of lower hedging costs as
older, higher-rate interest rate swap agreements were
replaced at more favorable rates. We reported net
income of $164 million for 2012, up from $160 million
in 2011, while net income per diluted common share
declined 14% year over year to $1.50. This reflects
a 19% increase in average diluted common shares
outstanding resulting from raising $374 million in
new common equity capital over the past two years.
Looking forward, we believe many of the factors
leading to declining yields and higher short-term
borrowing rates during 2012 have largely run their
course. Further declines in weighted average coupons
should be muted given that an increasing number of
mortgage loans underlying our portfolio are at or near
fully indexed levels. Prevailing mortgage rates are off
the lows seen last fall, contributing to expectations that
refinancing activity may decline as 2013 progresses.
Furthering our optimism is our exclusive focus on
ARM securities, over half of which were originated
prior to 2008. Most of the mortgage loans underlying
these securities carry coupon interest rates at or below
current fixed mortgage rates, diminishing the economic
advantage, if any, of refinancing. Additionally, for
many of these homeowners, refinancing continues to be
hampered by low housing prices and credit problems.
As a result, we anticipate that mortgage prepayment
rates will remain manageable in 2013. As for our
borrowing costs, we are seeing lower market rates for
short-term borrowings than rates that were common
late in 2012. Additionally, we will benefit from lower
hedging costs as older and higher-rate interest rate
swap agreements expiring during 2013 are replaced at
significantly lower rates. Considering these positive
developments, we are expecting relatively stable
quarterly results in 2013.
We believe our focus on investing in a portfolio
of agency-guaranteed ARM securities is a prudent
investment strategy that can produce attractive riskadjusted
returns over the long term while reducing,
but not eliminating, sensitivity to changes in interest
rates. By focusing solely on agency-guaranteed ARM
securities we have differentiated Capstead from our
mortgage ReIT peers, many of which invest in fixedrate
and/or private label residential mortgage securities.
Coupon interest rates on mortgage loans underlying
ARM securities reset to more current interest rates
within a relatively short period of time. This allows
for a recovery of financing spreads diminished during
periods of rising interest rates and better insulates
our book value from changes in the interest rate
environment because resulting fluctuations in the value
of ARM securities are typically smaller compared to
fixed-rate mortgage securities. From a credit risk
perspective, agency-guaranteed securities are considered
to have limited, if any, credit risk, in light of federal
government support for Fannie Mae and Freddie Mac.
This support has largely alleviated concerns regarding
the ability of these government-sponsored enterprises
to fulfill their guarantee obligations.
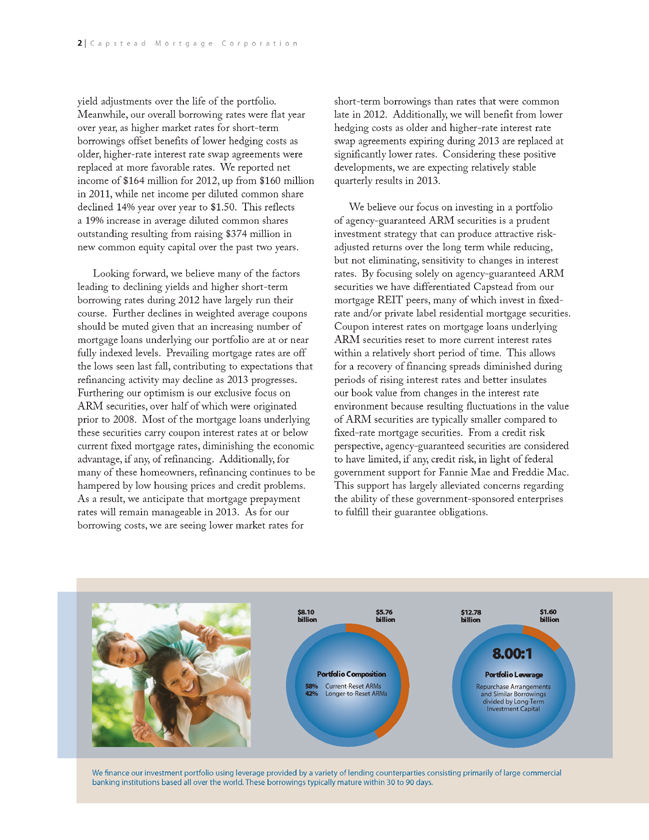
We finance our investment portfolio using leverage provided by a variety of lending counterparties consisting primarily of large commercial
banking institutions based all over the world. These borrowings typically mature within 30 to 90 days.
$5.76
billion
$8.10
billion
PortfolioComposition
58% Current-Reset ARMs
42% Longer-to-Reset ARMs

We believe our focus on
investing in a portfolio of
agency-guaranteed ARM
securities is a prudent
investment strategy that
can produce attractive riskadjusted
returns over the long
term while reducing, but not
eliminating, sensitivity to
changes in interest rates.

(As of or for the year ended December 31)
(In thousands, except percentages and ratios) 2012 2011 2010 2009 2008
Portfolio acquisitions (principal amount) $4,206,459 $5,673,803 $3,299,600 $1,969,113 $2,800,579
Portfolio runoff (principal amount) 2,784,687 2,127,812 2,932,978 1,513,967 1,511,362
Common equity capital raised 142,036 231,673 10,423 81,441 280,716
Year-end portfolio leverage ratio 8.00:1 8.15:1 6.91:1 6.67:1 7.85:1
Average Nnancing spreads on
residential mortgage investments 1.38% 1.68% 1.93% 2.42% 1.67%
Total average Nnancing spreads 1.26 1.56 1.74 2.23 1.59
Average mortgage prepayment rate
(expressed as a constant prepayment rate or CPR) 17.18 16.10 29.11 16.56 16.00
Return on average long-term investment capital 10.98 13.14 12.08 13.34 16.52
Return on average common equity capital 11.15 13.94 12.68 14.90 21.03
Return on beginning book value
(change in book value plus dividends) 20.37 18.80 12.84 55.69 20.65
KEY OPERATING DATA
Another differentiating factor between us and
most other mortgage ReITs is that we are internally
managed, meaning all of our investing activities are
performed by Capstead employees, not by an external
advisor. Additionally, approximately two-thirds of
our employee compensation expense for 2012 was
performance-based, with a significant amount of this
compensation awarded in shares of Capstead stock.
We believe this internally managed structure not only
avoids concerns regarding conflicts of interest unique
to externally managed companies, it also provides a
higher level of transparency regarding how we have
aligned the financial interests of our employees with
those of our stockholders through our compensation
practices. This strong alignment of interests through
the use of performance-based compensation practices
is reflected in an 11% year over year decrease in our
employee compensation costs for 2012.
Our future returns are predicated on our ability
to continue to produce attractive dividends while
preserving book value, both of which can fluctuate with
changes in market conditions. These returns may be
augmented by accretive capital raises when we can
invest new capital at attractive prices, as well as
opportunistic share repurchases should our shares trade
at a significant discount to book value and attractivelypriced
investments are not available. We believe that
by staying focused on our investment strategy of
managing a conservatively levered portfolio of agencyguaranteed
ARM securities, we are providing our
stockholders the opportunity to continue to prosper
over time.
On behalf of our board of directors and all of our
employees, thank you for your continued support
and investment.
Sincerely,
Andrew F. Jacobs
President and CeO
February 28, 2013
5 | C a p s t e a d M o r t g a g e C o r p o r a t i o n
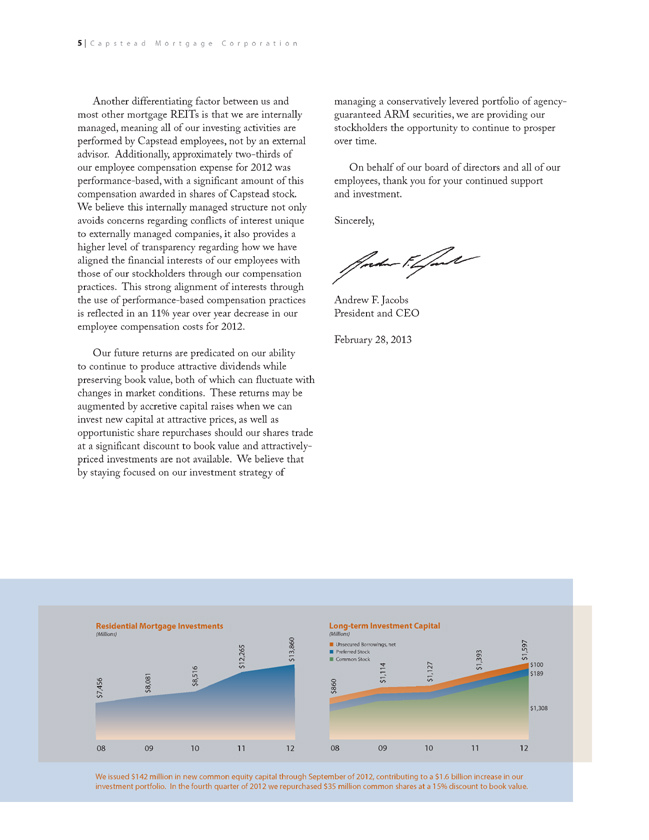
Residential Mortgage Investments
(Millions)
08 09 10 11 12
$7,456
$8,081
$8,516
$12,265
$13,860
We issued $142 million in new common equity capital through September of 2012, contributing to a $1.6 billion increase in our
investment portfolio. In the fourth quarter of 2012 we repurchased $35 million common shares at a 15% discount to book value.
Long-term Investment Capital
(Millions)
08 09 10 11 12
$1,597
$1,393
$1,127
$860
$1,114
Unsecured Borrowings, net
Preferred Stock
Common Stock
$1,308
$189
$100
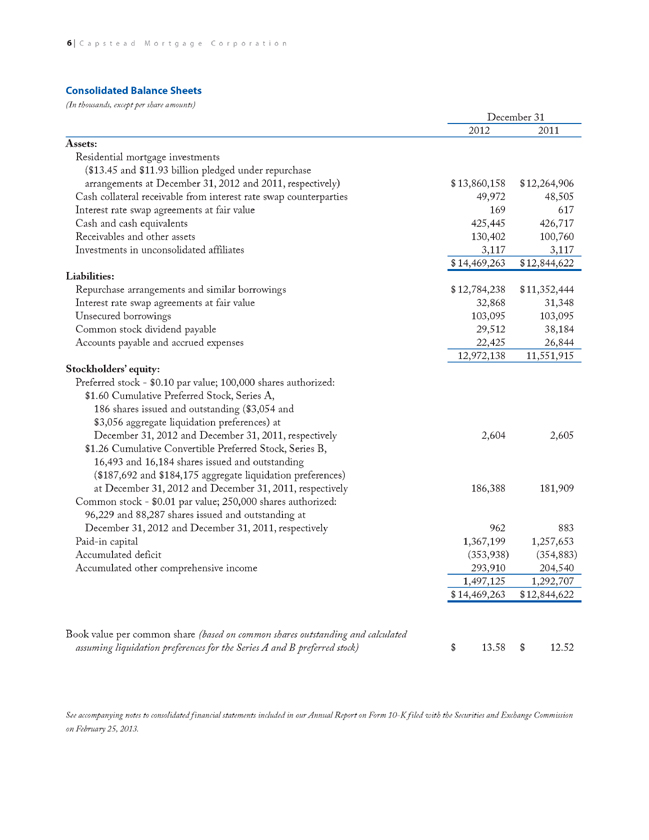
Consolidated Balance Sheets
(In thousands, except per share amounts)
December 31
2012 2011
Assets:
Residential mortgage investments
($13.45 and $11.93 billion pledged under repurchase
arrangements at December 31, 2012 and 2011, respectively) $ 13,860,158 $12,264,906
Cash collateral receivable from interest rate swap counterparties 49,972 48,505
Interest rate swap agreements at fair value 169 617
Cash and cash equivalents 425,445 426,717
Receivables and other assets 130,402 100,760
Investments in unconsolidated affiliates 3,117 3,117
$ 14,469,263 $12,844,622
Liabilities:
Repurchase arrangements and similar borrowings $ 12,784,238 $11,352,444
Interest rate swap agreements at fair value 32,868 31,348
Unsecured borrowings 103,095 103,095
Common stock dividend payable 29,512 38,184
Accounts payable and accrued expenses 22,425 26,844
12,972,138 11,551,915
Stockholders’ equity:
Preferred stock - $0.10 par value; 100,000 shares authorized:
$1.60 Cumulative Preferred Stock, Series A,
186 shares issued and outstanding ($3,054 and
$3,056 aggregate liquidation preferences) at
December 31, 2012 and December 31, 2011, respectively 2,604 2,605
$1.26 Cumulative Convertible Preferred Stock, Series B,
16,493 and 16,184 shares issued and outstanding
($187,692 and $184,175 aggregate liquidation preferences)
at December 31, 2012 and December 31, 2011, respectively 186,388 181,909
Common stock - $0.01 par value; 250,000 shares authorized:
96,229 and 88,287 shares issued and outstanding at
December 31, 2012 and December 31, 2011, respectively 962 883
Paid-in capital 1,367,199 1,257,653
Accumulated deficit (353,938) (354,883)
Accumulated other comprehensive income 293,910 204,540
1,497,125 1,292,707
$ 14,469,263 $12,844,622
Book value per common share (based on common shares outstanding and calculated
assuming liquidation preferences for the Series A and B preferred stock) $ 13.58 $ 12.52
See accompanying notes to consolidated financial statements included in our Annual Report on Form 10-K filed with the Securities and Exchange Commission
on February 25, 2013.
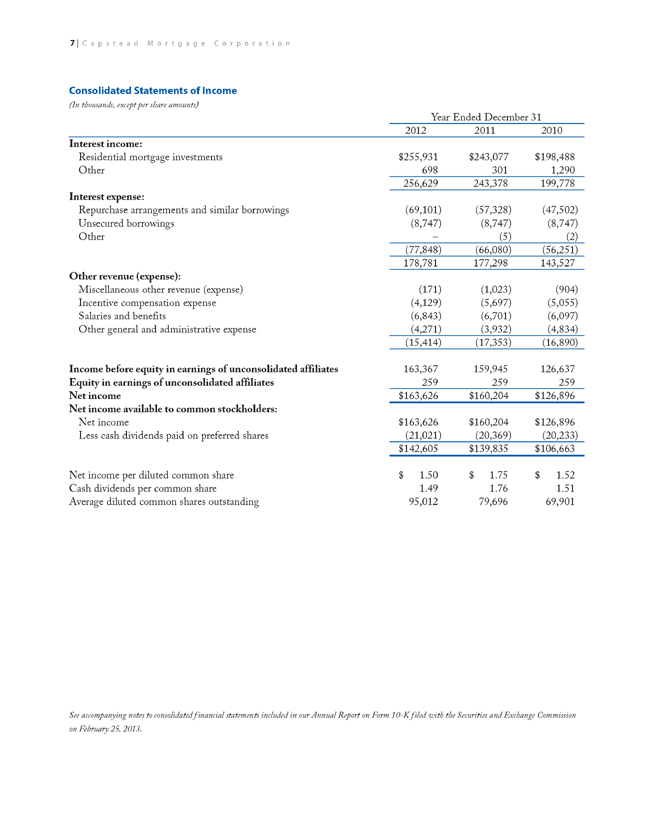
Consolidated Statements of Income
(In thousands, except per share amounts)
Year ended December 31
2012 2011 2010
Interest income:
Residential mortgage investments $255,931 $243,077 $198,488
Other 698 301 1,290
256,629 243,378 199,778
Interest expense:
Repurchase arrangements and similar borrowings (69,101) (57,328) (47,502)
Unsecured borrowings (8,747) (8,747) (8,747)
Other – (5) (2)
(77,848) (66,080) (56,251)
178,781 177,298 143,527
Other revenue (expense):
Miscellaneous other revenue (expense) (171) (1,023) (904)
Incentive compensation expense (4,129) (5,697) (5,055)
Salaries and benefits (6,843) (6,701) (6,097)
Other general and administrative expense (4,271) (3,932) (4,834)
(15,414) (17,353) (16,890)
Income before equity in earnings of unconsolidated affiliates 163,367 159,945 126,637
Equity in earnings of unconsolidated affiliates 259 259 259
Net income $163,626 $160,204 $126,896
Net income available to common stockholders:
Net income $163,626 $160,204 $126,896
Less cash dividends paid on preferred shares (21,021) (20,369) (20,233)
$142,605 $139,835 $106,663
Net income per diluted common share $ 1.50 $ 1.75 $ 1.52
Cash dividends per common share 1.49 1.76 1.51
Average diluted common shares outstanding 95,012 79,696 69,901
See accompanying notes to consolidated financial statements included in our Annual Report on Form 10-K filed with the Securities and Exchange Commission
on February 25, 2013.

8 | C a p s t e a d M o r t g a g e C o r p o r a t i o n
Directors
Jack Bernard
executive Director,
Renewable Funding, LLC
Jack Biegler
Private Investments
Chairman of the Board
Michelle P. Goolsby
Partner,Greenmont Capital Partners II
Andrew F. Jacobs
President and Chief executive Officer
Gary keiser
Private Investments
Paul M. Low
Private Investments
Chairman emeritus
Christopher W.Mahowald
Managing Partner,
RSF Partners
Michael G. O’Neil
Private Investments
Mark S.Whiting
Chief executive Officer,
Drawbridge Realty Trust, LLC
Officers
President and CEO
Andrew F. Jacobs
President and Chief executive Officer
Executive Vice Presidents
Phillip A. Reinsch
Chief Financial Officer and Secretary
Robert R. Spears, Jr.
Director of Residential Mortgage
Investments
Senior Vice Presidents
Michael W. Brown
Asset and Liability Management
and Treasurer
D. Christopher Sieber
Financial Accounting and Reporting
Vice Presidents
Diane F.Wilson
Financial Accounting and Reporting
Richard A.Wolf
Asset and Liability Management
Capstead’s management team, left to right:
Andrew F. Jacobs, Robert R. Spears, Jr.,Michael W. Brown and Phillip A. Reinsch
Transfer Agent and Registrar
Inquiries concerning dividend payments, lost certiNcates,
change of address and account information should be
directed to:
Wells Fargo Shareowner Services
Post Office Box 64854
St. Paul,Minnesota 55164-0854
(800) 468-9716
www.wellsfargo.com/shareownerservices
Preferred Share Conversions
Holders of the Series A and Series B preferred shares may
convert into common shares at any time.
Holders of the Series A and Series B preferred shares are
advised to carefully consider whether or not it is
economically advantageous to convert into common
shares, considering the conversion ratio as well as the
prevailing market prices and dividends of both the
common and preferred shares.
If conversion is requested after one or more preferred
record dates and on or before the record date for payment
of quarterly dividends on the common shares, the
preferred holder requesting conversion must return to us
all preferred share dividends declared and paid for the
corresponding quarter.
Available Information
We make available on our website at www.capstead.com,
free of charge, our annual report on Form 10-k, quarterly
reports on Form 10-Q, current reports on Form 8-k,
investor presentations, quarterly fact sheets, press releases,
charters for the committees of the board of directors,
our Board of Director’s Guidelines, Code of Business
Conduct and ethics, Financial Code of Professional
Conduct and other company information, including
amendments to such documents and waivers, if any, to
the codes. Such information is also furnished upon
written request to:
Capstead Mortgage Corporation
Attention: Stockholder Relations
8401 North Central expressway
Suite 800
Dallas,Texas 75225-4404
Annual Meeting
Our annual meeting of stockholders will be held at
9:00 a.m. Central Time onWednesday, April 24, 2013 at:
8401 North Central expressway
Suite 220
Dallas,Texas 75225-4404
Corporate Shareholder Information
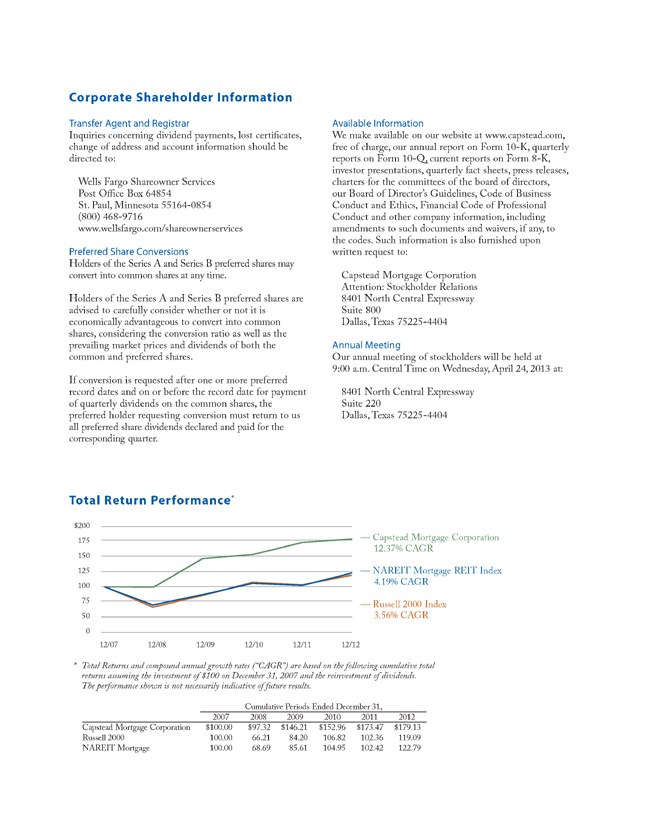
Total Return Performance*
Cumulative Periods ended December 31,
2007 2008 2009 2010 2011 2012
Capstead Mortgage Corporation $100.00 $97.32 $146.21 $152.96 $173.47 $179.13
Russell 2000 100.00 66.21 84.20 106.82 102.36 119.09
NAReIT Mortgage 100.00 68.69 85.61 104.95 102.42 122.79
$200
175
150
125
100
75
50
0
12/07 12/08 12/09 12/10 12/11 12/12
— Capstead Mortgage Corporation
12.37% CAGR
— NAReIT Mortgage ReIT Index
4.19% CAGR
— Russell 2000 Index
3.56% CAGR
* Total Returns and compound annual growth rates (“CAGR”) are based on the following cumulative total
returns assuming the investment of $100 on December 31, 2007 and the reinvestment of dividends.
The performance shown is not necessarily indicative of future results.
8401 North Central Expressway
Suite 800
Dallas, TX 75225-4404
(800) 358-2323
www.capstead.com
FORWARD-LOOkING STATeMeNTS
This document contains “forward-looking statements” within the meaning of the Private Securities Litigation Reform Act of 1995. Forward-looking
statements include, without limitation, any statement that may predict, forecast, indicate or imply future results, performance or achievements, and may
contain the words “believe,” “anticipate,” “expect,” “estimate,” “intend,” “will be,” “will likely continue,” “will likely result,” or words or phrases of similar
meaning. Forward-looking statements are based largely on the expectations of our management and are subject to a number of risks and uncertainties
including, but not limited to, the following:
changes in general economic conditions;
fluctuations in interest rates and levels of mortgage prepayments;
the effectiveness of risk management strategies;
the impact of differing levels of leverage employed;
liquidity of secondary markets and credit markets;
the availability of financing at reasonable levels and terms to support investing on a leveraged basis;
the availability of new investment capital;
the availability of suitable qualifying investments from both an investment return and regulatory perspective;
changes in legislation or regulation affecting exemptions for mortgage ReITs from regulation under the Investment Company Act of 1940;
changes in legislation or regulation affecting FannieMae, FreddieMac,GinnieMae and similar federal government agencies and related guarantees;
deterioration in credit quality and ratings of existing or future issuances of agency-guaranteed mortgage securities; and
increases in costs and other general competitive factors.
In addition to the above considerations, our actual results and liquidity are affected by other risks and uncertainties which could cause actual results to be
significantly different from those expressed or implied by any forward-looking statements included herein. It is not possible to identify all of the risks,
uncertainties and other factors that may affect future results. In light of these risks and uncertainties, the forward-looking events and circumstances
discussed herein may not occur and actual results could differ materially from those anticipated or implied in the forward-looking statements. Forwardlooking
statements speak only as of the date the statement is made and we undertake no obligation to update or revise any forward-looking statements,
whether as a result of new information, future events or otherwise. Accordingly, readers of this document are cautioned not to place undue reliance on any
forward-looking statements included herein.
CAP1AR2013