Attached files
| file | filename |
|---|---|
| EX-99.1 - EX-99.1 - AMAG PHARMACEUTICALS, INC. | a12-29683_4ex99d1.htm |
| 8-K - 8-K - AMAG PHARMACEUTICALS, INC. | a12-29683_48k.htm |
Exhibit 99.2
|
|
AMAG PHARMACEUTICALS 2012 Financial Results |
|
|
FORWARD LOOKING STATEMENTS 2 This presentation contains forward-looking statements within the meaning of the Private Securities Litigation Reform Act of 1995 and other federal securities laws. Any statements contained herein which do not describe historical facts, including but not limited to: (i) our statement that AMAG is well positioned for growth in 2013 and beyond; (ii) our plans to grow Feraheme revenues in 2013 and thereafter through a combination of volume and price growth; (iii) expectations regarding the status, expiry and extension of our Orange Book listed patents for Feraheme; (iv) the potential for approval and potential launch of the supplemental new drug application in the U.S. and the timing and potential regulatory submission in the EU for Feraheme/Rienso for the broad iron deficiency anemia indication; (v) statements regarding our plans to acquire and/or in-license additional commercial products or assets; (vi) statements regarding the potential size and expansion of the U.S. IV iron market opportunity; (vii) our expected financial results for 2013; (viii) our expected cash flows in 2013 and beyond; (ix) our plans to expand the reach of Feraheme to new indications and geographic territories; (x) statements regarding any potential milestone payments or royalties we may receive; (xi) statements regarding future annual sales for Feraheme/Rienso; (xii) our expected fourth quarter 2012 and full year 2012 financial results; (xiii) our expectation to increase our market share of the IV iron market in 2013; and (xiv) statements regarding our expectation to become the market leader in the current IV iron market, are forward-looking statements which involve risks and uncertainties that could cause actual results to differ materially from those discussed in such forward-looking statements. Such risks and uncertainties include: (1) uncertainties regarding our and Takeda's ability to successfully compete in the intravenous iron replacement market both in the US and outside the US, including the EU, (2) uncertainties regarding our ability to successfully and timely complete our clinical development programs and obtain regulatory approval for Feraheme/Rienso in the broader IDA indication both in the US and outside of the US, including the EU, (3) the possibility that significant safety or drug interaction problems could arise with respect to Feraheme/Rienso, (4) uncertainties regarding the manufacture of Feraheme/Rienso, (5) uncertainties relating to our patents and proprietary rights both in the US and outside the US, (6) the risk of an Abbreviated New Drug Application (ANDA) filing following the FDA’s recently published draft bioequivalence recommendation for ferumoxytol, and (7) other risks identified in our Securities and Exchange Commission (SEC) filings, including our Annual Report on Form 10-K for the year ended December 31, 2012 and subsequent filings with the SEC. We caution you not to place undue reliance on any forward-looking statements, which speak only as of the date they are made. We disclaim any obligation to publicly update or revise any such statements to reflect any change in expectations or in events, conditions or circumstances on which any such statements may be based, or that may affect the likelihood that actual results will differ from those set forth in the forward-looking statements |
|
|
AMAG: 2012 HIGHLIGHTS Continued growth of Feraheme U.S. CKD business Drove 17% Feraheme volume growth in the US compared to 2011 Exited year with 14% market share in grams Improved net revenue per gram for Feraheme Significant progress in Feraheme expansion efforts Completed phase III program for broad IDA indication; submitted sNDA Launched in Canada and Europe; triggered $33 million in milestones Stabilized organization and turned focus to execution and growth Ready to purchase/in-license additional comercial products Financial Streamlined cost structure with 32% reduction in operating expenses compared to 2011 Exceeded original guidance; delivered on updated financial guidance 3 |
|
|
FERAHEME US CKD BUSINESS |
|
|
2012 – STRONG GROWTH IN FERAHEME PROVIDER DEMAND 5 Source: IMS Health Data. 17% Grams 2012 Results 17% increase in Feraheme provider demand; 115 evolution index 4th Quarter Share 14% of non-dialysis IV iron market 26% of heme/onc segment 9% of hospital segment 37% of nephrology segment |
|
|
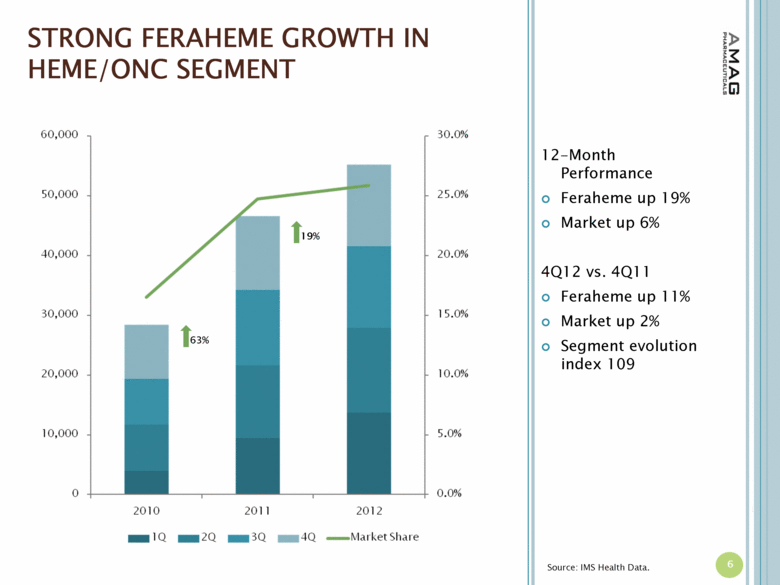
STRONG FERAHEME GROWTH IN HEME/ONC SEGMENT 6 Source: IMS Health Data. 63% 19% 12-Month Performance Feraheme up 19% Market up 6% 4Q12 vs. 4Q11 Feraheme up 11% Market up 2% Segment evolution index 109 |
|
|
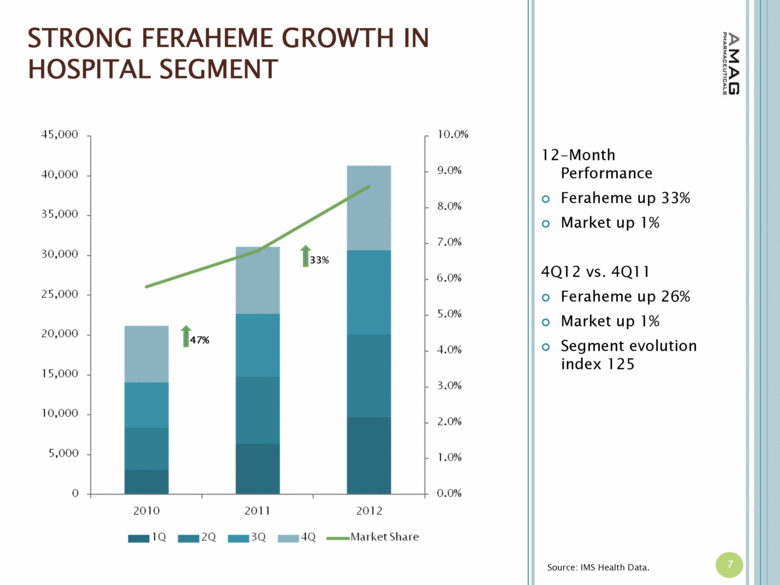
STRONG FERAHEME GROWTH IN HOSPITAL SEGMENT 7 Source: IMS Health Data. 47% 33% 12-Month Performance Feraheme up 33% Market up 1% 4Q12 vs. 4Q11 Feraheme up 26% Market up 1% Segment evolution index 125 |
|
|
FERAHEME PERFORMING WELL, WITH A BRIGHT FUTURE Continue to outpace market growth Gain access to untapped target heme/onc accounts Gain more hospital accounts Expand the IV iron market Present key data and medical meetings Continue to build awareness of Feraheme and of iron deficiency anemia 8 |
|
|
FINANCIAL OVERVIEW |
|
|
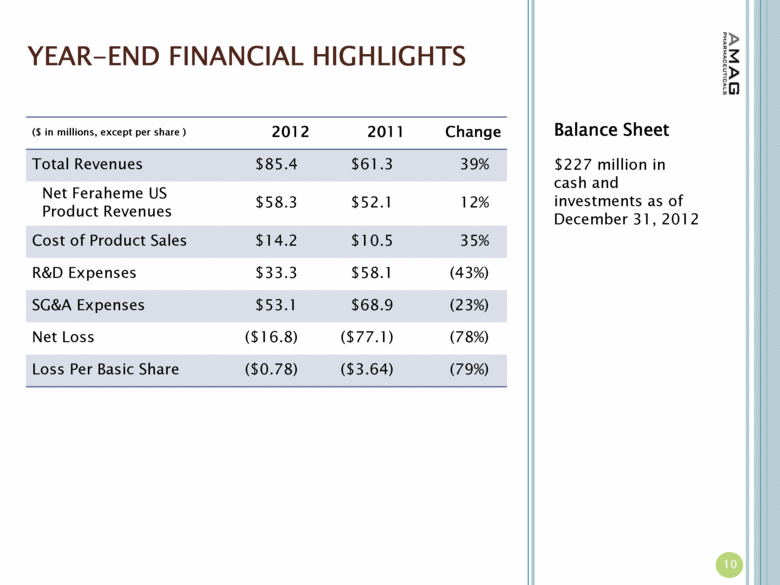
YEAR-END FINANCIAL HIGHLIGHTS Balance Sheet $227 million in cash and investments as of December 31, 2012 ($ in millions, except per share ) 2012 2011 Change Total Revenues $85.4 $61.3 39% Net Feraheme US Product Revenues $58.3 $52.1 12% Cost of Product Sales $14.2 $10.5 35% R&D Expenses $33.3 $58.1 (43%) SG&A Expenses $53.1 $68.9 (23%) Net Loss ($16.8) ($77.1) (78%) Loss Per Basic Share ($0.78) ($3.64) (79%) 10 |
|
|
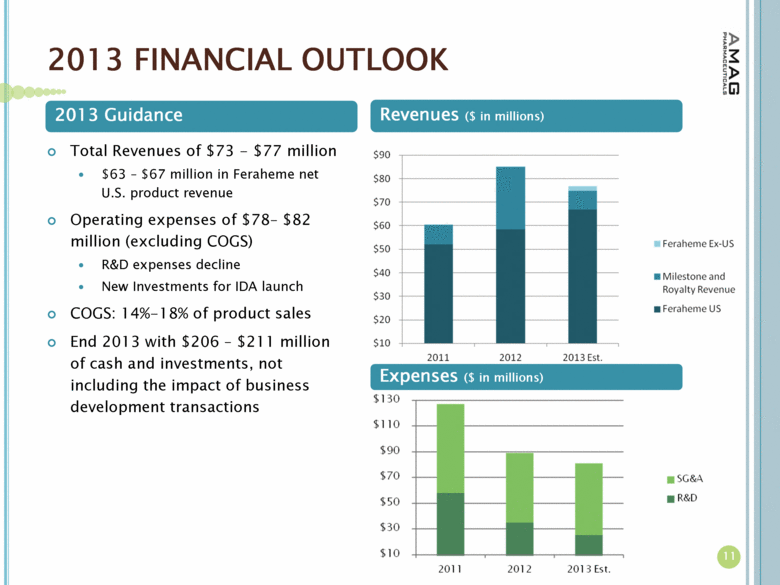
2013 FINANCIAL OUTLOOK 11 Expenses ($ in millions) Total Revenues of $73 - $77 million $63 – $67 million in Feraheme net U.S. product revenue Operating expenses of $78– $82 million (excluding COGS) R&D expenses decline New Investments for IDA launch COGS: 14%-18% of product sales End 2013 with $206 – $211 million of cash and investments, not including the impact of business development transactions 2013 Guidance Revenues ($ in millions) |
|
|
AMAG PHARMACEUTICALS Well positioned for growth in 2013 and beyond |

