Attached files
| file | filename |
|---|---|
| EX-31.2 - CERTIFICATION OF CFO PURSUANT TO EXCHANGE ACT RULE 13A-14(A) - PROOFPOINT INC | proofpoint-12312012xex3121.htm |
| EX-32.1 - CERTIFICATION OF CEO PURSUANT TO 18 U.S.C. SECTION 1350 - PROOFPOINT INC | proofpoint-12312012xex3211.htm |
| EX-31.1 - CERTIFICATION OF CEO PURSUANT TO EXCHANGE ACT RULE 13A-14(A) - PROOFPOINT INC | proofpoint-12312012xex3111.htm |
| EX-32.2 - CERTIFICATION OF CFO PURSUANT TO 18 U.S.C. SECTION 1350 - PROOFPOINT INC | proofpoint-12312012xex3221.htm |
UNITED STATES
SECURITIES AND EXCHANGE COMMISSION
Washington, D.C. 20549
__________________________________
FORM 10-K/A
(Amendment No. 1)
þ | ANNUAL REPORT PURSUANT TO SECTION 13 OR 15(d) OF THE SECURITIES EXCHANGE ACT OF 1934 | |
For the Fiscal Year Ended December 31, 2012
OR
o | TRANSITION REPORT PURSUANT TO SECTION 13 OR 15(d) OF THE SECURITIES EXCHANGE ACT OF 1934 | |
For the Transition Period from to
Commission File Number 001-35506
PROOFPOINT, INC.
(Exact name of Registrant as specified in its charter)
Delaware (State or other jurisdiction of incorporation or organization) | 51-0414846 (I.R.S. employer identification no.) | |
892 Ross Drive Sunnyvale, California (Address of principal executive offices) | 94089 (Zip Code) | |
(408) 517-4710
(Registrant’s telephone number, including area code)
__________________________________
Securities registered pursuant to Section 12(b) of the Act:
Title of Each Class | Name of each exchange on which registered | |
Common Stock , $0.0001 par value per share | NASDAQ Global Select Market | |
Securities registered pursuant to Section 12(g) of the Act:
None | ||
__________________________________
Indicate by check mark if the registrant is a well-known seasoned issuer, as defined in Rule 405 of the Securities Act. YES o NO þ
Indicate by check mark if the registrant is not required to file reports pursuant to Section 13 or Section 15(d) of the Act. YES o NO þ
Indicate by check mark whether the registrant (1) has filed all reports required to be filed by Section 13 or 15(d) of the Securities Exchange Act of 1934 during the preceding 12 months (or for such shorter period that the registrant was required to file such reports), and (2) has been subject to such filing requirements for the past 90 days. YES þ NO o
Indicate by check mark whether the registrant has submitted electronically and posted on its corporate Web site, if any, every Interactive Data File required to be submitted and posted pursuant to Rule 405 of Regulation S-T (§232.405 of this chapter) during the preceding 12 months (or for such shorter period that the registrant was required to submit and post such files). YES þ NO o
Indicate by check mark if disclosure of delinquent filers pursuant to Item 405 of Regulation S-K (§229.405 of this chapter) is not contained herein, and will not be contained, to the best of registrant’s knowledge, in definitive proxy or information statements incorporated by reference in Part III of this Form 10-K or any amendment to this Form 10-K. o
Indicate by check mark whether the registrant is a large accelerated filer, an accelerated filer, a non-accelerated filer, or a smaller reporting company. See the definitions of “large accelerated filer,” “accelerated filer” and “smaller reporting company” in Rule 12b-2 of the Exchange Act.
Large accelerated filer o | Accelerated filer o | Non-accelerated filer þ (Do not check if a smaller reporting company) | Smaller reporting company o | |||
Indicate by check mark whether the registrant is a shell company (as defined in Rule 12b-2 of the Exchange Act). YES ¨ NO þ
The aggregate market value of the voting and non-voting common equity held by non-affiliates of the registrant, based upon the closing price of a share of the registrant’s common stock on June 30, 2012 as reported by the NASDAQ Global Select Market on that date, was approximately $250,969,000. This calculation does not reflect a determination that certain persons are affiliates of the registrant for any other purpose.
The number of shares outstanding of the registrant’s common stock as of December 31, 2012 was 33,043,665 shares.
__________________________________
DOCUMENTS INCORPORATED BY REFERENCE
Portions of the registrant’s Proxy Statement for its 2013 Annual Meeting of Stockholders (the “Proxy Statement”), to be filed with the Securities and Exchange Commission, are incorporated by reference into Part III of this Annual Report on Form 10-K where indicated. The Proxy Statement will be filed with the Securities and Exchange Commission within 120 days of the registrant's fiscal year ended December 31, 2012.
EXPLANATORY NOTE
This Amendment No. 1 on Form 10-K/A (“Amendment No. 1”) amends the Annual Report on Form 10-K of Proofpoint, Inc. (the “Company”) for the year ended December 31, 2012, originally filed with the Securities Exchange Commission (the “SEC”) on March 8, 2013.
The Company is filing Amendment No. 1 to correct certain typographical errors in Exhibits 31.1, 31.2, 32.1 and 32.2. In the original filing there were typographical errors within Exhibits 31.1, 31.2 32.1 and 32.2, which indicated the Chief Executive Officer and Chief Financial Officer were certifying the Annual Report on Form 10-K with a signature date of March 8, 2012. The intent of Exhibits 31.1, 31.2, 32.1 and 32.2 were to certify the Annual Report on Form 10-K of the Company for the year ended December 31, 2012 with a signature date of March 8, 2013. The Company is also filing this Amendment No. 1 to correct Exhibit No. 10.09 in the original filing to incorporate by reference the Offer Letter to David Knight rather than the Offer Letter to Tom Cooper, and to correct a typographical error on the cover page to the original filing to refer to its 2013 Annual Meeting of the Stockholders rather than its 2012 Meeting of the Stockholders. As such, the Company is filing this Amendment No. 1 solely to correct the signature date in the above mentioned Exhibits, Exhibit No. 10.09 and the typographical error on the cover page referred to above.
Except as described above, no other changes are being made to the Annual Report on Form 10-K. This Amendment No. 1 does not reflect events occurring after the filing of our Annual Report on Form 10-K or modify or update the disclosure contained in the Annual Report on Form 10-K in any way other than as discussed above.
PROOFPOINT, INC.
FORM 10-K
For the Fiscal Year Ended December 31, 2012
TABLE OF CONTENTS
Page | ||
PART I. | ||
Item 1. | Business | |
Item 1A. | Risk Factors | |
Item 1B. | Unresolved Staff Comments | |
Item 2. | Properties | |
Item 3. | Legal Proceedings | |
Item 4. | Mine Safety Disclosures | |
PART II. | ||
Item 5. | Market for Registrant’s Common Equity, Related Stockholder Matters and Issuer Purchases of Equity Securities | |
Item 6. | Selected Financial Data | |
Item 7. | Management’s Discussion and Analysis of Financial Condition and Results of Operations | |
Item 7A. | Quantitative and Qualitative Disclosures About Market Risk | |
Item 8. | Financial Statements and Supplementary Data | |
Item 9. | Changes in and Disagreements with Accountants on Accounting and Financial Disclosure | |
Item 9A. | Controls and Procedures | |
Item 9B. | Other Information | |
PART III. | ||
Item 10. | Directors, Executive Officers and Corporate Governance | |
Item 11. | Executive Compensation | |
Item 12. | Security Ownership of Certain Beneficial Owners and Management and Related Stockholder Matters | |
Item 13. | Certain Relationships and Related Transactions, and Director Independence | |
Item 14. | Principal Accountant Fees and Services | |
PART IV. | ||
Item 15. | Exhibits and Financial Statement Schedules | |
Index to Consolidated Financial Statements | ||
Signatures | ||
1
CAUTIONARY STATEMENT REGARDING FORWARD-LOOKING STATEMENTS
This Annual Report on Form 10-K contains forward-looking statements within the meaning of the Private Securities Litigation Reform Act of 1995. All statements contained in this Annual Report on Form 10-K other than statements of historical fact, including statements regarding our future results of operations and financial position, our business strategy and plans, and our objectives for future operations, are forward-looking statements. The words "believe," "may," "will," "estimate," "continue," "anticipate," "intend," "expect," and similar expressions are intended to identify forward-looking statements. We have based these forward-looking statements largely on our current expectations and projections about future events and trends that we believe may affect our financial condition, results of operations, business strategy, short-term and long-term business operations and objectives, and financial needs. These forward-looking statements are subject to a number of risks, uncertainties and assumptions, including those described in Part I, Item 1A, "Risk Factors" in this Annual Report on Form 10-K. Moreover, we operate in a very competitive and rapidly changing environment. New risks emerge from time to time. It is not possible for our management to predict all risks, nor can we assess the impact of all factors on our business or the extent to which any factor, or combination of factors, may cause actual results to differ materially from those contained in any forward-looking statements we may make. In light of these risks, uncertainties and assumptions, the future events and trends discussed in this Annual Report on Form 10-K may not occur and actual results could differ materially and adversely from those anticipated or implied in the forward-looking statements. We undertake no obligation to revise or publicly release the results of any revision to these forward-looking statements, except as required by law. Given these risks and uncertainties, readers are cautioned not to place undue reliance on such forward-looking statements.
Unless expressly indicated or the context requires otherwise, the terms “Proofpoint,” “Company,” “Registrant,” “we,” “us,” and “our” mean Proofpoint, Inc. and its subsidiaries unless the context indicates otherwise.
2
PART I
ITEM 1. BUSINESS
Overview
Proofpoint is a pioneering security-as-a-service vendor that enables large and mid-sized organizations worldwide to defend, protect, archive and govern their most sensitive data. Our security-as-a-service platform is comprised of an integrated suite of on-demand data protection solutions, including threat protection, regulatory compliance, archiving and governance, and secure communication. Our solutions are built on a flexible, cloud-based platform and leverage a number of proprietary technologies, including big data analytics, machine learning, deep content inspection, secure storage and advanced encryption, to address today's rapidly changing threat landscape.
A fundamental shift in the sources of cyber crime, from hackers to organized crime and governments, combined with the emergence of international data trafficking, are driving an unprecedented wave of targeted, malicious attacks designed to steal valuable information. At the same time, the growth of business-to-business collaboration, as well as the consumerization of IT and the associated adoption of mobile devices and unmanaged Internet-based applications, have proliferated sensitive data and reduced the effectiveness of many existing security products. These factors have contributed to an increasing number of severe data breaches and expanding regulatory mandates, all of which have accelerated demand for effective data protection and governance solutions.
Our platform addresses this growing challenge by not only protecting data as it flows into and out of the enterprise via on-premise and cloud-based email, instant messaging, social media and other web-based applications, but also securely archiving these communications for compliance and discovery. We address four important problems for the enterprise:
• | Keeping malicious content out; |
• | Preventing the theft or inadvertent loss of sensitive information and, in turn, ensuring compliance with regulatory data protection mandates; |
• | Collecting, retaining, governing and discovering sensitive data for compliance and litigation support; and |
• | Securely sharing sensitive data with customers, partners and suppliers. |
Our platform and its associated solutions are sold to customers on a subscription basis and can be deployed through our unique cloud-based architecture that leverages both our global data centers as well as optional points-of-presence behind our customers' firewalls. Our flexible deployment model enables us to deliver superior security and compliance while maintaining the favorable economics afforded by cloud computing, creating a competitive advantage for us over legacy on-premise and cloud-only offerings.
We were founded in 2002 to provide a unified solution to help enterprises address their growing data security requirements. Our first solution was commercially released in 2003 to combat the burgeoning problem of spam and viruses and their impact on corporate email systems. To address the evolving threat landscape and the adoption of communication and collaboration systems beyond corporate email and networks, we have broadened our solutions to defend against a wide range of threats, protect against outbound security risks, and archive and govern corporate information. Today, our solutions are used by approximately 2,700 customers worldwide, including 27 of the Fortune 100, protecting tens of millions of end-users. We market and sell our solutions worldwide both directly through our sales teams and indirectly through a hybrid model where our sales organization actively assists our network of distributors and resellers. We also distribute our solutions through strategic partners including IBM, Microsoft and VMware.
The Proofpoint Solution
Our integrated suite of on-demand security-as-a-service solutions enables large and mid-sized organizations to defend, protect, archive and govern their sensitive data. Our comprehensive platform provides threat protection, regulatory compliance, archiving and governance, and secure communication. These solutions are built on a cloud-based architecture, protecting data not only as it flows into and out of the enterprise via on-premise and cloud-based email, instant messaging, social media and other web-based applications, but also securely archiving these communications for compliance and discovery. We have pioneered the use of innovative technologies to deliver better ease-of-use, greater protection against the latest advanced threats, and lower total cost of ownership than traditional alternatives. The key elements of our solution include:
3
• | Superior protection against advanced, targeted threats. We use a combination of proprietary technologies for big data analytics, machine learning and deep content inspection to detect and stop targeted "spear phishing" and other sophisticated attacks. By processing and modeling billions of requests per day, we can recognize anomalies in traffic flow to detect targeted attacks. Our deep content inspection technology enables us to identify malicious message attachments and distinguish between valid messages and "phishing" messages designed to look authentic and trick the end-user into divulging sensitive data or clicking on a malicious web link. Our machine learning technology enables us to detect targeted "zero-hour" attacks in real time, even if they have not been seen previously at other locations, and quarantine them appropriately. |
• | Comprehensive, integrated data protection suite. We offer a comprehensive solution for data protection and governance through an integrated, security-as-a-service platform that is comprised of four main suites: Proofpoint Enterprise Protection, Proofpoint Enterprise Privacy, Proofpoint Enterprise Archive and Proofpoint Enterprise Governance. Together, these solutions can improve an organization's ability to detect and mitigate inbound and outbound threats and securely archive and discover communication across all major communication channels including on-premise and cloud-based email, instant messaging, social media and other web-based applications. In addition, our common policy framework and reporting systems enable organizations to comply with complex regulatory mandates, implement consistent data governance policies and ensure end-to-end incident response across the enterprise. |
• | Designed to empower end-users. Unlike legacy offerings that simply block communication or report audit violations, our solutions actively enable secure business-to-business and business-to-consumer communications. Our easy-to-use policy-based email encryption service automatically encrypts sensitive emails and delivers them to any PC or mobile device. In addition, our secure file-transfer solution makes it easy for end-users to securely share various forms of documents and other content that are typically too large to send through traditional e-mail systems. All of our solutions provide mobile-optimized capabilities to empower the growing number of people who use mobile devices as their primary computing platform. |
• | Security optimized cloud architecture. Our multi-tenant security-as-a-service solution leverages a distributed, scalable architecture deployed in our global data centers for deep content inspection, global threat correlation and analytics, high-speed search, secure storage, encryption key management, software updates and other core functions. Customers can choose to deploy optional physical or virtual points-of-presence behind their firewalls for those who prefer to deploy certain functionality inside their security perimeter. This architecture enables us to leverage the benefits of the cloud to cost-effectively deliver superior security and compliance, while optimizing each deployment for the customer's unique threat environment. |
• | Extensible security-as-a-service platform. The key components of our security-as-a-service platform, including services for secure storage, content inspection, reputation, big data analytics, encryption, key management, and identity and policy, can be exposed through application programming interfaces, or APIs, to integrate with internally developed applications as well as with those developed by third-parties. In addition, these APIs provide a means to integrate with the other security and compliance components deployed in our customers' infrastructures. |
Our Security-as-a-Service Platform
We provide a multi-tiered security-as-a-service platform consisting of solutions, platform technologies and infrastructure. Our platform currently includes four solutions bundled for the convenience of our customers, distributors and resellers: Proofpoint Enterprise Protection, Proofpoint Enterprise Privacy, Proofpoint Enterprise Archive and Proofpoint Enterprise Governance. Each of these solutions is built on our security-as-a-service platform, which includes both platform services and enabling technologies. Our platform services provide the key functionality to enable our various solutions while our enabling technologies work in conjunction with our platform services to enable the efficient construction, scaling and maintenance of our customer-facing solutions.
Our suite is delivered by a cloud infrastructure and can be deployed as a secure cloud-only solution, or as a hybrid solution with optional physical or virtual points-of-presence behind our customers' firewalls for those who prefer to deploy certain functionality inside their security perimeter. In all deployment scenarios, our cloud-based architecture enables us to leverage the benefits of the cloud to cost-effectively deliver superior security and compliance while maintaining the flexibility to optimize deployments for customers' unique environments. The modularity of our solutions enables our existing customers to implement additional modules in a simple and efficient manner.
4

Solutions
Our security-as-a-service platform includes four solutions bundled for the convenience of our customers: Proofpoint Enterprise Protection, Proofpoint Enterprise Privacy, Proofpoint Enterprise Archive and Proofpoint Enterprise Governance.
Proofpoint Enterprise Protection
Proofpoint Enterprise Protection is our communications and collaboration security suite designed to protect customers' mission-critical messaging infrastructure from outside threats including spam, phishing, unpredictable email volumes, malware and other forms of objectionable or dangerous content before they reach the enterprise. Key capabilities within Proofpoint Enterprise Protection include:
• | Threat detection. Uses our Proofpoint MLX machine learning technology and reputation data to examine millions of possible attributes in every message, including envelope headers and structure, embedded web links, images, attachments and sender reputation, as well as unstructured content in the message body, to block phishing and spear phishing attacks, spam and other forms of malicious or objectionable content. This solution also includes sophisticated policy and routing controls designed to ensure security and the effective handling of all classifications of content. |
• | Virus protection. Combats email-borne viruses, worms and trojans with a solution that combines efficient message handling, comprehensive reporting, and robust policy management with leading third-party anti-virus scanning engines. |
• | Zero-hour threat detection. Protects enterprises against new phishing attacks, viruses and other forms of malicious code during the critical period after new attacks are released and before full information is available to characterize the threat. |
5
• | Smart search. Offers an easy-to-use interface that provides real-time visibility into message flows across an organization's messaging infrastructure, using built-in logging and reporting capabilities with advanced message tracing, forensics and log analysis capabilities. |
• | Targeted Attack Protection. Protects enterprises against advanced persistent threats such as phishing and other targeted email attacks using big data analysis techniques to identify and apply additional security controls against suspicious messages and any associated links to the web. |
Key benefits of Proofpoint Enterprise Protection include:
• | Superior protection from advanced threats, spam and viruses. Protects against advanced threats, spam and other malicious code such as viruses, worms and spyware. |
• | Comprehensive outbound threat protection. Analyzes all outbound email traffic to block spam, viruses and other malicious content from leaving the corporate network, and pinpoint the responsible compromised systems. |
• | Effective, flexible policy management and administration. Provides a user-friendly, web-based administration interface and robust reporting capabilities that make it easy to define, enforce and manage an enterprise's messaging policies. |
• | Easy-to-use end-user controls. Gives email users easy, self-service control over their individual email preferences within the parameters of corporate-defined messaging policies. |
Proofpoint Enterprise Privacy
Our data loss prevention, encryption and compliance solution defends against leaks of confidential information, and helps ensure compliance with common U.S., international and industry-specific data protection regulations - including the Health Care Insurance Portability and Accountability Act of 1996 (HIPAA), the Gramm-Leach-Bliley Act (GLBA), Canada's Personal Information Protection and Electronic Documents Act (PIPEDA) and the Payment Card Industry Security Standard Council's Data Security Standards (PCI-DSS). Key capabilities within Proofpoint Enterprise Privacy include:
• | Advanced data loss prevention. Our advanced data loss prevention solution identifies regulated private content, valuable corporate assets and confidential information before it leaves the organization via email, web-based applications, or our Secure Share solution. Pre-packaged smart identifiers and dictionaries automatically and accurately detect a wide range of regulated content such as social security numbers, health records, credit card numbers, and driver's license numbers. In addition to regulated content, our machine learning technology can identify confidential, organization-specific content and assets. Once identified and classified, sensitive data can be blocked, encrypted and transmitted or re-routed internally based on content and identity-aware policies. |
• | Flexible remediation and supervision. Content, identity and destination-aware policies enable effective remediation of potential data breaches or regulatory violations. Remediation options include stopping the transfer completely, automatically forcing data-encryption, or routing to a compliance supervisor or the end-user for disposition. Proofpoint Enterprise Privacy provides comprehensive reporting on potential violations and remediation using our analytics capabilities. |
• | Policy-based encryption. Automatically encrypts regulated and other sensitive data before it leaves an organization's security perimeter without requiring cumbersome end-user key management. This enables authorized users, whether or not they are our customers, to quickly and easily decrypt and view content from most devices. |
• | Secure file transfer. Provides secure, large file transfer capabilities that allow end-users to send large files quickly, easily, and securely while eliminating the impact of large attachments on an email infrastructure. |
• | Secure share. Cloud-based security-focused solution designed to enable enterprise users to securely exchange large files with ease while staying compliant with enterprise data policies. |
6
Key benefits of Proofpoint Enterprise Privacy include:
• | Regulatory compliance. Allows outbound messages to comply with national and state government and industry-specific privacy regulations. |
• | Superior malicious and accidental data loss protection. Protects against the loss of sensitive data, whether from a cybercriminal attempting to exfiltrate valuable data from a compromised system, or from an employee accidently distributing a file to the wrong party through email, webmail, social media, file sharing, or other Internet-based mechanisms for publishing content. |
• | Easy-to-use secure communication. Allows corporate end-users to easily share sensitive data without compromising security and privacy, and enables authorized external recipients to transparently decrypt and read the communications from any device. Our mobile-optimized interfaces provide an easy experience for the rapidly growing number of recipients on smartphones and tablets. |
Proofpoint Enterprise Archive
Proofpoint Enterprise Archive is designed to ensure: accurate enforcement of data governance, data retention and supervision policies and mandates; cost effective litigation support through efficient discovery; and active legal hold management. Proofpoint Enterprise Archive can store, govern and discover a wide range of data including email, instant message conversations, social media interactions, and other files throughout the enterprise. The key capabilities within Proofpoint Enterprise Archive include:
• | Secure cloud storage. With our proprietary double blind encryption technology and the associated data storage architecture, all email messages, files and other content are encrypted with keys controlled by the customer before the data enters the Proofpoint Enterprise Archive. This ensures that even our employees and law-enforcement agencies cannot access a readable form of the customer data without authorized access by the customer to the encryption keys stored behind the customer's firewall. |
• | Search performance. By employing parallel, big data search techniques, we are able to deliver search performance measured in seconds, even when searching hundreds of terabytes of archived data. Traditional on-premise solutions can take hours or even days to return search results to a complex query. |
• | Flexible policy enforcement. Enables organizations to easily define and automatically enforce data retention and destruction policies necessary to comply with regulatory mandates or internal policies that can vary by user, group, geography or domain. |
• | Active legal-hold management. Enables administrators or legal professionals to easily designate specific individuals or content as subject to legal hold. Proofpoint Enterprise Archive then provides active management of these holds by suspending normal deletion policies and automatically archiving subsequent messages and files related to the designated matter. |
• | End-user supervision. Leveraging our flexible workflow capabilities, Proofpoint Enterprise Archive analyzes all electronic communications, including email and communications from leading instant messaging and social networking sites, for potential violations of regulations, such as those imposed by Financial Industry Regulatory Authority (FINRA) and the SEC in the financial services industry. |
Key benefits of Proofpoint Enterprise Archive include:
• | Regulatory compliance. Helps organizations meet regulatory requirements by archiving all messages and content according to compliance retention policies and enabling staff to systematically review messages for compliance supervision. |
• | Proactive data governance. Allows organizations to create, maintain and consistently enforce a clear corporate data retention policy, reducing the risk of data loss and the cost of eDiscovery. |
• | Efficient litigation support. Provides advanced search features that reduce the cost of eDiscovery and allow organizations to more effectively manage the litigation hold process. |
7
• | Reduced storage and management costs. Helps to simplify mailbox and file system management by automatically moving storage-intensive attachments and files into cost-effective cloud storage. |
Proofpoint Enterprise Governance
Proofpoint Enterprise Governance provides organizations the ability to track, classify, monitor, and apply governance policies to unstructured information across the enterprise. By proactively governing unstructured information "in-place," organizations can effectively manage regulatory compliance, increase control over information and mitigate legal and financial risks. The key capabilities within Proofpoint Enterprise Governance include:
• | Document Tracking—Digital Thread. Proofpoint Enterprise Governance creates a unique "digital fingerprint" for every document and version. Our solution can monitor most major document stores including share-drives, Microsoft Sharepoint, Microsoft Exchange, Lotus Domino, EMC Documentum and desktops, and track every document, version and location. This enables organizations to track and govern their sensitive documents wherever they travel inside or outside the enterprise. |
• | Cloud-based Search and Analytics. By employing advanced search techniques, we are able to deliver detailed reporting on all monitored documents and locations. Administrators can quickly locate all copies and versions of a given document or run summary reports detailing types and locations of stored documents throughout the enterprise. |
• | Flexible policy enforcement. Enables organizations to easily define and automatically enforce data retention and destruction policies necessary to comply with regulatory mandates or internal policies that can vary by user, group, project or geography. |
Key benefits of Proofpoint Enterprise Governance include:
• | Regulatory compliance. Helps organizations meet regulatory requirements by systematically retaining required documents and unstructured content according to compliance retention policies and enabling staff to efficiently review and enforce these policies. |
• | Proactive data governance. Allows organizations to create, maintain and consistently enforce a clearcorporate data retention and destruction policy around documents and other unstructured content, reducing the risk of data loss and the cost of eDiscovery. |
• | Efficient litigation support. Provides advanced search features that locate all copies of documents wherever they live reducing the cost of eDiscovery and allowing organizations to effectively manage the litigation process. |
• | Reduced storage and management costs. Reduces document management and storage costs by automating the reporting and clean-up of unnecessary documents including duplicates, intermediate versions and non-business records. |
Platform Services
Our platform services provide the key functionality to enable our various solutions, using our enabling technologies. Our platform services consist of:
• | Content inspection. Applies our Proofpoint MLX machine learning techniques to understand the meaning of email, documents and social networking communications and to identify and classify content as malicious, sensitive or relevant to a litigation matter for threat protection, data loss prevention and discovery. |
• | Reputation. Leverages machine learning and big data analytics to analyze and correlate billions of requests per day to create a dynamic reputation profile of hundreds of millions of IP addresses, domains, web links and other Internet content. This database of reputation profiles is used to help identify and block malicious attacks. |
8
• | Encryption and key management. Securely encrypts data and stores and indexes hundreds of thousands of individual encryption keys without requiring cumbersome key-exchange or other end-user set-up. Enables authorized users to quickly and easily decrypt and view content from a wide variety of devices. |
• | Notification and workflow. Creates notifications and an enabling workflow to alert administrators and compliance officers of an incident and enable subsequent review, commentary, tracking, escalation and remediation of each event. |
• | Analytics and search. Provides an easy-to-use, web-based interface for searching and analyzing information to enable enterprises to rapidly trace inbound and outbound messages, analyze how messages were processed by a Proofpoint Enterprise deployment, report on the disposition and status of any email message, and retrieve in real time archived communications for litigation support and eDiscovery. |
Enabling Technologies
Our enabling technologies are a proprietary set of building blocks that work in conjunction with our application services to enable the efficient construction, scaling and maintenance of our customer-facing solutions. These technologies consist of:
• | Big data analytics. Indexes and analyzes petabytes of information in real time to discover threats, detect data leaks and enable end-users to quickly and efficiently access information distributed across their organizations. |
• | Machine learning. Builds predictive data models using our proprietary Proofpoint MLX machine learning techniques to rapidly identify and classify threats and sensitive content in real time. |
• | Identity and policy. Enables the definition and enforcement of sophisticated data protection policies based on a wide set of variables, including type of content, sender, recipient, pending legal matters, time and date, regulatory status and more. |
• | Secure storage. Stores petabytes of data in the cloud cost-effectively using proprietary encryption methods, keeping sensitive data tamper-proof and private, yet fully searchable in real time. |
Infrastructure
We deliver our security-as-a-service solutions through our cloud architecture and international data center infrastructure. We operate thousands of physical and virtual servers across nine data centers located in the United States, Canada, the Netherlands, Germany and Australia.
Our cloud architecture is optimized to meet the unique demands of delivering real-time security-as-a-service to global enterprises. Key design elements include:
•Security. Security is central to our cloud architecture and is designed into all levels of the system, including physical security, network security, application security, and security at our third-party data centers. Our security measures have met the rigorous standards of SSAE 16 certification. In addition to this commercial certification program, we have also successfully completed the FISMA certification for our cloud-based archiving and governance solution, enabling us to serve the rigorous security requirements of U.S. federal agencies.
•Scalability and performance. By leveraging a distributed, scalable architecture we process billions of requests against our reputation systems and hundreds of millions of messages per day, all in near real time. Massively-parallel query processing technology is designed to ensure rapid search results over this vast data volume. In addition to this aggregate scalability across all customers, our architecture also scales to effectively meet the needs of several of our largest individual customers, each of which has millions of users and processes tens of millions of messages per day.
• | Flexibility. Our cloud architecture enables individual customers to deploy entirely in Proofpoint's global data centers or in hybrid configurations with optional points of presence located behind the customer's firewall. This deployment flexibility enables us to deliver security, compliance and performance tailored to the unique threat profile and operating environment of each customer. |
9
• | High availability. Our services employ a wide range of technologies including redundancy, geographic distribution, real-time data replication and end-to-end service monitoring to provide 24x7 system availability. |
• | Network operations control. We employ a team of skilled professionals who monitor, manage and maintain our global data center infrastructure and its interoperability with the distributed points of presence located behind our customers' firewalls to ensure 24x7 operations. |
• | Low cost. We deploy our services on shared, low-cost, commodity computing and storage infrastructure. In addition, we utilize multi-tenancy and hardware virtualization to further reduce hardware and management costs. Because we primarily rely on internally developed and open source technology instead of commercially licensed technology, we are able to offer a cost-effective solution to our customers. |
During 2012, we had $5.9 million in capital spending in part to support infrastructure expansion. These expenditures are primarily in connection with the replacement and upgrade of equipment to lower the cost of deployment as well as to improve the efficiency for our cloud-based architecture.
Customers
As of December 31, 2012 we had approximately 2,700 customers of all sizes across a wide variety of industries, including 27 of the Fortune 100. Several of our largest customers use our platform to protect millions of users and handle tens of millions of messages per day. We have a highly diversified customer base, with no single partner or customer accounting for more than 10% of total revenue in 2010 or 2011 and one customer, a strategic partner serving a number of end customers with our platform, who accounted for 14% of total revenue in 2012. In each year since the launch of our first solution in 2003, we have retained over 90% of our customers.
We target large and mid-sized organizations across all major verticals including financial services, retail, manufacturing, aerospace and defense, healthcare, education and government. We have been particularly successful selling to the largest enterprises; 19 of the 50 largest companies in the United States as ranked by Fortune Magazine are our customers. We have also had success penetrating the market leaders in a number of significant verticals including:
• | 4 of the 5 largest U.S. retailers |
• | 4 of the 5 largest U.S. aerospace and defense contractors |
• | 3 of the 5 largest U.S. banks |
• | 3 of the 5 largest global pharmaceutical companies |
Among our customers are: Alticor Inc., AON Corporation, Bank of America Corporation, Bank of China Limited, Burlington Coat Factory Warehouse Corporation, Citicorp North America, Inc., First Data Corporation, Grant Thornton LLP, Hospital Corporation of America, Hitachi Data Systems Corporation, Huntsman Corporation, Kaiser Permanente, Mary Kay, Inc., Petco Animal Supplies, Inc., Pitney Bowes Inc., The Radio France Group, Raymond James Financial, Inc., Royal Mail Group Ltd., Scottsdale Healthcare Corporation, the State of California, Sub-Zero, Inc., T-Mobile Wireless USA, Inc., Tyson Foods, Inc., UCLA Health System, University of North Carolina at Charlotte, United States Department of Agriculture, VF Corporation, VMware, Inc., Washington State University, Weatherford International Ltd., and Zions Bancorporation.
Sales and Marketing
Sales
We primarily target large and mid-sized organizations across all industries. Our sales and marketing programs are organized by geographic regions, including Asia-Pacific, EMEA, Japan, North America, and South America, and we further segment and organize our sales force into teams that focus on large enterprises (2,500 employees and above), mid-sized organizations (500 - 2,500 employees) and existing customers. In addition, we create integrated sales and marketing programs targeting specific vertical-markets. This vertical-market approach enables us to provide a higher level of service and understanding of our customers' unique needs, including the industry-specific business and regulatory requirements in industries such as healthcare, financial services, retail and education.
We sell through both direct and indirect channels, including technology and channel partners:
10
• | Direct sales and reseller channel. We market and sell our solutions to large and mid-sized customers directly through our field and inside sales teams as well as indirectly through a hybrid model, where our sales organization actively assists our network of distributors and resellers. Our sales personnel are primarily located in North America, with additional personnel located in Asia-Pacific, EMEA, Japan and South America. Our reseller partners maintain relationships with their customers throughout the territories in which they operate, providing them with services and third party solutions to help meet their evolving security requirements. As such, these partners act as a direct conduit through which we can connect with these prospective customers to offer our solutions. Our reseller channel includes top security organizations including Accuvant, Adaptive Solutions, Inc., CGI Information Systems and Management Consultants Inc., Computer Sciences Corporation, FishNet Security, Integralis, NEC Corporation, Nissho Electronics Corporation, and Verizon Business Services. |
• | Strategic relationships. We also sell our solutions indirectly through key technology companies such as IBM, Microsoft and VMware that offer our solutions in conjunction with one or more of their own products or services. These companies each have a large, established customer base built around a broad platform of products and solutions sold under their own brand, and they promote our products to augment their own branded solutions. |
For sales involving a partner such as a distributor, reseller or strategic partner, the partner engages with the prospective customer directly and involves our sales team as needed to assist in developing and closing an order. At the conclusion of a successful sales cycle, we sell the associated subscription, hardware and services to the partner who in turn resells these items to the customer, with the partner earning a fee based on the total value of the order. With the order completed, we provide these customers with direct access to our security-as-a-service platform and other associated services, enabling us to establish a direct relationship and provide them with support as part of ensuring that the customer has a good experience with our platform. At the end of the contract term, the partner engages with the customer to execute a renewal order, with our team providing assistance as required. For 2012, over half of our billings were sold through one of these partners.
Marketing
Our marketing programs include a variety of online marketing, advertising, conferences, events, white-papers, public relations activities and web-based seminar campaigns targeted at key decision makers within our prospective customers.
We have a number of marketing initiatives to build awareness about our solutions and encourage customer adoption of our solutions. We offer free trials, competitive evaluations and free compliance risk audits to allow prospective customers to experience the quality of our solutions, to learn in detail about the features and functionality of our suite, and to quantify the potential benefits of our solutions.
Customer Service and Support
We believe that our customer service and support provide a competitive advantage and are critical to retaining and expanding our customer base. We conduct regular third-party surveys to measure customer loyalty and satisfaction with our solutions.
Proofpoint Support Services
We deliver 24x7x365 customer support from support centers located in New York, California, Japan, Malaysia, Singapore, Canada and the United Kingdom. We offer a wide range of support offerings with varying levels of access to our support resources.
Proofpoint Professional Services and Training
With our security-as-a-service model, our solutions are designed to be implemented, configured, and operated without the need for any training or professional services. For those customers that would like to develop deeper expertise in the use of our solutions or would like some assistance with complex configurations or the importing of data, we offer various training and professional services. Many implementation services can be completed in one day and are primarily provided remotely using web-based conferencing tools. If requested, our professional services organization also provides additional assistance with data importing, design, implementation, customization, or advanced reporting. We also offer a learning center for both in-person and online training and certification.
11
Research and Development
We devote significant resources to improve and enhance our existing security solutions and maintain the effectiveness of our platform. We also work closely with our customers to gain valuable insights into their threat environments and security management practices to assist us in designing new solutions and features that extend the data protection, archiving and governance capabilities of our platform. Our technical staff monitors and tests our software on a regular basis, and we maintain a regular release process to update and enhance our existing solutions. Leveraging our on-demand platform model, we can deploy real-time upgrades with no downtime.
Research and development expenses were $24.8 million, $19.8 million and $17.6 million for 2012, 2011 and 2010, respectively.
Competition
Our markets are highly competitive, fragmented and subject to rapid changes in technology. We compete primarily with companies that offer a broad array of data protection and governance solutions. Providers of data protection solutions generally have product offerings that include threat protection, virus protection, data loss prevention, flexible remediation, data encryption, and in some cases secure file transfer. Providers of governance solutions generally have product offerings that provide data storage, search, policy enforcement, legal hold management, and in some cases supervision.
Key competitors include:
• | Data Protection and Privacy: Cisco (through its acquisition of IronPort), Google (through its acquisition of Postini), McAfee, an Intel subsidiary (through its acquisitions of Secure Computing and MX Logic), Microsoft (through its acquisition of Frontbridge), and Symantec (through its acquisitions of Brightmail and MessageLabs) |
• | Archiving and Governance: EMC (through its acquisitions of Legato and Kazeon), Hewlett-Packard (through its acquisition of Autonomy) and Symantec (through its acquisitions of KVS and LiveOffice) |
We believe we compete favorably based on the following factors:
• | level of protection against advanced threats; |
• | comprehensiveness and integration of the solution; |
• | flexibility of delivery models; |
• | total cost of ownership; |
• | scalability and performance; |
• | customer support; and |
• | extensibility of platform. |
Certain of our competitors have greater sales, marketing and financial resources, more extensive geographic presence and greater name recognition than we do. We may face future competition in our markets from other large, established companies, as well as from emerging companies. In addition, we expect that there is likely to be continued consolidation in our industry that could lead to increased price competition and other forms of competition.
Intellectual Property
We rely on a combination of trade secrets, patents, copyrights and trademarks, as well as contractual protections, to establish and protect our intellectual property rights and protect our proprietary technology. As of December 31, 2012, we had 17 patents and eight patent applications. We have a number of registered and unregistered trademarks. We require our employees, consultants and other third parties to enter into confidentiality and proprietary rights agreements and control access to software, documentation and other proprietary information. Although we rely on intellectual property rights, including trade
12
secrets, patents, copyrights and trademarks, as well as contractual protections to establish and protect our proprietary rights, we believe that factors such as the technological and creative skills of our personnel, creation of new modules, features and functionality, and frequent enhancements to our solutions are more essential to establishing and maintaining our technology leadership position.
Despite our efforts to protect our proprietary technology and our intellectual property rights, unauthorized parties may attempt to copy or obtain and use our technology to develop products with the same functionality as our solution. Policing unauthorized use of our technology and intellectual property rights is difficult.
We expect that software and other solutions in our industry may be subject to third-party infringement claims as the number of competitors grows and the functionality of products in different industry segments overlaps. Any of these third parties might make a claim of infringement against us at any time.
Employees
As of December 31, 2012, we had 449 employees. We also engage a number of temporary employees and consultants. None of our employees is represented by a labor union with respect to his or her employment with us. We have not experienced any work stoppages and we consider our relations with our employees to be good. Our future success will depend upon our ability to attract and retain qualified personnel. Competition for qualified personnel remains intense and we may not be successful in retaining our key employees or attracting skilled personnel.
Corporate Information
We were incorporated in Delaware in 2002. Our principal executive offices are located at 892 Ross Drive, Sunnyvale, California 94089, and our telephone number is (408) 517-4710.
Proofpoint, the Proofpoint logo, all of our product names and our other registered or common law trademarks, service marks, or trade names appearing in this Annual Report on Form 10-K are our property. Other trademarks appearing in this prospectus are the property of their respective holders.
Available Information
We file annual reports on Form 10-K, quarterly reports on Form 10-Q, current reports on Form 8-K, proxy and information statements and amendments to reports filed or furnished pursuant to Sections 13(a), 14 and 15(d) of the Securities Exchange Act of 1934, as amended. The public may obtain these filings at the Securities and Exchange Commission (“SEC”)'s Public Reference Room at 100 F Street, NE, Washington, DC 20549 or by calling the SEC at 1-800-SEC-0330. The SEC also maintains a website at http://www.sec.gov that contains reports, proxy and information statements and other information regarding Proofpoint and other companies that file materials with the SEC electronically. Copies of Proofpoint's reports on Form 10-K, Forms 10-Q and Forms 8-K, may be obtained, free of charge, electronically through our internet website, http://investor.proofpoint.com/financials.cfm, or by sending an electronic message by visiting the Contact Us section within the investor relations portion of our website.
13
ITEM 1A. RISK FACTORS
Investing in our common stock involves a high degree of risk. You should carefully consider the following risk factors, as well as the other information in this Annual Report on Form 10-K, before deciding whether to invest in shares of our common stock. The occurrence of any of the events described below could harm our business, financial condition, results of operation and growth prospects. In such an event, the trading price of our common stock may decline and you may lose all or part of your investment.
Risks Related to Our Business and Industry
We have a history of losses, and we are unable to predict the extent of any future losses or when, if ever, we will achieve profitability in the future.
We have incurred net losses in every year since our inception, including net losses of $20.4 million, $20.1 million and $20.9 million in 2012, 2011 and 2010, respectively. As a result, we had an accumulated deficit of $182.5 million as of December 31, 2012. Achieving profitability will require us to increase revenue, manage our cost structure, and avoid unanticipated liabilities. We do not expect to be profitable in the near term. Revenue growth may slow or revenue may decline for a number of possible reasons, including slowing demand for our solutions, increasing competition, a decrease in the growth of our overall market, or if we fail for any reason to continue to capitalize on growth opportunities. Any failure by us to obtain and sustain profitability, or to continue our revenue growth, could cause the price of our common stock to decline significantly.
Our quarterly operating results are likely to vary significantly and be unpredictable, which could cause the trading price of our stock to decline.
Our operating results have historically varied from period to period, and we expect that they will continue to do so as a result of a number of factors, many of which are outside of our control and may be difficult to predict, including:
• | the level of demand for our solutions and the level of perceived urgency regarding security threats and compliance requirements; |
• | the timing of new subscriptions and renewals of existing subscriptions; |
• | the mix of solutions sold; |
• | the extent to which customers subscribe for additional solutions or increase the number of users; |
• | customer budgeting cycles and seasonal buying patterns; |
• | the extent to which we bring on new distributors; |
• | any changes in the competitive landscape of our industry, including consolidation among our competitors, customers, partners or resellers; |
• | deferral of orders in anticipation of new solutions or enhancements announced by us; |
• | price competition; |
• | changes in renewal rates and terms in any quarter; |
• | any disruption in our sales channels or termination of our relationship with important channel partners; |
• | general economic conditions, both domestically and in our foreign markets; |
• | insolvency or credit difficulties confronting our customers, affecting their ability to purchase or pay for our solutions; or |
• | future accounting pronouncements or changes in our accounting policies. |
14
Any one of the factors above or the cumulative effect of some of the factors referred to above may result in significant fluctuations in our quarterly financial and other operating results, including fluctuations in our key metrics. This variability and unpredictability could result in our failing to meet the expectations of securities analysts or investors for any period. If we fail to meet or exceed such expectations for these or any other reasons, the market price of our shares could fall substantially and we could face costly lawsuits, including securities class action suits. In addition, a significant percentage of our operating expenses are fixed in nature and based on forecasted revenue and cash flow trends. Accordingly, in the event of revenue shortfalls, we are generally unable to mitigate the negative impact on margins or other operating results in the short term.
We may fail to meet or exceed the expectations of securities analysts and investors, and the market price for our common stock could decline. If one or more of the securities analysts who cover us change their recommendation regarding our stock adversely, the market price for our common stock could decline. Additionally, our stock price may be based on expectations, estimates or forecasts of our future performance that may be unrealistic or may not be achieved. Further our stock price may be affected by financial media, including press reports and blogs.
If we are unable to maintain high subscription renewal rates, our future revenue and operating results will be harmed.
Our customers have no obligation to renew their subscriptions for our solutions after the expiration of their initial subscription period, which typically ranges from one to three years. In addition, our customers may renew for fewer subscription services or users, renew for shorter contract lengths or renew at lower prices due to competitive or other pressures. We cannot accurately predict renewal rates and our renewal rates may decline or fluctuate as a result of a number of factors, including competition, customers' IT budgeting and spending priorities, and deteriorating general economic conditions. If our customers do not renew their subscriptions for our solutions, our revenue would decline and our business would suffer.
If we are unable to sell additional solutions to our customers, our future revenue and operating results will be harmed.
Our future success depends on our ability to sell additional solutions to our customers. This may require increasingly sophisticated and costly sales efforts and may not result in additional sales. In addition, the rate at which our customers purchase additional solutions depends on a number of factors, including the perceived need for additional solutions, growth in the number of end-users, and general economic conditions. If our efforts to sell additional solutions to our customers are not successful, our business may suffer.
If our solutions fail to protect our customers from security breaches, our brand and reputation could be harmed, which could have a material adverse effect on our business and results of operations.
The threats facing our customers are constantly evolving and the techniques used by attackers to access or sabotage data change frequently. As a result, we must constantly update our solutions to respond to these threats. If we fail to update our solutions in a timely or effective manner to respond to these threats, our customers could experience security breaches. Many state and foreign governments have enacted laws requiring companies to notify individuals of data security breaches involving their personal data. These mandatory disclosures regarding a security breach often lead to widespread negative publicity, and any association of us with such publicity may cause our customers to lose confidence in the effectiveness of our data security measures. Any security breach at one of our customers would harm our reputation as a secure and trusted company and could cause the loss of customers. Similarly, if a well-publicized breach of data security at a customer of any other cloud-based data protection or archiving service provider or other major enterprise cloud services provider were to occur, there could be a loss of confidence in the cloud-based storage of sensitive data and information generally.
In addition, our solutions work in conjunction with a variety of other elements in customers' IT and security infrastructure, and we may receive blame and negative publicity for a security breach that may have been the result of the failure of one of the other elements not provided by us. The occurrence of a breach, whether or not caused by our solutions, could delay or reduce market acceptance of our solutions and have an adverse effect on our business and financial performance. In addition, any revisions to our solutions that we believe may be necessary or appropriate in connection with any such breach may cause us to incur significant expenses. Any of these events could have material adverse effects on our brand and reputation, which could harm our business, financial condition, and operating results.
If our customers experience data losses, our brand, reputation and business could be harmed.
Our customers rely on our archive solutions to store their corporate data, which may include financial records, credit card information, business information, health information, other personally identifiable information or other sensitive personal information. A breach of our network security and systems or other events that cause the loss or public disclosure of, or access
15
by third parties to, our customers' stored files or data could have serious negative consequences for our business, including possible fines, penalties and damages, reduced demand for our solutions, an unwillingness of our customers to use our solutions, harm to our brand and reputation, and time-consuming and expensive litigation. The techniques used to obtain unauthorized access, disable or degrade service, or sabotage systems change frequently, often are not recognized until launched against a target, and may originate from less regulated or remote areas around the world. As a result, we may be unable to proactively prevent these techniques, implement adequate preventative or reactionary measures, or enforce the laws and regulations that govern such activities. In addition, because of the large amount of data that we collect and manage, it is possible that hardware failures, human errors or errors in our systems could result in data loss or corruption, or cause the information that we collect to be incomplete or contain inaccuracies that our customers regard as significant. If our customers experience any data loss, or any data corruption or inaccuracies, whether caused by security breaches or otherwise, our brand, reputation and business would be harmed.
Our errors and omissions insurance may be inadequate or may not be available in the future on acceptable terms, or at all. In addition, our policy may not cover any claim against us for loss of data or other indirect or consequential damages. Defending a suit based on any data loss or system disruption, regardless of its merit, could be costly and divert management's attention.
Defects or vulnerabilities in our solutions could harm our reputation, reduce the sales of our solutions and expose us to liability for losses.
Because our solutions are complex, undetected errors, failures or bugs may occur, especially when solutions are first introduced or when new versions or updates are released despite our efforts to test those solutions and enhancements prior to release. We may not be able to correct defects, errors, vulnerabilities or failures promptly, or at all.
Any defects, errors, vulnerabilities or failures in our solutions could result in:
• | expenditure of significant financial and development resources in efforts to analyze, correct, eliminate or work around errors or defects or to address and eliminate vulnerabilities; |
• | loss of existing or potential partners or customers; |
• | loss or disclosure of our customers' confidential information, or the inability to access such information; |
• | loss of our proprietary technology; |
• | our solutions being susceptible to hacking or electronic break-ins or otherwise failing to secure data; |
• | delayed or lost revenue; |
• | delay or failure to attain market acceptance; |
• | lost market share; |
• | negative publicity, which could harm our reputation; or |
• | litigation, regulatory inquiries or investigations that would be costly and harm our reputation. |
Limitation of liability provisions in our standard terms and conditions may not adequately or effectively protect us from any claims related to defects, errors, vulnerabilities or failures in our solutions, including as a result of federal, state or local laws or ordinances or unfavorable judicial decisions in the United States or other countries.
Because we provide security solutions, our software, website and internal systems may be subject to intentional disruption that could adversely impact our reputation and future sales.
We could be a target of attacks specifically designed to impede the performance of our solutions and harm our reputation. Similarly, experienced computer hackers may attempt to penetrate our network security or the security of our website and misappropriate proprietary information and/or cause interruptions of our services. Because the techniques used by such computer hackers to access or sabotage networks change frequently and may not be recognized until launched against a target, we may be unable to anticipate these techniques. If an actual or perceived breach of network security occurs, it could
16
adversely affect the market perception of our solutions, and may expose us to the loss of information, litigation and possible liability. In addition, such a security breach could impair our ability to operate our business, including our ability to provide support services to our customers.
We believe that there is a trend for large and mid-sized enterprises to migrate their on-premise email systems to cloud-based offerings. If we fail to successfully develop, market, broaden or enhance our solutions to continue to be attractive to existing customers currently using cloud-based email systems or by new prospects, our ability to grow or maintain our revenue could be harmed, and our business could suffer.
We derive a substantial portion of our revenue from our solutions that protect and archive data in our customers' on-premise email systems and expect to continue to do so for the foreseeable future. We currently derive a portion of our revenue from customers using cloud-based email systems such as Google's Google Apps and Microsoft's Office 365, both of which include varying degrees of threat protection and governance services as part of their offering. A significant market shift from on-premise email systems toward such cloud-based email systems could decrease demand for our solutions because customers who move to cloud-based email systems may no longer value our threat and governance solutions and may choose to instead use competing or low cost alternatives from companies such as Google or Microsoft that may offer competing solutions in connection with their cloud-based email systems. If our current or prospective customers who utilize cloud-based systems fail to find value in our solutions or migrate to these other threat or governance offerings, our business could be adversely affected.
Historically, our solutions have been used primarily for email, and any decrease in the use of email systems by large and mid-sized enterprises over time, or the failure of our newly developed solutions for emerging methods of communication and collaboration to gain acceptance could harm our business.
Historically, our customers have primarily used our solutions to protect and archive data in their corporate email systems. If the use of email decreases, demand for our solutions would decrease and we may fail to diversify our revenue base by increasing demand for our other technology solutions.
In addition, messaging and collaboration technologies are evolving rapidly. For instance, the widespread adoption and use of mobile devices, unmanaged Internet-based collaboration and file sharing applications and social networking sites have caused valuable and sensitive data to proliferate well beyond traditional corporate email systems, resulting in new and increasing security risks. We are devoting resources to continue developing and marketing our solutions for these emerging methods of communication and collaboration. However, our customers may not perceive the need to deploy our solutions intended to address these emerging areas. If we are unable to successfully develop, market, broaden or enhance our solutions to address the wider range of threats caused by the proliferation of new technologies and methods of communication, demand for our existing solutions would decrease, and our business would be harmed.
If functionality similar to that offered by our solutions is incorporated into our competitors' networking products, potential or existing customers may decide against adding our solutions to their network, which would have an adverse effect on our business.
Some large, well-established providers of networking equipment, such as Cisco and Juniper Networks, Inc. currently offer, and may continue to introduce, network security features that compete with our solutions, either in stand-alone security products or as additional features in their network infrastructure products. The inclusion of, or the announcement of an intent to include, functionality perceived to be similar to that offered by our solutions in networking products that are already generally accepted as necessary components of customers' network architecture may have an adverse effect on our ability to market and sell our solutions. Furthermore, even if the functionality offered by network infrastructure providers is more limited than that offered by our solutions, a significant number of our customers may elect to accept such limited functionality in lieu of adding appliances or software from an additional vendor such as us. Many organizations have invested substantial personnel and financial resources to design and operate their networks and have established deep relationships with other providers of networking products, which may make them reluctant to add new third-party components to their networks.
Our solutions collect, filter and archive customer data which may contain personal information, which raises privacy concerns and could result in us having liability or inhibit sales of our solutions.
Many federal, state and foreign government bodies and agencies have adopted or are considering adopting laws and regulations regarding the collection, use, and disclosure of personal information. Because many of the features of our solutions use, store, and report on customer data which may contain personal information from our customers, any inability to adequately address privacy concerns, or comply with applicable privacy laws, regulations and policies could, even if unfounded, result in liability to us, damage to our reputation, loss of sales, and harm to our business. Furthermore, the costs of compliance with, and
17
other burdens imposed by, such laws, regulations and policies that are applicable to the businesses of our customers may limit the use and adoption of our solutions and reduce overall demand for them. Privacy concerns, whether or not valid, may inhibit market adoption of our solutions. For example, in the United States regulations such as the Gramm-Leach-Bliley Act (GLBA), which protects and restricts the use of consumer credit and financial information, and the Health Insurance Portability and Accountability Act of 1996 (HIPAA), which regulates the use and disclosure of personal health information, impose significant security and data protection requirements and obligations on businesses that may affect the use and adoption of our solutions. The European Union has also adopted a data privacy directive that requires member states to impose restrictions on the collection and use of personal data that, in some respects, are more stringent, and impose more significant burdens on subject businesses, than current privacy standards in the United States.
Any failure or perceived failure to comply with laws and regulations may result in proceedings or actions against us by government entities or others, or could cause us to lose users and customers, which could potentially have an adverse effect on our business.
We operate in a highly competitive environment with large, established competitors, and our competitors may gain market share in the markets for our solutions that could adversely affect our business and cause our revenue to decline.
Our traditional competitors include security-focused software vendors, such as Symantec Corporation and McAfee, Inc., an Intel Corporation subsidiary, which offer software products that directly compete with our solutions. In addition to competing with these vendors directly for sales to customers, we compete with them for the opportunity to have our solutions bundled with the product offerings of our strategic partners. Our competitors could gain market share from us if any of these partners replace our solutions with the products of our competitors or if these partners more actively promote our competitors' products over our solutions. In addition, software vendors who have bundled our solutions with theirs may choose to bundle their software with their own or other vendors' software, or may limit our access to standard product interfaces and inhibit our ability to develop solutions for their platform.
We also face competition from large technology companies, such as Cisco Systems, Inc., EMC Corporation, Google Inc., Hewlett-Packard Company, Intel and Microsoft. These companies are increasingly developing and incorporating into their products data protection and storage software that compete on various levels with our solutions. Our competitive position could be adversely affected to the extent that our customers perceive that the functionality incorporated into these products would replace the need for our solutions or that buying from one vendor would provide them with increased leverage
and purchasing power and a better customer experience. We also face competition from many smaller companies that specialize in particular segments of the markets in which we compete.
Many of our competitors have greater financial, technical, sales, marketing or other resources than we do and consequently may have the ability to influence our customers to purchase their products instead of ours. Further consolidation within our industry or other changes in the competitive environment could also result in larger competitors that compete with us on several levels. In addition, acquisitions of smaller companies that specialize in particular segments of the markets in which we compete by large technology companies would result in increased competition from these large technology companies. For example, Cisco's acquisition of IronPort, an email and web security service, resulted in Cisco becoming one of our competitors. If we are unsuccessful in responding to our competitors or to changing technological and customer demands, our competitive position and financial results could be adversely affected.
If we do not effectively expand and train our sales force, we may be unable to add new customers or increase sales to our existing customers and our business will be harmed.
We continue to be substantially dependent on our sales force to obtain new customers and to sell additional solutions to our existing customers. We believe that there is significant competition for sales personnel with the skills and technical knowledge that we require. Our ability to achieve significant revenue growth will depend, in large part, on our success in recruiting, training and retaining sufficient numbers of sales personnel to support our growth. New hires require significant training and may take significant time before they achieve full productivity. Our recent hires and planned hires may not become as productive as we expect, and we may be unable to hire or retain sufficient numbers of qualified individuals in the markets where we do business or plan to do business. If we are unable to hire and train sufficient numbers of effective sales personnel, or the sales personnel are not successful in obtaining new customers or increasing sales to our existing customer base, our business will be harmed.
Our sales cycle is long and unpredictable, and our sales efforts require considerable time and expense. As a result, our results are difficult to predict and may vary substantially from quarter to quarter, which may cause our operating results to fluctuate.
18
We sell our security and compliance offerings primarily to enterprise IT departments that are managing a growing set of user and compliance demands, which has increased the complexity of customer requirements to be met and confirmed in the sales cycle. Additionally, we have found that increasingly security, legal and compliance departments are involved in testing, evaluating and finally approving purchases, which has also made the sales cycle longer and less predictable. We may not be able to accurately predict or forecast the timing of sales, which makes our future revenue difficult to predict and could cause our results to vary significantly. In addition, we might devote substantial time and effort to a particular unsuccessful sales effort, and as a result we could lose other sales opportunities or incur expenses that are not offset by an increase in revenue, which could harm our business.
Because our long-term success depends, in part, on our ability to expand the sales of our platform to our customers located outside of the United States, our business will be increasingly susceptible to risks associated with international operations.
One key element of our growth strategy is to develop a worldwide customer base and expand our operations worldwide. We have added employees, offices and customers internationally, particularly in Europe and Asia. Operating in international markets requires significant resources and management attention and will subject us to regulatory, economic, political and competitive risks and competition that are different from those in the United States. Because of our limited experience with international operations, we cannot assure you that our international expansion efforts will be successful or that expected returns on such investments will be achieved in the future.
In addition, our international operations may fail to succeed due to other risks inherent in operating businesses internationally, including:
• | our lack of familiarity with commercial and social norms and customs in other countries which may adversely affect our ability to recruit, retain and manage employees in these countries; |
• | difficulties and costs associated with staffing and managing foreign operations; |
• | the potential diversion of management's attention to oversee and direct operations that are geographically distant from our U.S. headquarters; |
• | compliance with multiple, conflicting and changing governmental laws and regulations, including employment, tax, privacy and data protection laws and regulations; |
• | legal systems in which our ability to enforce and protect our rights may be different or less effective than in the United States, including more limited protection for intellectual property rights in some countries; |
• | immaturity of compliance regulations in other jurisdictions, which may lower demand for our solutions; |
• | greater difficulty with payment collections and longer payment cycles; |
• | higher employee costs and difficulty terminating non-performing employees; |
• | differences in work place cultures; |
• | the need to adapt our solutions for specific countries; |
• | our ability to comply with differing technical and certification requirements outside the United States; |
• | tariffs, export controls and other non-tariff barriers such as quotas and local content rules; |
• | adverse tax consequences; |
• | fluctuations in currency exchange rates; |
• | restrictions on the transfer of funds; |
• | anti-bribery compliance by us or our partners; and |
19
• | new and different sources of competition. |
Our failure to manage any of these risks successfully could harm our existing and future international operations and seriously impair our overall business.
If the market for our delivery model and cloud computing services develops more slowly than we expect, our business could be harmed.
Our success will depend to a substantial extent on the willingness of enterprises, large and small, to increase their use of cloud computing services. The market for messaging security and data compliance solutions delivered as a service in particular is at an early stage relative to on-premise solutions, and these applications may not achieve and sustain high levels of demand and market acceptance. Many enterprises have invested substantial personnel and financial resources to integrate traditional enterprise software or hardware appliances for these applications into their businesses or may be reluctant or unwilling to use cloud computing services because they have concerns regarding the risks associated with reliability and security, among other things, of this delivery model, or its ability to help them comply with applicable laws and regulations. If enterprises do not perceive the benefits of this delivery model, then the market for our services may develop more slowly than we expect, which would adversely affect our business and operating results.
If we are unable to enhance our existing solutions and develop new solutions, our growth will be harmed and we may not be able to achieve profitability.
Our ability to attract new customers and increase revenue from existing customers will depend in large part on our ability to enhance and improve our existing solutions and to introduce new solutions. The success of any enhancement or new solution depends on several factors, including the timely completion, introduction and market acceptance of the enhancement or solution. Any new enhancement or solution we develop or acquire may not be introduced in a timely or cost-effective manner and may not achieve the broad market acceptance necessary to generate significant revenue. If we are unable to successfully develop or acquire new solutions or enhance our existing solutions to meet customer requirements, we may not grow as expected and we may not achieve profitability.
We cannot be certain that our development activities will be successful or that we will not incur delays or cost overruns. Furthermore, we may not have sufficient financial resources to identify and develop new technologies and bring enhancements or new solutions to market in a timely and cost effective manner. New technologies and enhancements could be delayed or cost more than we expect, and we cannot ensure that any of these solutions will be commercially successful if and when they are introduced.
If we are unable to cost-effectively scale or adapt our existing architecture to accommodate increased traffic, technological advances or changing customer requirements, our operating results could be harmed.
As our customer base grows, the number of users accessing our solutions over the Internet will correspondingly increase. Increased traffic could result in slow access speeds and response times. Since our customer agreements often include service availability commitments, slow speeds or our failure to accommodate increased traffic could result in breaches of our service level agreements or obligate us to issue service credits. In addition, the market for our solutions is characterized by rapid technological advances and changes in customer requirements. In order to accommodate increased traffic and respond to technological advances and evolving customer requirements, we expect that we will be required to make future investments in our network architecture. If we do not implement future upgrades to our network architecture cost-effectively, or if we experience prolonged delays or unforeseen difficulties in connection with upgrading our network architecture, our service quality may suffer and our operating results could be harmed.
If we fail to manage our sales and distribution channels effectively or if our partners choose not to market and sell our solutions to their customers, our operating results could be adversely affected.
We have derived and anticipate that in the future we will continue to derive a substantial portion of the sales of our solutions through channel partners. In order to scale our channel program to support growth in our business, it is important that we continue to help our partners enhance their ability to independently sell and deploy our solutions. We may be unable to continue to successfully expand and improve the effectiveness of our channel sales program.
Our agreements with our channel partners are generally non-exclusive and some of our channel partners have entered, and may continue to enter, into strategic relationships with our competitors or are competitors themselves. Further, many of our channel partners have multiple strategic relationships and they may not regard us as significant for their businesses. Our
20
channel partners may terminate their respective relationships with us with limited or no notice and with limited or no penalty, pursue other partnerships or relationships, or attempt to develop or acquire products or services that compete with our solutions. Our partners also may impair our ability to enter into other desirable strategic relationships. If our channel partners do not effectively market and sell our solutions, if they choose to place greater emphasis on products of their own or those offered by our competitors, or if they fail to meet the needs of our customers, our ability to grow our business and sell our solutions may be adversely affected. Similarly, the loss of a substantial number of our channel partners, and our possible inability to replace them, the failure to recruit additional channel partners, any reduction or delay in their sales of our solutions, or any conflicts between channel sales and our direct sales and marketing activities could materially and adversely affect our results of operations.
Because we recognize revenue from subscriptions over the term of the relevant service period, decreases or increases in sales are not immediately reflected in full in our operating results.
We recognize revenue from subscriptions over the term of the relevant service period, which typically range from one to three years, with some up to five years. As a result, most of our quarterly revenue from subscriptions results from agreements entered into during previous quarters. Consequently, a shortfall in demand for our solutions in any quarter may not significantly reduce our subscription revenue for that quarter, but could negatively affect subscription revenue in future quarters. We may be unable to adjust our cost structure to compensate for this potential shortfall in subscription revenue. Accordingly, the effect of significant downturns in sales of subscriptions may not be fully reflected in our results of operations until future periods. Our subscription model also makes it difficult for us to rapidly increase our subscription revenue through additional sales in any period, as subscription revenue must be recognized over the term of the contract.
Interruptions or delays in services provided by third parties could impair the delivery of our service and harm our business.
We currently serve our customers from third-party data center hosting facilities located in the United States, Canada and Europe. We also rely on bandwidth providers, Internet service providers, and mobile networks to deliver our solutions. Any damage to, or failure of, the systems of our third-party providers could result in interruptions to our service. If for any reason our arrangement with one or more of our data centers is terminated we could experience additional expense in arranging for new facilities and support. Our data center facilities providers have no obligations to renew their agreements with us on commercially reasonable terms, or at all. If we are unable to renew our agreements with the facilities providers on commercially reasonable terms or if in the future we add additional data center facility providers, we may experience costs or downtime in connection with the transfer to, or the addition of, new data center facilities. In addition, the failure of our data centers to meet our capacity requirements could result in interruptions in the availability of our solutions, impair the functionality of our solutions or impede our ability to scale our operations. As we continue to add data centers, restructure our data management plans, and increase capacity in existing and future data centers, we may move or transfer our data and our customers' data. Despite precautions taken during such processes and procedures, any unsuccessful data transfers may impair the delivery of our service, and we may experience costs or downtime in connection with the transfer of data to other facilities.
We also depend on access to the Internet through third-party bandwidth providers to operate our business. If we lose the services of one or more of our bandwidth providers, or if these providers experience outages, for any reason, we could experience disruption in delivering our solutions or we could be required to retain the services of a replacement bandwidth provider. Our business also depends on our customers having high-speed access to the Internet. Any Internet outages or delays could adversely affect our ability to provide our solutions to our customers.
Our operations also rely heavily on the availability of electricity, which also comes from third-party providers. If we or the third-party data center facilities that we use to deliver our services were to experience a major power outage or if the cost of electricity were to increase significantly, our operations and financial results could be harmed. If we or our third-party data centers were to experience a major power outage, we or they would have to rely on back-up generators, which might not work properly or might not provide an adequate supply during a major power outage. Such a power outage could result in a significant disruption of our business.
The occurrence of an extended interruption of ours or third-party services for any reason could result in lengthy interruptions in our services or in the delivery of customers' email and require us to provide service credits, refunds, indemnification payments or other payments to our customers, and could also result in the loss of customers.
Any failure to offer high-quality technical support services may adversely affect our relationships with our customers and harm our financial results.
21
Once our solutions are deployed, our customers depend on our support organization to resolve any technical issues relating to our solutions. In addition, our sales process is highly dependent on our solutions and business reputation and on strong recommendations from our existing customers. Any failure to maintain high-quality technical support, or a market perception that we do not maintain high-quality support, could harm our reputation, adversely affect our ability to sell our solutions to existing and prospective customers, and harm our business, operating results and financial condition.
We offer technical support services with many of our solutions. We may be unable to respond quickly enough to accommodate short-term increases in customer demand for support services. We also may be unable to modify the format of our support services to compete with changes in support services provided by competitors. Increased customer demand for these services, without corresponding revenue, could increase costs and adversely affect our operating results.
We have outsourced a substantial portion of our worldwide customer support functions to third-party service providers. If these companies experience financial difficulties, do not maintain sufficiently skilled workers and resources to satisfy our contracts, or otherwise fail to perform at a sufficient level, the level of support services to our customers may be significantly disrupted, which could materially harm our reputation and our relationships with these customers.
If we fail to develop or protect our brand, our business may be harmed.
We believe that developing and maintaining awareness and integrity of our company and our brand are important to achieving widespread acceptance of our existing and future offerings and are important elements in attracting new customers. We believe that the importance of brand recognition will increase as competition in our market further intensifies. Successful promotion of our brand will depend on the effectiveness of our marketing efforts and on our ability to provide reliable and useful solutions at competitive prices. We plan to continue investing substantial resources to promote our brand, both domestically and internationally, but there is no guarantee that our brand development strategies will enhance the recognition of our brand. Some of our existing and potential competitors have well-established brands with greater recognition than we have. If our efforts to promote and maintain our brand are not successful, our operating results and our ability to attract and retain customers may be adversely affected. In addition, even if our brand recognition and loyalty increases, this may not result in increased use of our solutions or higher revenue.
In addition, independent industry analysts often provide reviews of our solutions, as well as those of our competitors, and perception of our solutions in the marketplace may be significantly influenced by these reviews. We have no control over what these industry analysts report, and because industry analysts may influence current and potential customers, our brand could be harmed if they do not provide a positive review of our solutions or view us as a market leader.
The steps we have taken to protect our intellectual property rights may not be adequate.
We rely on a combination of contractual rights, trademarks, trade secrets, patents and copyrights to establish and protect our intellectual property rights. These offer only limited protection, however, and the steps we have taken to protect our proprietary technology may not deter its misuse, theft or misappropriation. Any of our patents, copyrights, trademarks or other intellectual property rights may be challenged by others or invalidated through administrative process or litigation. Competitors may independently develop technologies or products that are substantially equivalent or superior to our solutions or that inappropriately incorporate our proprietary technology into their products. Competitors may hire our former employees who may misappropriate our proprietary technology or misuse our confidential information. Although we rely in part upon confidentiality agreements with our employees, consultants and other third parties to protect our trade secrets and other confidential information, those agreements may not effectively prevent disclosure of trade secrets and other confidential information and may not provide an adequate remedy in the event of misappropriation of trade secrets or unauthorized disclosure of confidential information. In addition, others may independently discover our trade secrets and confidential information, and in such cases we could not assert any trade secret rights against such parties.
We might be required to spend significant resources to monitor and protect our intellectual property rights. We may initiate claims or litigation against third parties for infringement of our intellectual property rights or misappropriation of our trade secrets, or to establish the validity of our intellectual property rights. Any litigation, whether or not it is resolved in our favor, could result in significant expense to us and divert the efforts of our technical and management personnel, which may adversely affect our business, operating results and financial condition. Certain jurisdictions may not provide adequate legal infrastructure for effective protection of our intellectual property rights. Changing legal interpretations of liability for unauthorized use of our solutions or lessened sensitivity by corporate, government or institutional users to refraining from intellectual property piracy or other infringements of intellectual property could also harm our business.
22
Our issued patents may not provide us with any competitive advantages or may be challenged by third parties, and our patent applications may never be granted at all. It is possible that innovations for which we seek patent protection may not be protectable. Additionally, the process of obtaining patent protection is expensive and time consuming, and we may not be able to prosecute all necessary or desirable patent applications at a reasonable cost or in a timely manner. Given the cost, effort, risks and downside of obtaining patent protection, including the requirement to ultimately disclose the invention to the public, we may not choose to seek patent protection for certain innovations. However, such patent protection could later prove to be important to our business. Even if issued, there can be no assurance that any patents will have the coverage originally sought or adequately protect our intellectual property, as the legal standards relating to the validity, enforceability and scope of protection of patent and other intellectual property rights are uncertain. Any patents that are issued may be invalidated or otherwise limited, or may lapse or may be abandoned, enabling other companies to better develop products that compete with our solutions, which could adversely affect our competitive business position, business prospects and financial condition.
We cannot assure you that the measures we have taken to protect our intellectual property will adequately protect us, and any failure to protect our intellectual property could harm our business.
Third parties claiming that we infringe their intellectual property rights could cause us to incur significant legal expenses and prevent us from selling our solutions.
Companies in the software and technology industries, including some of our current and potential competitors, own large numbers of patents, copyrights, trademarks and trade secrets and frequently enter into litigation based on allegations of infringement, misappropriation or other violations of intellectual property rights. In addition, many of these companies have the capability to dedicate substantially greater resources to enforce their intellectual property rights and to defend claims that may be brought against them. The litigation may involve patent holding companies or other adverse patent owners who have no relevant product revenue and against whom our potential patents may provide little or no deterrence. We have received, and may in the future receive, notices that claim we have infringed, misappropriated or otherwise violated other parties' intellectual property rights. To the extent we gain greater visibility, we face a higher risk of being the subject of intellectual property infringement claims, which is not uncommon with respect to software technologies in general and information security technology in particular. There may be third-party intellectual property rights, including issued or pending patents that cover significant aspects of our technologies or business methods. Any intellectual property claims, with or without merit, could be very time consuming, could be expensive to settle or litigate and could divert our management's attention and other resources.
These claims could also subject us to significant liability for damages, potentially including treble damages if we are found to have willfully infringed patents or copyrights. These claims could also result in our having to stop using technology found to be in violation of a third party's rights. We might be required to seek a license for the intellectual property, which may not be available on reasonable terms or at all. Even if a license were available, we could be required to pay significant royalties, which would increase our operating expenses. As a result, we may be required to develop alternative non-infringing technology, which could require significant effort and expense. If we cannot license or develop technology for any infringing aspect of our business, we would be forced to limit or stop sales of one or more of our solutions or features of our solutions and may be unable to compete effectively. Any of these results would harm our business, operating results and financial condition.
In addition, our agreements with customers and channel partners include indemnification provisions under which we agree to indemnify them for losses suffered or incurred as a result of claims of intellectual property infringement and, in some cases, for damages caused by us to property or persons. Large indemnity payments could harm our business, operating results and financial condition.
We rely on technology and intellectual property licensed from other parties, the failure or loss of which could increase our costs and delay or prevent the delivery of our solutions.
We utilize various types of software and other technology, as well as intellectual property rights, licensed from unaffiliated third parties in order to provide certain elements of our solutions. Any errors or defects in any third-party technology could result in errors in our solutions that could harm our business. In addition, licensed technology and intellectual property rights may not continue to be available on commercially reasonable terms, or at all. While we believe that there are currently adequate replacements for the third-party technology we use, any loss of the right to use any of this technology on commercially reasonable terms, or at all, could result in delays in producing or delivering our solutions until equivalent technology is identified and integrated, which delays could harm our business. In this situation we would be required to either redesign our solutions to function with software available from other parties or to develop these components ourselves, which would result in increased costs. Furthermore, we might be forced to limit the features available in our current or future solutions. If we fail to maintain or renegotiate any of these technology or intellectual property licenses, we could face significant delays and diversion of resources in attempting to develop similar or replacement technology, or to license and integrate a functional equivalent of the technology.
23
Some of our solutions contain "open source" software, and any failure to comply with the terms of one or more of these open source licenses could negatively affect our business.
Some of our solutions are distributed with software licensed by its authors or other third parties under so-called "open source" licenses, which may include, by way of example, the GNU General Public License, or GPL, and the Apache License. Some of these licenses contain requirements that we make available source code for modifications or derivative works we create based upon the open source software, and that we license such modifications or derivative works under the terms of a particular open source license or other license granting third parties certain rights of further use. By the terms of certain open source licenses, we could be required to release the source code of our proprietary software, and to make our proprietary software available under open source licenses, if we combine our proprietary software with open source software in a certain manner. In the event that portions of our proprietary software are determined to be subject to an open source license, we could be required to publicly release the affected portions of our source code, re-engineer all or a portion of our technologies, or otherwise be limited in the licensing of our technologies, each of which could reduce or eliminate the value of our technologies and solutions. In addition to risks related to license requirements, usage of open source software can lead to greater risks than use of third party commercial software, as open source licensors generally do not provide warranties or controls on the origin of the software. We have established processes to help alleviate these risks, including a review process for screening requests from our development organizations for the use of open source software, but we cannot be sure that all open source software is submitted for approval prior to use in our solutions, that our programmers have not incorporated open source software into our proprietary solutions and technologies or that they will not do so in the future. In addition, many of the risks associated with usage of open source software cannot be eliminated, and could, if not properly addressed, negatively affect our business.
Governmental regulations affecting the export of certain of our solutions could negatively affect our business.
Our products are subject to U.S. export controls, and we incorporate encryption technology into certain of our products. These encryption products and the underlying technology may be exported outside the United States only with the required export authorizations, including by license, a license exception or other appropriate government authorizations, including the filing of an encryption registration. Governmental regulation of encryption technology and regulation of imports or exports, or our failure to obtain required import or export approval for our products, could harm our international sales and adversely affect our revenue.
We determined that subsequent to our acquisition of Fortiva, Inc., a Canadian company, in August 2008, we may have shipped a particular hardware appliance model to a limited number of international customers that, prior to shipment, may have required either a one-time product review or application for an encryption registration number in lieu of such product review. We have made a voluntary submission and a supplemental submission to the U.S. Commerce Department's Bureau of Industry and Security (BIS) to report this potential violation. On January 17, 2013, BIS issued a Warning Letter to us. The Warning Letter notified us that BIS would not be referring these violations to prosecution and had closed the matter.
The U.S. government also prohibits U.S. companies from doing business with customers in certain restricted countries, including Iran. As part of a pre-IPO due diligence review, we discovered a potential export violation involving the provision of web-based, email communication services through our Everyone.net service, which we acquired in October 2009. Our records indicate that there were two end-users who may have, for a portion of their respective service periods, been located in Iran, a U.S.-designated state sponsor of terrorism. Our internal investigation has progressed and we have found that the issues identified are specific to the acquired Everyone.net system, which has a separate customer database and billing system from that of Proofpoint's other businesses. We do not have any indication that these services were utilized by the Iranian government. The accounts of both end-users were terminated in 2010 and accounted for approximately $14,500 in payments to us in 2009 and $6,000 in payments to us in 2010. We have made a voluntary submission and a supplemental submission to the U.S. Department of Treasury's Office of Foreign Assets Control (OFAC) to report this potential violation. On November 2, 2012, OFAC issued a Cautionary Letter to us. The Cautionary Letter notified us that OFAC had closed the matter instead of pursuing any civil penalty.
Failure to comply with such regulations could result in penalties, costs, and restrictions on export privileges, which could also harm our operating results.
We have experienced rapid growth in recent periods. If we fail to manage such growth and our future growth effectively, we may be unable to execute our business plan, maintain high levels of service or adequately address competitive challenges.
We have experienced significant growth in recent periods. For example, we grew from 158 employees as of December 31, 2007 to 449 as of December 31, 2012. This growth has placed, and any future growth may place, a significant
24
strain on our management and operational infrastructure, including our hosting operations. Our success will depend, in part, on our ability to manage these changes effectively. We will need to continue to improve our operational, financial and management controls and our reporting systems and procedures. Failure to effectively manage growth could result in declines in service quality or customer satisfaction, increases in costs, difficulties in introducing new features or other operational difficulties. Any failure to effectively manage growth could adversely impact our business and reputation.
We have and may further expand through acquisitions of, or investments in, other companies, which may divert our management's attention, dilute our stockholders and consume corporate resources that otherwise would be necessary to sustain and grow our business.
Our business strategy may, from time to time, include acquiring complementary products, technologies or businesses. We also may enter into relationships with other businesses in order to expand our solutions, which could involve preferred or exclusive licenses, additional channels of distribution, or investments by or between the two parties. Negotiating these transactions can be time consuming, difficult and expensive, and our ability to close these transactions may be subject to third-party approvals, such as government regulation, which are beyond our control. Consequently, we can make no assurance that these transactions, once undertaken and announced, will close.
These kinds of transactions may result in unforeseen operating difficulties and expenditures. In particular, we may encounter difficulties assimilating or integrating the businesses, technologies, products, personnel or operations of acquired companies, particularly if the key personnel of the acquired business choose not to work for us, and we may have difficulty retaining the customers of any acquired business. Acquisitions may also disrupt our ongoing business, divert our resources and require significant management attention that would otherwise be available for development of our business. Any acquisition or investment could expose us to unknown liabilities. In addition, as of December 31, 2012, we had $21.5 million in goodwill and intangible assets recorded on our consolidated balance sheet. We may in the future need to incur charges with respect to the write-down or impairment of goodwill or intangible assets, which could adversely affect our operating results. Moreover, we cannot assure you that the anticipated benefits of any acquisition or investment would be realized or that we would not be exposed to unknown liabilities. In connection with these types of transactions, we may issue additional equity securities that would dilute our stockholders, use cash that we may need in the future to operate our business, incur debt on terms unfavorable to us or that we are unable to repay, incur large charges or substantial liabilities, encounter difficulties integrating diverse business cultures, and become subject to adverse tax consequences, substantial depreciation or deferred compensation charges. These challenges related to acquisitions or investments could adversely affect our business, operating results and financial condition.
If we are unable to attract and retain qualified employees, lose key personnel, fail to integrate replacement personnel successfully, or fail to manage our employee base effectively, we may be unable to develop new and enhanced solutions, effectively manage or expand our business, or increase our revenue.
Our future success depends upon our ability to recruit and retain key management, technical, sales, marketing, finance, and other critical personnel. Despite the economic downturn, competition for qualified management, technical and other personnel is intense, and we may not be successful in attracting and retaining such personnel. If we fail to attract and retain qualified employees, our ability to grow our business could be harmed. Our officers and other key personnel are employees-at-will, and we cannot assure you that we will be able to retain them. Competition for people with the specific skills that we require is significant. In order to attract and retain personnel in a competitive marketplace, we believe that we must provide a competitive compensation package, including cash and equity-based compensation. Volatility in our stock price may from time to time adversely affect our ability to recruit or retain employees. If we are unable to hire and retain qualified employees, or conversely, if we fail to manage employee performance or reduce staffing levels when required by market conditions, our business and operating results could be adversely affected.
In addition, hiring, training, and successfully integrating replacement personnel could be time consuming, may cause additional disruptions to our operations, and may be unsuccessful, which could negatively impact future revenue.
Changes in laws and/or regulations related to the Internet or changes in the Internet infrastructure itself may diminish the demand for our solutions, and could have a negative impact on our business.
The future success of our business depends upon the continued use of the Internet as a primary medium for commerce, communication and business applications. Federal, state or foreign government bodies or agencies have in the past adopted, and may in the future adopt, laws or regulations affecting data privacy and the use of the Internet as a commercial medium. Changes in these laws or regulations could require us to modify our solutions in order to comply with these changes. In addition, government agencies or private organizations may begin to impose taxes, fees or other charges for accessing the
25
Internet or commerce conducted via the Internet. These laws or charges could limit the growth of Internet-related commerce or communications generally, result in a decline in the use of the Internet and the viability of Internet-based applications such as ours and reduce the demand for our solutions.
The legal and regulatory framework also drives demand for our solutions. Our customers are subject to laws, regulations and internal policies that mandate how they process, handle, store, use and transmit a variety of sensitive data and communications. These laws and regulations are subject to revision, change and interpretation at any time, and any such change could either help or hurt the demand for our solutions. We cannot be sure that the legal and regulatory framework in any given jurisdiction will be favorable to our business or that we will be able to sustain or grow our business if there are any adverse changes to these laws and regulations.
If we are required to collect sales and use taxes on the solutions we sell, we may be subject to liability for past sales and our future sales may decrease.
State and local taxing jurisdictions have differing rules and regulations governing sales and use taxes, and these rules and regulations are subject to varying interpretations that may change over time. In particular, the applicability of sales taxes to our subscription services in various jurisdictions is unclear. We have recorded sales tax liabilities of $0.2 million on our consolidated balance sheet as of December 31, 2012 in respect of sales and use tax liabilities in various states and local jurisdictions. It is possible that we could face sales tax audits and that our liability for these taxes could exceed our estimates as state tax authorities could still assert that we are obligated to collect additional amounts as taxes from our customers and remit those taxes to those authorities. We could also be subject to audits with respect to state and international jurisdictions for which we have not accrued tax liabilities. A successful assertion that we should be collecting additional sales or other taxes on our services in jurisdictions where we have not historically done so and do not accrue for sales taxes could result in substantial tax liabilities for past sales, discourage customers from purchasing our application or otherwise harm our business and operating results.
Adverse conditions in the national and global economies and financial markets may adversely affect our business and financial results.
Our financial performance depends, in part, on the state of the economy, which deteriorated in the recent broad recession, and which may deteriorate in the future. Challenging economic conditions worldwide have from time to time contributed, and may continue to contribute, to slowdowns in the information technology industry, resulting in reduced demand for our solutions as a result of continued constraints on IT-related capital spending by our customers and increased price competition for our solutions. Moreover, we target some of our solutions to the financial services industry and therefore if there is consolidation in that industry, or layoffs, or lack of funding for IT purchases, our business may suffer. If unfavorable economic conditions continue or worsen, our business, financial condition and operating results could be materially and adversely affected.
Our business is subject to the risks of earthquakes, fire, power outages, floods and other catastrophic events, and to interruption by manmade problems such as terrorism.
Natural disasters or other catastrophic events may cause damage or disruption to our operations, international commerce and the global economy, and thus could have a strong negative effect on us. We have significant operations in the Silicon Valley area of Northern California, a region known for seismic activity. A major earthquake or other natural disaster, fire, act of terrorism or other catastrophic event that results in the destruction or disruption of any of our critical business operations or information technology systems could severely affect our ability to conduct normal business operations and, as a result, our future operating results could be harmed. These negative events could make it difficult or impossible for us to deliver our services to our customers, and could decrease demand for our services. Because we do not carry earthquake insurance for direct quake-related losses, and significant recovery time could be required to resume operations, our financial condition and operating results could be materially adversely affected in the event of a major earthquake or catastrophic event.
A portion of our revenue is generated by sales to government entities, which are subject to a number of challenges and risks.
Sales to U.S. and foreign federal, state and local governmental agency customers have accounted for a portion of our revenue in past periods, and we may in the future increase sales to government entities. Sales into government entities are subject to a number of risks. Selling to government entities can be highly competitive, expensive and time consuming, often requiring significant upfront time and expense without any assurance that we will win a sale. We have invested in the creation of a cloud offering certified under the Federal Information Security Management Act (FISMA) for government usage but we cannot be sure that we will continue to sustain or renew this certification, that the government will continue to mandate such
26
certification or that other government agencies or entities will use this cloud offering. Government demand and payment for our solutions may be impacted by public sector budgetary cycles and funding authorizations, with funding reductions or delays adversely affecting public sector demand for our solutions. Government entities may have contractual or other legal rights to terminate contracts with our distributors and resellers for convenience or due to a default, and any such termination may adversely impact our future results of operations. For example, if the distributor receives a significant portion of its revenue from sales to such governmental entity, the financial health of the distributor could be substantially harmed, which could negatively affect our future sales to such distributor. Governments routinely investigate and audit government contractors' administrative processes, and any unfavorable audit could result in the government refusing to continue buying our solutions, a reduction of revenue or fines or civil or criminal liability if the audit uncovers improper or illegal activities. Any such penalties could adversely impact our results of operations in a material way.
If we fail to maintain an effective system of internal controls, our ability to produce timely and accurate financial statements or comply with applicable regulations could be impaired.
As a public company, we are subject to the reporting requirements of the Exchange Act, the Sarbanes‑Oxley Act of 2002, or the Sarbanes‑Oxley Act, and the rules and regulations of the NASDAQ Global Market. We expect that the requirements of these rules and regulations will continue to increase our legal, accounting and financial compliance costs, make some activities more difficult, time consuming and costly, and place significant strain on our personnel, systems and resources.
The Sarbanes‑Oxley Act requires, among other things, that we maintain effective disclosure controls and procedures and internal control over financial reporting. We are continuing to develop and refine our disclosure controls and other procedures that are designed to ensure that information required to be disclosed by us in the reports that we file with the Securities and Exchange Commission, or the SEC, is recorded, processed, summarized and reported within the time periods specified in SEC rules and forms, and that information required to be disclosed in reports under the Exchange Act is accumulated and communicated to our principal executive and financial officers.
Our current controls and any new controls that we develop may become inadequate because of changes in conditions in our business. Further, weaknesses in our internal controls may be discovered in the future. Any failure to develop or maintain effective controls, or any difficulties encountered in their implementation or improvement, could harm our operating results or cause us to fail to meet our reporting obligations and may result in a restatement of our financial statements for prior periods. Any failure to implement and maintain effective internal controls also could adversely affect the results of periodic management evaluations and annual independent registered public accounting firm attestation reports regarding the effectiveness of our internal control over financial reporting that we are required to include in our periodic reports we will file with the SEC under Section 404 of the Sarbanes‑Oxley Act. Ineffective disclosure controls and procedures and internal control over financial reporting could also cause investors to lose confidence in our reported financial and other information, which would likely have a negative effect on the trading price of our common stock.
In order to maintain and improve the effectiveness of our disclosure controls and procedures and internal control over financial reporting, we have expended, and anticipate that we will continue to expend, significant resources, including accounting‑related costs, and provide significant management oversight. Any failure to maintain the adequacy of our internal controls, or consequent inability to produce accurate financial statements on a timely basis, could increase our operating costs and could materially impair our ability to operate our business. In the event that we are not able to demonstrate compliance with Section 404 of the Sarbanes‑Oxley Act that our internal controls are perceived as inadequate or that we are unable to produce timely or accurate financial statements, investors may lose confidence in our operating results and our stock price could decline. In addition, if we are unable to continue to meet these requirements, we may not be able to remain listed on The NASDAQ Global Market.
We are not currently required to comply with the SEC rules that implement Sections 302 and 404 of the Sarbanes‑Oxley Act, and are therefore not required to make a formal assessment of the effectiveness of our internal controls over financial reporting for that purpose. We are required to comply with certain of these rules, which will require management to certify financial and other information in our quarterly and annual reports and provide an annual management report on the effectiveness of our internal control over financial reporting. Though we will be required to disclose changes made in our internal control and procedures on a quarterly basis, we will not be required to make our first annual assessment of our internal control over financial reporting pursuant to Section 404 until the later of the year following our first annual report required to be filed with the SEC, or the date we are no longer an “emerging growth company” as defined in the Jumpstart Our Business Startups Act of 2012. We will remain an "emerging growth company" for up to five years, although if the market value of our common stock that is held by non-affiliates exceeds $700 million as of any June 30 before that time, we would cease to be an "emerging growth company" as of the following December 31. To comply with the requirements of being a public company,
27
we may need to undertake various actions, such as implementing new internal controls and procedures and hiring accounting or internal audit staff.
Our independent registered public accounting firm is not required to report on to the effectiveness of our internal control over financial reporting until the later of the year following our first annual report required to be filed with the SEC, or the date we are no longer an “emerging growth company.” At such time, our independent registered public accounting firm may issue a report that is adverse in the event it is not satisfied with the level at which our controls are documented, designed or operating. Our remediation efforts may not enable us to avoid a material weakness in the future.
We will incur significantly increased costs and devote substantial management time as a result of operating as a public company particularly after we are no longer an "emerging growth company."
As a public company, we will incur significant legal, accounting and other expenses that we did not incur as a private company. For example, we will be required to comply with certain of the requirements of the Sarbanes-Oxley Act and the Dodd Frank Wall Street Reform and Consumer Protection Act, as well as rules and regulations subsequently implemented by the SEC, and the NASDAQ Global Market, our stock exchange, including the establishment and maintenance of effective disclosure and financial controls and changes in corporate governance practices. We expect that compliance with these requirements will increase our legal and financial compliance costs and will make some activities more time consuming and costly. In addition, we expect that our management and other personnel will need to divert attention from operational and other business matters to devote substantial time to these public company requirements.
However, for as long as we remain an "emerging growth company" as defined in the Jumpstart Our Business Startups Act of 2012, we intend to take advantage of certain exemptions from various reporting requirements that are applicable to other public companies that are not "emerging growth companies" including, but not limited to, not being required to comply with the auditor attestation requirements of Section 404 of the Sarbanes-Oxley Act, reduced disclosure obligations regarding executive compensation in our periodic reports and proxy statements, and exemptions from the requirements of holding a nonbinding advisory vote on executive compensation and shareholder approval of any golden parachute payments not previously approved. We intend to take advantage of these reporting exemptions until we are no longer an "emerging growth company."
Under the Jumpstart Our Business Startups Act, "emerging growth companies" can delay adopting new or revised accounting standards until such time as those standards apply to private companies. We have irrevocably elected not to avail ourselves of this exemption from new or revised accounting standards and, therefore, we will be subject to the same new or revised accounting standards as other public companies that are not "emerging growth companies."
After we are no longer an "emerging growth company," we expect to incur significant expenses and devote substantial management effort toward ensuring compliance with the requirements of Section 404 of the Sarbanes-Oxley Act, when applicable to us. In that regard, we currently do not have an internal audit function, and we will need to hire additional accounting and financial staff with appropriate public company experience and technical accounting knowledge. We cannot predict or estimate the amount of additional costs we may incur as a result of becoming a public company or the timing of such costs. We also expect that operating as a public company will make it more difficult and more expensive for us to obtain director and officer liability insurance, and we may be required to accept reduced policy limits and coverage or incur substantially higher costs to obtain the same or similar coverage. As a result, it may be more difficult for us to attract and retain qualified people to serve on our board of directors, our board committees or as executive officers.
We are an "emerging growth company" and we cannot be certain if the reduced disclosure requirements applicable to emerging growth companies will make our common stock less attractive to investors.
We are an "emerging growth company," as defined in the Jumpstart Our Business Startups Act of 2012, and we intend to take advantage of certain exemptions from various reporting requirements that are applicable to other public companies that are not "emerging growth companies" including, but not limited to, not being required to comply with the auditor attestation requirements of section 404 of the Sarbanes-Oxley Act, reduced disclosure obligations regarding executive compensation in our periodic reports and proxy statements, and exemptions from the requirements of holding a nonbinding advisory
vote on executive compensation and shareholder approval of any golden parachute payments not previously approved. We cannot predict if investors will find our common stock less attractive because we will rely on these exemptions. If some investors find our common stock less attractive as a result, there may be a less active trading market for our common stock and our stock price may be more volatile.
28
Risks Related to the Ownership of Our Common Stock
The trading prices of the securities of technology companies have been highly volatile. Accordingly, the market price of our common stock has been, and is likely to continue to be, subject to wide fluctuations and could subject us to litigation. Factors affecting the market price of our common stock include:
• | variations in our revenue, billings, gross margin, operating results, free cash flow, loss per share and how these results compare to analyst expectations; |
• | forward looking guidance that we may provide regarding financial metrics such as billings, revenue, gross margin, operating results, free cash flow, and loss per share; |
• | announcements of technological innovations, new products or services, strategic alliances, acquisitions or significant agreements by us or by our competitors; |
• | disruptions in our cloud-based operations or services or disruptions of other prominent cloud-based operations or services; |
• | the economy as a whole, market conditions in our industry, and the industries of our customers; and |
• | any other factors discussed herein. |
In addition, the stock markets in general and the NASDAQ Global Market in particular, have experienced substantial price and volume volatility that is often seemingly unrelated to the operating results of any particular companies. Moreover, if the market for technology stocks, especially security and cloud computing-related stocks, or the stock market in general experiences uneven investor confidence, the market price of our common stock could decline for reasons unrelated to our business, operating results or financial condition. The market price for our stock might also decline in reaction to events that affect other companies within, or outside, our industry, even if these events do not directly affect us. Some companies that have experienced volatility in the trading price of their stock have been subject of securities litigation. If we are the subject of such litigation, it could result in substantial costs and a diversion of management’s attention and resources.
Anti-takeover provisions contained in our certificate of incorporation and bylaws, as well as provisions of Delaware law, could impair a takeover attempt.
Our certificate of incorporation and bylaws contain provisions that could have the effect of rendering more difficult, delaying or preventing an acquisition of our company deemed undesirable by our board of directors. These provisions could also reduce the price that investors might be willing to pay in the future for shares of our common stock and result in the market price of our common stock being lower than it would be without these provisions. Our corporate governance documents include provisions:
• | creating a classified board of directors whose members serve staggered three-year terms; |
• | authorizing “blank check” preferred stock, which could be issued by our board without stockholder approval which may contain voting, liquidation, dividend and other rights which are superior to our common stock; |
• | limiting the liability of, and providing indemnification to, our directors and officers; |
• | limiting the ability of our stockholders to call and bring business before special meetings by providing that any stockholder action must be effected at a duly called meeting of the stockholders and not by a consent in writing, and providing that only our board of directors, the chairman of our board of directors, our Chief Executive Officer or President may call a special meeting of the stockholders; and |
• | requiring advance notice of stockholder proposals for business to be conducted at meetings of our stockholders and for nominations of candidates for election to our board of directors. |
These provisions, alone or together, could frustrate, delay or prevent hostile takeovers and changes in control or changes in our management.
29
As a Delaware corporation, we are also subject to provisions of Delaware law, including Section 203 of the Delaware General Corporation law, which prevents some stockholders holding more than 15% of our outstanding common stock from engaging in certain business combinations merging or combining with us without approval of the holders of a substantial majority of all of our outstanding common stock.
Our failure to raise additional capital or generate the significant capital necessary to expand our operations and invest in new solutions could reduce our ability to compete and could harm our business.
We may need to raise additional funds, and we may not be able to obtain additional debt or equity financing on favorable terms, if at all. If we raise additional equity financing, our stockholders may experience significant dilution of their ownership interests and the per share value of our common stock could decline. If we issue equity securities in any additional financing, the new securities may have rights and preferences senior to our common stock. If we engage in debt financing, we may be required to accept terms that restrict our ability to incur additional indebtedness and force us to maintain specified liquidity or other ratios. If we need additional capital and cannot raise it on acceptable terms, we may not be able to, among other things:
• | develop or enhance our application and services; |
• | continue to expand our product development, sales and marketing organizations; |
• | acquire complementary technologies, products or businesses; |
• | expand operations, in the United States or internationally; |
• | hire, train and retain employees; or |
• | respond to competitive pressures or unanticipated working capital requirements. |
We do not anticipate paying cash dividends, and accordingly, stockholders must rely on stock appreciation for any return on their investment.
We do not anticipate paying cash dividends on our common stock in the future. As a result, only appreciation of the price of our common stock will provide a return to our stockholders. Investors seeking cash dividends should not invest in our common stock.
ITEM 1 B. UNRESOLVED STAFF COMMENTS
None.
ITEM 2. PROPERTIES
Our corporate headquarters, which includes our operations and research and development facilities, is located in Sunnyvale, California, and consists of 74,338 square feet of space under a lease that expires in 2014, with a three-year extension option.
We lease additional U.S. offices in Draper, Utah and Herndon, Virginia. We also lease offices in Toronto, Canada; Paris, France; Tokyo, Japan; Singapore; and Reading, United Kingdom. We believe our facilities are adequate for our current needs and for the foreseeable future.
The following is a list of our locations and the primary functions.
30
Location | Primary function |
Sunnyvale, California, U.S. | Research and development, sales, marketing and administration |
Draper, Utah, U.S. | Research and development, sales, marketing and administration |
Herndon, Virginia, U.S. | Sales |
Toronto, Canada | Research and development, sales, marketing and administration |
Reading, United Kingdom | Research and development, sales and marketing |
Paris, France | Sales |
Tokyo, Japan | Sales |
Singapore | Sales |
We operate nine data centers at third-party facilities throughout the world: four in the United States, two in Canada, one in the Netherlands, one in Germany and one in Australia.
ITEM 3. LEGAL PROCEEDINGS
From time to time, we are involved in various legal proceedings arising from the normal course of business activities. We are not presently a party to any litigation the outcome of which, we believe, if determined adversely to us, would individually or in the aggregate have a material adverse effect on our business, operating results, cash flows or financial condition.
As part of a pre-IPO due diligence review, we discovered a potential export violation involving the provision of web-based, email communication services through our Everyone.net service, which we acquired in October 2009. Our records indicate that there were two end-users who may have, for a portion of their respective service periods, been located in Iran, a U.S.‑designated state sponsor of terrorism. Our internal investigation has progressed and we have found that the issues identified are specific to the acquired Everyone.net system, which has a separate customer database and billing system from that of Proofpoint’s main businesses. We do not have any indication that these services were utilized by the Iranian government. The accounts of both end‑users were terminated in 2010 and accounted for approximately $14,500 in payments to us in 2009 and $6,000 in payments to us in 2010. Although we had ceased providing the services, we made a voluntary submission to OFAC on December 12, 2011 and a supplemental submission to OFAC on January 20, 2012, to report this potential violation. On November 2, 2012, OFAC issued a Cautionary Letter to us. The Cautionary Letter notified us that OFAC had closed the matter instead of pursuing any civil penalty.
In addition, we determined that subsequent to our acquisition of Fortiva in August 2008, we may have shipped a particular hardware appliance model to a limited number of international customers that, prior to shipment, may have required either a one-time product review or application for an encryption registration number in lieu of such product review. We have since acquired the appropriate encryption registration number. We have also made a voluntary submission and a supplemental submission to BIS to report this potential violation. On January 17, 2013, BIS issued a Warning Letter to us. The Warning Letter notified us that BIS would not be referring these violations to prosecution and had closed the matter. Our investigation of these matters has covered the last five fiscal years and we have not found any additional violations. We are in the process of supplementing our existing systems and procedures designed to ensure that we do not have any such violations in the future.
ITEM 4. MINE SAFETY DISCLOSURES
Not applicable.
31
PART II.
ITEM 5. MARKET FOR REGISTRANT'S COMMON EQUITY, RELATED STOCKHOLDER MATTERS AND ISSUER PURCHASES OF EQUITY SECURITIES
Market Price of Our Common Stock
Our common stock has traded on the NASDAQ Global Market since April 20, 2012, under the symbol PFPT. Prior to this date, there was no public market for our common stock. The following table set forth, for the periods, indicated, the high and low sales price of our common shares as reported by the NASDAQ Global Market.
High | Low | ||||||||
Year Ended December 31, 2012 | |||||||||
Second Quarter | April 20, 2012 - June 30, 2012 | $ | 17.14 | $ | 12.45 | ||||
Third Quarter | July 1, 2012 - September 30, 2012 | $ | 16.90 | $ | 12.44 | ||||
Fourth Quarter | October 1, 2012 - December 31, 2012 | $ | 14.14 | $ | 10.05 | ||||
Holders of our Common Shares
As of January 31, 2013, there were 155 stockholders of record, although we believe that there are a larger number of beneficial owners as many of our shares of our common stock are held by brokers and other institutions on behalf of stockholders.
Dividend Policy
We have never declared or paid any cash dividends on our common stock. We currently intend to retain any future earnings and do not expect to pay any cash dividends on our common stock for the foreseeable future. Any determination to pay dividends in the future will be at the discretion of our board of directors and will be dependent on a number of factors, including our earnings, capital requirements and overall financial conditions. In addition, the terms of our equipment loan agreement with Silicon Valley Bank limit our ability to pay dividends.
Unregistered Sales of Equity Securities
We made no sales of unregistered securities during the quarter ended December 31, 2012.
Use of Proceeds from Public Offering of Common Stock
There has been no material change in the use of proceeds from our initial public offering in April 2012.
Stock Performance Graph
The following graph shows a comparison from April 20, 2012 through December 31, 2012, of the cumulative total return for our common stock, the NASDAQ Composite Index, and the NASDAQ Computer Index. The graph assumes an investment of $100 on April 20, 2012 and reinvestment of any dividends. The comparisons in the graph below are required by the Securities and Exchange Commission and are not intended to forecast or be indicative of possible future performance of our common shares.
32
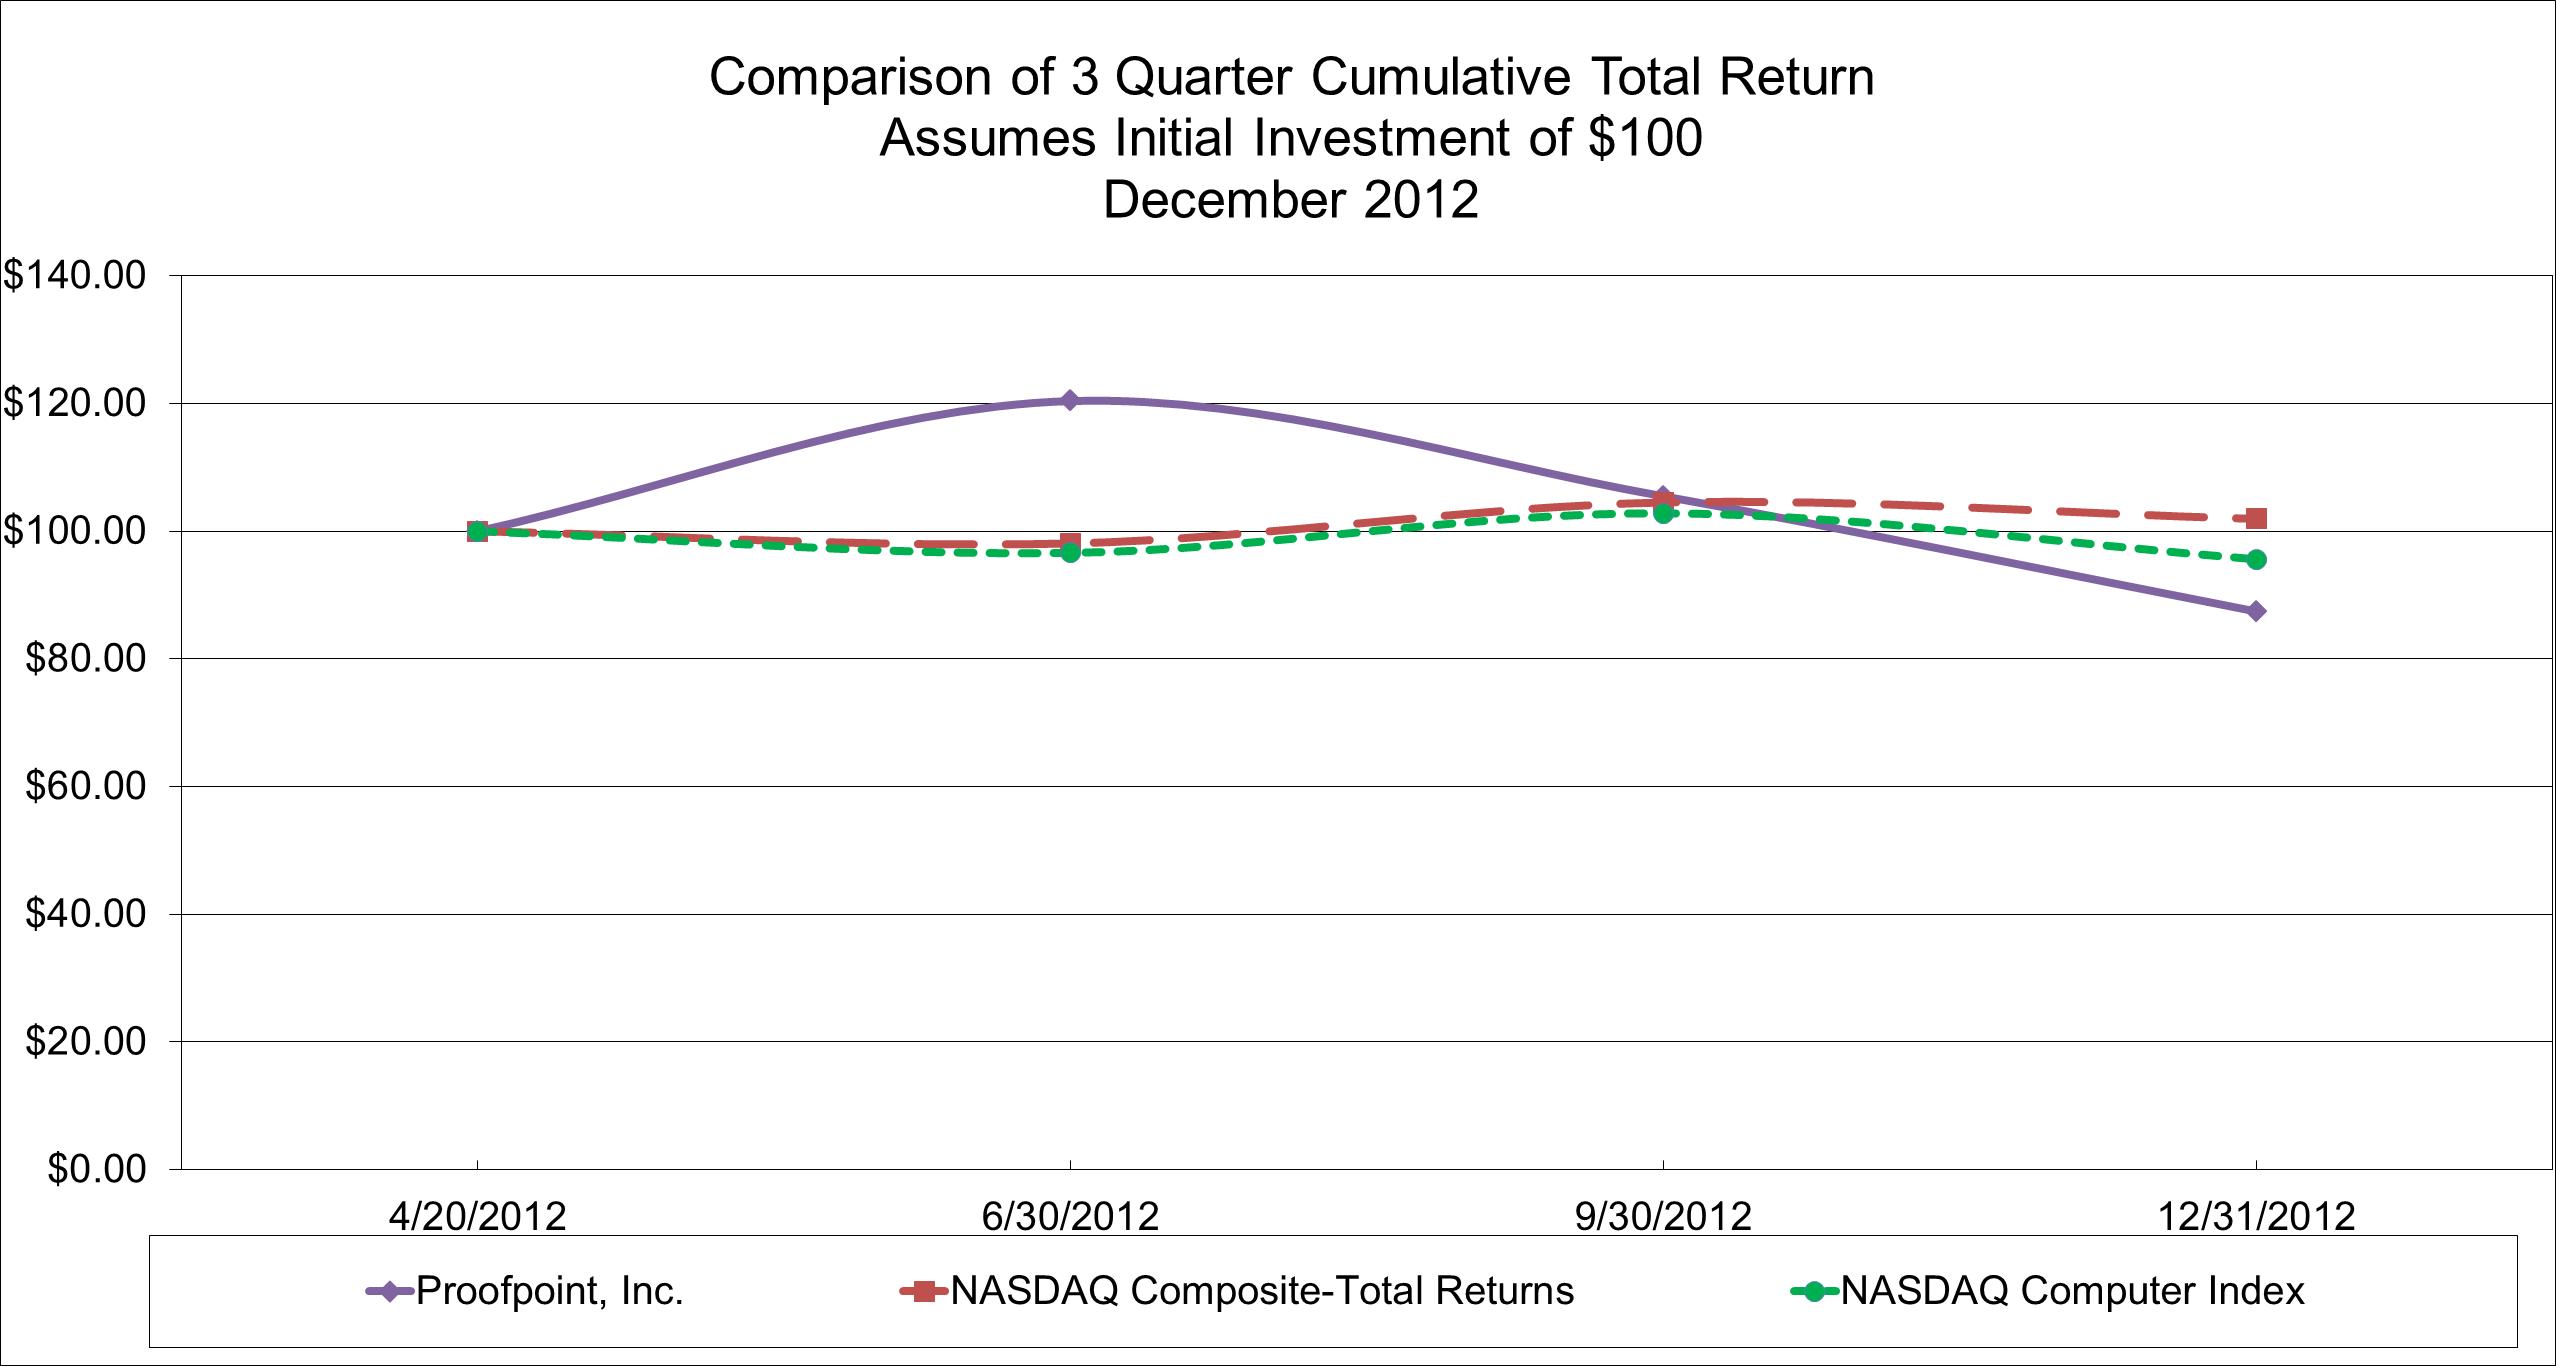
4/20/2012 | 6/30/2012 | 9/30/2012 | 12/31/2012 | |||||
Proofpoint, Inc. | 100.00 | 120.38 | 105.47 | 87.43 | ||||
NASDAQ Composite - Total Returns | 100.00 | 98.09 | 104.50 | 101.93 | ||||
NASDAQ Computer Index | 100.00 | 96.61 | 102.81 | 95.61 | ||||
The above stock Performance Graph and related information shall not be deemed "filed" with the SEC and is not to be incorporated by reference into any filing of Proofpoint, Inc. made under the Securities Act of 1933, as amended, or the Securities Exchange Act of 1934, as amended.
ITEM 6. SELECTED CONSOLIDATED FINANCIAL DATA
The following tables present selected historical financial data for our business. You should read this information together with "Management's Discussion and Analysis of Financial Condition and Results of Operations" and the consolidated financial statements, related notes and other financial information included elsewhere in this Annual Report on Form 10-K. The selected consolidated financial data in this section are not intended to replace the consolidated financial statements and are qualified in their entirety by the consolidated financial statements and related notes included elsewhere in this Annual Report on Form 10-K.
We derived the consolidated statements of operations data for the years ended December 31, 2012, 2011 and 2010, and the consolidated balance sheet data as of December 31, 2012 and 2011 from our audited consolidated financial statements included elsewhere in this report. We derived the consolidated statements of operations data for the years ended December 31, 2009 and 2008 and the consolidated balance sheet data as of December 31, 2010, 2009 and 2008 from our audited financial statements not included in this report. Our historical results are not necessarily indicative of the results to be expected in the future.
33
Years Ended December 31, | |||||||||||||||||||
2012 | 2011 | 2010 | 2009 | 2008 | |||||||||||||||
(in thousands, except per share data) | |||||||||||||||||||
Consolidated Statements of Operations Data: | |||||||||||||||||||
Revenue: | |||||||||||||||||||
Subscription | $ | 101,470 | $ | 73,896 | $ | 57,657 | $ | 42,135 | $ | 31,115 | |||||||||
Hardware and services | 4,825 | 7,942 | 7,133 | 6,393 | 7,128 | ||||||||||||||
Total revenue | 106,295 | 81,838 | 64,790 | 48,528 | 38,243 | ||||||||||||||
Cost of revenue:(1) | |||||||||||||||||||
Subscription | 28,246 | 24,193 | 24,523 | 19,150 | 11,907 | ||||||||||||||
Hardware and services | 4,867 | 5,537 | 4,082 | 3,309 | 3,850 | ||||||||||||||
Total cost of revenue | 33,113 | 29,730 | 28,605 | 22,459 | 15,757 | ||||||||||||||
Gross profit | 73,182 | 52,108 | 36,185 | 26,069 | 22,486 | ||||||||||||||
Operating expense:(1) | |||||||||||||||||||
Research and development | 24,827 | 19,779 | 17,583 | 11,831 | 10,926 | ||||||||||||||
Sales and marketing | 55,239 | 42,676 | 31,161 | 27,883 | 32,439 | ||||||||||||||
General and administrative | 12,693 | 9,237 | 7,465 | 5,678 | 5,224 | ||||||||||||||
Total operating expense | 92,759 | 71,692 | 56,209 | 45,392 | 48,589 | ||||||||||||||
Operating loss | (19,577 | ) | (19,584 | ) | (20,024 | ) | (19,323 | ) | (26,103 | ) | |||||||||
Interest income (expense), net | (108 | ) | (300 | ) | (340 | ) | 87 | 536 | |||||||||||
Other income (expense), net | (154 | ) | 113 | (258 | ) | (269 | ) | (183 | ) | ||||||||||
Loss before provision for income taxes | (19,839 | ) | (19,771 | ) | (20,622 | ) | (19,505 | ) | (25,750 | ) | |||||||||
Provision for income taxes | (521 | ) | (370 | ) | (243 | ) | (233 | ) | (138 | ) | |||||||||
Net loss | $ | (20,360 | ) | $ | (20,141 | ) | $ | (20,865 | ) | $ | (19,738 | ) | $ | (25,888 | ) | ||||
Net loss per share, basic and diluted | $ | (0.85 | ) | $ | (5.03 | ) | $ | (5.84 | ) | $ | (6.14 | ) | $ | (8.73 | ) | ||||
Weighted average shares outstanding, basic and diluted(2) | 24,056 | 4,005 | 3,575 | 3,212 | 2,964 | ||||||||||||||
(1) | Includes stock-based compensation and amortization of intangible assets as follows: |
Years Ended December 31, | |||||||||||||||||||
2012 | 2011 | 2010 | 2009 | 2008 | |||||||||||||||
(in thousands) | |||||||||||||||||||
Stock-based compensation | |||||||||||||||||||
Cost of subscription revenue | $ | 657 | $ | 366 | $ | 357 | $ | 275 | $ | 178 | |||||||||
Cost of hardware and services revenue | 70 | 29 | 17 | 11 | 1 | ||||||||||||||
Research and development | 1,869 | 1,247 | 1,010 | 848 | 519 | ||||||||||||||
Sales and marketing | 3,103 | 1,976 | 1,113 | 1,030 | 703 | ||||||||||||||
General and administrative | 1,622 | 930 | 868 | 732 | 707 | ||||||||||||||
Amortization of intangible assets | |||||||||||||||||||
Cost of subscription revenue | $ | 2,785 | $ | 3,772 | $ | 3,745 | $ | 3,371 | $ | 1,488 | |||||||||
Research and development | 30 | 1 | — | — | — | ||||||||||||||
Sales and marketing | 461 | 769 | 637 | 408 | 163 | ||||||||||||||
(2) | Please see notes 12 of our notes to consolidated financial statements included elsewhere in this report for an explanation of the calculations of basic and diluted net loss per share of common stock. |
34
As of December 31, | |||||||||||||||||||
2012 | 2011 | 2010 | 2009 | 2008 | |||||||||||||||
(in thousands) | |||||||||||||||||||
Consolidated Balance Sheet Data: | |||||||||||||||||||
Cash, cash equivalents and short-term investments | $ | 86,517 | $ | 12,714 | $ | 12,747 | $ | 11,317 | $ | 19,355 | |||||||||
Property and equipment, net | 8,560 | 7,353 | 4,630 | 4,455 | 3,861 | ||||||||||||||
Total assets | 140,441 | 67,952 | 62,352 | 63,722 | 64,138 | ||||||||||||||
Debt, current and long term | 4,012 | 4,981 | 264 | 741 | 723 | ||||||||||||||
Deferred revenue, current and long term | 86,859 | 76,240 | 69,101 | 57,346 | 47,690 | ||||||||||||||
Convertible preferred stock | — | 109,911 | 109,820 | 108,329 | 102,380 | ||||||||||||||
Total stockholders' equity (deficit) | 33,808 | (137,347 | ) | (128,401 | ) | (112,142 | ) | (95,508 | ) | ||||||||||
ITEM 7. MANAGEMENT'S DISCUSSION AND ANALYSIS OF FINANCIAL CONDITION AND RESULTS OF OPERATIONS
The following discussion and analysis of our financial condition and results of operations should be read in conjunction with our "Selected Consolidated Financial Data" and our consolidated financial statements and related notes included elsewhere in this Annual Report on Form 10-K. This discussion contains forward-looking statements that involve risks and uncertainties. Our actual results could differ materially from those forward-looking statements below. Factors that could cause or contribute to those differences include, but are not limited to, those identified below and those discussed in the section entitled "Risk Factors" included elsewhere in this Annual Report on Form 10-K. This Annual Report on Form 10-K contains “forward-looking statements” within the meaning of Section 21E of the Securities Exchange Act of 1934, as amended (the “Exchange Act”). These statements are often identified by the use of words such as “may,” “will,” “expect,” “believe,” “anticipate,” “intend,” “could,” “estimate,” or “continue,” and similar expressions or variations. Such forward-looking statements are subject to risks, uncertainties and other factors that could cause actual results and the timing of certain events to differ materially from future results expressed or implied by such forward-looking statements. Factors that could cause or contribute to such differences include, but are not limited to, those identified herein, and those discussed in the section titled “Risk Factors”, set forth in Part I, Item 1A of this Form 10-K. Except as required by law, we disclaim any obligation to update any forward-looking statements to reflect events or circumstances after the date of such statements.
Overview
Proofpoint is a pioneering security-as-a-service vendor that enables large and mid-sized organizations worldwide to defend, protect, archive and govern their most sensitive data. Our security-as-a-service platform is comprised of an integrated suite of on-demand data protection solutions, including threat protection, regulatory compliance, archiving and governance, and secure communication.
We were founded in 2002 to provide a unified solution to help enterprises address their growing data security requirements. Our first solution was commercially released in 2003 to combat the burgeoning problem of spam and viruses and their impact on corporate email systems. As the threat environment has continued to evolve, we have dedicated significant resources to meet the ongoing challenges that this highly dynamic environment creates for our customers. In addition, we have invested significantly to expand the breadth of our data protection platform:
• | In 2004, we launched our Regulatory Compliance and Digital Asset Security solutions, designed to prevent the loss of critical data. These Data Loss Prevention, or DLP, solutions apply our proprietary machine learning and deep content inspection technologies to screen outbound email to prevent the theft or inadvertent loss of sensitive or confidential information. |
• | In 2005, we launched Proofpoint Secure Messaging, our first email encryption solution. |
• | In 2006, we combined our email encryption and DLP technologies to develop a new solution for policy-based encryption, enabling each outgoing message to be inspected for confidential content and automatically encrypted accordingly. |
35
• | In 2007, we began selling our software-based virtual appliance, enabling our customers to deploy our solutions in a private cloud configuration. We also invested in international expansion by establishing a team in the United Kingdom as a precursor to the build out of our data center infrastructure, and launching operations in Germany and the Netherlands to support our customers outside of the United States. |
• | In 2008, we introduced Proofpoint Enterprise Archive, a cloud-based email archiving solution that enables businesses to securely archive both their email and instant message conversations while enabling real-time access to the entire repository for quick and easy electronic discovery, or eDiscovery. |
• | In 2009, we launched Proofpoint Encryption, a proprietary email encryption solution that improved the level of integration across our data protection suite and allowed us to phase out technology licensed from a third party. We also introduced a cloud-based email messaging service. |
• | In 2010, we evolved our solutions to address new forms of messaging and information sharing in the enterprise such as social media and Internet-based collaboration and file sharing applications. |
• | In 2011, we achieved FISMA certification for our cloud-based archiving and governance solution, enabling us to serve the rigorous security requirements of U.S. Federal agencies. We also introduced an integrated security offering in conjunction with VMware for its Zimbra Collaboration Server. |
• | In 2012, we introduced Proofpoint Enterprise Governance, an information governance solution that provides organizations the ability to monitor and apply governance policies to unstructured information across the enterprise. We also introduced Proofpoint Targeted Attack Protection along with Proofpoint Secure Share. Proofpoint Target Attack Protection is a solution that uses big data analysis techniques to identify and apply additional security controls to suspicious messages. Proofpoint Secure Share allows enterprises to securely exchange large files with ease in a cloud-based environment. |
Our business is based on a recurring revenue model. Our customers pay a subscription fee to license the various components of our security-as-a-service platform for a contract term that is typically one to three years. At the end of the license term, customers may renew their subscription and in each year since the launch of our first solution in 2003, we have retained over 90% of our customers. We derive this retention rate by calculating the total annually recurring subscription revenue from customers currently using our security-as-a-service platform and dividing it by the total annually recurring subscription revenue from both these current customers as well as all business lost through non-renewal. A growing number of our customers increase their annual subscription fees after their initial purchase by broadening their use of our platform or by adding more users, as evidenced by the fact that these sales consistently represent 15% or more of our billings each year since 2008. As our business has grown, our subscription revenue has increased as a percentage of our total revenue, from 89% of total revenue in 2010 to 95% in 2012.
We market and sell our solutions to large and mid-sized customers both directly through our field and inside sales teams and indirectly through a hybrid model where our sales organization actively assists our network of distributors and resellers. We also derive a lesser portion of our revenue from the license of our solutions to strategic partners who offer our solutions in conjunction with one or more of their own products or services.
Our sales and marketing operation consists of sales people and associated marketing resources, each of whom are assigned to a specific geographic territory. Their mission is to grow additional revenue within their respective territory in whatever manner is most efficient, either by obtaining new customers or by working with existing customers to expand their use of our solutions. Our sales teams are compensated equally for sales to new customers or sales of additional solutions to existing customers, and we do not allocate sales and marketing resources between activities related to the acquisition of new customers and activities associated with the sale of additional solutions to existing customers.
We invoice our customers for the entire contract amount at the start of the term. The majority of these invoiced amounts is treated as deferred revenue on our consolidated balance sheet and is recognized ratably over the term of the contract. We invoice our strategic partners on a monthly basis, and the associated fees vary based upon the level of usage during the month by their customers. These amounts are recognized as revenue at the time of invoice.
Our deferred revenue balance on our consolidated balance sheet does not represent the total contract value of annual or multi-year, non-cancelable subscription agreements. Unbilled deferred revenue was approximately $7.6 million and $7.3 million as of December 31, 2012 and 2011, respectively. Unbilled deferred revenue represents future billings under our subscription agreements that have not been invoiced and, accordingly, are not recorded in deferred revenue. We expect that the
36
amount of unbilled deferred revenue will change depending upon the timing and duration of large customer subscription agreements, billing cycles and the timing of when unbilled deferred revenue is to be recognized as revenue. Additionally, the unbilled deferred revenue for multi-year subscription agreements that billed annually is typically high at the beginning of the contract period, low prior to renewal and increases when the agreement is renewed. Such fluctuations are not a reliable indicator of future revenues.
Our solutions are designed to be implemented, configured and operated without the need for any training or professional services. For those customers that seek to develop deeper expertise in the use of our solutions or would like assistance with complex configurations or the importing of data, we offer various training and professional services. In some cases, we provide a hardware appliance to those customers that elect to host elements of our solution behind their firewall. Increasing adoption of virtualization in the data center has led to a decline in the sales of our hardware appliances and a shift towards our software-based virtual appliances, which are delivered as a download via the Internet. Our hardware and services offerings carry lower margins and are provided as a courtesy to our customers. The revenue derived from these offerings has declined from11% of total revenue in 2010 to 5% of total revenue in 2012. We view this trend as favorable to our business and expect the overall proportion of total revenue derived from these offerings to continue to gradually decline.
The substantial majority of our revenue is derived from our customers in the United States. We believe the markets outside of the United States offer an opportunity for growth and we intend to make additional investments in sales and marketing to expand in these markets. Customers from outside of the United States represented 18%, 21% and 20% of total revenue for 2012, 2011 and 2010, respectively. As of December 31, 2012, we had approximately 2,700 customers around the world, including 27 of the Fortune 100. No single partner or customer accounted for more than 10% of our total revenue in 2011 or 2010, one customer accounted for 14% of our total revenue in 2012.
We have not been profitable to date and will need to grow revenue at a rate faster than our investments in cost of revenue and operating expenses in order to achieve profitability, as discussed in more detail below.
Key Opportunities and Challenges
The majority of costs associated with generating customer agreements are incurred up front. These upfront costs include direct incremental sales commissions, which are recognized upon the billing of the contract. The costs associated with the teams tasked with closing business with new customers and additional business with our existing customers have represented more than 90% of our total sales and marketing costs since 2008. Although we expect customers to be profitable over the duration of the customer relationship, these upfront costs typically exceed related revenue during the earlier periods of a contract. As a result, while our practice of invoicing our customers for the entire amount of the contract at the start of the term provides us with a relatively immediate contribution to cash flow, the revenue is recognized ratably over the term of the contract, and hence contributions toward operating income are limited in the period where these sales and marketing costs are incurred. Accordingly, an increase in the mix of new customers as a percentage of total customers would likely negatively impact our near-term operating results. On the other hand, we expect that an increase in the mix of existing customers as a percentage of total customers would positively impact our operating results over time. As we accumulate customers that continue to renew their contracts, we anticipate that our mix of existing customers will increase, contributing to a decrease in our sales and marketing costs as a percentage of total revenue and a commensurate improvement in our operating income.
As part of maintaining our security-as-a-service platform, we provide ongoing updates and enhancements to the platform services both in terms of the software as well as the underlying hardware and data center infrastructure. These updates and enhancements are provided to our customers at no additional charge as part of the subscription fees paid for the use of our platform. While more traditional products eventually become obsolete and require replacement, we are constantly updating and maintaining our cloud-based services and as such they operate with a continuous product life cycle. Much of this work is designed to both maintain and enhance the customers' experience over time while also lowering our costs to deliver the service, as evidenced by our improvements in gross profit over the past three years. Our security-as-a-service platform is a shared infrastructure that is used by all of our approximately 2,700 customers. Accordingly, the costs of the platform are spread in a relatively uniform manner across the entire customer base and no specific infrastructure elements are directly attached to any particular customer. As such, in the event that a customer chooses to not renew its subscription, the underlying resources are reallocated either to new customers or to accommodate the expanding needs of our existing customers and, as a result, we do not believe that the loss of any particular customer has a meaningful impact on our gross profit as long as we continue to grow our customer base.
To date, our customers have primarily used our solutions in conjunction with email messaging content. We have developed solutions to address the new and evolving messaging solutions such as social media and file sharing applications, but these solutions are relatively nascent. If customers increase their use of these new messaging solutions in the future, we
37
anticipate that our growth in revenue associated with email messaging solutions may slow over time. Although revenue associated with our social media and file sharing applications has not been material to date, we believe that our ability to provide security, archiving, governance and discovery for these new solutions will be viewed as valuable by our existing customers, enabling us to derive revenue from these new forms of messaging and communication.
While the majority of our current and prospective customers run their email systems on premise, we believe that there is a trend for large and mid-sized enterprises to migrate these systems to the cloud. While our current revenue derived from customers using cloud-based email systems continues to grow as a percentage of our total revenue, many of these cloud-based email solutions offer some form of threat protection and governance services, potentially mitigating the need for customers to buy these capabilities from third parties such as ourselves. We believe that we can continue to provide security, archiving, governance, and discovery solutions that are differentiated from the services offered by cloud-based email providers, and as such our platform will continue to be viewed as valuable to enterprises once they have migrated their email services to the cloud, enabling us to continue to derive revenue from this new trend toward cloud-based email deployment models.
We are currently in the midst of a significant investment cycle in which we have taken steps designed to drive future revenue growth and profitability. For example, we plan to build out our infrastructure, develop our technology, offer additional security-as-a-service solutions, and expand our sales and marketing personnel both in North America and internationally. Accordingly, we expect that our total cost of revenue and operating expenses will continue to increase in absolute dollars, limiting our ability to achieve and maintain positive operating cash flow and profitability in the near term.
With the majority of our business, we invoice our customers for the entire contract amount at the start of the term and these amounts are recorded as deferred revenue on our balance sheet, with the dollar weighted average duration of these contracts for any given period over the past three years typically ranging from 18 to 23 months. As a result, while our practice of invoicing customers for the entire amount of the contract at the start of the term provides us with a relatively immediate contribution to cash flow, the revenue is recognized ratably over the term of the contract, and hence contributions toward operating income are realized over an extended period. Accordingly, when comparing 2012 with 2009, our cash flow related to operating activities improved by $10.5 million while our operating loss increased by $0.3 million. As such, our efforts to improve our profitability require us to invest far less in operating expenses than the cash flow generated by our business might otherwise allow. As we strive to invest in an effort to continue to increase the size and scale of our business, we expect that the level of investment afforded by our growth in revenue should be sufficient to fund the investments needed to drive revenue growth and broaden our product line.
Considering all of these factors, we do not expect to be profitable on a GAAP basis in the near term and in order to achieve profitability we will need to grow revenue at a rate faster than our investments in operating expenses and cost of revenue.
We intend to grow our revenue through acquiring new customers by investing in our sales and marketing activities. We believe that an increase in new customers in the near term will result in a larger base of renewal customers, which, over time we expect to be more profitable for us.
Sales and marketing is our greatest expense and hence a significant contributing factor to our operating losses. Given that our costs to acquire new revenue sources, either in the form of new customers or the sale of additional solutions to existing customers, often exceed the actual revenue recognized in the initial periods, we believe that our opportunity to improve our return on investment on sales and marketing costs relies primarily on our ongoing ability to cost effectively renew our business with existing customers, thereby lowering our overall sales and marketing costs as a percentage of revenue as the mix of revenue derived from this more profitable renewal activity increases over time. Therefore, we anticipate that our initial significant investments in sales and marketing activities will over time generate a larger base of more profitable customers. Cost of subscription revenue is also a significant expense for us, and we expect to continue to build on the improvements over the past three years, such as in replacing third-party technology with our proprietary technology and improving the utilization of our fixed investments in equipment and infrastructure, in order to provide the opportunity for improved subscription gross margins over time. Although we plan to continue enhancing our solutions, we intend to lower our rate of investment in research and development as a percentage of revenue over time by deriving additional revenue from our existing platform of solutions rather than by adding entirely new categories of solutions. In addition, as personnel costs are one of the primary drivers of the increases in our operating expenses, we plan to reduce our historical rate of headcount growth over time.
Key Metrics
We regularly review a number of metrics, including the following key metrics presented in the unaudited table below, to evaluate our business, measure our performance, identify trends in our business, prepare financial projections and make
38
strategic decisions. Many of these key metrics, such as adjusted subscription gross profit, billings and adjusted EBITDA, are non-GAAP measures. This non-GAAP information is not necessarily comparable to non-GAAP information of other companies. Non-GAAP information should not be viewed as a substitute for, or superior to, net loss prepared in accordance with GAAP as a measure of our profitability or liquidity. Users of this financial information should consider the types of events and transactions for which adjustments have been made.
Year Ended December 31, | |||||||||||
2012 | 2011 | 2010 | |||||||||
(in thousands) | |||||||||||
Total revenue | $ | 106,295 | $ | 81,838 | $ | 64,790 | |||||
Growth | 30 | % | 26 | % | 34 | % | |||||
Subscription revenue | $ | 101,470 | $ | 73,896 | $ | 57,657 | |||||
Growth | 37 | % | 28 | % | 37 | % | |||||
Adjusted subscription gross profit | $ | 76,666 | $ | 53,841 | $ | 37,236 | |||||
% of subscription revenue | 76 | % | 73 | % | 65 | % | |||||
Billings | $ | 116,914 | $ | 88,977 | $ | 76,545 | |||||
Growth | 31 | % | 16 | % | 32 | % | |||||
Adjusted EBITA | $ | (4,543 | ) | $ | (7,227 | ) | $ | (9,016 | ) | ||
Subscription revenue.
Subscription revenue represents the recurring subscription fees paid by our customers and recognized as revenue during the period for the use of our security-as-a-service platform, typically licensed for one to three years at a time. We consider subscription revenue to be a key business metric because it reflects the recurring aspect of our business model and is the primary driver of growth for our business over time. The consistent growth in subscription revenue over the past several years has resulted from our ongoing investment in sales and marketing personnel, our efforts to expand our customer base, and our efforts to broaden the use of our platform with existing customers.
Adjusted subscription gross profit.
We have included adjusted subscription gross profit, a non‑GAAP financial measure, in this report because it is a key measure used by our management and board of directors to understand and evaluate our operating results, core operating performance, and trends to prepare and approve our annual budget and to develop short‑ and long-term operational plans. We have provided a reconciliation between subscription gross profit, the most directly comparable GAAP financial measure, and adjusted subscription gross profit. We believe that adjusted subscription gross profit provides useful information to investors and others in understanding and evaluating our operating results in the same manner as our management and board of directors.
Our use of adjusted subscription gross profit has limitations as an analytical tool, and you should not consider it in isolation or as a substitute for analysis of our results as reported under GAAP. Because of these limitations, you should consider adjusted subscription gross profit alongside other financial performance measures, including subscription gross profit and our other GAAP results.
The following unaudited table presents the reconciliation of subscription gross profit to adjusted subscription gross profit for the years ended December 31, 2012, 2011 and 2010:
39
Year Ended December 31, | |||||||||||
2012 | 2011 | 2010 | |||||||||
(in thousands) | |||||||||||
Subscription revenue | $ | 101,470 | $ | 73,896 | $ | 57,657 | |||||
Cost of subscription revenue | 28,246 | 24,193 | 24,523 | ||||||||
Subscription gross profit | $ | 73,224 | $ | 49,703 | $ | 33,134 | |||||
Add back: | |||||||||||
Stock‑based compensation | 657 | 366 | 357 | ||||||||
Amortization of intangible assets | 2,785 | 3,772 | 3,745 | ||||||||
Adjusted subscription gross profit | $ | 76,666 | $ | 53,841 | $ | 37,236 | |||||
Billings.
We have included billings, a non‑GAAP financial measure, in this report because it is a key measure used by our management and board of directors to manage our business and monitor our near term cash flows. We have provided a reconciliation between total revenue, the most directly comparable GAAP financial measure, and billings. Accordingly, we believe that billings provides useful information to investors and others in understanding and evaluating our operating results in the same manner as our management and board of directors.
Our use of billings as a non-GAAP measure has limitations as an analytical tool, and you should not consider it in isolation or as a substitute for revenue or an analysis of our results as reported under GAAP. Some of these limitations are:
• | Billings is not a substitute for revenue, as trends in billings are not directly correlated to trends in revenue except when measured over longer periods of time; |
• | Billings is affected by a combination of factors including the timing of renewals, the sales of our solutions to both new and existing customers, the relative duration of contracts sold, and the relative amount of business derived from strategic partners. As each of these elements has unique characteristics in the relationship between billings and revenue, our billings activity is not closely correlated to revenue except over longer periods of time; and |
• | Other companies, including companies in our industry, may not use billings, may calculate billings differently, or may use other financial measures to evaluate their performance ‑ all of which reduce the usefulness of billings as a comparative measure. |
The following unaudited table presents the reconciliation of total revenue to billings for the years ended December 31, 2012, 2011 and 2010:
Year Ended December 31, | |||||||||||
2012 | 2011 | 2010 | |||||||||
(in thousands) | |||||||||||
Total revenue | $ | 106,295 | $ | 81,838 | $ | 64,790 | |||||
Deferred revenue | |||||||||||
Ending | 86,859 | 76,240 | 69,101 | ||||||||
Beginning | 76,240 | 69,101 | 57,346 | ||||||||
Net change | 10,619 | 7,139 | 11,755 | ||||||||
Billings | $ | 116,914 | $ | 88,977 | $ | 76,545 | |||||
Adjusted EBITA.
40
We define adjusted EBITDA as net loss, adjusted to exclude: depreciation, amortization of intangibles, interest income (expense), net, provision for income taxes, stock‑based compensation, acquisition‑related expense, other income, and other expense. We believe that adjusted EBITDA is useful to investors and other users of our financial statements in evaluating our operating performance because it provides them with an additional tool to compare business performance across companies and across periods. We believe that:
• | Adjusted EBITDA provides investors and other users of our financial information consistency and comparability with our past financial performance, facilitates period-to-period comparisons of operations and facilitates comparisons with our peer companies, many of which use similar non-GAAP financial measures to supplement their GAAP results; and |
• | It is useful to exclude certain non-cash charges, such as depreciation, amortization of intangible assets and stock‑based compensation and non-core operational charges, such as acquisition‑related expenses, from adjusted EBITDA because the amount of such expenses in any specific period may not be directly correlated to the underlying performance of our business operations and these expenses can vary significantly between periods as a result of new acquisitions, full amortization of previously acquired tangible and intangible assets or the timing of new stock‑based awards, as the case may be. |
We use adjusted EBITDA in conjunction with traditional GAAP operating performance measures as part of our overall assessment of our performance, for planning purposes, including the preparation of our annual operating budget, to evaluate the effectiveness of our business strategies and to communicate with our board of directors concerning our financial performance.
We do not place undue reliance on adjusted EBITDA as our only measures of operating performance. Adjusted EBITDA should not be considered as a substitute for other measures of financial performance reported in accordance with GAAP. There are limitations to using non-GAAP financial measures, including that other companies may calculate these measures differently than we do, that they do not reflect our capital expenditures or future requirements for capital expenditures and that they do not reflect changes in, or cash requirements for, our working capital.
The following unaudited table presents the reconciliation of net loss to adjusted EBITDA for the years ended December 31, 2012, 2011 and 2010:
Year Ended December 31, | |||||||||||
2012 | 2011 | 2010 | |||||||||
(in thousands) | |||||||||||
Net loss | $ | (20,360 | ) | $ | (20,141 | ) | $ | (20,865 | ) | ||
Depreciation | 4,434 | 3,142 | 3,261 | ||||||||
Amortization of intangible assets | 3,276 | 4,542 | 4,382 | ||||||||
Interest expense, net | 108 | 300 | 340 | ||||||||
Provision for income taxes | 521 | 370 | 243 | ||||||||
EBITDA | (12,021 | ) | (11,787 | ) | (12,639 | ) | |||||
Stock‑based compensation expense | 7,321 | 4,548 | 3,365 | ||||||||
Acquisition‑related expense | 3 | 125 | — | ||||||||
Other income | (18 | ) | (141 | ) | (20 | ) | |||||
Other expense | 172 | 28 | 278 | ||||||||
Adjusted EBITDA | $ | (4,543 | ) | $ | (7,227 | ) | $ | (9,016 | ) | ||
Components of Our Results of Operations
Revenue
41
We derive our revenue primarily through the license of various solutions and services on our security-as-a-service platform on a subscription basis, supplemented by the sales of training, professional services and hardware depending upon our customers' requirements.
Subscription. We license our platform and its associated solutions and services on a subscription basis. The fees are charged on a per user, per year basis. Subscriptions are typically one to three years in duration. We invoice our customers upon signing for the entire term of the contract. The invoiced amounts billed in advance are treated as deferred revenue on the balance sheet and are recognized ratably, in accordance with the appropriate revenue recognition guidelines, over the term of the contract (see —Critical Accounting Policies). We also derive a portion of our subscription revenue from the license of our solutions to strategic partners. We bill these strategic partners monthly. As our business has grown, our subscription revenue has increased as a percentage of our total revenue, from 89% of total revenue in 2010 to 95% in 2012.
Hardware and services. We provide hardware appliances as a convenience to our customers and as such it represents a small part of our business. Our solutions are designed to be implemented, configured and operated without the need for any training or professional services. For those customers that seek to develop deeper expertise in the use of our solutions or would like assistance with complex configurations or the importing of data, we offer various training and professional services. We typically invoice the customer for hardware at the time of shipment. Effective January 1, 2011, we adopted the revenue recognition guidance of Accounting Standards Update (ASU) 2009-13 and ASU 2009-14, which mandate that our revenue derived from the sale of hardware be recognized at the time of shipment. Prior to the adoption of this new accounting guidance, hardware revenue was recognized ratably over the duration of the contract. We typically invoice customers for services at the time the order is placed and recognize this revenue ratably over the term of the contract. On occasion, customers may retain us for special projects such as archiving import and export services; these types of services are recognized upon completion of the project. The revenue derived from these hardware and services offerings has declined from 11% of total revenue in 2010 to 5% of total revenue in 2012. We view this trend as favorable to our business and expect the overall proportion of revenue derived from these offerings to continue to decline gradually.
Total Cost of Revenue
Cost of Revenue
Cost of Subscription Revenue. Cost of subscription revenue primarily includes personnel costs, consisting of salaries, benefits, bonuses, and stock-based compensation, for employees who provide support services to our customers and operate our data centers. Other costs include fees paid to contractors who supplement our support and data center personnel; expenses related to the use of third-party data centers in both the United States and internationally; depreciation of data center equipment; amortization of licensing fees and royalties paid for the use of third-party technology; amortization of capitalized research and development costs; and the amortization of intangible assets related to prior acquisitions. Growth in subscription revenue generally consumes production resources, requiring us to gradually increase our cost of subscription revenue in absolute dollars as we expand our investment in data center equipment, the third party data center space required to house this equipment, and the personnel needed to manage this higher level of activity. However, our cost of subscription revenue has declined in recent periods as a percentage of its associated revenue as we have replaced third-party licensed technology with our proprietary technology, and we expect the benefit of these initiatives to continue in future periods.
Cost of Hardware and Services Revenue. Cost of hardware and services revenue includes personnel costs for employees who provide training and professional services to our customers as well as the cost of server hardware shipped to our customers that we procure from third parties and configure with our software solutions. Effective January 1, 2012, in conjunction with the adoption of the new revenue recognition guidance, the cost of hardware is expensed at the time of shipment. Prior to the adoption of this new guidance, these hardware costs were recognized ratably over the duration of the contract with which they were sold. Our cost of hardware and services as a percentage of its associated revenue has been relatively consistent from period to period in the past, but with the adoption of our new accounting guidance we expect that it may gradually increase as a percentage of hardware and services revenue in future periods.
Operating Expenses
Our operating expenses consist of research and development, sales and marketing, and general and administrative expenses. Personnel costs, which consist of salaries, benefits, bonuses, and stock-based compensation, are the most significant component of our operating expenses. Our headcount increased from 239 employees as of January 1, 2010 to 449 employees as of December 31, 2012. As a result of this growth in headcount, operating expenses have increased significantly over these
42
periods. We expect personnel costs to continue to increase in absolute dollars as we hire new employees to continue to grow our business, however, we do not anticipate that our historical rates of headcount growth will continue over the longer term.
Research and Development. Research and development expenses include personnel costs, consulting services and depreciation. Our research and development headcount increase reflects our ongoing investment in solutions developed internally as well as those added through acquisitions. We believe that these investments have played an important role in broadening the capabilities of our platform over the course of our operating history, enhancing the relevance of our solutions in the market in general and helping us to retain our customers over time. We expect to continue to devote substantial resources to research and development in an effort to continuously improve our existing solutions as well as to develop new offerings. We believe that these investments are necessary to maintain and improve our competitive position, however, over the longer term, we intend to monitor these costs so as to decrease this spending as a percentage of total revenue. Our research efforts include both software developed for our internal use on behalf of our customers as well as software elements to be used by our customers in their own facilities. To date, for software developed for internal use on behalf of our customers, we have capitalized costs of approximately $0.4 million, all of which was incurred during 2011, and is being amortized as cost of subscription revenue over a two-year period. For the software developed for use on our customers' premises, the costs associated with the development work between technological feasibility and the general availability has not been material and as such we have not capitalized any of these development costs to date.
Sales and Marketing. Sales and marketing expenses include personnel costs, sales commissions, and other costs including travel and entertainment, marketing and promotional events, public relations and marketing activities. All of these costs are expensed as incurred, including sales commissions. These costs also include amortization of intangible assets as a result of our past acquisitions. We plan to continue to invest in growing our sales and marketing operations, both domestically and internationally. Our sales personnel are typically not immediately productive, and therefore the increase in sales and marketing expenses we incur when we add new sales representatives is not immediately offset by increased revenue and may not result in increased revenue over the long-term if these new sales people fail to become productive. The timing of our hiring of new sales personnel and the rate at which they generate incremental revenue will affect our future financial performance. We expect that sales and marketing expenses will continue to increase in absolute dollars and be among the most significant components of our operating expenses.
General and Administrative. General and administrative expenses include personnel costs, consulting services, audit fees, tax services, legal expenses and other general corporate items. We expect our general and administrative expenses to increase in absolute dollars in future periods as we continue to expand our operations, hire additional personnel and transition from being a private company to a public company, although we expect these expenses to decrease as a percentage of total revenue.
Total Other Income (Expense), Net
Total other income (expense), net, consists of interest income (expense), net and other income (expense), net. Interest income (expense), net, consists primarily of interest income earned on our cash and cash equivalents offset by the interest expense for our capital lease payments and borrowings under our equipment loans. Other income (expense), net, consists primarily of the net effect of foreign currency transaction gain or loss.
Provision for Income Taxes
The provision for income taxes is related to certain state and foreign income taxes. As we have incurred operating losses in all periods to date and recorded a full valuation allowance against our deferred tax assets, we have not historically recorded a provision for federal income taxes. Realization of any of our deferred tax assets depends upon future earnings, the timing and amount of which are uncertain. Utilization of our net operating losses may be subject to substantial annual limitation due to the ownership change limitations provided by the Internal Revenue Code and similar state provisions.
Analyses have been conducted to determine whether an ownership change had occurred since inception. The analyses have indicated that although an ownership change occurred in a prior year, the net operating losses and research and development credits would not expire before utilization as a result of the ownership change. In the event the Company has subsequent changes in ownership, net operating losses and research and development credit carryovers could be limited and may expire unutilized as a result of the subsequent ownership change.
Results of Operations
The following table is a summary of our consolidated statements of operations.
43
Year Ended December 31, | |||||||||||
2012 | 2011 | 2010 | |||||||||
(in thousands) | |||||||||||
Revenue: | |||||||||||
Subscription | $ | 101,470 | $ | 73,896 | $ | 57,657 | |||||
Hardware and services | 4,825 | 7,942 | 7,133 | ||||||||
Total revenue | 106,295 | 81,838 | 64,790 | ||||||||
Cost of revenue:(1) | |||||||||||
Subscription | 28,246 | 24,193 | 24,523 | ||||||||
Hardware and services | 4,867 | 5,537 | 4,082 | ||||||||
Total cost of revenue | 33,113 | 29,730 | 28,605 | ||||||||
Gross profit | 73,182 | 52,108 | 36,185 | ||||||||
Operating expense:(1) | |||||||||||
Research and development | 24,827 | 19,779 | 17,583 | ||||||||
Sales and marketing | 55,239 | 42,676 | 31,161 | ||||||||
General and administrative | 12,693 | 9,237 | 7,465 | ||||||||
Total operating expense | 92,759 | 71,692 | 56,209 | ||||||||
Operating loss | (19,577 | ) | (19,584 | ) | (20,024 | ) | |||||
Interest income (expense), net | (108 | ) | (300 | ) | (340 | ) | |||||
Other income (expense), net | (154 | ) | 113 | (258 | ) | ||||||
Loss before provision for income taxes | (19,839 | ) | (19,771 | ) | (20,622 | ) | |||||
Provision for income taxes | (521 | ) | (370 | ) | (243 | ) | |||||
Net loss | $ | (20,360 | ) | $ | (20,141 | ) | $ | (20,865 | ) | ||
The following table sets forth our consolidated results of operations for the specified periods as a percentage of our total revenue for those periods.
44
Year Ended December 31, | ||||||||
2012 | 2011 | 2010 | ||||||
Revenue: | ||||||||
Subscription | 95 | % | 90 | % | 89 | % | ||
Hardware and services | 5 | 10 | 11 | |||||
Total revenue | 100 | 100 | 100 | |||||
Cost of revenue:(1) | ||||||||
Subscription | 27 | 30 | 38 | |||||
Hardware and services | 4 | 6 | 6 | |||||
Total cost of revenue | 31 | 36 | 44 | |||||
Gross profit | 69 | 64 | 56 | |||||
Operating expense:(1) | ||||||||
Research and development | 23 | 24 | 27 | |||||
Sales and marketing | 52 | 52 | 48 | |||||
General and administrative | 12 | 12 | 12 | |||||
Total operating expense | 87 | 88 | 87 | |||||
Operating loss | (18 | ) | (24 | ) | (31 | ) | ||
Interest income (expense), net | — | — | (1 | ) | ||||
Other income (expense), net | — | — | — | |||||
Loss before provision for income taxes | (18 | ) | (24 | ) | (32 | ) | ||
Provision for income taxes | (1 | ) | (1 | ) | — | |||
Net loss | (19 | )% | (25 | )% | (32 | )% | ||
_______________________________________________________________________________
(1) | Includes stock-based compensation and amortization of intangible assets as follows: |
Year Ended December 31, | |||||||||||
2012 | 2011 | 2010 | |||||||||
(in thousands) | |||||||||||
Stock-based compensation | |||||||||||
Cost of subscription revenue | $ | 657 | $ | 366 | $ | 357 | |||||
Cost of hardware and services revenue | 70 | 29 | 17 | ||||||||
Research and development | 1,869 | 1,247 | 1,010 | ||||||||
Sales and marketing | 3,103 | 1,976 | 1,113 | ||||||||
General and administrative | 1,622 | 930 | 868 | ||||||||
Amortization of intangible assets | |||||||||||
Cost of subscription revenue | $ | 2,785 | $ | 3,772 | $ | 3,745 | |||||
Research and development | 30 | 1 | — | ||||||||
Sales and marketing | 461 | 769 | 637 | ||||||||
Revenue
Year Ended December 31, | Change | Year Ended December 31, | Change | ||||||||||||||||||||||||||
2012 | 2011 | $ | % | 2011 | 2010 | $ | % | ||||||||||||||||||||||
(in thousands) | (in thousands) | ||||||||||||||||||||||||||||
Revenue | |||||||||||||||||||||||||||||
Subscription | $ | 101,470 | $ | 73,896 | $ | 27,574 | 37 | % | $ | 73,896 | $ | 57,657 | $ | 16,239 | 28 | % | |||||||||||||
Hardware and services | 4,825 | 7,942 | (3,117 | ) | (39 | )% | 7,942 | 7,133 | 809 | 11 | % | ||||||||||||||||||
Total revenue | $ | 106,295 | $ | 81,838 | $ | 24,457 | 30 | % | $ | 81,838 | $ | 64,790 | $ | 17,048 | 26 | % | |||||||||||||
45
Subscription revenue increased $27.6 million and $16.2 million, or 37% and 28%, for 2012 and 2011. These increases were primarily due to a $24.3 million and $12.7 million increase in revenue from the United States and, to a lesser extent, a $3.2 million and $3.5 million increase from our international operations for 2012 and 2011, respectively. We increased personnel in the sales and marketing organization, which represented a 24% and 30% increase for 2012 and 2011, respectively in the size of the team from the prior year. These new resources directly contributed to the further growth in the sales capacity of our field sales organization and were the primary reason for the 30% and 26% overall growth in revenue for 2012 and 2011 from the previous years. We believe that the fundamental shift in the overall threat landscape, the growth of business-to-business collaboration as well as the consumerization of IT, coupled with an ongoing improvement in economic conditions, led to the increase in demand for data protection and governance solutions.
Hardware and services revenue decreased $3.1 million and increased $0.8 million or (39%) and 11% for 2012 and 2011, respectively. Revenue from the United States contributed $2.7 million and international business accounted for $0.4 million of the decrease for 2012. Revenue from the United States contributed $0.7 million and international business accounted for $0.1 million of the increase for 2011. The fluctuation was attributable to our adoption of new revenue recognition guidance (as more fully described in our Critical Accounting Policies) effective January 1, 2011 under which revenue from sales of hardware appliances began to be recognized when sold.
Cost of Revenue
Year Ended December 31, | Change | Year Ended December 31, | Change | ||||||||||||||||||||||||||
2012 | 2011 | $ | % | 2011 | 2010 | $ | % | ||||||||||||||||||||||
(in thousands) | |||||||||||||||||||||||||||||
Cost of revenue | |||||||||||||||||||||||||||||
Subscription | $ | 28,246 | $ | 24,193 | $ | 4,053 | 17 | % | $ | 24,193 | $ | 24,523 | $ | (330 | ) | (1 | )% | ||||||||||||
Hardware and services | 4,867 | 5,537 | (670 | ) | (12 | )% | 5,537 | 4,082 | 1,455 | 36 | |||||||||||||||||||
Total cost of revenue | $ | 33,113 | $ | 29,730 | $ | 3,383 | 11 | % | $ | 29,730 | $ | 28,605 | $ | 1,125 | 4 | % | |||||||||||||
Cost of subscription revenue increased $4.1 million and decreased $0.3 million or 17% and (1%) for 2012 and 2011, respectively. The changes in 2012 and 2011 were primarily due to increased data center costs of $0.9 million and $0.4 million associated with ongoing growth in usage by new and existing customers. Additionally depreciation increased $0.9 million and $0.2 million in 2012 and 2011 in support of the ongoing growth. An increase in personnel related expenses of $2.4 million and $0.8 million in 2012 and 2011 attributed to both operations and customer support, due to overall growth of our business. Royalty expense decreased $.4 million and $1.8 million in 2012 and 2011, driven by the replacement of third-party licensed technology, as well as improved economic terms associated with our ongoing licensing agreements.
Cost of hardware and services revenue decreased $0.7 million and increased $1.5 million, or (12%) and 36% for 2012 and 2011, respectively. The changes in 2012 and 2011 were primarily due to the adoption of the new revenue recognition guidance effective January 1, 2011 under which costs from sales of hardware appliances were recognized when the associated hardware revenue is recognized resulted in higher hardware costs in 2011. Accordingly, a decrease of $0.4 million and an increase of $1.5 million of these costs were a result of the change in revenue recognition guidance in 2011. Additionally, a decrease of $0.9 million and $0.2 million in 2012 and 2011 in appliance costs was attributable to a decrease in corresponding revenue, offset by an increase in services expense of $0.6 million and $0.2 million in 2012 and 2011 directly correlated to an increase in services revenue during the fiscal year.
Operating Expenses
Year Ended December 31, | Change | Year Ended December 31, | Change | ||||||||||||||||||||||||||
2012 | 2011 | $ | % | 2011 | 2010 | $ | % | ||||||||||||||||||||||
(in thousands) | (in thousands) | ||||||||||||||||||||||||||||
Research and development | $ | 24,827 | $ | 19,779 | $ | 5,048 | 26 | % | $ | 19,779 | $ | 17,583 | $ | 2,196 | 12 | % | |||||||||||||
Percent of total revenue | 23 | % | 24 | % | 24 | % | 27 | % | |||||||||||||||||||||
46
Research and development expenses increased $5.1 million and 2.2 million, or 26% and 12% for 2012 and 2011, respectively. The increases were primarily due to personnel related costs of $3.5 million and $2.0 million for 2012 and 2011. Additionally, facilities costs and corporate fees both increased $0.6 million in 2012 and no such increase in 2011 primary due to the acquisition related activities in 2011.
Year Ended December 31, | Change | Year Ended December 31, | Change | ||||||||||||||||||||||||||
2012 | 2011 | $ | % | 2011 | 2010 | $ | % | ||||||||||||||||||||||
(in thousands) | |||||||||||||||||||||||||||||
Sales and marketing | $ | 55,239 | $ | 42,676 | $ | 12,563 | 29 | % | $ | 42,676 | $ | 31,161 | $ | 11,515 | 37 | % | |||||||||||||
Percent of total revenue | 52 | % | 52 | % | 52 | % | 48 | % | |||||||||||||||||||||
Sales and marketing expenses increased $12.6 million and 11.5 million, or 29% and 37%, for 2012 and 2011, respectively. The increase in headcount on a worldwide basis resulted in increased personnel related costs of $7.6 million and $6.5 million, as well as an increase in travel expenses of $1.1 million and $1.0 million in 2012 and 2011, respectively. Additionally, as our business grew, commission expense increased by $2.6 million and $1.8 million for 2012 and 2011. Marketing program spending increased $0.5 million and $1.4 million in 2012 and 2011, respectively, as a result of our continued investment in lead generation programs, tradeshows and our corporate branding programs.
Year Ended December 31, | Change | Year Ended December 31, | Change | ||||||||||||||||||||||||||
2012 | 2011 | $ | % | 2011 | 2010 | $ | % | ||||||||||||||||||||||
(in thousands) | (in thousands) | ||||||||||||||||||||||||||||
General and administrative | $ | 12,693 | $ | 9,237 | $ | 3,456 | 37 | % | $ | 9,237 | $ | 7,465 | $ | 1,772 | 24 | % | |||||||||||||
Percent of total revenue | 12 | % | 11 | % | 11 | % | 12 | % | |||||||||||||||||||||
General and administrative expenses increased $3.5 million and $1.8 million, or 37% and 24%, for 2012 and 2011, respectively. Personnel-related costs increased $2.6 million and $0.9 million for 2012 and 2011, respectively, in our transition to being a public company. Additionally, an increase of $0.8 million in both 2012 and 2011was related to external consulting fees and legal expenses.
Total Interest Income (Expense), Net
Year Ended December 31, | Change | Year Ended December 31, | Change | ||||||||||||||||||||
2012 | 2011 | $ | % | 2011 | 2010 | $ | % | ||||||||||||||||
(in thousands) | (in thousands) | ||||||||||||||||||||||
Total interest income (expense), net | (108 | ) | (300 | ) | 192 | (64 | )% | (300 | ) | (340 | ) | 40 | (12 | )% | |||||||||
Total interest income (expense), net increased $0.2 million for 2012. The change for 2012 was primarily due to an increase of $0.1 million in interest income related to investments purchased subsequent to the IPO in April 2012. Additionally, interest expense decreased $0.1 million for 2012 as we continue to pay down our capital equipment loans. The change for 2011 was immaterial.
Total Other Income (Expense), Net
Year Ended December 31, | Change | Year Ended December 31, | Change | ||||||||||||||||||||||||||
2012 | 2011 | $ | % | 2011 | 2010 | $ | % | ||||||||||||||||||||||
(in thousands) | (in thousands) | ||||||||||||||||||||||||||||
Total other income (expense), net | $ | (154 | ) | $ | 113 | $ | (267 | ) | (236 | )% | $ | 113 | $ | (258 | ) | $ | 371 | (144 | )% | ||||||||||
47
Total other income (expense), net decreased $0.3 million and increased $0.4 million for 2012 and 2011, respectively. The change was primarily related to an increase in other expense due to loss sustained from foreign currency translation and a decrease in other income related to revaluation of Series B warrant in 2011.
Provision for Income Taxes
Year Ended December 31, | Change | Year Ended December 31, | Change | ||||||||||||||||||||||||
2012 | 2011 | $ | % | 2011 | 2010 | $ | % | ||||||||||||||||||||
(in thousands) | (in thousands) | ||||||||||||||||||||||||||
Provision for income taxes | $ | 521 | $ | 370 | $ | 151 | 41 | % | 370 | 243 | $ | 127 | 52 | % | |||||||||||||
Total income tax expense increased $0.2 million and $0.1 million, or 41% and 52% for 2012 and 2011, respectively. The 2012 change was primarily related to an increase in interest and penalties on uncertain tax positions as a result of the completion of a transfer pricing analysis. The 2011 change was primarily related to an increase in uncertain tax positions.
As of December 31, 2012, due to recent net cumulative losses and other negative evidence, a valuation allowance of approximately $4.2 million remains on certain non-U.S. deferred tax assets that are not more-likely-than-not to be realized. We evaluate our deferred tax asset valuation allowance position on a quarterly basis. As a result, management believes a reversal of a significant portion of the Company's valuation allowance on non-U.S. deferred tax assets is possible in the next 12 months.
Quarterly Results of Operations
The following table sets forth our unaudited quarterly consolidated statements of operations data for each of the eight quarters in the period ended December 31, 2012. We have prepared the quarterly data on a basis consistent with our audited annual financial statements, including, in the opinion of management, all normal recurring adjustments necessary for the fair statement of the financial information contained in these statements. The historical results are not necessarily indicative of future results and should be read in conjunction with our consolidated financial statements and the related notes included elsewhere in this Annual Report on Form 10-K.
48
Three Months Ended | |||||||||||||||||||||||||||||||
Dec. 31, 2012 | Sept. 30, 2012 | June 30, 2012 | Mar. 31, 2012 | Dec. 31, 2011 | Sept. 30, 2011 | June 30, 2011 | Mar. 31, 2011 | ||||||||||||||||||||||||
(in thousands, except per share data) | |||||||||||||||||||||||||||||||
Consolidated Statements of Operations Data: | |||||||||||||||||||||||||||||||
Revenue: | |||||||||||||||||||||||||||||||
Subscription | $ | 27,460 | $ | 25,991 | $ | 24,750 | $ | 23,269 | $ | 21,363 | $ | 18,793 | $ | 17,663 | $ | 16,077 | |||||||||||||||
Hardware and services | 1,189 | 1,093 | 1,193 | 1,350 | 1,328 | 1,693 | 2,217 | 2,704 | |||||||||||||||||||||||
Total revenue | 28,649 | 27,084 | 25,943 | 24,619 | 22,691 | 20,486 | 19,880 | 18,781 | |||||||||||||||||||||||
Cost of revenue:(1) | |||||||||||||||||||||||||||||||
Subscription | 6,832 | 6,967 | 7,236 | 7,211 | 6,640 | 5,936 | 5,801 | 5,816 | |||||||||||||||||||||||
Hardware and services | 1,401 | 1,163 | 1,134 | 1,169 | 1,111 | 1,313 | 1,530 | 1,583 | |||||||||||||||||||||||
Total cost of revenue | 8,233 | 8,130 | 8,370 | 8,380 | 7,751 | 7,249 | 7,331 | 7,399 | |||||||||||||||||||||||
Gross profit | 20,416 | 18,954 | 17,573 | 16,239 | 14,940 | 13,237 | 12,549 | 11,382 | |||||||||||||||||||||||
Operating expense:(1) | |||||||||||||||||||||||||||||||
Research and development | 6,460 | 6,262 | 6,224 | 5,881 | 5,363 | 4,594 | 4,881 | 4,941 | |||||||||||||||||||||||
Sales and marketing | 15,488 | 14,126 | 13,450 | 12,175 | 12,606 | 10,779 | 9,846 | 9,445 | |||||||||||||||||||||||
General and administrative | 3,822 | 3,141 | 2,964 | 2,766 | 3,054 | 2,043 | 2,092 | 2,048 | |||||||||||||||||||||||
Total operating expense | 25,770 | 23,529 | 22,638 | 20,822 | 21,023 | 17,416 | 16,819 | 16,434 | |||||||||||||||||||||||
Operating loss | (5,354 | ) | (4,575 | ) | (5,065 | ) | (4,583 | ) | (6,083 | ) | (4,179 | ) | (4,270 | ) | (5,052 | ) | |||||||||||||||
Interest income (expense), net | 2 | (7 | ) | (43 | ) | (60 | ) | (42 | ) | (70 | ) | (112 | ) | (76 | ) | ||||||||||||||||
Other income (expense), net | (54 | ) | 109 | (178 | ) | (31 | ) | (99 | ) | (31 | ) | 94 | 149 | ||||||||||||||||||
Loss before provision for income taxes | (5,406 | ) | (4,473 | ) | (5,286 | ) | (4,674 | ) | (6,224 | ) | (4,280 | ) | (4,288 | ) | (4,979 | ) | |||||||||||||||
Provision for income taxes | (91 | ) | (119 | ) | (232 | ) | (79 | ) | (201 | ) | (33 | ) | (30 | ) | (106 | ) | |||||||||||||||
Net loss | $ | (5,497 | ) | $ | (4,592 | ) | $ | (5,518 | ) | $ | (4,753 | ) | $ | (6,425 | ) | $ | (4,313 | ) | $ | (4,318 | ) | $ | (5,085 | ) | |||||||
_______________________________________________________________________________
(1) | Includes stock-based compensation expense and amortization of intangible assets as follows: |
Three Months Ended | |||||||||||||||||||||||||||||||
Dec. 31, 2012 | Sept. 30, 2012 | June 30, 2012 | Mar. 31, 2012 | Dec. 31, 2011 | Sept. 30, 2011 | June 30, 2011 | Mar. 31, 2011 | ||||||||||||||||||||||||
(in thousands) | |||||||||||||||||||||||||||||||
Stock-based compensation: | |||||||||||||||||||||||||||||||
Cost of subscription revenue | $ | 214 | $ | 205 | $ | 109 | $ | 129 | $ | 85 | $ | 76 | $ | 107 | $ | 98 | |||||||||||||||
Cost of hardware and services revenue | 24 | 20 | 15 | 11 | 9 | 7 | 6 | 7 | |||||||||||||||||||||||
Research and development | 460 | 502 | 485 | 422 | 379 | 307 | 283 | 278 | |||||||||||||||||||||||
Sales and marketing | 801 | 830 | 820 | 651 | 558 | 511 | 478 | 429 | |||||||||||||||||||||||
General and administrative | 439 | 390 | 506 | 288 | 226 | 220 | 239 | 245 | |||||||||||||||||||||||
Total stock based compensation expenses | $ | 1,938 | $ | 1,947 | $ | 1,935 | $ | 1,501 | $ | 1,257 | $ | 1,121 | $ | 1,113 | $ | 1,057 | |||||||||||||||
Amortization of intangible assets: | |||||||||||||||||||||||||||||||
Cost of subscription revenue | $ | 333 | $ | 333 | $ | 1,019 | $ | 1,100 | $ | 963 | $ | 949 | $ | 935 | $ | 925 | |||||||||||||||
Research and development | 7 | 8 | 7 | 8 | 1 | — | — | — | |||||||||||||||||||||||
Sales and marketing | 72 | 72 | 146 | 171 | 143 | 142 | 141 | 343 | |||||||||||||||||||||||
Total amortization of intangible assets | $ | 412 | $ | 413 | $ | 1,172 | $ | 1,279 | $ | 1,107 | $ | 1,091 | $ | 1,076 | $ | 1,268 | |||||||||||||||
The following unaudited table sets forth our consolidated results of operations data as a percentage of total revenue.
49
Three Months Ended | |||||||||||||||||||||||
Dec. 31, 2012 | Sept. 30, 2012 | June 30, 2012 | Mar. 31, 2012 | Dec. 31, 2011 | Sept. 30, 2011 | June 30, 2011 | Mar. 31, 2011 | ||||||||||||||||
Consolidated Statements of Operations Data: | |||||||||||||||||||||||
Revenue: | |||||||||||||||||||||||
Subscription | 96 | % | 96 | % | 95 | % | 95 | % | 94 | % | 92 | % | 89 | % | 86 | % | |||||||
Hardware and services | 4 | 4 | 5 | 5 | 6 | 8 | 11 | 14 | |||||||||||||||
Total revenue | 100 | 100 | 100 | 100 | 100 | 100 | 100 | 100 | |||||||||||||||
Cost of revenue: | |||||||||||||||||||||||
Subscription | 24 | 26 | 28 | 29 | 29 | 29 | 29 | 31 | |||||||||||||||
Hardware and services | 5 | 4 | 4 | 5 | 5 | 7 | 8 | 8 | |||||||||||||||
Total cost of revenue | 29 | 30 | 32 | 34 | 34 | 36 | 37 | 39 | |||||||||||||||
Gross profit | 71 | 70 | 68 | 66 | 66 | 64 | 63 | 61 | |||||||||||||||
Operating expense: | |||||||||||||||||||||||
Research and development | 23 | 23 | 24 | 24 | 24 | 22 | 25 | 26 | |||||||||||||||
Sales and marketing | 54 | 52 | 52 | 50 | 56 | 53 | 50 | 51 | |||||||||||||||
General and administrative | 13 | 12 | 11 | 11 | 13 | 10 | 10 | 11 | |||||||||||||||
Total operating expense | 90 | 87 | 87 | 85 | 93 | 85 | 85 | 88 | |||||||||||||||
Operating loss | (19 | ) | (17 | ) | (19 | ) | (19 | ) | (27 | ) | (21 | ) | (22 | ) | (27 | ) | |||||||
Interest income (expense), net | — | — | — | — | — | — | — | — | |||||||||||||||
Other income (expense), net | — | — | (1 | ) | — | — | — | — | 1 | ||||||||||||||
Loss before provision for income taxes | (19 | ) | (17 | ) | (20 | ) | (19 | ) | (27 | ) | (21 | ) | (22 | ) | (26 | ) | |||||||
Provision for income taxes | — | — | (1 | ) | — | (1 | ) | — | — | (1 | ) | ||||||||||||
Net loss | (19 | )% | (17 | )% | (21 | )% | (19 | )% | (28 | )% | (21 | )% | (22 | )% | (27 | )% | |||||||
Liquidity and Capital Resources
Since our inception, we have relied principally on sales of our preferred stock to fund our operating activities. To date, we have raised $92.8 million from the sale of preferred stock. Additionally, we have utilized equipment lines to fund capital purchases and in April and May 2012, we raised net proceeds of $68.3 million in our initial public offering including proceeds from the underwriters' partial exercise of their over-allotment option.
We entered into a new equipment loan agreement with Silicon Valley Bank in April 2011 for an aggregate loan principal amount of $6.0 million. Interest on the advances is equal to the prime rate plus 0.50%. As of December 31, 2012, the interest rate on the outstanding advances was 4.50%. We had the ability to draw down on this equipment line through April 19, 2012 and no longer have the ability to draw on this equipment line. Each drawn amount is due 48 months after funding. Borrowings outstanding under the equipment loan at December 31, 2012 were $4.0 million. Equipment financed under this loan arrangement is collateralized by the respective assets underlying the loan. The terms of the loan restrict our ability to pay dividends. The loan includes a covenant that requires us to maintain cash and cash equivalents plus net accounts receivables of at least two times the amount of all outstanding indebtedness. As of December 31, 2012, we were in compliance with this financial covenant. See the notes to our consolidated financial statements for a description of our prior equipment loan.
We plan to grow our customer base by continuing to emphasize investments in sales and marketing to add new customers, expand our customers’ use of our platform, and maintain high renewal rates. We also expect to incur additional cost of subscription revenue in accordance with the resulting growth in our customer base. We believe that the combination of our ongoing improvements in gross margins, the benefits of lower sales and marketing costs associated with our renewal activity, and the fact that our contracts are structured to bill our customers in advance should enable us to improve our cash flow from operations as we grow. Based on our current level of operations and anticipated growth, both of which are expected to be consistent with recent quarters, we believe that our existing sources of liquidity will be sufficient to fund our operations for at least the next 12 months. Our future capital requirements will depend on many factors, including our rate of revenue growth, the expansion of our sales and marketing activities, and the timing and extent of spending to support product development efforts and expansion into new territories, and the timing of introductions of new features and enhancements to our solutions. To the extent that existing cash and cash equivalents and cash from operations are insufficient to fund our future activities, we may need to raise additional funds through public or private equity or debt financing. We may also seek to invest in or acquire
50
complementary businesses, applications or technologies, any of which could also require us to seek additional equity or debt financing. Additional funds may not be available on terms favorable to us or at all.
Cash Flows
The following table sets forth a summary of our consolidated cash flows for the periods indicated:
Years Ended December 31, | |||||||||||
2012 | 2011 | 2010 | |||||||||
(in thousands) | |||||||||||
Net cash provided by (used in) operating activities | $ | 6,836 | $ | (168 | ) | $ | 3,409 | ||||
Net cash provided by (used in) investing activities | (50,735 | ) | (7,353 | ) | 306 | ||||||
Net cash provided by financing activities | 73,386 | 5,201 | 1,445 | ||||||||
Net Cash Flows Provided by (Used in) Operating Activities
Our net loss and cash flows from operating activities are significantly influenced by our investments in headcount and data center operations to support anticipated growth. Our cash flows are also influenced by cash payments from customers. We invoice customers for the entire contract amount at the start of the term, and as such our cash flow from operations is also affected by the length of a customer contract.
We generated $6.8 million of cash in operating activities in 2012. The generation of cash was the result of a net loss of $20.4 million, offset by non-cash expenditures of $15.6 million, which included depreciation, amortization, provision for allowance of bad debt and stock-based compensation expense. These non-cash expenditures increased due to capital expenditure and headcount growth, primarily related to continued investment in our business. Cash used in operations was further offset by an increase in deferred revenue of $10.6 million due to sales growth and a decrease in deferred product costs of $1.3 million. The remaining use of funds was due to the net change in working capital items, most notably an increase in accounts receivable of $2.4 million due to strong sales growth, an increase of $0.9 million in prepaid expenses and other current assets, and an increase in accrued liabilities of $3.5 million related to timing of compensation, employee stock purchase plan contribution and increase in tax liability.
We used $0.2 million of cash in operating activities in 2011. This use of cash was the result of a net loss of $20.1 million, offset by non-cash expenditures of $12.4 million million, which included depreciation, amortization and stock-based compensation expense. These non-cash expenditures increased due to capital expenditure and headcount growth, primarily related to continued investment in our business. Cash used in operations was further offset by an increase in deferred revenue of $7.1 million due to sales growth and a decrease in deferred product costs of $2.8 million. The remaining use of funds was due to the net change in working capital items, most notably an increase in accounts receivable of $2.7 million due to strong sales efforts during the last quarter of the fiscal year, an increase of $0.8 million in prepaid expenses and other current assets, and an increase in accrued liabilities of $0.7 million related to timing of compensation and capital expenditures.
Cash provided by operating activities in 2010 of $3.4 million was the result of a net loss of $20.9 million, offset by non-cash expenditures of $11.4 million, which included depreciation, amortization and stock-based compensation expense, due to headcount growth and investment in the business. This was further offset by an increase in deferred revenue of $11.8 million and a decrease in deferred product costs of $1.6 million as a result of our increased sales activity. The remaining use of funds of $0.5 million was from the net change in working capital items, most notably an increase in accounts receivable of $3.1 million due to growth and timing of increased sales, and increases in accounts payable and accrued liabilities of $1.0 million and $1.8 million respectively, related to timing of royalty, inventory, data center obligations, and employee compensation accruals.
Net Cash Flows Provided by (Used in) Investing Activities
Our primary investing activities have consisted of capital expenditures in support of expanding our infrastructure and workforce and the purchase and sale of short-term investments. As our business grows, we expect our capital expenditures and our investment activity to continue to increase.
51
We used $50.7 million of cash in investing activities during 2012. This was primarily due to purchases of short term investments of $60.1 million with proceeds generated from our initial public offering, offset by net proceeds of $15.3 million from sales and maturities of short-term investments. In addition, we used $5.9 million to purchase equipment for infrastructure expansion. These expenditures were primarily for replacement and upgrade of equipment to lower the cost of deployment as well as to improve the efficiency for our cloud‑based architecture.
We used $7.4 million of cash in investing activities during 2011. This was primarily from the net purchase of $2.3 million in short-term investments. In addition, we used $4.9 million to purchase equipment for infrastructure expansion. These expenditures were primarily for replacement and upgrade of equipment to lower the cost of deployment as well as to improve the efficiency for our cloud-based architecture.
Investing activities in 2010 resulted in net proceeds of $0.3 million. This was primarily from $3.7 million of net proceeds from short-term investments, offset by $3.4 million of equipment purchases used for infrastructure expansion and other fixed assets.
Net Cash Flows Provided by (Used in) Financing Activities
Cash provided by financing activities in 2012 was $73.4 million. This was primarily related to proceeds from our initial public offering, net of offering costs, of $68.3 million. Contributions also included $6.1 million of proceeds from the exercise of stock options, partially offset by $1.0 million in repayments under our equipment financing loans.
Cash provided by financing activities in 2011 was $5.2 million. This consisted of $1.2 million of proceeds from the exercise of stock options and borrowings under our new equipment line of $4.9 million during this period, partially offset by repayments under our equipment financing loans of $0.2 million and $0.7 million in earn-out payments.
Cash provided by financing activities in 2010 was $1.4 million. This consisted of proceeds from sales our Series F preferred stock financing of $1.5 million along with $1.2 million from the exercise of employee stock options, partially offset by repayment of equipment financing loans of $0.5 million and $0.8 million towards earn-out payments.
Contractual Obligations and Commitments
Our principal commitments consist of obligations under our outstanding leases for our office space and third-party data centers as well as equipment leases and loans for certain computer and office equipment. The following table summarizes our contractual obligations as of December 31, 2012 (in thousands):
Payment Due By Period | |||||||||||||||||||
Contractual Obligations | Total | Less Than 1 Year | 1-3 Years | 3-5 Years | More Than 5 Years | ||||||||||||||
Debt obligations(1) | $ | 3,968 | $ | 1,642 | $ | 2,326 | $ | — | $ | — | |||||||||
Interest expense payments(2) | 226 | 146 | 80 | — | — | ||||||||||||||
Capital and operating lease obligations(3) | 4,234 | 1,818 | 1,980 | 436 | — | ||||||||||||||
Purchase obligations(4) | 2,256 | 1,924 | 332 | — | — | ||||||||||||||
Total | $ | 10,684 | $ | 5,530 | $ | 4,718 | $ | 436 | $ | — | |||||||||
_______________________________________________________________________________
(1) | Represents our outstanding debt under our equipment loan, including the loan and equipment agreement commencing April 2011. |
(2) | Represents interest payments on our outstanding debt under our equipment loan, including the loan and equipment agreement commencing April 2011. |
(3) | Consists of capital leases and contractual obligations under operating leases for office space, including the new facility lease commencing December 2012 and June 2013. |
(4) | Consists of purchase obligations for servers and similar equipment to support our third-party data centers. |
We entered into a new equipment loan agreement with Silicon Valley Bank in April 2011 for an aggregate loan principal amount of $6.0 million. For more information about our equipment loan agreement please see "Liquidity and Capital Resources."
52
In March 2011, we entered into a lease agreement to occupy an additional 23,121 square feet of office space at our headquarters facility. The lease term is 39 months for 74,338 square feet in the aggregate, with a monthly rental of $74,338 commencing on April 1, 2011, and expiring on June 30, 2014.
In November 2012, we entered into a lease agreement to occupy 22,216 square feet of office space at our Canada facility. The lease term is 36 months with a monthly rental approximately $37,000 commencing on December 1, 2012, and expiring on November 30, 2015.
In December 2012, we entered into an amendment to the lease agreement to occupy an additional 3,202 square feet of office space at our Utah facility. The lease is 48 months for 18,532 square feet in the aggregate, with a monthly rent approximately $24,000 commencing on June 1, 2013 and expiring on May 31, 2017.
We have recorded a liability for sales and use taxes. A variety of factors could affect the liability, which factors include recovery of amounts from customers and any changes in relevant statutes in the various states in which we have done business. To the extent that the actual amount of our liabilities for sales and use taxes materially differs from the amount we have recorded on our consolidated balance sheet, our future results of operations and cash flows could be negatively affected.
As of December 31, 2012, the amount of cash and cash equivalents held by our foreign subsidiaries was $11.7 million, including intercompany receivable balances. If these funds were needed for our operations in the United States, we would be required to withhold foreign taxes on the funds repatriated of approximately $0.5 million. We have provided an insignificant amount (less than $0.1 million) for these taxes in accordance with ASC 740-30-25, as it is our intention that these funds are permanently reinvested outside the United States and our current plans do not demonstrate a need to repatriate these funds to our United States operations.
Under the indemnification provisions of our standard customer agreements, we agree to indemnify, defend and hold harmless our customers against, among other things, infringement of any patents, trademarks or copyrights under any country's laws or the misappropriation of any trade secrets arising from the customer's legal use of our solutions. Certain indemnification provisions potentially expose us to losses in excess of the aggregate amount paid to us by the customer under the applicable customer agreement. No material claims have been made against us pursuant to these indemnification provisions to date.
Off-Balance Sheet Arrangements
During the periods presented, we did not have, nor do we currently have, any relationships with unconsolidated entities or financial partnerships, such as entities often referred to as structured finance or special purpose entities, which would have been established for the purpose of facilitating off-balance sheet arrangements or other contractually narrow or limited purposes. We are therefore not exposed to any financing, liquidity, market or credit risk that could arise if we had engaged in those types of relationships.
Item 7A. QUANTITATIVE AND QUALITATIVE DISCLOSURES ABOUT MARKET RISK
We have operations both within the United States and internationally, and we are exposed to market risks in the ordinary course of our business. These risks primarily include interest rate, foreign exchange and inflation risks, as well as risks relating to changes in the general economic conditions in the countries where we conduct business. To reduce certain of these risks, we monitor the financial condition of our large clients and limit credit exposure by collecting in advance and setting credit limits as we deem appropriate. In addition, our investment strategy has been to invest in financial instruments that are highly liquid and readily convertible into cash with maturity dates within three months from the date of purchase. To date, we have not used derivative instruments to mitigate the impact of our market risk exposures. We have also not used, nor do we intend to use, derivatives for trading or speculative purposes.
Interest Rate Risk
We are exposed to market risk related to changes in interest rates. Our investments are considered cash equivalents and primarily consist of money market funds, corporate debt securities and a certificate of deposit. As of December 31, 2012, we had cash, cash equivalents, and short-term investments of $86.5 million. The carrying amount of our cash equivalents and short-term investments reasonably approximates fair value, due to the short maturities of these investments. The primary objectives of our investment activities are the preservation of capital, the fulfillment of liquidity needs and the fiduciary control of cash and investments. We do not enter into investments for trading or speculative purposes. Our investments are exposed to market risk due to a fluctuation in interest rates, which may affect our interest income and the fair market value of our investments. Due to the short-term nature of our investment portfolio, we believe only dramatic fluctuations in interest rates
53
would have a material effect on our investments. As such we do not expect our operating results or cash flows to be materially affected by a sudden change in market interest rates.
As of December 31, 2012 we had borrowings outstanding with principal amounts of $4.0 million. Our outstanding long-term borrowings consist of fixed and variable interest rate financial instruments. The interest rates of our borrowings range from 2.9% to 10.6%. A hypothetical 10% increase or decrease in interest rates relative to our current interest rates would not have a material impact on the fair values of all of our outstanding borrowings. Changes in interest rates would, however, affect operating results and cash flows, because of the variable rate nature of our borrowings. A hypothetical 10% increase or decrease in interest rates relative to interest rates at December 31, 2012 would result in an insignificant impact to interest expense for 2013.
Foreign Currency Risk
Our sales to international customers are generally U.S. dollar-denominated. As a result, there are no significant foreign currency gains or losses related to these transactions. The functional currency for our wholly owned foreign subsidiaries is the U.S. dollar. Accordingly, the subsidiaries remeasure monetary assets and liabilities at period-end exchange rates, while nonmonetary items are remeasured at historical rates. Income and expense accounts are remeasured at the average exchange rates in effect during the year. Remeasurement adjustments are recognized in the statement of operations as foreign currency transaction gains or losses in the year of occurrence. Aggregate foreign currency transaction gain (losses) included in determining net loss were ($0.2 million), $8,000 and ($0.2 million) for 2012, 2011 and 2010, respectively. Transaction gains and losses are included in other income (expense), net.
As our international operations grow, our risks associated with fluctuation in currency rates will become greater, and we will continue to reassess our approach to managing this risk. In addition, currency fluctuations or a weakening U.S. dollar can increase the costs of our international expansion. To date, we have not entered into any foreign currency hedging contracts, since exchange rate fluctuations have not had a material impact on our operating results and cash flows. Based on our current international structure, we do not plan on engaging in hedging activities in the near future.
Inflation Risk
We do not believe that inflation has had a material effect on our business, financial condition or results of operations. Nonetheless, if our costs were to become subject to significant inflationary pressures, we may not be able to fully offset such higher costs through price increases. Our inability or failure to do so could harm our business, financial condition and results of operations.
Critical Accounting Policies
Our management's discussion and analysis of our financial condition and results of operations are based on our consolidated financial statements, which have been prepared in accordance with GAAP. GAAP requires us to make certain estimates and judgments that can affect the reported amounts of assets and liabilities as of the dates of the consolidated financial statements, the disclosure of contingencies as of the dates of the consolidated financial statements, and the reported amounts of revenue and expenses during the periods presented. We base our estimates on historical experience and on various other assumptions that we believe to be reasonable under the circumstances, the results of which form the basis for making judgments about the carrying values of assets and liabilities. If actual results or events differ materially from those contemplated by us in making these estimates, our reported financial condition and results of operations for future periods could be materially affected. See "Risk Factors" for certain matters that may affect our future financial condition or results of operations. An accounting policy is deemed to be critical if it requires an accounting estimate to be made based on assumptions about matters that are uncertain at the time the estimate is made, if different estimates reasonably could have been used, or if the changes in estimate that are reasonably likely to occur could materially impact the financial statements. Our management has discussed the development, selection and disclosure of these estimates with the audit committee of our board of directors.
Our significant accounting policies, including those considered to be critical accounting policies, are summarized in “Note 1 - The Company and Summary of Significant Accounting Policies” to the accompanying consolidated financial statements in this report. The following critical accounting policies reflect significant judgments and estimates used in the preparation of our consolidated financial statements:
• | Revenue recognition and deferred revenue; |
• | Stock-based compensation; |
54
• | Allowance for doubtful accounts; |
• | Capitalized software costs; |
• | Impairment of long lived assets; and |
• | Income taxes. |
Revenue Recognition and Deferred Revenue
We derive our revenue primarily from two sources: (1) subscription revenue for rights related to the use of our security-as-a-service platform and (2) hardware, training, and professional services revenue provided to customers related to their use of our platform. Subscription revenue is derived from a subscription-based enterprise licensing model with contract terms typically ranging from one to three years, and consists of (i) subscription fees from the licensing of our security-as-a-service platform, (ii) subscription fees for access to the on-demand elements of our platform and (iii) subscription fees for the right to access our customer support services.
We apply the provision of Accounting Standard Codification (ASC) 985-605, "Software Revenue Recognition," and related interpretations, to all transactions involving the licensing of software, as well as related support, training, and other professional services. ASC 985-605 requires revenue earned on software arrangements involving multiple elements such as software license, support, training, and other professional services to be allocated to each element based on the relative fair values of these elements. The fair value of an element must be based on vendor-specific objective evidence (VSOE) of fair value. VSOE of fair value of each element is based on the price charged when the element is sold separately. Revenue is recognized when all of the following criteria are met as set forth in ASC 985-605:
• | Persuasive evidence of an arrangement exists; |
• | Delivery has occurred; |
• | The fee is fixed or determinable; and |
• | Collectability is probable. |
We have analyzed all of the elements included in our multiple element arrangements and have determined that we do not have sufficient VSOE of fair value to allocate revenue to our subscription and software license agreements, support, training, and professional services. We defer all revenue under the arrangement until the commencement of the subscription services and any associated professional services. Once the subscription services and the associated professional services have commenced, the entire fee from the arrangement is recognized ratably over the remaining period of the arrangement. If the professional services are essential to the functionality of the subscription, then the revenue recognition does not commence until such services are completed.
Our hosted on-demand service agreements do not provide customers with the right to take possession of the software supporting the hosted service. We recognize revenue from our on-demand services in accordance with ASC 605-20, and as such recognize revenue when the following criteria are met:
• | Persuasive evidence of an arrangement exists; |
• | Delivery of our obligations to our customers has occurred; |
• | Collection of the fees is probable; and |
• | The amount of fees to be paid by the customer is fixed or determinable. |
In October 2009, the Financial Accounting Standards Board (FASB) amended the accounting guidance for multiple element arrangements (ASU 2009-13) to:
• | Provide updated guidance on whether multiple deliverables exist, how the deliverables in an arrangement should be separated, and how the arrangement consideration should be allocated among its elements; |
55
• | Require an entity to allocate revenue in an arrangement that has separate units of accounting using best estimated selling price (BESP) of deliverables if a vendor does not have VSOE of fair value or third-party evidence of selling price (TPE); and |
• | Eliminate the use of the residual method and require an entity to allocate revenue using the relating selling price method to the separate unit of accounting. |
Concurrently, the FASB amended the accounting guidance for revenue recognition (ASU 2009-14) to exclude hardware appliances containing software components and hardware components that function together to deliver the hardware appliance's essential functionality from the scope of the software revenue recognition guidance of ASC 985-605.
Prior to the adoption of ASU 2009-14, revenue derived from hardware appliance sales were recognized based on the software revenue recognition guidance. We could not establish VSOE of fair value for the undelivered elements in the arrangement, and therefore the entire fee from the arrangement was recognized ratably over the contractual term of the agreement. In addition, we were unable to establish VSOE of fair value of our hosted on-demand service agreements, and therefore the entire fee for the agreement was recognized ratably over the contractual term of the agreement.
As a result of the adoption of this new accounting guidance, revenue derived from our subscription services and hardware appliance sales are no longer subject to industry-specific software revenue recognition guidance. For all arrangements within the scope of the new guidance, including our hosted on-demand services, we evaluate each element in a multiple element arrangement to determine whether it represents a separate unit of accounting. An element constitutes a separate unit of accounting when the delivered item has standalone value and delivery of the undelivered element is probable and within our control. Revenue derived from the licensing of the security-as-a-service platform continues to be accounted for in accordance with the industry specific revenue recognition guidance.
When we are unable to establish the selling price of our non-software deliverables using VSOE or TPE, we use BESP in our allocation of arrangement consideration. The objective of BESP is to determine the price at which we would transact a sale if the product or service were sold on a stand-alone basis. We determine BESP for an individual element within a multiple element revenue arrangement using the same methods utilized to determine the selling price of an element sold on a standalone basis. We estimate the selling price for our subscription solutions by considering internal factors such as historical pricing practices and we estimate the selling price of our hardware and services using a combination of our historical costs paired with external measurements regarding the pricing of similar products and services in similar industries. As there is a significant amount of judgment when determining BESP, we regularly review all of our assumptions and inputs around BESP and maintain internal controls over the establishment and updates of these estimates.
Hardware appliance revenue is recognized upon shipment. Subscription and support revenue are recognized over the contract period commencing on the start date of the contract. Professional services and training, when sold with hardware appliances or subscription and support services, are accounted for separately when those services have standalone value. In determining whether professional services and training services can be accounted for separately from subscription and support services, we consider the following factors: availability of the services from other vendors, the nature of the services, and the dependence of the subscription services on the customer's decision to buy the professional services. If professional services and training do not qualify for separate accounting, we recognize the professional services and training ratably over the contract term of the subscription services.
Delivery generally occurs when the hardware appliance is delivered to a common carrier freight on board shipping point by us or the hosted service has been activated and communicated to the customer accordingly. Our fees are typically considered to be fixed or determinable at the inception of an arrangement and are negotiated at the outset of an arrangement, generally based on specific products and quantities to be delivered. In the event payment terms are provided that differ significantly from our standard business practices, the fees are deemed to not be fixed or determinable and revenue is recognized as the fees become paid.
We assess collectability based on a number of factors, including credit worthiness of the customer and past transaction history of the customer. Through December 31, 2012, we have not experienced any significant credit losses.
We elected to adopt this new guidance in the first quarter of 2011 for new and materially modified revenue arrangements originating after January 1, 2011. Prior to the adoption of this new accounting guidance, hardware revenue was recognized ratably over the duration of the contract. Accordingly, as of December 31, 2010, our deferred revenue balance reflected amounts yet to be recognized under our then-current accounting practices. These deferred amounts will continue to be recognized ratably under their original amortization schedules until the end of the associated contract term. As such, until the
56
end of these contract periods, we will recognize hardware revenue both from sales in prior periods subject to the original accounting guidance as well as from sales in current periods subject to the new accounting guidance, with the principal impact being in 2011 and to a lesser extent 2012 and future periods. Given the marginal contribution toward profitability of our hardware appliances, we do not expect this transition to contribute materially toward our profitability.
Stock-Based Compensation
Effective January 1, 2006, we adopted ASC 718, which requires non-public companies that used the minimum value method under ASC 718 for either recognition or pro forma disclosures to apply ASC 718 using the prospective-transition method. In accordance with ASC 718, we recognize the compensation cost of employee stock-based awards granted subsequent to December 31, 2005 in the statement of operations using the straight-line method over the vesting period of the award.
The following table set for the stock-based compensation expense included in the related consolidated financial statement line items:
Years Ended December 31, | |||||||||||
2012 | 2011 | 2010 | |||||||||
(in thousands) | |||||||||||
Stock-based compensation: | |||||||||||
Cost of subscription revenue | $ | 657 | $ | 366 | $ | 357 | |||||
Cost of hardware and services revenue | 70 | 29 | 17 | ||||||||
Research and development | 1,869 | 1,247 | 1,010 | ||||||||
Sales and marketing | 3,103 | 1,976 | 1,113 | ||||||||
General and administrative | 1,622 | 930 | 868 | ||||||||
We estimated the fair value of each option granted using the Black-Scholes option pricing model using the following assumptions for the periods presented in the table below:
Year Ended December 31, | |||||
2012 | 2011 | 2010 | |||
Estimated volatility | 59% - 60% | 59%-61% | 60%-61% | ||
Estimated dividend yield | —% | —% | —% | ||
Expected term (years) | 5.50 - 6.08 | 5.85 - 6.08 | 6 - 6.08 | ||
Risk-free rate | 0.9% - 1.2% | 1.2%-2.5% | 1.8%-2.8% | ||
As of each stock option grant date, we considered the fair value of the underlying common stock, determined as described below, in order to establish the options exercise price.
As our common stock has been publicly traded less than a year, and therefore a lack of company-specific historical and implied volatility data, we have determined the share price volatility for options granted based on an analysis of reported data for a peer group of companies that granted options with substantially similar terms. We analyzed a population of possible comparable companies and selected those for our peer group that we considered to be the most comparable to us in terms of industry business model, revenue, growth and gross profit margins. The expected volatility of options granted has been determined using an average of the historical volatility measures of this peer group of companies for a period equal to the expected life of the option. We intend to continue to consistently apply this process using the same or similar entities until a sufficient amount of historical information regarding the volatility of our own share price becomes available, or unless circumstances change such that the identified entities are no longer similar to us. In this latter case, more suitable entities whose share prices are publicly available would be utilized in the calculation.
The expected life of options granted has been determined utilizing the "simplified" method as permitted by the SEC. The risk-free interest rate is based on a daily treasury yield curve rate whose term is consistent with the expected life of the stock options. We have not, historically, paid and, in the future, do not anticipate paying cash dividends on our shares of common stock and therefore, the expected dividend yield is assumed to be zero.
57
In addition, ASC 718 requires forfeitures to be estimated at the time of grant and revised, if necessary, in subsequent periods if actual forfeitures differ from those estimates. We apply an estimated forfeiture rate based on our historical forfeiture experience.
Prior to our IPO, we have historically granted stock options at exercise prices no less than the fair market value as determined by our board of directors, with input from management and a third-party valuation firm.
We used a third-party valuation firm to assist us with the development of contemporaneous valuations. Our board of directors determined the fair value of our common stock on the date of grant based on a number of factors including:
• | Our performance, growth rate and financial condition at the approximate time of the option grant; |
• | The value of companies that we consider peers based on a number of factors including, but not limited to, |
similarity to us with respect to industry, business model, stage of growth, financial risk or other factors;
• | Changes in the company and our prospects since the last time the board approved option grants and made a determination of fair value; |
• | Amounts recently paid by investors for our common stock and convertible preferred stock in arm's-length transactions with stockholders; |
• | The rights, preferences and privileges of preferred stock relative to those of our common stock; |
• | Future financial projections; and |
• | Valuations completed in conjunction with, and at the time of, each option grant. |
For our valuations we calculated the enterprise value by applying both the market approach and the income approach. In the market approach the valuations and outcomes of comparable peer companies in the public market were reviewed. The income approach consists of a discounted cash flow analysis. The methodology we use derives equity values utilizing a probability-weighted expected return method. Under this approach, various potential liquidity events are identified and each possible outcome is assigned a probability based on discussion with our management. For each of the possible events, a range of future equity values is estimated based on both the market and income approaches where applicable, applying various possible dates for each event. The timing of these events is based on discussion with our management. For each future equity liquidity value scenario, the rights and preferences of each stockholder class are considered in order to determine the appropriate allocation of value to common shares. The value of each common share is then multiplied by a discount factor derived from the calculated discount rate and the expected timing of the event. The value per common share, taking into account sensitivities to the timing of the event, is then multiplied by an estimated probability for each of the possible events. The calculated value per common share under a private company scenario is then discounted for a lack of marketability. A probability-weighted value per share of common stock is then determined. Under this approach, the value of our common stock is estimated based upon an analysis of values for our common stock assuming the following various possible future events for the company, including initial public offering, strategic merger or sale, remaining a private company, and dissolution of the business with no resulting value to common stockholders.
Allowance for Doubtful Accounts
We assess collectability based on a number of factors, including credit worthiness of the customer along with past transaction history; in addition, we perform periodic evaluations of our customers' financial condition. Credit losses historically have not been material, which is directly attributable to our subscription-based services model, enabling us to immediately discontinue the availability of the services in question in the event of non-payment. Through December 31, 2012, we have not experienced any significant credit losses.
Capitalized Software Costs
Our research and development efforts include both software created for our internal use on behalf of our customers as well as software elements to be used by our customers in their own facilities. As such, we consider both ASC 350-40 and ASC 985-20 when accounting for our research and development costs.
ASC 350-40, Internal-Use Software, contains the following provisions: (1) Preliminary project costs are expensed as incurred; (2) All costs associated with the development of the application are to be capitalized; and (3) All costs associated with
58
the post-implementation operation of the software shall be expenses as incurred. As well, the costs for all upgrades and enhancements to the originally developed software may be capitalized if additional functionality is added. Accordingly, we capitalize certain software development costs, including the costs to develop new solutions or significant enhancements to existing solutions, which are developed or obtained for internal use. We capitalize software development costs when application development begins, it is probable that the project will be completed, and the software will be used as intended. Such capitalized costs are amortized on a straight-line basis over the estimated useful life of the related asset, which is generally two years. Costs associated with preliminary project stage activities, training, maintenance and all post implementation stage activities are expensed as incurred. To date in 2012, we have capitalized costs of approximately $0.4 million in aggregate under ASC 350-40.
ASC 985-20, Costs of Software to be Sold, Leased, or Marketed, contains the following provisions: (1) all costs to establish the technological feasibility shall be expensed when incurred; (2) costs of producing product masters incurred subsequent to establishing technological feasibility shall be capitalized; and (3) capitalization of computer software costs shall cease when the product is available for general release to customers. Accordingly, software development costs related to software services to be distributed and sold are capitalized once technological feasibility has been established and prior to the general availability of the solution, with amortization determined for each individual solution based on the solution's expected economic life. For all development projects subject to this accounting guidance, the costs to establish technological feasibility have been expensed as incurred. To date, all costs subsequent to technological feasibility but prior to general availability have not been material and as such we have not capitalized any costs associated with projects subject to ASC 985-20. All costs subsequent to general availability have been expensed as incurred.
Impairment of Long Lived Assets
In accordance with ASC 360, Property, Plant, and Equipment, we evaluate long-lived assets, such as property and equipment and intangible assets other than goodwill, for impairment whenever events or changes in circumstances indicate that the carrying value of an asset may not be recoverable. Recoverability of these assets is measured by comparison of the carrying amount of the asset to the future undiscounted cash flows the asset is expected to generate. If the asset is considered to be impaired, the amount of any impairment is measured as the difference between the carrying value and the fair value of the impaired asset. No assets were determined to be impaired to date.
Income Taxes
We account for income taxes in accordance with authoritative guidance, which requires the use of the asset and liability method. Under this method, deferred income tax assets and liabilities are determined based on the difference between the consolidated financial statement carrying amounts and the tax basis of assets and liabilities and are measured using the enacted tax rates expected to apply to taxable income in the years in which differences are expected to be reversed. We record net deferred tax assets to the extent we believe these assets will more likely than not be realized. In making such determination, we consider all available positive and negative evidence, including future reversals of existing taxable temporary differences, projected future taxable income, tax planning strategies and recent financial operations.
We have elected to use the "with and without" approach as described in ASC 740-20, Intraperiod Tax Allocation, in determining the order in which tax attributes are utilized. As a result, we will only recognize a tax benefit from stock-based awards in additional paid-in capital if an incremental tax benefit is realized after all other tax attributes currently available to us have been utilized. In addition, we have elected to account for the impact of stock-based awards on other tax attributes, such as the research tax credit, through the consolidated statement of operations.
On January 2, 2013, the President signed into law The American Taxpayer Relief Act of 2012. Under prior law, a taxpayer was entitled to a research tax credit for qualifying amounts paid or incurred on or before December 31, 2011. The American Taxpayer Relief Act of 2012 extends the research credit for two years to December 31, 2013. The extension of the research credit is retroactive and includes amounts paid or incurred after Dec. 31, 2011. The impact will be considered in the period of enactment, which is the first quarter of 2013, but will not create a financial statement benefit due to the Company's valuation allowance in the United States.
Recent Accounting Pronouncements
See "Note 1 - The Company and Summary of Significant Accounting Policies" to the consolidated financial statements included in this report, regarding the impact of certain recent accounting pronouncements on our consolidated financial statements.+
59
ITEM 8. FINANCIAL STATEMENTS AND SUPPLEMENTARY DATA
The information in response to this item is included in our consolidated financial statements, together with the report thereon of PricewaterhouseCoopers LLP, appearing on pages F-1 through F-32 of this Form 10-K, and in Item 7 under the heading Management's Discussion and Analysis of Financial Condition and Results of Operations.
ITEM 9. CHANGES IN AND DISAGREEMENTS WITH ACCOUNTANTS ON ACCOUNTING AND FINANCIAL DISCLOSURE
None.
ITEM 9A. CONTROLS AND PROCEDURES
Evaluation of Disclosure Controls and Procedures
Regulations under the Securities Exchange Act of 1934, or the Exchange Act, require public companies, including us, to maintain “disclosure controls and procedures,” which are defined in Rule 13a-15(e) and Rule 15d-15(e) to mean a company’s controls and other procedures that are designed to ensure that information required to be disclosed in the reports that it files or submits under the Exchange Act is recorded, processed, summarized and reported, within the time periods specified in the SEC’s rules and forms. Disclosure controls and procedures include, without limitation, controls and procedures designed to ensure that information required to be disclosed in our reports filed under the Exchange Act is accumulated and communicated to management, including our principal executive officer and principal financial officer, or persons performing similar functions, as appropriate to allow timely decisions regarding required or necessary disclosures. In designing and evaluating our disclosure controls and procedures, management recognizes that disclosure controls and procedures, no matter how well conceived and operated, can provide only reasonable, not absolute, assurance that the objectives of the disclosure controls and procedures are met. Additionally, in designing disclosure controls and procedures, our management necessarily was required to apply its judgment in evaluating the cost-benefit relationship of possible disclosure controls and procedures. Our chief executive officer and chief financial officer have concluded, based on the evaluation of the effectiveness of the disclosure controls and procedures by our management as of December 31, 2012, that our disclosure controls and procedures were effective for this purpose.
Changes in Internal Controls
Regulations under the Exchange Act require public companies, including our company, to evaluate any change in our “internal control over financial reporting” as such term is defined in Rule 13a-15(f) and Rule 15d-15(f) of the Exchange Act. In connection with their evaluation of our disclosure controls and procedures as of the end of the period covered by this Annual Report, our Chief Executive Officer and Chief Financial Officer did not identify any change in our internal control over financial reporting during the most recent fiscal quarter that materially affected, or is reasonably likely to materially affect, our internal control over financial reporting.
Management's annual Report on Internal control over Financial Reporting
This Annual Report on Form 10-K does not include a report of management's assessment regarding internal control over financial reporting or an attestation report of our registered public accounting firm as permitted in this transition period under the rules of the SEC for newly public companies.
ITEM 9B. OTHER INFORMATION
Not applicable.
60
PART III
ITEM 10. DIRECTORS, EXECUTIVE OFFICERS AND CORPORATE GOVERNANCE
The information required by this item concerning our directors, executive officers, Section 16 compliance and corporate governance matters will be set forth under the headings "Directors and Executive Officers" and "Section 16(a) Beneficial Ownership compliance" in the definitive Proxy Statement for our 2013 Annual Meeting of Stockholders (the "Proxy Statement") and is incorporated into this report by reference.
ITEM 11. EXECUTIVE COMPENSATION
The information required by this item regarding related party transactions and director independence will be set forth under the headings “Executive Compensation" in the Proxy Statement and is incorporated into this report by reference.
ITEM 12. SECURITY OWNERSHIP OF CERTAIN BENEFICIAL OWNERS AND MANAGEMENT AND RELATED STOCKHOLDER MATTERS
The information required by this item regarding related party transactions and director independence will be set forth under the headings “Security Ownership of Certain Beneficial Owners and Management" in the Proxy Statement and is incorporated into this report by reference.
ITEM 13. CERTAIN RELATIONSHIPS AND RELATED TRANSACTIONS, AND DIRECTOR INDEPENDENCE
The information required by this item regarding related party transactions and director independence will be set forth under the headings “Board of Directors and Committees of the Board", “Related Party Transactions" in the Proxy Statement and is incorporated into this report by reference.
ITEM 14. PRINCIPAL ACCOUNTING FEES AND SERVICES
The information required by this item regarding related party transactions and director independence will be set forth under the headings “Ratification of Appointment of Independent Registered Public Accounting Firm" in the Proxy Statement and is incorporated into this report by reference.
61
PART IV
ITEM 15. EXHIBITS, FINANCIAL STATEMENT SCHEDULES
(a)
(1) Financial Statements
The list of consolidated financial statements and schedules set forth in the accompanying Index to the Consolidated Financial Statements at page F-1 of this annual report is incorporated herein by reference. Such consolidated financial statements and schedules are filed as part of this annual report.
(2) Financial Statement Schedules
The schedule required by this item is included in Note 4 to the Consolidated Financial Statements. All other financial statement schedules are not required or are inapplicable and therefore have been omitted.
(b)
(3) Exhibits
The exhibits listed on the accompanying Index to Exhibits in Item 15(b) below are filed or incorporated by reference as part of this annual report on Form 10-K. See Exhibit Index immediately following the Signature Pages.
62
INDEX TO CONSOLIDATED FINANCIAL STATEMENTS
Page | |
Consolidated Statements of Comprehensive Loss | |
63
REPORT OF INDEPENDENT REGISTERED PUBLIC ACCOUNTING FIRM
To the Board of Directors and Stockholders of Proofpoint, Inc.
In our opinion, the accompanying consolidated balance sheets and the related consolidated statements of operations, comprehensive loss, changes in convertible preferred stock and stockholders' equity (deficit) and cash flows present fairly, in all material respects, the financial position of Proofpoint, Inc. and its subsidiaries (the "Company") at December 31, 2012 and 2011, and the results of their operations and their cash flows for each of the three years in the period ended December 31, 2012 in conformity with accounting principles generally accepted in the United States of America. These financial statements are the responsibility of the Company's management. Our responsibility is to express an opinion on these financial statements based on our audits. We conducted our audits of these statements in accordance with the standards of the Public Company Accounting Oversight Board (United States). Those standards require that we plan and perform the audit to obtain reasonable assurance about whether the financial statements are free of material misstatement. An audit includes examining, on a test basis, evidence supporting the amounts and disclosures in the financial statements, assessing the accounting principles used and significant estimates made by management, and evaluating the overall financial statement presentation. We believe that our audits provide a reasonable basis for our opinion.
As discussed in Note 1 of the financial statements, the Company changed the manner in which it accounts for revenue recognition related to multiple element arrangements in 2011.
/s/ PricewaterhouseCoopers LLP
San Jose, California
March 8, 2013
The accompanying notes are an integral part of these consolidated financial statements.
F-1
Proofpoint, Inc.
Consolidated Balance Sheets
(in thousands, except per share amounts)
At December 31, | |||||||
2012 | 2011 | ||||||
Assets | |||||||
Current assets | |||||||
Cash and cash equivalents | $ | 39,254 | $ | 9,767 | |||
Short-term investments | 47,263 | 2,947 | |||||
Accounts receivable, net of allowance for doubtful accounts of $187 and $233 at December 2012 and 2011 | 18,115 | 15,789 | |||||
Inventory | 567 | 729 | |||||
Deferred product costs, current | 1,184 | 1,803 | |||||
Prepaid expenses and other current assets | 3,491 | 2,556 | |||||
Total current assets | 109,874 | 33,591 | |||||
Property and equipment, net | 8,560 | 7,353 | |||||
Deferred product costs, noncurrent | 326 | 987 | |||||
Goodwill | 18,557 | 18,557 | |||||
Intangible assets, net | 2,913 | 6,189 | |||||
Other noncurrent assets | 211 | 1,275 | |||||
Total assets | $ | 140,441 | $ | 67,952 | |||
Liabilities, Convertible Preferred Stock and Stockholders' Equity (Deficit) | |||||||
Current liabilities | |||||||
Accounts payable | $ | 2,496 | $ | 3,504 | |||
Accrued liabilities | 12,078 | 10,061 | |||||
Notes payable and lease obligations | 1,658 | 467 | |||||
Deferred rent | 462 | 517 | |||||
Deferred revenue | 62,642 | 52,836 | |||||
Total current liabilities | 79,336 | 67,385 | |||||
Notes payable and lease obligations, noncurrent | 2,354 | 4,514 | |||||
Other long term liabilities, noncurrent | 726 | 85 | |||||
Deferred revenue, noncurrent | 24,217 | 23,404 | |||||
Total liabilities | 106,633 | 95,388 | |||||
Commitments and contingencies (Note 7) | |||||||
Convertible preferred stock (Note 9), $0.0001 par value— no shares authorized, issued and outstanding as of December 31, 2012 and 39,424 shares authorized, 38,942 shares issued and outstanding at December 31, 2011, net of issuance costs and liquidation preference of $110,338 | — | 109,911 | |||||
Stockholders' equity (deficit) | |||||||
Preferred stock, $0.0001 par value; 5,000 shares authorized; no shares issued and outstanding at December 31, 2012; no shares authorized, issued and outstanding at December 31, 2011 | — | — | |||||
Common stock, $0.0001 par value—200,000 and 71,400 shares authorized at December 31, 2012 and 2011, respectively; 33,044 and 4,961 shares outstanding at December 31, 2012 and 2011, respectively | 3 | 1 | |||||
Additional paid-in capital | 216,280 | 24,773 | |||||
Accumulated other comprehensive income (loss) | 3 | (3 | ) | ||||
Accumulated deficit | (182,478 | ) | (162,118 | ) | |||
Total stockholders' equity (deficit) | 33,808 | (137,347 | ) | ||||
Total liabilities, convertible preferred stock, and stockholders' equity (deficit) | $ | 140,441 | $ | 67,952 | |||
The accompanying notes are an integral part of these consolidated financial statements.
F-2
Proofpoint, Inc.
Consolidated Statements of Operations
(in thousands, except per share amounts)
Year Ended December 31, | |||||||||||
2012 | 2011 | 2010 | |||||||||
Revenue: | |||||||||||
Subscription | $ | 101,470 | $ | 73,896 | $ | 57,657 | |||||
Hardware and services | 4,825 | 7,942 | 7,133 | ||||||||
Total revenue | 106,295 | 81,838 | 64,790 | ||||||||
Cost of revenue:(1)(2) | |||||||||||
Subscription | 28,246 | 24,193 | 24,523 | ||||||||
Hardware and services | 4,867 | 5,537 | 4,082 | ||||||||
Total cost of revenue | 33,113 | 29,730 | 28,605 | ||||||||
Gross profit | 73,182 | 52,108 | 36,185 | ||||||||
Operating expense:(1)(2) | |||||||||||
Research and development | 24,827 | 19,779 | 17,583 | ||||||||
Sales and marketing | 55,239 | 42,676 | 31,161 | ||||||||
General and administrative | 12,693 | 9,237 | 7,465 | ||||||||
Total operating expense | 92,759 | 71,692 | 56,209 | ||||||||
Operating loss | (19,577 | ) | (19,584 | ) | (20,024 | ) | |||||
Interest income (expense), net | (108 | ) | (300 | ) | (340 | ) | |||||
Other income (expense), net | (154 | ) | 113 | (258 | ) | ||||||
Loss before provision for income taxes | (19,839 | ) | (19,771 | ) | (20,622 | ) | |||||
Provision for income taxes | (521 | ) | (370 | ) | (243 | ) | |||||
Net loss | $ | (20,360 | ) | $ | (20,141 | ) | $ | (20,865 | ) | ||
Net loss per share, basic and diluted | (0.85 | ) | (5.03 | ) | (5.84 | ) | |||||
Weighted average shares outstanding, basic and diluted | 24,056 | 4,005 | 3,575 | ||||||||
(1) Includes stock-based compensation expense as follows: | |||||||||||
Cost of subscription revenue | $ | 657 | $ | 366 | $ | 357 | |||||
Cost of hardware and services revenue | 70 | 29 | 17 | ||||||||
Research and development | 1,869 | 1,247 | 1,010 | ||||||||
Sales and marketing | 3,103 | 1,976 | 1,113 | ||||||||
General and administrative | 1,622 | 930 | 868 | ||||||||
(2) Includes intangible amortization expense as follows: | |||||||||||
Cost of subscription revenue | $ | 2,785 | $ | 3,772 | $ | 3,745 | |||||
Research and development | 30 | 1 | — | ||||||||
Sales and marketing | 461 | 769 | 637 | ||||||||
The accompanying notes are an integral part of these consolidated financial statements.
F-3
Proofpoint, Inc.
Consolidated Statements of Comprehensive Loss
(In thousands)
Year Ended December 31, | |||||||||||
2012 | 2011 | 2010 | |||||||||
Net loss | $ | (20,360 | ) | $ | (20,141 | ) | $ | (20,865 | ) | ||
Other comprehensive income (loss), before tax and net of reclassification adjustments: | |||||||||||
Unrealized gains (losses) on investments, net | 6 | (3 | ) | 1 | |||||||
Other comprehensive income (loss), before tax | 6 | (3 | ) | 1 | |||||||
Tax benefit (provision) related to items of other comprehensive income (loss) | — | — | — | ||||||||
Other comprehensive income (loss), net tax | 6 | (3 | ) | 1 | |||||||
Comprehensive loss | $ | (20,354 | ) | $ | (20,144 | ) | $ | (20,864 | ) | ||
See accompanying Notes to the Consolidated Financial Statements.
F-4
Proofpoint, Inc.
Consolidated Statements of Changes in Convertible Preferred Stock and Stockholders' Equity (Deficit)
(in thousands)
Convertible Preferred Stock | Common Stock | Additional Paid-In Capital | Deferred Share-Based Compensation | Accumulated Other Comprehensive Income (Loss) | Accumulated Deficit | Total Stockholders' Deficit | ||||||||||||||||||||||||||
Shares | Amount | Shares | Amount | |||||||||||||||||||||||||||||
Balances at December 31, 2009 | 38,611 | 108,329 | 3,299 | 1 | 8,970 | — | (1 | ) | (121,112 | ) | (112,142 | ) | ||||||||||||||||||||
Net loss | — | — | — | — | — | — | — | (20,865 | ) | (20,865 | ) | |||||||||||||||||||||
Unrealized gain (loss) on short-term investments | — | — | — | — | — | — | 1 | 1 | ||||||||||||||||||||||||
Issuance of Series F preferred stock for cash, net of issuance costs of $9 | 282 | 1,491 | — | — | — | — | — | — | — | |||||||||||||||||||||||
Stock-based compensation expense | — | — | — | — | 3,365 | — | — | — | 3,365 | |||||||||||||||||||||||
Stock options exercised | — | — | 530 | — | 1,231 | — | — | — | 1,231 | |||||||||||||||||||||||
Vesting of early exercise options | — | — | — | — | 9 | — | — | — | 9 | |||||||||||||||||||||||
Balances at December 31, 2010 | 38,893 | 109,820 | 3,829 | 1 | 13,575 | — | — | (141,977 | ) | (128,401 | ) | |||||||||||||||||||||
Net loss | — | — | — | — | — | — | — | (20,141 | ) | (20,141 | ) | |||||||||||||||||||||
Unrealized gain (loss) on short-term investments | — | — | — | — | — | — | (3 | ) | — | (3 | ) | |||||||||||||||||||||
Issuance of Series B preferred stock upon net exercise of warrants | 49 | 91 | — | — | — | — | — | — | — | |||||||||||||||||||||||
Issuance of common stock as part of the consideration for acquisitions | — | — | 677 | — | 5,406 | — | — | — | 5,406 | |||||||||||||||||||||||
Fair value of vested restricted stock units assumed in connection with acquisition | — | — | — | — | 58 | — | — | — | 58 | |||||||||||||||||||||||
Stock-based compensation expense | — | — | — | — | 4,548 | — | — | — | 4,548 | |||||||||||||||||||||||
Stock options exercised | — | — | 456 | — | 1,178 | — | — | — | 1,178 | |||||||||||||||||||||||
Repurchase of stock options | — | — | (1 | ) | — | (4 | ) | — | — | — | (4 | ) | ||||||||||||||||||||
Vesting of early exercise options | — | — | — | 12 | — | — | — | 12 | ||||||||||||||||||||||||
Balances at December 31, 2011 | 38,942 | 109,911 | 4,961 | 1 | 24,773 | — | (3 | ) | (162,118 | ) | (137,347 | ) | ||||||||||||||||||||
Net loss | — | — | — | — | — | — | — | (20,360 | ) | $ | (20,360 | ) | ||||||||||||||||||||
Unrealized gain (loss) on short-term investments | — | — | — | — | — | — | 6 | — | $ | 6 | ||||||||||||||||||||||
Issuance of common stock in April 2012 initial public offering at $13.00 per share, net of issuance costs of $7,879 | — | — | 5,860 | 1 | 68,294 | — | — | — | $ | 68,295 | ||||||||||||||||||||||
Conversion of preferred stock into shares of common stock | (38,942 | ) | (109,911 | ) | 19,567 | 1 | 109,910 | — | — | — | $ | 109,911 | ||||||||||||||||||||
Stock-based compensation expense | — | — | — | — | 7,321 | — | — | — | $ | 7,321 | ||||||||||||||||||||||
Stock options exercised | — | — | 2,543 | — | 4,946 | — | — | — | $ | 4,946 | ||||||||||||||||||||||
Issuance of common stock in connection with vested restricted stock units assumed with acquisition | — | — | 21 | — | — | — | — | — | $ | — | ||||||||||||||||||||||
Restricted stock withholding taxes net-settlement | — | — | (7 | ) | — | (83 | ) | — | — | — | $ | (83 | ) | |||||||||||||||||||
Issuance of common stock under employee stock purchase plan | — | — | 99 | — | 1,093 | — | — | — | $ | 1,093 | ||||||||||||||||||||||
Vesting of early exercise options | — | — | — | — | 26 | — | — | — | $ | 26 | ||||||||||||||||||||||
Balances at December 31, 2012 | — | $ | — | 33,044 | $ | 3 | $ | 216,280 | — | $ | 3 | $ | (182,478 | ) | $ | 33,808 | ||||||||||||||||
The accompanying notes are an integral part of these consolidated financial statements.
F-5
Proofpoint, Inc.
Consolidated Statements of Cash Flows
(in thousands)
Year Ended | |||||||||||
December 31, | |||||||||||
2012 | 2011 | 2010 | |||||||||
Cash flows from operating activities | |||||||||||
Net loss | $ | (20,360 | ) | $ | (20,141 | ) | $ | (20,865 | ) | ||
Adjustments to reconcile net loss to net cash provided by (used in) operating activities | |||||||||||
Depreciation and amortization | 7,710 | 7,684 | 7,643 | ||||||||
Gain (loss) on disposal of property and equipment | — | — | (11 | ) | |||||||
Accretion of investments | 520 | — | — | ||||||||
Provision for allowance for doubtful accounts | 54 | 8 | 44 | ||||||||
Stock issued for services | — | — | 29 | ||||||||
Stock-based compensation | 7,321 | 4,548 | 3,365 | ||||||||
Change in fair value of warrant liability | — | (66 | ) | 73 | |||||||
Change in fair value of contingent earn-outs | — | 208 | 297 | ||||||||
Changes in assets and liabilities, net of effect of acquisitions: | |||||||||||
Accounts receivable | (2,380 | ) | (2,702 | ) | (3,116 | ) | |||||
Inventory | 162 | (144 | ) | 348 | |||||||
Deferred products costs | 1,280 | 2,779 | 1,610 | ||||||||
Prepaid expenses and other current assets | (934 | ) | (778 | ) | (250 | ) | |||||
Noncurrent assets | 97 | 168 | (43 | ) | |||||||
Accounts payable | (683 | ) | 300 | 1,001 | |||||||
Accrued liabilities | 3,485 | 722 | 1,759 | ||||||||
Earn-out payment(1) | — | (285 | ) | (220 | ) | ||||||
Deferred rent | (55 | ) | 447 | (10 | ) | ||||||
Deferred revenue | 10,619 | 7,084 | 11,755 | ||||||||
Net cash provided by (used in) operating activities | 6,836 | (168 | ) | 3,409 | |||||||
Cash flows from investing activities | |||||||||||
Proceeds from sales and maturities of short-term investments | 15,264 | 2,791 | 5,149 | ||||||||
Purchase of short-term investments | (60,095 | ) | (5,080 | ) | (1,418 | ) | |||||
Purchase of property and equipment, net | (5,904 | ) | (4,930 | ) | (3,425 | ) | |||||
Acquisitions of business (net of cash acquired) | — | (134 | ) | — | |||||||
Net cash provided by (used in) investing activities | (50,735 | ) | (7,353 | ) | 306 | ||||||
Cash flows from financing activities | |||||||||||
Proceeds from issuance of common stock, net of repurchases | 6,060 | 1,199 | 1,211 | ||||||||
Proceeds from issuance of convertible preferred stock, net of repurchases and issuance costs | — | — | 1,491 | ||||||||
Proceeds from initial public offering, net of offering costs | 68,295 | — | — | ||||||||
Proceeds from equipment financing loans | — | 4,925 | — | ||||||||
Repayments of equipment financing loans | (969 | ) | (208 | ) | (477 | ) | |||||
Earn-out payment(1) | — | (715 | ) | (780 | ) | ||||||
Net cash provided by financing activities | 73,386 | 5,201 | 1,445 | ||||||||
Net increase (decrease) in cash and cash equivalents | 29,487 | (2,320 | ) | 5,160 | |||||||
Cash and cash equivalents | |||||||||||
Beginning of period | 9,767 | 12,087 | 6,927 | ||||||||
End of period | $ | 39,254 | $ | 9,767 | $ | 12,087 | |||||
Supplemental disclosures of cash flow information | |||||||||||
Cash paid for interest | $ | 49 | $ | 97 | $ | 63 | |||||
Cash paid for taxes | 370 | 210 | 206 | ||||||||
Supplemental disclosure of noncash investing and financing activities | |||||||||||
Common stock issued in connection with acquisition | — | 5,406 | $ | — | |||||||
Fair value of vested restricted stock units assumed in connection with acquisition | — | 58 | — | ||||||||
Issuance of Series B preferred stock upon net exercise of warrants | — | 91 | — | ||||||||
Unpaid deferred initial public offering costs | — | 967 | — | ||||||||
Unpaid purchase of property and equipment | 659 | 931 | 136 | ||||||||
(1) | The consolidated statement of cash flows for the year ended December 31, 2010 has been revised to reflect the correction of an immaterial error related to the classification of an earn-out payment in the consolidated statements of cash flows. |
The accompanying notes are an integral part of these consolidated financial statements.
F-6
Proofpoint, Inc.
Notes to Consolidated Financial Statements
(dollars and share amounts in thousands, except per share amounts)
1. The Company and Summary of Significant Accounting Policies
The Company
Proofpoint, Inc. (the "Company") was incorporated in Delaware in June 2002 and is headquartered in California.
Proofpoint is a pioneering security-as-a-service vendor that enables large and mid-sized organizations worldwide to defend, protect, archive and govern their most sensitive data. The Company's security-as-a-service platform is comprised of a number of data protection solutions, including threat protection, regulatory compliance, archiving and governance, and secure communication.
Reverse Stock Split
On March 30, 2012, the Company's Board of Directors approved a 1-for-2 reverse stock split of the Company's common stock. The reverse stock split became effective on April 2, 2012. Upon the effectiveness of the reverse stock split, (i) every two shares of outstanding common stock was decreased to one share of common stock, (ii) the number of shares of common stock into which each outstanding option to purchase common stock is exercisable was proportionally decreased on a 1-for-2 basis, (iii) the exercise price of each outstanding option to purchase common stock was proportionately increased on a 1-for-2 basis, and (iv) the conversion ratio for each share of preferred stock outstanding was proportionately reduced on a 1-for-2 basis. All of the share numbers, share prices, and exercise prices have been retrospectively adjusted to reflect the reverse stock split.
Principles of Consolidation
The consolidated financial statements include the accounts of the Company and its wholly-owned subsidiaries. All intercompany transactions and balances have been eliminated in consolidation.
In 2011, we acquired GFI Software Ltd. and NextPage, Inc. The consolidated financial statements include the results of operations from these business combinations from their date of acquisition. Additional disclosure related to the acquisition is provided in Note 2, "Acquisitions."
Use of Estimates
The preparation of financial statements in conformity with accounting principles generally accepted in the United States of America requires management to make estimates and assumptions that affect the reported amounts of assets and liabilities and disclosure of contingent assets and liabilities at the date of the financial statements, and the reported amounts of expenses during the reporting period. Actual results could differ from those estimates and such difference may be material to the financial statements.
Foreign Currency Remeasurement and Transactions
The Company's sales to international customers are generally U.S. dollar-denominated. As a result, there are no significant foreign currency gains or losses related to these transactions. The functional currency for the Company's wholly-owned foreign subsidiaries is the U.S. dollar. Accordingly, the subsidiaries remeasure monetary assets and liabilities at period-end exchange rates, while nonmonetary items are remeasured at historical rates. Income and expense accounts are remeasured at the average exchange rates in effect during the year. Remeasurement adjustments are recognized in the consolidated statement of operations as transaction gains or losses within other income (expense), net, in the period of occurrence. Aggregate transaction gain (losses) included in determining net loss were $(157), $8 and $(187) for the years ended December 31, 2012, 2011 and 2010, respectively.
Cash, Cash Equivalents and Short-term Investments
F-7
Proofpoint, Inc.
Notes to Consolidated Financial Statements (Continued)
(dollars and share amounts in thousands, except per share amounts)
The Company considers all highly liquid instruments purchased with an original maturity date of 90 days or less from the date of purchase to be cash equivalents. Cash equivalents consist of money market funds and certain types of commercial paper. Cash and cash equivalents were $39,254 and $9,767 as of December 31, 2012 and 2011, respectively. Short-term investments consist of readily marketable securities with maturity dates within three months from the date of purchase and include certain types of commercial paper, corporate bonds, debt securities and certificates of deposit. Short-term investments were $47,263 and $2,947 as of December 31, 2012 and 2011, respectively, and all were classified as available-for-sale and were carried at fair value, with unrealized gains and losses reported as a component of accumulated other comprehensive income (loss). Realized gains and losses are included in “other income (expense), net.” Fair value is estimated based on available market information. The cost of securities sold is based on the specific identification method.
Inventories
Inventories are stated at lower of cost or market value, with costs computed on a first-in, first-out basis. Cost is determined using standard costs which approximate actual costs. The Company periodically reviews its inventories for excess and obsolete items and adjusts carrying costs to estimated net realizable values when they are determined to be less than cost.
Inventories held at December 31, 2012 and 2011 consist of finished goods.
Revenue Recognition
The Company derives its revenue primarily from two sources: (1) subscription revenue for rights related to the use of the security-as-a-service platform and (2) hardware, training and professional services revenue provided to customers related to their use of the platform. Subscription revenue is derived from a subscription‑based enterprise licensing model with contract terms typically ranging from one to three years, and consist of (i) subscription fees from the licensing of the security-as-a-service platform, (ii) subscription fees for access to the on-demand elements of the platform and (iii) subscription fees for the right to access the Company’s customer support services.
The Company applies the provision of ASC 985-605, “Software Revenue Recognition,” and related interpretations, to all transactions involving the licensing of software, as well as related support, training, and other professional services. ASC 985-605 requires revenue earned on software arrangements involving multiple elements such as software license, support, training and other professional services to be allocated to each element based on the relative fair values of these elements. The fair value of an element must be based on vendor‑specific objective evidence (“VSOE”) of fair value. VSOE of fair value of each element is based on the price charged when the element is sold separately. Revenue is recognized when all of the following criteria are met as set forth in ASC 985-605:
• | Persuasive evidence of an arrangement exists, |
• | Delivery has occurred, |
• | The fee is fixed or determinable, and |
• | Collectability is probable. |
The Company has analyzed all of the elements included in its multiple element arrangements and has determined that it does not have sufficient VSOE of fair value to allocate revenue to its subscription and software license agreements, support, training, and professional services. The Company defers all revenue under the software arrangement until the commencement of the subscription services and any associated professional services. Once the subscription services and the associated professional services have commenced, the entire fee from the arrangement is recognized ratably over the remaining period of the arrangement. If the professional services are essential to the functionality of the subscription, then the revenue recognition does not commence until such services are completed.
In the consolidated statement of operations, revenue is categorized as "subscription" and "hardware and services." Although the Company is unable to separate its multiple elements under the applicable revenue recognition guidance since it does not have sufficient VSOE of fair value for revenue recognition purposes, the Company has used a systematic and rational estimate to classify revenue between "subscription" and "hardware and services." For presentation purposes only, the Company
F-8
Proofpoint, Inc.
Notes to Consolidated Financial Statements (Continued)
(dollars and share amounts in thousands, except per share amounts)
allocates revenue to hardware and services based upon management's best estimate of fair value of such deliverables using a cost plus model. The remaining consideration of the arrangement is then allocated to subscription services. Management believes that this methodology provides a reasonable basis to allocate revenue between subscription and hardware and services for presentation purposes.
The hosted on-demand service agreements do not provide customers with the right to take possession of the software supporting the hosted service. The Company recognizes revenue from its hosted on-demand services in accordance with ASC 605-20, and as such recognizes revenue when the following criteria are met:
• | Persuasive evidence of an arrangement exists, |
• | Delivery of the Company’s obligations to its customers has occurred, |
• | Collection of the fees is probable, and |
• | The amount of fees to be paid by the customer is fixed or determinable. |
In October 2009, the FASB amended the accounting guidance for multiple element arrangements (“ASU 2009-13”) to:
• | Provide updated guidance on whether multiple deliverables exist, how the deliverables in an arrangement should be separated, and how the arrangement consideration should be allocated among its elements; |
• | Require an entity to allocate revenue in an arrangement that has separate units of accounting using best estimated selling price (“BESP”) of deliverables if a vendor does not have VSOE of fair value or third-party evidence of selling price (“TPE”), and |
• | Eliminate the use of the residual method and require an entity to allocate revenue using the relative selling price method to the separate unit of accounting. |
Concurrently, the FASB amended the accounting guidance for revenue recognition (“ASU 2009-14”) to exclude hardware appliances containing software components and hardware components that function together to deliver the hardware appliance’s essential functionality from the scope of the software revenue recognition guidance of ASC 985-605.
The Company elected to adopt this new guidance in the first quarter of fiscal 2011 for new and materially modified revenue arrangements originating after January 1, 2011.
Prior to the adoption of ASU 2009-14, revenue derived from hardware appliance sales were recognized based on the software revenue recognition guidance. The Company could not establish VSOE of fair value for the undelivered elements in the arrangement, and therefore the entire fee from the arrangement was recognized ratably over the contractual term of the agreement. In addition, the Company was unable to establish VSOE of fair value of its hosted on-demand service agreements, and therefore the entire fee for the agreement was recognized ratably over the contractual term of the agreement.
As a result of the adoption of this accounting guidance, revenue derived from our subscription services and hardware appliance sales are no longer subject to industry‑specific software revenue recognition guidance. For all arrangements within the scope of these new accounting pronouncements, including the Company’s hosted on-demand services, the Company evaluates each element in a multiple element arrangement to determine whether it represents a separate unit of accounting. An element constitutes a separate unit of accounting when the delivered item has standalone value and delivery of the undelivered element is probable and within the Company’s control. Revenue derived from the licensing of the security-as-a-service platform continues to be accounted for in accordance with the industry specific revenue recognition guidance.
Hardware appliance revenue is recognized upon shipment. Subscription and support revenue are recognized over the contract period commencing on the start date of the contract. Professional services and training, when sold with hardware
F-9
Proofpoint, Inc.
Notes to Consolidated Financial Statements (Continued)
(dollars and share amounts in thousands, except per share amounts)
appliances or subscription and support services, are accounted for separately when those services have standalone value. In determining whether professional services and training services can be accounted for separately from subscription and support services, the Company considers the following factors: availability of the services from other vendors, the nature of the services, and the dependence of the subscription services on the customer’s decision to buy the professional services. If professional services and training do not qualify for separate accounting, the Company recognizes the professional services and training ratably over the contract term of the subscription services.
Delivery generally occurs when the hardware appliance is delivered to a common carrier freight on board shipping point by the Company or the hosted service has been activated and communicated to the customer accordingly. The Company’s fees are typically considered to be fixed or determinable at the inception of an arrangement and are negotiated at the outset of an arrangement, generally based on specific products and quantities to be delivered. In the event payment terms are provided that differ significantly from the Company's standard business practices, the fees are deemed to not be fixed or determinable and revenue is recognized as the fees become paid.
The Company assesses collectability based on a number of factors, including credit worthiness of the customer and past transaction history of the customer. Through December 31, 2012, the Company has not experienced significant credit losses.
Deferred Revenue
Deferred revenue primarily consists of billings or payments received in advance of revenue recognition from the sale of the Company’s subscription fees, training and professional services. Once the revenue recognition criteria are met, this revenue is recognized ratably over the term of the associated contract, which typically ranges from 12 to 36 months.
Deferred Product Costs
Deferred product costs are the incremental costs that are directly associated with each noncancelable customer contract or hosting agreement and primarily consist of cost of appliances and royalty payments made to third parties, from whom the Company has obtained licenses to integrate certain software into its products. The costs are deferred and amortized over the noncancelable term of the related customer contract or hosting agreement, which typically range from 12 to 36 months.
Software Development Costs
We capitalize certain software development costs, including the costs to develop new software solutions or significant enhancements to existing solutions, which are developed or obtained for internal use. We capitalize software development costs when application development begins, it is probable that the project will be completed, and the software will be used as intended. Such capitalized costs are amortized on a straight-line basis over the estimated useful life of the related asset, which is generally two years. Costs associated with preliminary project stage activities, training, maintenance and all post implementation stage activities are expensed as incurred.
Software development costs related to software services to be sold are capitalized when technological feasibility has been established. Amortization of capitalized software development costs will begin as each product is available for general release to customers. Amortization will be computed on an individual solution basis for those solutions available for market and will be recognized based on the solution's economic life. Because the Company believes its current process for developing software is essentially completed concurrently with the establishment of technology feasibility. Costs associated with the development work between technological feasibility and the general availability has not been material and as such we have not capitalized any development costs to date.
Property and Equipment
Property and equipment are stated at cost. Depreciation is computed using the straight-line method over the estimated useful life of the related asset, which is generally one to three years. Amortization of leasehold improvements is computed using the straight-line method over the shorter of the lease term or the estimated useful life of the asset or improvement. Cost of maintenance and repairs that do not improve or extend the lives of the respective assets are expensed as incurred. When
F-10
Proofpoint, Inc.
Notes to Consolidated Financial Statements (Continued)
(dollars and share amounts in thousands, except per share amounts)
property and equipment are retired or otherwise disposed of, the cost and related accumulated depreciation are removed from the balance sheet and the resulting gain or loss is included in other income (expense), net.
Impairment of Long-Lived Assets
In accordance with ASC 360, "Property, Plant, and Equipment," the Company evaluates long-lived assets, such as property and equipment, including intangible assets other than goodwill, for impairment whenever events or changes in circumstances indicate that the carrying value of an asset may not be recoverable. Recoverability of these assets is measured by comparison of the carrying amount of the asset to the future undiscounted cash flows the asset is expected to generate. If the asset is considered to be impaired, the amount of any impairment is measured as the difference between the carrying value and the fair value of the impaired asset. No assets were determined to be impaired to date.
Advertising and Promotion Costs
Expenses related to advertising and promotion of solutions is charged to sales and marketing expense as incurred. The Company did not incur any significant advertising and promotion expenses during the years ended December 31, 2012, 2011 and 2010, respectively.
Goodwill and Intangible Assets
Goodwill represents the excess of the purchase price of the acquired enterprise over the fair value of identifiable assets acquired and liabilities assumed. The Company applies ASC 350, "Intangibles—Goodwill and Other," and performs an annual goodwill impairment test during the fourth quarter of the Company's fiscal year and more frequently if an event or circumstance indicates that an impairment may have occurred. For the purposes of impairment testing, the Company has determined that it has one reporting unit. A two-step impairment test of goodwill is required pursuant to ASC 350-20-35. In the first step, the fair value of the reporting unit is compared to its carrying value. If the fair value exceeds the carrying value, goodwill is not impaired and further testing is not required. If the carrying value exceeds the fair value, then the second step of the impairment test is required to determine the implied fair value of the reporting unit's goodwill. The implied fair value of goodwill is calculated by deducting the fair value of all tangible and intangible net assets of the reporting unit, excluding goodwill, from the fair value of the reporting unit as determined in the first step. If the carrying value of the reporting unit's goodwill exceeds its implied fair value, then an impairment loss must be recorded that is equal to the difference. The identification and measurement of goodwill impairment involves the estimation of the fair value of the Company. The estimate of fair value of the Company, based on the best information available as of the date of the assessment, is subjective and requires judgment, including management assumptions about expected future revenue forecasts and discount rates. No impairment to the carrying value of goodwill was identified by the Company during the years ended December 31, 2012, 2011 and 2010.
Intangible assets consist of developed technology, vendor relationships and customer relationships. The values assigned to intangibles are based on estimates and judgments regarding expectations for success and life cycle of solutions and technologies acquired.
Intangible assets are amortized on a straight-line basis over their estimated lives, which approximate the pattern in which the economic benefits of the intangible assets are consumed, as follows:
Developed technology | 4 years |
Customer relationships | 4 years |
Vendor relationships | 4 years |
Fair Value of Financial Instruments
The carrying amounts of certain of the Company's cash equivalents, accounts receivable, accounts payable and accrued liabilities approximate their fair values due to their short maturities. Based on borrowing rates that are available to the Company for loans with similar terms and consideration of the Company's credit risk, the carrying value of the note payable approximates its fair value.
F-11
Proofpoint, Inc.
Notes to Consolidated Financial Statements (Continued)
(dollars and share amounts in thousands, except per share amounts)
Warranty
The Company provides limited warranties on all sales and provides for the estimated cost of the warranties at the date of sale, to the extent not already provided by its own vendors. The estimated cost of warranties has not been material to date.
Income Taxes
The Company accounts for income taxes in accordance with authoritative guidance, which requires use of the asset and liability method. Under this method, deferred income tax assets and liabilities are determined based on the difference between the consolidated financial statement carrying amounts and the tax basis of assets and liabilities and are measured using the enacted tax rates expected to apply to taxable income in the years in which the differences are expected to be reversed.
The Company records net deferred tax assets to the extent the Company believes these assets will more likely than not be realized. In making such determination, the Company considers all available positive and negative evidence, including future reversals of existing taxable temporary differences, projected future taxable income, tax planning strategies and recent financial operations.
The Company has elected to use the "with and without" approach as described in ASC 740-20, "Intraperiod Tax Allocation," in determining the order in which tax attributes are utilized. As a result, the Company will only recognize a tax benefit from stock-based awards in additional paid-in capital if an incremental tax benefit is realized after all other tax attributes currently available to the Company have been utilized. In addition, the Company has elected to account for the impact of stock-based awards on other tax attributes, such as the research tax credit, through the consolidated statement of operations.
The Company recognizes interest and penalties related to uncertain tax positions within the income tax expense line in the accompanying consolidated statement of operations. Accrued interest and penalties are included within the related tax liability line in the consolidated balance sheet.
Employee Benefit Plans
The Company sponsors a 401(k) defined contribution plan covering all employees. The Company may make discretionary contributions to the 401(k). To date, no contributions have been made by the Company.
Stock-Based Compensation
The Company accounts for stock-based compensation under ASC 718, "Compensation—Stock Compensation" using the prospective transition method prescribed for private companies. Using the prospective transition method, compensation expense recognized includes the compensation cost for all share-based payment awards granted to employees subsequent to December 31, 2005, based on the grant-date fair value estimated in accordance with the provisions of ASC 718. The Company uses the Black-Scholes option pricing model to determine the fair value of stock options. Stock compensation expense is recognized on a straight-line basis over the requisite service period of the award, which generally equals the vesting period.
Under ASC 718, the Company is required to estimate potential forfeitures of stock grants and adjust compensation cost recorded accordingly. The estimate of forfeitures is computed based on historical data of employee turnover and is adjusted over the requisite service period to the extent that actual forfeitures differ, or are expected to differ, from the prior estimates. Changes in estimated forfeitures are recognized in the period of change and will impact the amount of stock compensation expenses to be recognized in future periods.
Stock-based compensation expense recognized is shown in the operating activities section of the consolidated statements of cash flows. In addition, ASC 718 requires the cash flows resulting from the tax benefits due to tax deductions on stock option exercises in excess of the stock-based compensation expense recognized (excess tax benefits) to be classified in the financing activities section of the consolidated statements of cash flows. During the years ended December 31, 2012, 2011 and 2010, the Company did not recognize any excess tax benefits.
The Company accounts for stock options issued to non-employees in accordance with the provisions of ASC 505-50 using a fair-value approach. The measurement of stock-based compensation for non-employees is subject to periodic adjustments as the options vest, and the expense is recognized over the period over which services are received. stock-based compensation expense for non-employees has not been material for all periods presented.
F-12
Proofpoint, Inc.
Notes to Consolidated Financial Statements (Continued)
(dollars and share amounts in thousands, except per share amounts)
Comprehensive Income (Loss)
Comprehensive income (loss) includes all changes in equity that are not the result of transactions with stockholders. The Company’s comprehensive income (loss) consists of its net loss and changes in unrealized gains (losses) from its available-for-sale investments. The Company adopted guidance issued by the FASB amending the presentation of the Statement of Comprehensive Income. The amended guidance eliminates the current option to report other comprehensive income and its components of other comprehensive income as part of the statement of changes in stockholders’ equity. In addition, it gives an entity the option to present the total of comprehensive income, the components of net income, and the components of other comprehensive income either in a single continuous statement of comprehensive income or in two separate but consecutive statements. The Company implemented this guidance in the first quarter ended March 31, 2012.
Recent Accounting Pronouncements
In February 2013, the FASB issued ASU 2013-02, "Comprehensive Income: Reporting of Amounts Reclassified Out of Accumulated Other Comprehensive Income". The amended guidance requires an entity to present the effects on the line items of net income of significant reclassifications out of accumulated other comprehensive income if the amount being reclassified is required under U.S. generally accepted accounting principles (“GAAP”) to be reclassified in its entirety to net income in the same reporting period. The guidance is effective prospectively for the reporting periods beginning after December 15, 2012. The Company does not anticipate the adoption of the amended guidance to have significant impact on its consolidated financial statements.
2. Acquisitions
Everyone.net, Inc.
On October 21, 2009, the Company acquired 100% of the outstanding shares of Everyone.net, Inc. ("EDN"), in exchange for cash payment of $5,496, cash settlement of EDN's outstanding debts totaling $1,330, issuance of 94 shares of Series F preferred stock at its fair value of $1,000 ($10.64 per share). Additionally, the Company agreed to pay additional earn-out consideration ("earn-out") of up to $2,000 through November 2011, such earn-out being contingent upon the achievement of specified financial targets. The initial fair value of the earn-out of $1,495 was recorded as part of the purchase consideration. The change in fair value of the earn-out of $208 and $297 during the years ended December 31, 2011 and 2010, respectively, was recognized as a charge to interest income (expense), net for the year. During the year ended December 31, 2010, the Company paid $1,000 of earn-out to the sellers. The remaining payout of $1,000 was paid in December 2011 given that the performance criteria had been met at December 31, 2011. The Company also received $180 during the year ended December 31, 2010, as a working capital adjustment following the closing of the acquisition and such amount was recorded in the consolidated statement of operations as an offset to related expenses incurred and included in general and administrative expenses.
Spam and Open Relay Blocking System (“SORBS”)
On June 30, 2011, the Company entered into an asset purchase agreement (the “SORBS Agreement”) with GFI Software Ltd., a British Virgin Islands corporation.
Under the terms of the SORBS agreement, the Company paid consideration of $200 for intellectual property and fixed assets with $40 being held in escrow to secure indemnification obligations, which was released from escrow in September 2012. The acquisition related costs of $29 incurred by the Company was charged to operating expenses in the year ended December 31, 2011.
Of the total cash consideration paid, $120 was allocated to goodwill as the intellectual property purchased did not meet the criteria for purchase price allocations as set forth in ASC 805, Business Combinations, and $46 was recorded as fixed assets. The following table summarizes the allocation of the purchase price and the estimated useful lives of the identifiable intangible assets acquired as of the date of the acquisition:
F-13
Proofpoint, Inc.
Notes to Consolidated Financial Statements (Continued)
(dollars and share amounts in thousands, except per share amounts)
Estimated Fair Value | Estimated Useful Life | ||||
Tangible assets acquired | $ | 46 | 1 year | ||
Liabilities assumed | — | ||||
Developed technology | 34 | 2 years | |||
Customer relationships | — | ||||
Vendor relationships | — | ||||
Goodwill | 120 | Indefinite | |||
$ | 200 | ||||
NextPage, Inc.
On December 23, 2011, the Company entered into an Agreement of Merger (the "NextPage Agreement") with NextPage, Inc. ("NextPage"), a Delaware corporation, by which the Company acquired 100% of the outstanding shares of NextPage. Under the terms of the NextPage Agreement, the acquisition was completed in exchange for a cash payment of $1 and the issuance of 677 shares of the Company's common stock at its fair value of $5,406 ($7.98 per share) and the assumption of 23 restricted stock units ("RSUs") valued at $180 ($7.98 per unit). Of the 23 RSUs assumed, 14 were fully vested on the date of acquisition. The fair value of the vested RSUs of $58 were included in the purchase price consideration. The acquisition related costs of $3 and $97 incurred by the Company was charged to general and administrative expense in the years ended December 31, 2012 and December 31, 2011, respectively. The results of NextPage's operations have been included in the consolidated financial statements since the acquisition date. The Company's revenue for the year ended December 31, 2012 included $702 of revenue recognized related to the NextPage acquisition.
The Company acquired NextPage for its file archiving and governance capabilities and will incorporate this technology into its Enterprise Governance solution. This will provide the Company additional scale to its existing business in the United States. The total purchase price was as follows:
Common stock (677 shares) | $ | 5,406 | |
Restricted stock units (14 shares) | 58 | ||
Cash Paid | 1 | ||
$ | 5,465 | ||
The acquisition was accounted for as a purchase business combination. The Company allocated the purchase price to tangible assets acquired, liabilities assumed and identifiable intangible assets acquired based on their estimated fair values. The excess of the purchase price over the aggregate fair values was recorded as goodwill. The goodwill was not deductible for tax purposes. The following table summarizes the allocation of the purchase price and the estimated useful lives of the identifiable intangible assets acquired as of the date of the acquisition:
Estimated Fair Value | Estimated Useful Life | ||||
Tangible assets acquired | $ | 413 | |||
Liabilities assumed | (353 | ) | |||
Trade name | 18 | 2 years | |||
Customer relationships | 146 | 4 years | |||
Non-compete agreements | 106 | 2 years | |||
Patent | 50 | 4 years | |||
NextPage technology | 2,580 | 4 years | |||
Goodwill | 2,505 | Indefinite | |||
$ | 5,465 | ||||
F-14
Proofpoint, Inc.
Notes to Consolidated Financial Statements (Continued)
(dollars and share amounts in thousands, except per share amounts)
Pro Forma Financial Information (unaudited)
The unaudited pro forma financial information in the table below summarizes the combined results of operations for the Company and companies that were acquired since the beginning of fiscal year 2010. The pro forma financial information includes the business combination accounting effects from the acquisitions including amortization charges from acquired intangible assets and the related tax effects as though the aforementioned companies were combined as of the beginning of 2010. The unaudited pro forma financial information for the years ended December 31, 2012, 2011 and 2010, as
Proofpoint, Inc. presented below, is for informational purposes only and is not indicative of the results of operations that would have been achieved if the acquisitions had taken place at the beginning of 2010.
Year Ended | |||||||||||
December 31, | |||||||||||
2012 | 2011 | 2010 | |||||||||
Revenue | $ | 106,295 | $ | 83,152 | $ | 66,026 | |||||
Net loss | (20,360 | ) | (21,930 | ) | (21,941 | ) | |||||
Basic and diluted net loss per share | (0.85 | ) | (5.48 | ) | (6.14 | ) | |||||
3. Concentration of Risks
Financial instruments that potentially subject the Company to credit risk consist principally of cash, cash equivalents, short-term investments and accounts receivable.
The Company limits its concentration of risk in cash equivalents and short-term investments by diversifying its investments among a variety of industries and issuers and by limiting the average maturity to one year or less. The Company's professional portfolio managers adhere to this investment policy as approved by the Company's Board of Directors.
The Company's investment policy is to invest only in fixed income investments denominated and payable in U.S. dollars. Investment in obligations of the U.S. government and its agencies, money market instruments, commercial paper, certificates of deposit, bankers' acceptances, corporate bonds of U.S. companies, municipal securities and asset backed securities are allowed. The Company does not invest in auction rate securities, futures contracts, or hedging instruments.
The Company's accounts receivables are derived from revenue earned from customers primarily located in the United States of America. The Company performs periodic evaluations of its customers' financial condition and generally does not require its customers to provide collateral or other security to support accounts receivable, and maintains an allowance for doubtful accounts. Credit losses historically have not been significant.
The following customer accounted for more than 10% of total revenue in the year ended December 31, 2012. No single customer accounted for more than 10% of total revenue in the years ended December 31, 2011 or 2010.
Year Ended | |||||
December 31, | |||||
2012 | 2011 | 2010 | |||
Customer A | 14% | * | * | ||
* indicates less than 10% of total revenue during the period.
At December 31, 2011, there were no customers that accounted for more than 10% of total accounts receivable. At December 31, 2012 the following customer accounted for more than 10% of total accounts receivable:
F-15
Proofpoint, Inc.
Notes to Consolidated Financial Statements (Continued)
(dollars and share amounts in thousands, except per share amounts)
As of | |||
December 31, | |||
2012 | 2011 | ||
Customer A | 10% | * | |
* indicates less than 10% of total accounts receivable.
At December 31, 2012 and 2011, the following vendor accounted for more than 10% of total accounts payable:
As of | |||
December 31, | |||
2012 | 2011 | ||
Vendor A | 22% | 15% | |
Vendor B | * | 11% | |
* indicates less than 10% of total accounts payable.
4. Balance Sheet Components
Allowance for doubtful accounts activity and balances are presented below:
Balance at Beginning of Period | Additions to Costs and Expenses | Write Offs | Balance at End of Period | ||||||||||||
Year ended December 31, 2010 | $ | 296 | $ | 44 | $ | (83 | ) | $ | 257 | ||||||
Year ended December 31, 2011 | 257 | 8 | (32 | ) | 233 | ||||||||||
Year ended December 31, 2012 | 233 | 54 | (100 | ) | 187 | ||||||||||
Property and equipment at December 31, 2012 and 2011, consist of the following:
Useful Life (in years) | December 31, | ||||||||
2012 | 2011 | ||||||||
Computer equipment | 2 to 3 | $ | 22,204 | $ | 18,298 | ||||
Software | 2 | 1,712 | 1,539 | ||||||
Furniture | 5 | 76 | 48 | ||||||
Office equipment | 2 | 347 | 341 | ||||||
Leasehold improvements | 5 years or shorter of the lease term | 1,217 | 539 | ||||||
Other | 2 | 54 | 54 | ||||||
Construction in progress | 1,158 | 559 | |||||||
26,768 | 21,378 | ||||||||
Less: Accumulated depreciation and amortization | (18,208 | ) | (14,025 | ) | |||||
$ | 8,560 | $ | 7,353 | ||||||
Property and equipment acquired under capital leases:
F-16
Proofpoint, Inc.
Notes to Consolidated Financial Statements (Continued)
(dollars and share amounts in thousands, except per share amounts)
December 31, | |||||||
2012 | 2011 | ||||||
Computer equipment | $ | 341 | $ | 386 | |||
Less: Accumulated depreciation | (269 | ) | (371 | ) | |||
$ | 72 | $ | 15 | ||||
Depreciation expense for the years ended December 31, 2012, 2011 and 2010, was approximately $4,434, $3,142, and $3,261, respectively. This included depreciation expense for assets under capital leases of $42, $151, $164 for the years ended December 31, 2012, 2011 and 2010, respectively.
The Company capitalized software development costs of $400 for the year ended December 31, 2011. Amortization of capitalized software development costs was approximately $200 and $41 for the years ended December 31, 2012 and 2011, respectively. Unamortized capitalized software development costs for the years ended December 31, 2012 and 2011, were $159 and $359, respectively.
Accrued liabilities at December 31, 2012 and 2011 consisted of the following:
December 31, | |||||||
2012 | 2011 | ||||||
Accrued compensation | $ | 7,125 | $ | 5,909 | |||
Accrued royalties | 262 | 355 | |||||
Other | 4,691 | 3,797 | |||||
$ | 12,078 | $ | 10,061 | ||||
5. Goodwill and Intangible Assets
The goodwill activity and balances are presented below:
December 31, | |||||||
2012 | 2011 | ||||||
Opening balance | $ | 18,557 | $ | 15,932 | |||
Add: Goodwill from acquisitions | — | 2,625 | |||||
Closing balance | $ | 18,557 | $ | 18,557 | |||
The goodwill balance as of December 31, 2012 was the result of the acquisitions of Fortiva, Sigaba, EDN, SORBS and NextPage (Note 2).
Intangible Assets
Intangible assets excluding goodwill, consisted of the following:
December 31, 2012 | December 31, 2011 | ||||||||||||||||||||||
Gross Carrying Amount | Accumulated Amortization | Net Carrying Amount | Gross Carrying Amount | Accumulated Amortization | Net Carrying Amount | ||||||||||||||||||
Developed technology | $ | 17,641 | $ | (15,163 | ) | $ | 2,478 | $ | 17,641 | $ | (12,378 | ) | $ | 5,263 | |||||||||
Customer relationships | 2,408 | (2,109 | ) | 299 | 2,408 | (1,685 | ) | 723 | |||||||||||||||
Vendor relationships | — | — | — | 290 | (290 | ) | — | ||||||||||||||||
Non-compete | 106 | (27 | ) | 79 | 106 | (1 | ) | 105 | |||||||||||||||
Trademark and patents | 98 | (41 | ) | 57 | 98 | — | 98 | ||||||||||||||||
$ | 20,253 | $ | (17,340 | ) | $ | 2,913 | $ | 20,543 | $ | (14,354 | ) | $ | 6,189 | ||||||||||
F-17
Proofpoint, Inc.
Notes to Consolidated Financial Statements (Continued)
(dollars and share amounts in thousands, except per share amounts)
In the quarter ended March 31, 2011, the Company revised the useful life of the vendor relationship intangible asset. The Company fully depreciated this intangible asset given that it is no longer using the technology provided by this vender. Accordingly, the entire remaining balance of $0.3 million was expensed.
Amortization expense of intangibles totaled $3,276, $4,542, and $4,382 during the years ended December 31, 2012, 2011 and 2010, respectively.
Future estimated amortization costs of intangible assets as of December 31, 2012 are presented below:
Year Ended December 31, | (in thousands) | ||
2013 | $ | 1,479 | |
2014 | 725 | ||
2015 | 709 | ||
$ | 2,913 | ||
6. Financial Instruments and Fair Value Measurements
The cost and fair value of the Company’s available-for-sale investments as of December 31, 2012 and 2011 were as follows:
December 31, 2012 | |||||||||||||||
Cost Basis | Unrealized Gains | Unrealized Losses | Fair Value | ||||||||||||
Cash and Cash Equivalents: | |||||||||||||||
Cash | $ | 11,749 | $ | — | $ | — | $ | 11,749 | |||||||
Money market funds | 26,485 | — | — | 26,485 | |||||||||||
Corporate debt securities | 1,020 | — | — | 1,020 | |||||||||||
Total | $ | 39,254 | $ | — | $ | — | $ | 39,254 | |||||||
Short term investments: | |||||||||||||||
Corporate debt securities | $ | 29,266 | $ | 4 | $ | (3 | ) | $ | 29,267 | ||||||
Commercial paper | 15,987 | 1 | — | 15,988 | |||||||||||
Certificates of deposit | 2,007 | 1 | — | 2,008 | |||||||||||
Total | $ | 47,260 | $ | 6 | $ | (3 | ) | $ | 47,263 | ||||||
December 31, 2011 | |||||||||||||||
Cost Basis | Unrealized Gains | Unrealized Losses | Fair Value | ||||||||||||
Cash and Cash Equivalents: | |||||||||||||||
Cash | $ | 2,917 | $ | — | $ | — | $ | 2,917 | |||||||
Money market funds | 6,850 | — | — | 6,850 | |||||||||||
Total | $ | 9,767 | $ | — | $ | — | $ | 9,767 | |||||||
Short term investments: | |||||||||||||||
Corporate debt securities | $ | 2,650 | $ | — | $ | (3 | ) | $ | 2,647 | ||||||
Commercial paper | 300 | — | — | 300 | |||||||||||
Total | $ | 2,950 | $ | — | $ | (3 | ) | $ | 2,947 | ||||||
F-18
Proofpoint, Inc.
Notes to Consolidated Financial Statements (Continued)
(dollars and share amounts in thousands, except per share amounts)
As of and December 31, 2012 and 2011, all investments mature in less than one year. Estimated fair values for marketable securities are based on quoted market prices for the same or similar instruments.
Fair Value Measurements
Fair value is defined as the price that would be received to sell an asset or paid to transfer a liability (i.e., the “exit price”) in an orderly transaction between market participants at the measurement date. A hierarchy for inputs used in measuring fair value has been defined to minimize the use of unobservable inputs by requiring the use of observable market data when available. Observable inputs are inputs that market participants would use in pricing the asset or liability based on active market data. Unobservable inputs are inputs that reflect the Company’s assumptions about the assumptions market participants would use in pricing the asset or liability based on the best information available in the circumstances.
The fair value hierarchy prioritizes the inputs into three broad levels:
• | Level 1: Quoted (unadjusted) prices in active markets for identical assets or liabilities. |
The Company’s Level 1 assets generally consist of money market funds.
• | Level 2: Observable inputs other than quoted prices included in Level 1, such as quoted prices for similar assets or liabilities in active markets; quoted prices for identical or similar assets or liabilities in markets that are not active; or other inputs that are observable or can be corroborated by observable market data for substantially the full term of the asset or liability. |
The Company’s Level 2 assets and liabilities generally consist of corporate bonds and agency debt securities, commercial paper, and certificates of deposit.
• | Level 3: Unobservable inputs to the valuation methodology that are supported by little or no market activity and that are significant to the measurement of the fair value of the assets or liabilities. Level 3 assets and liabilities include those whose fair value measurements are determined using pricing models, discounted cash flow methodologies or similar valuation techniques, as well as significant management judgment or estimation. |
The Company’s Level 3 liabilities have historically consisted of the Series B preferred stock warrants, which were exercised during the year ended December 31, 2011 and the equipment financing loans.
The following tables summarize, for each category of assets or liabilities, the respective fair value as of December 31, 2012 and 2011 and the classification by level of input within the fair value hierarchy.
F-19
Proofpoint, Inc.
Notes to Consolidated Financial Statements (Continued)
(dollars and share amounts in thousands, except per share amounts)
Balance as of December 31, 2012 | Quoted Prices in Active Markets for Identical Assets (Level 1) | Significant Other Observable Inputs (Level 2) | Unobservable Inputs (Level 3) | ||||||||||||
Cash equivalents: | |||||||||||||||
Money market funds | $ | 26,485 | $ | 26,485 | $ | — | $ | — | |||||||
Corporate debt securities | 1,020 | 1,020 | — | — | |||||||||||
Short-term investments: | |||||||||||||||
Corporate debt securities | 29,267 | — | 29,267 | — | |||||||||||
Commercial paper | 15,988 | — | 15,988 | — | |||||||||||
Certificates of deposit | 2,008 | — | 2,008 | — | |||||||||||
Total financial assets | $ | 74,768 | $ | 27,505 | $ | 47,263 | $ | — | |||||||
Balance as of December 31, 2011 | Quoted Prices in Active Markets for Identical Assets (Level 1) | Significant Other Observable Inputs (Level 2) | Unobservable Inputs (Level 3) | ||||||||||||
Cash equivalents: | |||||||||||||||
Money market funds | $ | 6,850 | $ | 6,850 | $ | — | $ | — | |||||||
Short-term investments: | |||||||||||||||
Corporate debt securities | 2,647 | — | 2,647 | — | |||||||||||
Commercial paper | 300 | — | 300 | — | |||||||||||
Total financial assets | $ | 9,797 | $ | 6,850 | $ | 2,947 | $ | — | |||||||
7. Commitments and Contingencies
Operating Leases
The Company leases certain of its facilities under noncancelable operating leases with various expiration dates through May 2017.
Rent expense was $1,520, $1,471 and $1,157 for the years ended December 31, 2012, 2011 and 2010, respectively.
Capital Leases
The Company acquired capital leases as part of the EDN acquisition. The leases were secured by fixed assets primarily used in a data center. The leases have various expiration dates through October 2012. The interest rates range from 2.9% to 9.7%.
In July 2012, the Company entered into a lease agreement to lease certain office equipment with an expiration date in July 2015. The lease bears an annual interest rate of 4.5% and is secured by fixed assets used in the Company's corporate office location.
At December 31, 2012, future annual minimum lease payments under noncancelable operating and capital leases were as follows:
F-20
Proofpoint, Inc.
Notes to Consolidated Financial Statements (Continued)
(dollars and share amounts in thousands, except per share amounts)
Capital Leases | Operating Leases | ||||||
2013 | $ | 19 | $ | 3,725 | |||
2014 | 18 | 1,556 | |||||
2015 | 11 | 728 | |||||
2016 | 306 | ||||||
2017 | 130 | ||||||
Total minimum lease payments | 48 | $ | 6,445 | ||||
Less: Amount representing interest | (3 | ) | |||||
Present value of capital lease obligations | 45 | ||||||
Less: Current portion | (17 | ) | |||||
Long-term portion of capital lease obligations | $ | 28 | |||||
Contingencies
Under the indemnification provisions of the Company's customer agreements, the Company agrees to indemnify and defend and hold harmless its customers against, among other things, infringement of any patent, trademark or copyright under any country's laws or the misappropriation of any trade secret arising from the customers' legal use of the Company's solutions. The exposure to the Company under these indemnification provisions is generally limited to the total amount paid by the customers under the applicable customer agreement. However, certain indemnification provisions potentially expose the Company to losses in excess of the aggregate amount paid to the Company by the customer under the applicable customer agreement. To date, there have been no claims against the Company or its customers pursuant to these indemnification provisions.
Legal Contingencies
From time to time, the Company is involved in claims and legal proceedings that arise in the ordinary course of business. Based on currently available information, management does not believe that the ultimate outcome of these unresolved matters, individually and in the aggregate, is likely to have a material adverse effect on the Company’s financial position, results of operations or cash flows. However, litigation is subject to inherent uncertainties and the Company’s view of these matters may change in the future. Were an unfavorable outcome to occur, there exists the possibility of a material adverse impact on the Company’s financial position, results of operations or cash flows for the period in which the unfavorable outcome occurs, and potentially in future periods.
The Company determined that subsequent to its acquisition of Fortiva, Inc., a Canadian company, in August 2008, it shipped a particular hardware appliance model to a limited number of international customers that, prior to shipment, required either a one-time product review or application for an encryption registration number in lieu of such product review. The Company has made voluntary submissions to the United States Commerce Department’s Bureau of Industry and Security (BIS) to report this potential violation. Based upon the results of the internal investigation completed to date, the Company does not believe that the amount of any loss incurred as a result of this matter would be material to its business, financial condition, results of operations or cash flows. On January 17, 2013, BIS issued a Warning Letter to us. The Warning Letter notified us that BIS would not be referring these violations to prosecution and had closed the matter.
As part of a pre-IPO due diligence review, the Company discovered a potential export violation involving the provision of web-based, email communication services through its Everyone.net service, which the Company acquired in October 2009. The Company’s records indicate that there were two end-users who may have, for a portion of their respective service periods, been located in Iran, a United States designated state sponsor of terrorism. The Company’s internal investigation has progressed and the Company has found that the issues identified are specific to the acquired Everyone.net system, which has a separate customer database and billing system from that of Proofpoint’s main businesses. The Company does not have any indication that these services were utilized by the Iranian government. The accounts of both end-users were terminated in 2010 and accounted for approximately $15 in payments to us in 2009 and $6 in payments to us in 2010. Although the Company has ceased providing the service, the Company has made voluntary submissions to the U.S. Department of Treasury’s Office of Foreign Assets Control, or OFAC, to report this potential violation. Based upon the results of the internal
F-21
Proofpoint, Inc.
Notes to Consolidated Financial Statements (Continued)
(dollars and share amounts in thousands, except per share amounts)
investigation completed to date, the Company does not believe that the amount of any loss incurred as a result of this matter would be material to its business, financial condition, results of operations or cash flows. On November 2, 2012, OFAC issued a Cautionary Letter to us. The Cautionary Letter notified us that OFAC had closed the matter instead of pursuing any civil penalty.
8. Debt
Equipment Financing Loans
The Company entered into a new equipment loan agreement with Silicon Valley Bank in April 2011 for an aggregate loan principal amount of $6,000. Interest on the advances is equal to prime rate plus 0.50%. As of December 31, 2012, the interest on the outstanding advances was 4.50%. The Company had the ability to draw down on this equipment line through April 19, 2012. Each drawn amount is due 48 months after funding. Borrowings outstanding under the equipment loan at December 31, 2012 were $3,968. Equipment financed under this loan arrangement is collateralized by the respective assets underlying the loan. The terms of the loan restrict the Company’s ability to pay dividends. The loan includes a covenant that requires the Company to maintain cash and cash equivalents plus net accounts receivable of at least two times the amount of all outstanding indebtedness. As of December 31, 2012, the Company was in compliance with the financial covenant.
The Company had a previous equipment loan arrangement with Silicon Valley Bank for $2,000. The loan bore interest at an annual rate of 8.75%. The maturity date was 36 months after the funding date. Borrowings outstanding under the equipment loan at December 31, 2011 were zero, as the loan was completely repaid and terminated in June 2011. Equipment financed under this loan arrangement was collateralized by the respective assets underlying each specific draw down. This loan required the Company to maintain a tangible net worth greater than $18,000 and during the term of the loan, the Company was in compliance with the financial covenant.
Interest expense for the years ended December 31, 2012, 2011 and 2010 was $211, $54 and $27, respectively.
At December 31, 2012, the remaining repayment commitments related to the equipment loans are as follows:
2013 | 1,642 | ||
2014 | 1,642 | ||
2015 | 684 | ||
2016 | — | ||
$ | 3,968 | ||
9. Convertible Preferred Stock
On April 19, 2012, the Company's registration statement on Form S-1 for its IPO was declared effective by the SEC and on April 20, 2012, the Company closed its IPO. Immediately prior to the close of the IPO, the Company's outstanding redeemable convertible preferred stock automatically converted into common stock.
The following table summarizes information related to the Company's redeemable convertible preferred stock prior to conversion into common stock:
F-22
Proofpoint, Inc.
Notes to Consolidated Financial Statements (Continued)
(dollars and share amounts in thousands, except per share amounts)
Original Issue Price Per Share | Shares | Liquidation Amount | Proceeds Net of Issuance Costs | |||||||||||||||
Authorized | Outstanding | |||||||||||||||||
Series A | $ | 1.00 | 7,400 | 7,400 | $ | 7,400 | $ | 7,374 | ||||||||||
Series B | 1.28 | 7,109 | 7,080 | 9,062 | 8,937 | |||||||||||||
Series C | 2.41 | 8,307 | 8,307 | 20,020 | 19,920 | |||||||||||||
Series D | 3.01 | 665 | 665 | 2,001 | 1,954 | |||||||||||||
Series E | 3.48 | 5,743 | 5,743 | 20,001 | 19,899 | |||||||||||||
Series F | 5.32 | 10,200 | 9,747 | 51,854 | 34,238 | |||||||||||||
39,424 | 38,942 | $ | 110,338 | $ | 92,322 | |||||||||||||
Each share of Series A, B, C and F preferred stock converted into 0.5 share of common stock. Series D preferred stock is convertible into 0.625 shares of common stock and each share of Series E preferred stock is convertible into 0.502315 shares of common stock.
Dividends
No dividends on the convertible preferred stock were declared by the Board of Directors from inception through their conversion into common stock.
Series B Preferred Stock Warrants
In 2004, the Company issued warrants to purchase 78 shares of the Company's Series B convertible preferred stock at a price of $1.28 per share in connection with an equipment financing arrangement. Using the Black-Scholes option-pricing model, the Company determined the fair value of each warrant to be $2.01 as of December 31, 2010. The fair value of the warrants was estimated using the following assumptions.
Year Ended December 31, 2010 | |||
Dividend yield | — | % | |
Expected volatility | 61.0 | % | |
Risk-free interest rate | 1.8 | % | |
Expected term (in years) | 0.5 | ||
The warrants were converted in August 2011 into 49 shares of the Company's Series B convertible preferred stock on a net settlement basis.
10. Common Stock
Initial Public Offering
In April 2012, the Company completed its initial public offering of its common stock to the public (“IPO”) whereby 5,859 shares of common stock sold by the Company (inclusive of 729 shares of common stock from the partial exercise of the overallotment option granted to the underwriters) and 1,370 shares of common stock sold by the selling shareholders (inclusive of 171 shares of common stock from the partial exercise of the overallotment option granted to the underwriters). The public offering price of the shares sold in the offering was $13.00 per share. The Company did not receive any proceeds from the sales of shares by the selling stockholders. The total gross proceeds from the offering to the Company were $76.2 million. After deducting underwriters’ discounts and commissions and offering expenses, the aggregate net proceeds received by the Company totaled approximately $68.3 million. Immediately prior to the closing of the IPO, all shares of the Company’s outstanding redeemable convertible preferred stock automatically converted into 19,567 shares of common stock. As a result, following the IPO, the Company has two classes of authorized stock: Common stock and Preferred stock.
F-23
As of December 31, 2012, the Company is authorized to issue two classes of stock totaling 205,000 shares, of which 5,000 are designated as preferred stock and 200,000 are designated common stock, each with a par value of $0.0001 per share.
On March 30, 2012, the Company's Board of Directors approved a 1-for-2 reverse stock split of the Company's common stock. The reverse stock split became effective on April 2, 2012. All of the share numbers, share prices, and exercise prices have been retrospectively adjusted to reflect the reverse stock split.
The following table presents the shares authorized and issued and outstanding as of the dates presented:
As of December 31, 2012 | As of December 31, 2011 | ||||||||||||||
Shares | Shares | Liquidation | |||||||||||||
Authorized | Outstanding | Authorized | Outstanding | Amount | |||||||||||
Convertible preferred stock Series A | — | — | 7,400 | 7,400 | $ | 7,400 | |||||||||
Convertible preferred stock Series B | — | — | 7,109 | 7,080 | 9,062 | ||||||||||
Convertible preferred Series C | — | — | 8,307 | 8,307 | 20,020 | ||||||||||
Convertible preferred Series D | — | — | 665 | 665 | 2,001 | ||||||||||
Convertible preferred Series E | — | — | 5,743 | 5,743 | 20,001 | ||||||||||
Convertible preferred Series F | — | — | 10,200 | 9,747 | 51,854 | ||||||||||
Common Stock | 200,000 | 33,044 | 71,400 | 4,961 | — | ||||||||||
Undesignated preferred stock | 5,000 | — | — | — | — | ||||||||||
205,000 | 33,044 | 110,824 | 43,903 | $ | 110,338 | ||||||||||
Number of shares of common stock reserved for future issuance was as follows:
Year Ended December 31, | |||||
2012 | 2011 | ||||
Options available for future grant under the stock plans | 4,611 | 364 | |||
Options outstanding under stock option plans | 9,636 | 10,705 | |||
Shares available for future issuance under ESPP | 646 | — | |||
Conversion of convertible preferred stock | — | 19,567 | |||
Common stock issuable upon exercise of warrant and settlement of outstanding restricted stock units | 1 | 25 | |||
Total shares reserved | 14,894 | 30,661 | |||
11. Stock Option Plans
On March 30, 2012, the Board of Directors and the Company’s stockholders approved the 2012 Equity Incentive Plan (the "2012 Plan"), which became effective in April 2012. The Company has two equity incentive plans: the Company’s 2002 stock option plan (the “2002 Plan”) and the 2012 Equity Incentive Plan. Upon the IPO, all shares that were reserved under the 2002 Plan but not issued, and shares issued but subsequently returned to the plan through forfeitures, cancellations and repurchases became part of the 2012 Plan and no further shares will be granted pursuant to the 2002 Plan. All outstanding stock awards under the 2002 and 2012 Plans will continue to be governed by their existing terms. Under the 2012 Plan, the Company has the ability to issue incentive stock options (“ISOs”), nonstatutory stock options (“NSOs”), restricted stock awards, stock
F-24
Proofpoint, Inc.
Notes to Consolidated Financial Statements (Continued)
(dollars and share amounts in thousands, except per share amounts)
bonus awards, stock appreciation rights ("SARs"), restricted stock units (“RSUs”), and performance shares. The 2012 Plan also allows direct issuance of common stock to employees, outside directors and consultants at prices equal to the fair market value at the date of grant of options or issuance of common stock. Additionally, the 2012 Plan provides for the grant of performance cash awards to employees, directors and consultants. The Company has the right to repurchase any unvested shares (at the option exercise price) of common stock issued directly or under option exercises. The right of repurchase generally expires over the vesting period.
Under the 2002 and 2012 Plans, the term of an option grant shall not exceed ten years from the date of its grant and options generally vest over a three to four-year period, with vesting on a monthly or annual interval. 20,316 shares of common stock are reserved for issuance to eligible participants, under the 2012 Plan. As of December 31, 2012, 4,611 shares were available for future grant. Restricted stock awards generally vest over a four-year period with 25% vesting at the end of one year and the remaining vest quarterly thereafter. The number of shares available for grant and issuance under the 2012 Plan will be increased automatically on each January 1 of 2013 through 2016 by an amount equal to 5% of the Company's shares outstanding on the immediately preceding December 31, but not to exceed 3,724 shares, unless the Board of Directors, in its discretion, determines to make a smaller increase.
Employee Stock Purchase Plan
On March 30, 2012, the Board of Directors and the Company’s stockholders approved the 2012 Employee Stock Purchase Plan (the "ESPP"), which became effective in April 2012. A total of 745 shares of the Company's common stock are initially reserved for future issuance under the ESPP. The number of shares reserved for issuance under the ESPP will increase automatically on January 1 of each of the first eight years commencing with 2013 by the number of shares equal to 1% of the Company's shares outstanding on the immediately preceding December 31, but not to exceed 1,490 shares, unless the Board of Directors, in its discretion, determines to make a smaller increase. As of December 31, 2012, there were 646 shares of the Company's common stock available for future issuance under the ESPP.
Stock option activity under the Plan is as follows:
Shares subject to Options Outstanding | |||||||||||||
Number of Shares | Weighted Average Exercise Price | Weighted Average Remaining Contractual Term (in years) | Aggregate Intrinsic Value | ||||||||||
Balance at January 1, 2010 | 7,854 | $ | 2.55 | 5.62 | $ | 11,258 | |||||||
Options granted | 3,315 | 4.57 | |||||||||||
Options exercised | (522 | ) | 2.35 | ||||||||||
Options forfeited and cancelled | (936 | ) | 3.51 | ||||||||||
Balance at December 31, 2010 | 9,711 | 3.15 | 6.18 | 21,619 | |||||||||
Options granted | 2,533 | 6.33 | |||||||||||
Options exercised | (456 | ) | 2.63 | ||||||||||
Options forfeited and cancelled | (1,083 | ) | 4.16 | ||||||||||
Balance at December 31, 2011 | 10,705 | 3.83 | 6.77 | 44,466 | |||||||||
Options granted | 2,243 | 10.29 | |||||||||||
Options exercised | (2,543 | ) | 1.95 | ||||||||||
Options forfeited and cancelled | (769 | ) | 6.26 | ||||||||||
Balance at December 31, 2012 | 9,636 | 5.63 | 7.33 | 64,719 | |||||||||
Exercisable, December 31, 2012 | 5,096 | 3.80 | 6.14 | 43,390 | |||||||||
Vested and expected to vest, December 31, 2012 | 9,636 | $ | 5.63 | 7.33 | $ | 64,719 | |||||||
F-25
Proofpoint, Inc.
Notes to Consolidated Financial Statements (Continued)
(dollars and share amounts in thousands, except per share amounts)
The total intrinsic value of options exercised was $18,950, $1,505 and $1,337, for the years ended December 31, 2012, 2011 and 2010, respectively. Total cash proceeds from such option exercises were $4,966, $1,198 and $1,211 for the years ended December 31, 2012, 2011 and 2010, respectively.
Stock-Based Compensation
The fair value of options granted is estimated on the grant date using the Black-Scholes option valuation model. This valuation model for stock-based compensation expense requires the Company to make assumptions and judgments about the variables used in the calculation, including the expected term (weighted-average period of time that the options granted are expected to be outstanding), the volatility of the common stock price, an assumed risk-free interest rate and the estimated forfeitures of unvested stock options. To the extent actual forfeitures differ from the estimates, the difference will be recorded as a cumulative adjustment in the period estimates are revised. No compensation cost is recorded for options that do not vest and the compensation cost from vested options, whether forfeited or not, is not reversed.
Prior to the Company's IPO, the Board of Directors, in good faith, determined the fair market values of the Company's common stock, based on the best information available to the Board and the Company's management at the time of grant. The Company performed its analysis in accordance with applicable elements of the practice aid issued by the American Institute of Certified Public Accountants entitled Valuation of Privately Held Company Equity Securities Issued as Compensation. The procedures performed to determine the fair value of the Company's common stock were based on a probability‑weighted expected return method to estimate the aggregate equity value of the Company.
The weighted average fair value of stock options granted to employees during the years ended December 31, 2012, 2011 and 2010, was $5.65, $6.33 and $4.57, respectively. The fair values were estimated on the grant dates using the Black-Scholes option-pricing model with the following weighted-average assumptions:
Year Ended December 31, | |||||
2012 | 2011 | 2010 | |||
Expected life (in years) | 5.50 - 6.08 | 5.85 - 6.08 | 6.00 - 6.08 | ||
Volatility | 59% - 60% | 59% - 61% | 60% - 61% | ||
Risk-free interest rate | 0.9% - 1.2% | 1.2% - 2.5% | 1.8% - 2.8% | ||
Dividend yield | —% | —% | —% | ||
The estimate for expected life of options granted reflects the midpoint of the vesting term and the contractual life computed utilizing the simplified method as allowed by the SEC staff. The Company does not have significant historical share option exercise experience and hence considers the expected term assumption calculated using the simplified method to be reasonable. Since the Company's stock has been publicly traded for a limited time, the stock volatility assumptions represent an estimate of the historical volatilities of the common stock of a group of publicly-traded peer companies that operate in a similar industry. The estimate was determined based on the average historical volatilities of these peer companies. The risk-free interest rate used was the Federal Reserve Bank's constant maturities interest rate commensurate with the expected life of the options in effect at the time of the grant. The expected dividend yield was zero, as the Company does not anticipate paying a dividend within the relevant time frame. Expected forfeitures are estimated based on the Company's historical experience.
The Company realized no income tax benefit from stock option exercises in each of the periods presented due to recurring losses and valuation allowances.
As of December 31, 2012, the Company had unamortized stock-based compensation expense of 14,526 related to stock options, that will be recognized net of forfeitures over the average remaining vesting term of the options of 2.74 years.
Restricted Stock Units
In December 2011, the Company assumed NextPage's 2007 Stock Plan (the "2007 Plan"). Under the 2007 Plan, the Company assumed 23 RSUs, which remain subject to their original terms and conditions.
During the year ended December 31, 2011, the Company acquired NextPage, Inc. and assumed the RSUs granted to certain employees. The fair value of each unit is based on the fair value of the Company's common stock on the date of
F-26
Proofpoint, Inc.
Notes to Consolidated Financial Statements (Continued)
(dollars and share amounts in thousands, except per share amounts)
assumption. A summary of the status of RSUs awarded and unvested under the stock option plans as of December 31, 2011 is presented below (in thousands, except per share amounts):
RSUs Outstanding | ||||||
Number of Shares | Granted Fair Value Per Unit | |||||
Awarded and unvested at January 1, 2011 | — | |||||
Awards assumed | 23 | $ | 7.98 | |||
Awards vested | (15 | ) | 7.98 | |||
Awards forfeited | — | 7.98 | ||||
Awarded and unvested at December 31, 2011 | 8 | $ | 7.98 | |||
Awards assumed | — | 7.98 | ||||
Awards vested | (6 | ) | 7.98 | |||
Awards forfeited | (1 | ) | 7.98 | |||
Awarded and unvested at December 31, 2012 | 1 | $ | 7.98 | |||
As of December 31, 2012, there was $1 of unamortized stock-based compensation expense related to unvested RSUs, which are expected to be recognized over a weighted average period of 2.3 years.
The fair value of option grants that vested was $5,736, $4,015 and $3,440 during the years ended December 31, 2012, 2011 and 2010, respectively.
The fair value of the option component of the ESPP shares was estimated at the grant date using the Black-Scholes option pricing model with the following weighted average assumptions:
Year ended December 31, | |||||
2012 | 2011 | 2010 | |||
Expected life (in years) | 0.50 -0.53 | * | * | ||
Volatility | 46 - 51% | * | * | ||
Risk-free interest rate | 0.13 - 0.15% | * | * | ||
Dividend yield | —% | * | * | ||
* Employee participation in the ESPP did not begin until the second quarter of 2012.
As of December 31, 2012, the Company expects to recognize $321 of the total unamortized compensation cost related to employee purchases under the ESPP over a weighted average period of 0.33 years.
12. Net Loss per Share
Basic net loss per share of common stock is calculated by dividing the net loss by the weighted‑average number of shares of common stock outstanding for the period. The weighted‑average number of shares of common stock used to calculate our basic net loss per share of common stock excludes those shares subject to repurchase related to stock options that were exercised prior to vesting as these shares are not deemed to be issued for accounting purposes until they vest. Diluted net loss
F-27
per share of common stock is computed by dividing the net loss using the weighted‑average number of shares of common stock, excluding common stock subject to repurchase, and, if dilutive, potential shares of common stock outstanding during the period. Basic and diluted net loss per common share was the same for all periods presented as the impact of all potentially dilutive securities outstanding was anti-dilutive.
The following table presents the calculation of basic and diluted net loss per share:
Years Ended December 31, | |||||||||||
2012 | 2011 | 2010 | |||||||||
Numerator: | |||||||||||
Net loss | $ | (20,360 | ) | $ | (20,141 | ) | $ | (20,865 | ) | ||
Denominator: | |||||||||||
Weighted average number of common shares used in computing basic and diluted net loss per share | 24,056 | 4,005 | 3,575 | ||||||||
Net loss per common share | |||||||||||
Basic and diluted net loss per share | $ | (0.85 | ) | $ | (5.03 | ) | $ | (5.84 | ) | ||
The following table presents the potentially dilutive common shares outstanding that were excluded from the computation of diluted net loss per share of common stock for the periods presented because including them would have been anti-dilutive:
Years Ended December 31, | ||||||||
2012 | 2011 | 2010 | ||||||
Convertible preferred stock | — | 39,134 | 39,086 | |||||
Stock options to purchase common stock | 9,636 | 10,705 | 9,711 | |||||
Common stock subject to repurchase | 4 | 6 | 5 | |||||
Convertible preferred stock warrants | — | — | 78 | |||||
Common stock warrants | — | 2 | 2 | |||||
Restricted stock units | 1 | — | — | |||||
Total | 9,641 | 49,847 | 48,882 | |||||
13. Segment Reporting
Operating segments are reported in a manner consistent with the internal reporting supported and defined by the components of an enterprise about which separate financial information is available, provided and is evaluated regularly by the chief operating decision maker, or decision making group, in deciding how to allocate resources and in assessing performance. The Company's chief operating decision maker is its chief executive officer. The Company's chief executive officer reviews financial information presented on a consolidated basis and as a result, the Company concluded that there is only one operating and reportable segment.
The following sets forth total revenue and long-lived assets by geographic area. Revenue by geography is based upon the billing address of the customer.
Year Ended December 31, | |||||||||||
2012 | 2011 | 2010 | |||||||||
Total revenue: | |||||||||||
United States | $ | 86,661 | $ | 65,044 | $ | 51,623 | |||||
Rest of World | 19,634 | 16,794 | 13,167 | ||||||||
Total revenue | $ | 106,295 | $ | 81,838 | $ | 64,790 | |||||
F-28
Year Ended December 31, | |||||||
2012 | 2011 | ||||||
Long-lived assets: | |||||||
United States | $ | 6,857 | $ | 5,198 | |||
Rest of World | 1,703 | 2,155 | |||||
Total long-lived assets | $ | 8,560 | $ | 7,353 | |||
14. Income Taxes
The Company accounts for income taxes in accordance with authoritative guidance, which requires the use of the asset and liability method. Under this method, deferred income tax assets and liabilities are determined based on the difference between the consolidated financial statement carrying amounts and the tax basis of assets and liabilities and are measured using the enacted tax rates expected to apply to taxable income in the years in which the differences are expected to be reversed.
The domestic and foreign components of loss before provision for income taxes were as follows for the years ended December 31, 2012, 2011 and 2010:
Year Ended December 31, | |||||||||||
2012 | 2011 | 2010 | |||||||||
Domestic | $ | (23,506 | ) | $ | (17,566 | ) | $ | (18,233 | ) | ||
Foreign | 3,667 | (2,205 | ) | (2,389 | ) | ||||||
Loss before provision for income taxes | $ | (19,839 | ) | $ | (19,771 | ) | $ | (20,622 | ) | ||
The expense for income taxes is comprised of:
Year Ended December 31, | |||||||||||
2012 | 2011 | 2010 | |||||||||
Current tax expense: | |||||||||||
Federal | $ | — | $ | — | $ | — | |||||
State | 30 | 52 | 78 | ||||||||
Foreign | 491 | 318 | 165 | ||||||||
Total current | 521 | 370 | 243 | ||||||||
Deferred tax expense: | |||||||||||
Federal | — | — | — | ||||||||
State | — | — | — | ||||||||
Foreign | — | — | — | ||||||||
Total deferred | — | — | — | ||||||||
Total tax expense | $ | 521 | $ | 370 | $ | 243 | |||||
The reconciliation of income tax expense at the statutory federal income tax rate of 34% to the income tax provision included in the statement of operations for the years ended December 31, 2012, 2011 and 2010 is as follows:
F-29
Proofpoint, Inc.
Notes to Consolidated Financial Statements (Continued)
(dollars and share amounts in thousands, except per share amounts)
Year Ended December 31, | |||||||||||
2012 | 2011 | 2010 | |||||||||
Tax at federal statutory rate | $ | (6,745 | ) | $ | (6,722 | ) | $ | (7,011 | ) | ||
Foreign income tax rate differential | (262 | ) | 219 | 132 | |||||||
State, net of federal benefit | (822 | ) | (821 | ) | (804 | ) | |||||
Stock compensation charges | 1,256 | 1,091 | 677 | ||||||||
Other permanent items | 1,204 | 849 | 171 | ||||||||
Provision to return & other | 1,074 | 850 | (2 | ) | |||||||
Research and development credits | (1,061 | ) | (1,427 | ) | (1,320 | ) | |||||
Uncertain tax positions | 301 | 1,004 | 272 | ||||||||
Valuation allowance | 5,576 | 5,327 | 8,128 | ||||||||
Total tax expense | $ | 521 | $ | 370 | $ | 243 | |||||
Deferred tax assets and liabilities reflect the net tax effects of net operating loss and tax credit carryovers and the temporary differences between the carrying amount of assets and liabilities for financial reporting and the amounts used for income tax purposes. Significant components of the Company's deferred tax assets were as follows for the years ended December 31, 2012 and 2011:
Year Ended December 31, | |||||||
2012 | 2011 | ||||||
Deferred Tax Assets: | |||||||
Net operating loss carryforwards | $ | 44,045 | $ | 48,828 | |||
Tax credit carryforwards | 6,639 | 5,632 | |||||
Research expenditures | 4,567 | 1,035 | |||||
Deferred revenue | 7,726 | 7,545 | |||||
Stock compensation | 2,294 | 1,620 | |||||
Fixed assets | 926 | 523 | |||||
Accruals and other | 3,487 | 1,656 | |||||
Total deferred tax assets | 69,684 | 66,839 | |||||
Deferred Tax Liabilities: | |||||||
Intangibles | (990 | ) | (1,857 | ) | |||
Valuation allowance | (68,694 | ) | (64,982 | ) | |||
Net deferred tax assets | $ | — | $ | — | |||
The Company records net deferred tax assets to the extent that Company believes these assets will more likely than not be realized. In making such determination, the Company considers all available positive and negative evidence, including future reversals of existing taxable temporary differences, projected future taxable income, tax planning strategies and recent financial operations.
Realization of deferred tax assets is dependent upon future earnings, if any, the timing and amount of which are uncertain. Accordingly, the net deferred tax assets have been fully offset by a valuation allowance. The valuation allowance increased by approximately $3,700, $6,400 and $8,200 during the years ended December 31, 2012, 2011 and 2010, respectively. As of December 31, 2012, due to recent net cumulative losses and other negative evidence, a valuation allowance of approximately $4,200 remained on certain non-U.S. deferred tax assets that were not more-likely-than-not to be realized. We evaluate our deferred tax asset valuation allowance position on a quarterly basis. As a result, management believes a reversal of a significant portion of the Company's valuation allowance on non-U.S. deferred tax assets is possible in the next 12 months.
As of December 31, 2012 and 2011, the Company had net operating loss carry-forwards for federal income tax purposes of $120,100 and $115,300, respectively. The amount of federal net-operating loss carry-forwards at December 31,
F-30
Proofpoint, Inc.
Notes to Consolidated Financial Statements (Continued)
(dollars and share amounts in thousands, except per share amounts)
2012 for which a benefit will be recorded in APIC when realized is approximately $7,500. The federal net operating losses will begin to expire in the year 2017. As of December 31, 2012 and 2011, the Company had federal research credit carry-forwards of $3,200 and $3,200 respectively. The federal research and development credits will begin to expire in the year 2022.
As of December 31, 2012 and 2011, the Company had net operating loss carry-forwards for state income tax purposes of approximately $92,400 and $91,400, respectively. The amount of state net-operating loss carry-forwards at December 31, 2012 for which a benefit will be recorded in APIC when realized is approximately $4,100. The state net operating losses will expire in years 2013-2032. As of December 31, 2012 and 2011, the Company had research and development credit carry-forwards for state income tax purpose of $4,700 and $3,800, respectively. The state research and development credits have no expiration period.
As of December 31, 2012 and 2011, the Company had net operating losses carry-forwards in its non-US locations of approximately $4,700 and $8,300, respectively. The non-US net operating loss carry-forwards will begin to expire in the year 2027. In addition, as of December 31, 2012 and 2011, the Company had research and development credit carry-forwards in its non-US locations of approximately $2,400 and $1,800, respectively. The non-US research and development credits will begin to expire in the year 2025.
Utilization of the federal and state net operating losses may be subject to substantial annual limitation due to the ownership change limitations provided by the Internal Revenue Code and similar state provisions. Analyses have been conducted to determine whether an ownership change had occurred since inception. The analyses have indicated that although an ownership change occurred in a prior year, the net operating losses and research and development credits would not expire before utilization as a result of the ownership change. In the event the Company has subsequent changes in ownership, net operating losses and research and development credit carryovers could be limited and may expire unutilized as a result of the subsequent ownership change.
The Company recognizes interest and penalties related to uncertain tax positions within the income tax expense line in the accompanying consolidated statement of operations. Accrued interest and penalties are included within the related tax liability line in the consolidated balance sheet. During the period ended December 31, 2012 the Company accrued interest and penalties of $178 as a component of income tax expense related to tax contingencies and has $183 of interest and penalties recorded as a long term income tax liability as of December 31, 2012. During the period ended December 31, 2011, the Company accrued interest and penalties of $5 as a component of income tax expense related to tax contingencies and had $5 of interest and penalties recorded as a long term income tax liability.
As of December 31, 2012, the Company had recorded unrecognized tax benefits of $255 that if recognized, would benefit the Company's effective tax rate. As of December 31, 2011, the Company had recorded unrecognized tax benefits of $85 that if recognized, would benefit the Company's effective tax rate.
The Company does not anticipate that the amount of unrecognized tax benefits relating to tax positions existing at December 31, 2012 will significantly increase or decrease within the next twelve months.
Because of net operating loss and credit carry-forwards, all of the Company's tax years dating to inception in 2002 remain open to tax examination in all major tax jurisdictions.
The aggregate changes in the balance of gross unrecognized tax benefits were as follows:
F-31
Proofpoint, Inc.
Notes to Consolidated Financial Statements (Continued)
(dollars and share amounts in thousands, except per share amounts)
Beginning balances as of January 1, 2010 | $ | 1,143 | |
Increase in balances related to tax positions taken during the current period | 321 | ||
Ending balance as of December 31, 2010 | 1,464 | ||
Increase in balances related to tax positions taken during the current period | 651 | ||
Increase in balances related to tax positions taken during the prior period | 411 | ||
Ending balance as of December 31, 2011 | 2,526 | ||
Increase in balances related to tax positions taken during the current period | 357 | ||
Decrease in balances related to tax positions taken during the prior period | (135 | ) | |
Decrease in balances related to statute expirations during the current period | $ | (8 | ) |
Ending balance as of December 31, 2012 | $ | 2,740 | |
As of December 31, 2012, $10 of foreign withholding taxes associated with the repatriation of earning of foreign subsidiaries had been provided on $200 of undistributed earnings for a certain foreign subsidiary. The Company intends to reinvest the remainder of its undistributed earnings indefinitely outside the United States. As of December 31, 2012, the Company estimated that no material additional U.S. income taxes would have to be provided if these earnings were repatriated back to the United States as substantially all earnings from its foreign subsidiaries are previously taxed income. As of December 31, 2012, the Company estimated that approximately $530 of foreign withholding tax would have to be provided if these earnings were repatriated back to the United States.
F-32
SIGNATURES
Pursuant to the requirements of Section 13 or 15(d) of the Securities Exchange Act of 1934, the Company has duly caused this report to be signed on its behalf by the undersigned, thereunto duly authorized, on March 14, 2013.
PROOFPOINT INC. | |||
By: | /s/ PAUL AUVIL | ||
Paul Auvil Chief Financial Officer | |||
Pursuant to the requirements of the Securities Exchange Act of 1934, this report has been signed below by the following persons in the capacities and on the date indicated:
Name | Title | Date | ||
* | Chief Executive Officer (principal executive officer) | March 14, 2013 | ||
Gary Steele | ||||
/s/ PAUL AUVIL | Chief Financial Officer (principal financial and accounting officer) | March 14, 2013 | ||
Paul Auvil | ||||
* | Director | March 14, 2013 | ||
Anthony Bettencourt | ||||
* | Director | March 14, 2013 | ||
Dana Evan | ||||
* | Director | March 14, 2013 | ||
Jonathan Feiber | ||||
* | Director | March 14, 2013 | ||
Eric Hahn | ||||
* | Director | March 14, 2013 | ||
Kevin Harvey | ||||
* | Director | March 14, 2013 | ||
Philip Koen | ||||
* | Director | March 14, 2013 | ||
Rob Ward | ||||
*By: | /s/ PAUL AUVIL | |
Paul Auvil Attorney-in-Fact | ||
S-1
EXHIBIT INDEX
Incorporated by Reference | Filed | ||||||||||||
Exhibit Number | Exhibit Title | Form | File No. | Filing Date | Exhibit No. | Herewith | |||||||
3.01 | Amended and Restated Certificate of Incorporation of the Registrant. | S-1A | 333-178479 | April 9, 2012 | 3.02 | ||||||||
3.02 | Amended and Restated Bylaws of the Registrant. | S-1A | 333-178479 | April 9, 2012 | 3.04 | ||||||||
4.01 | Form of Registrant's common stock certificate. | S-1A | 333-178479 | April 9, 2012 | 4.01 | ||||||||
4.02 | Fourth Amended and Restated Investors' Rights Agreement by and among the Registrant and the investors named therein of the Registrant dated February 19, 2008. | S-1 | 333-178479 | December 14, 2011 | 4.02 | ||||||||
10.01 | Form of Indemnity Agreement. | S-1A | 333-178479 | April 9, 2012 | 10.01 | ||||||||
10.02 | † | 2002 Stock Option/Stock Issuance Plan and form of option grant. | S-1A | 333-178479 | April 9, 2012 | 10.02 | |||||||
10.03 | † | 2012 Equity Incentive Plan and form of grant agreements. | S-1A | 333-178479 | April 9, 2012 | 10.03 | |||||||
10.04 | † | 2012 Employee Stock Purchase Plan. | S-1A | 333-178479 | April 9, 2012 | 10.04 | |||||||
10.05 | Lease Agreement between Registrant and Hines VAF No Cal Properties, L.P., dated as of March 28, 2011, as amended July 28, 2011. | S-1 | 333-178479 | December 14, 2011 | 10.05 | ||||||||
10.06 | Loan and Security Agreement, dated as of April 19, 2011, as amended May 19, 2011, between the Registrant and Silicon Valley Bank. | S-1 | 333-178479 | December 14, 2011 | 10.06 | ||||||||
10.07 | † | Offer Letter to Gary Steele from the Registrant, dated November 17, 2002. | S-1 | 333-178479 | December 14, 2011 | 10.07 | |||||||
10.08 | † | Offer letter to Paul Auvil from the Registrant, dated March 9, 2007. | S-1A | 333-178479 | January 25, 2012 | 10.08 | |||||||
10.09 | † | Offer Letter to David Knight from the Registrant, dated March 14, 2011. | S-1A | 333-178479 | January 25, 2012 | 10.11 | |||||||
10.12 | † | Proofpoint Executive Bonus Plan—FY 2012. | 10-K | 001-35506 | March 8, 2013 | 10.12 | |||||||
21.01 | Subsidiaries of Registrant. | 10-K | 001-35506 | March 8, 2013 | 21.01 | ||||||||
23.01 | Consent of PricewaterhouseCoopers LLP, independent registered public accounting firm. | 10-K | 001-35506 | March 8, 2013 | 23..01 | ||||||||
31.01 | Certification of Chief Executive Officer Pursuant to Rule 13-a-14 of the Securities Exchange Act of 1934, as Adopted Pursuant to Section 302 of the Sarbanes-Oxley Act of 2002. | X | |||||||||||
31.02 | Certification of Chief Financial Officer Pursuant to Rule 13-a-14 of the Securities Exchange Act of 1934, as Adopted Pursuant to Section 302 of the Sarbanes-Oxley Act of 2002. | X | |||||||||||
32.01 | * | Certification of Chief Executive Officer Pursuant to 18 U.S.C. Section 1350 as Adopted Pursuant to Section 906 of the Sarbanes-Oxley Act of 2002. | X | ||||||||||
32.02 | * | Certification of Chief Financial Officer Pursuant to 18 U.S.C. Section 1350 as Adopted Pursuant to Section 906 of the Sarbanes-Oxley Act of 2002. | X | ||||||||||
101.INS | * | XBRL Instance Document | 10-K | 001-35506 | March 8, 2013 | 101.INS | |||||||
101.SCH | * | XBRL Taxonomy Extension Schema Document | 10-K | 001-35506 | March 8, 2013 | 101.SCH | |||||||
101.CAL | * | XBRL Taxonomy Extension Calculation Linkbase Document | 10-K | 001-35506 | March 8, 2013 | 101.CAL | |||||||
101.DEF | * | XBRL Taxonomy Extension Definition Linkbase Document | 10-K | 001-35506 | March 8, 2013 | 101.DEF | |||||||
101.LAB | * | XBRL Taxonomy Extension Label Linkbase Document | 10-K | 001-35506 | March 8, 2013 | 101.LAB | |||||||
101.PRE | * | XBRL Taxonomy Extension Presentation Linkbase Document | 10-K | 001-35506 | March 8, 2013 | 101.PRE | |||||||
____________________________________________________________________
† Indicates a management contract or compensatory plan.
*As contemplated by SEC Release No. 33-8212, these exhibits are furnished with this Annual Report on Form 10-K and are not deemed filed with the Securities and Exchange Commission and are not incorporated by reference in any filing of Proofpoint, Inc. under the Securities Act of 1933 or the Exchange Act of 1934, whether made before or after the date hereof and irrespective of any general incorporation language in such filings.