Attached files
| file | filename |
|---|---|
| 8-K - FORM 8-K - OCWEN FINANCIAL CORP | ocn_8k.htm |
Exhibit 99.1
Investor Presentation March 2013 © 2013 Ocwen Financial Corporation. All rights reserved.
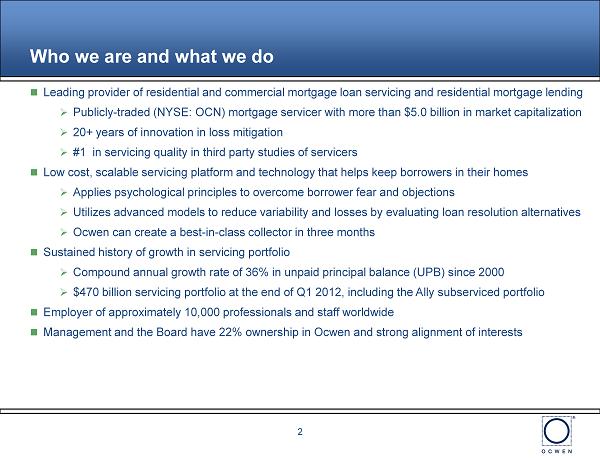
2 Who we are and what we do Leading provider of residential and commercial mortgage loan servicing and residential mortgage lending » Publicly - traded (NYSE: OCN ) mortgage servicer with more than $5.0 billion in market capitalization » 20 + years of innovation in loss mitigation » #1 in servicing quality in third party studies of servicers Low cost, scalable servicing platform and technology that helps keep borrowers in their homes » Applies psychological principles to overcome borrower fear and objections » Utilizes advanced models to reduce variability and losses by evaluating loan resolution alternatives » Ocwen can create a best - in - class collector in three months Sustained history of growth in servicing portfolio » Compound annual growth rate of 36% in unpaid principal balance (UPB) since 2000 » $470 billion servicing portfolio at the end of Q1 2012, including the Ally subserviced portfolio Employer of approximately 10,000 professionals and staff worldwide Management and the Board have 22% ownership in Ocwen and strong alignment of interests
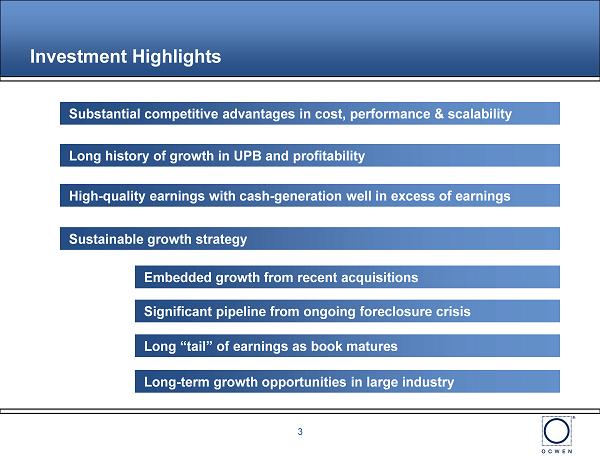
High - quality earnings with cash - generation well in excess of earnings Investment Highlights 3 Embedded growth from recent acquisitions Substantial competitive advantages in cost, performance & scalability Significant pipeline from ongoing foreclosure crisis Long history of growth in UPB and profitability Long - term growth opportunities in large industry Long “tail” of earnings as book matures Sustainable growth strategy
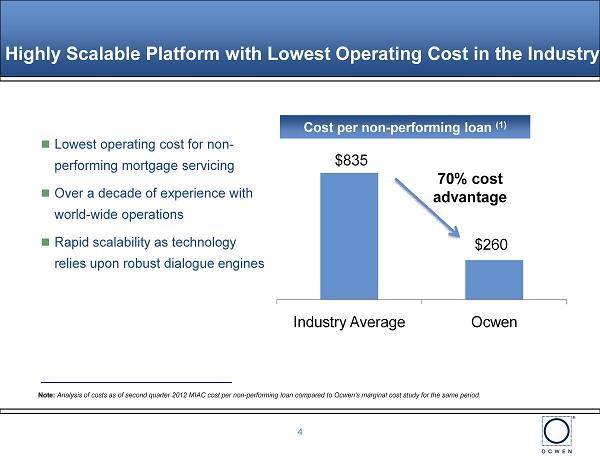
$835 $260 Industry Average Ocwen Highly Scalable Platform with Lowest Operating Cost in the Industry 4 4 Lowest operating cost for non - performing mortgage servicing Over a decade of experience with world - wide operations Rapid scalability as technology relies upon robust dialogue engines Cost per non - performing loan (1) 70% cost advantage Note: Analysis of costs as of second quarter 2012 MIAC cost per non - performing loan compared to Ocwen's marginal cost study for the sa me period.
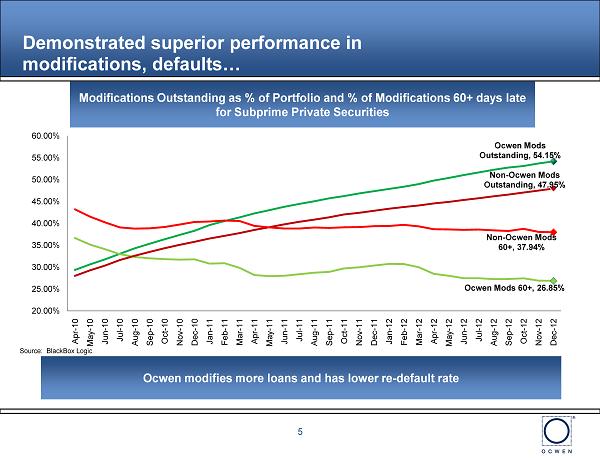
Modifications Outstanding as % of Portfolio and % of Modifications 60+ days late for Subprime Private Securities Source: BlackBox Logic Demonstrated superior performance in modifications, defaults… Ocwen modifies more loans and has lower re - default rate 5 Ocwen Mods Outstanding, 54.15% Ocwen Mods 60+, 26.85% Non - Ocwen Mods Outstanding, 47.95% Non - Ocwen Mods 60+, 37.94% 20.00% 25.00% 30.00% 35.00% 40.00% 45.00% 50.00% 55.00% 60.00% Apr - 10 May - 10 Jun - 10 Jul - 10 Aug - 10 Sep - 10 Oct - 10 Nov - 10 Dec - 10 Jan - 11 Feb - 11 Mar - 11 Apr - 11 May - 11 Jun - 11 Jul - 11 Aug - 11 Sep - 11 Oct - 11 Nov - 11 Dec - 11 Jan - 12 Feb - 12 Mar - 12 Apr - 12 May - 12 Jun - 12 Jul - 12 Aug - 12 Sep - 12 Oct - 12 Nov - 12 Dec - 12
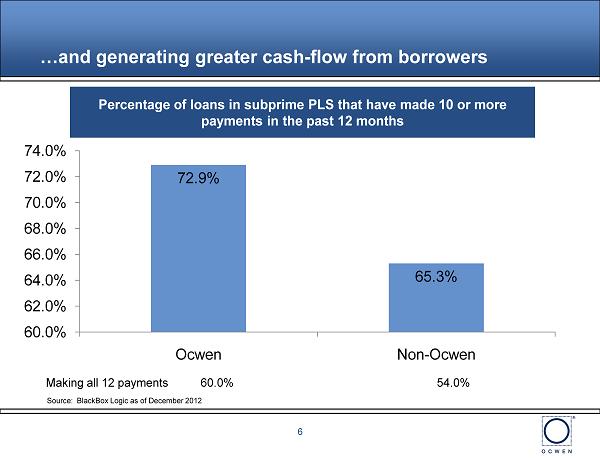
…and generating greater cash - flow from borrowers Source: BlackBox Logic as of December 2012 Percentage of loans in subprime PLS that have made 10 or more payments in the past 12 months Making all 12 payments 60.0% 54.0% 72.9% 65.3% 60.0% 62.0% 64.0% 66.0% 68.0% 70.0% 72.0% 74.0% Ocwen Non - Ocwen 6
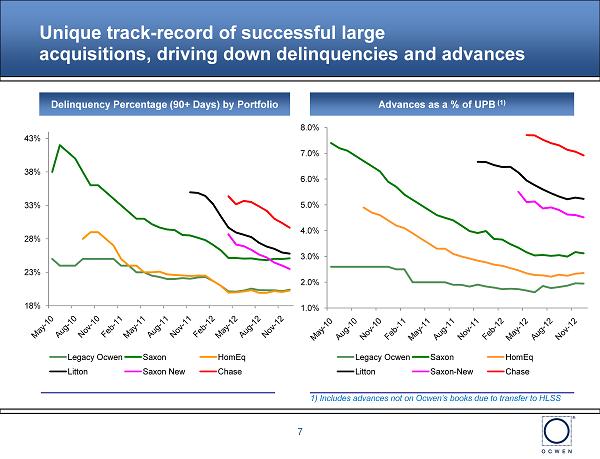
7 Advances as a % of UPB (1) Delinquency Percentage (90+ Days) by Portfolio Unique track - record of successful large acquisitions, driving down delinquencies and advances 1) Includes advances not on Ocwen’s books due to transfer to HLSS 18% 23% 28% 33% 38% 43% Legacy Ocwen Saxon HomEq Litton Saxon New Chase 1.0% 2.0% 3.0% 4.0% 5.0% 6.0% 7.0% 8.0% Legacy Ocwen Saxon HomEq Litton Saxon - New Chase
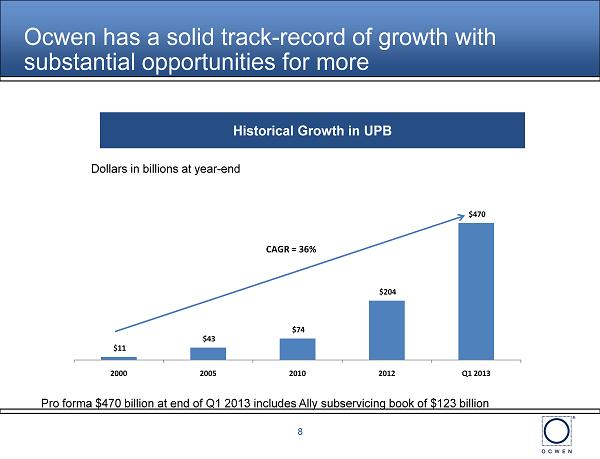
Historical Growth in UPB Dollars in billions at year - end Pro forma $470 billion at end of Q1 2013 includes Ally subservicing book of $123 billion Ocwen has a solid track - record of growth with substantial opportunities for more $11 $43 $74 $204 $470 2000 2005 2010 2012 Q1 2013 CAGR = 36% 8
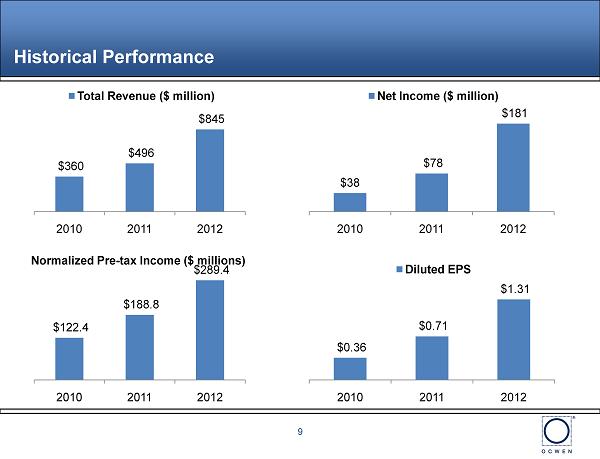
Historical Performance $360 $496 $845 2010 2011 2012 Total Revenue ($ million) $38 $78 $181 2010 2011 2012 Net Income ($ million) $122.4 $188.8 $289.4 2010 2011 2012 Normalized Pre - tax Income ($ millions) $0.36 $0.71 $1.31 2010 2011 2012 Diluted EPS 9
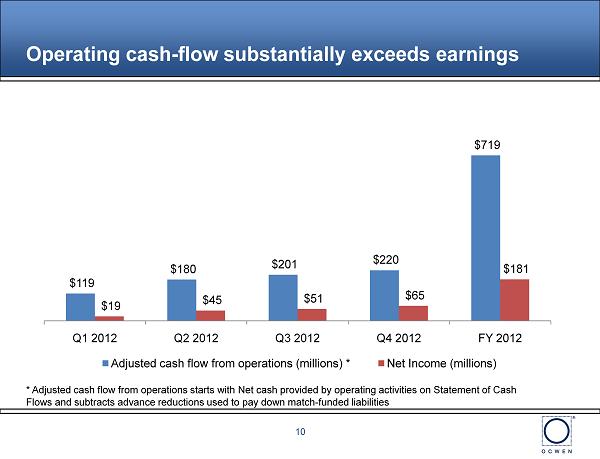
* Adjusted cash flow from operations starts with Net cash provided by operating activities on Statement of Cash Flows and subtracts advance reductions used to pay down match - funded liabilities Operating cash - flow substantially exceeds earnings 10 $119 $180 $201 $220 $719 $19 $45 $51 $65 $181 Q1 2012 Q2 2012 Q3 2012 Q4 2012 FY 2012 Adjusted cash flow from operations (millions) * Net Income (millions)
Strong operations and conservative accounting OPERATIONS - As advances are collected, it frees substantial cash in the form of equity supporting the financing – in 2012 OCN collected over $1.4 billion in advances, including $346 million of equity in those advances TIMING DIFFERENCES Things we do that defer earnings » Delinquent servicing fees booked when collected, not accrued – over $452 million at the end of 2012 » Amortization of servicing higher than actual CPR – fair value of MSRs was $78 million higher than carrying value at year - end Things we do not do that would accelerate earnings » Almost no “gain - on - sale” earnings or mark - to - market earnings on MSRs » Advances purchased at a discount not booked as earnings when collected, but amortized over life of MSR 11
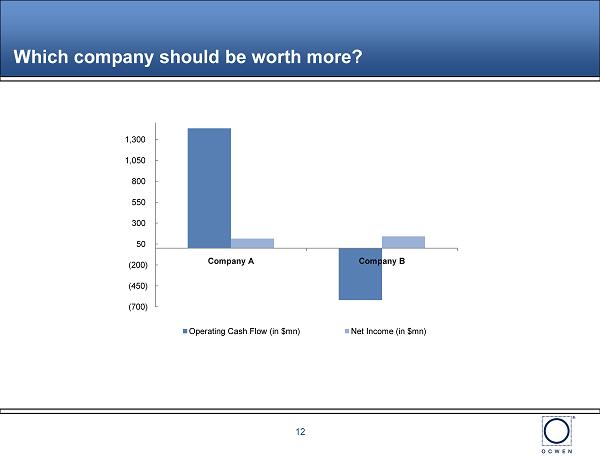
Which company should be worth more? 12 (700) (450) (200) 50 300 550 800 1,050 1,300 Company A Company B Operating Cash Flow (in $mn) Net Income (in $mn)
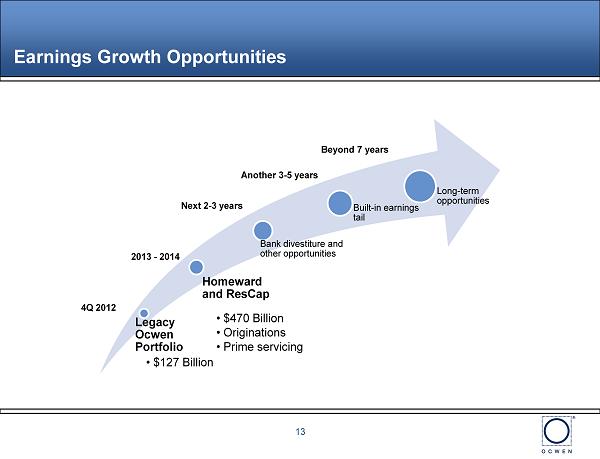
Earnings Growth Opportunities Legacy Ocwen Portfolio Homeward and ResCap Bank divestiture and other opportunities Built - in earnings tail Long - term opportunities 4Q 2012 2013 - 2014 Next 2 - 3 years Another 3 - 5 years Beyond 7 years • $127 Billion • $470 Billion • Originations • Prime servicing 13
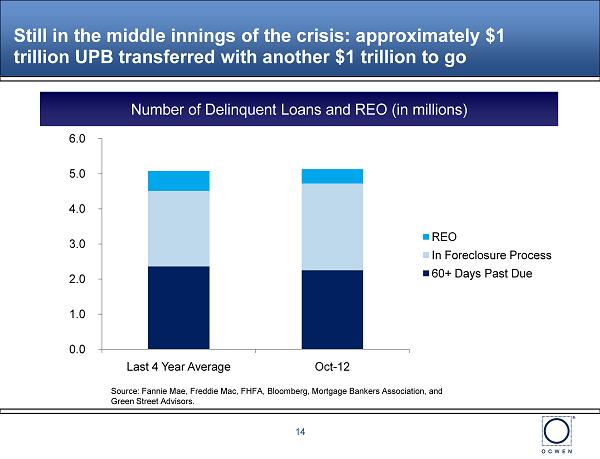
Still in the middle innings of the crisis: approximately $1 trillion UPB transferred with another $1 trillion to go Source: Fannie Mae, Freddie Mac, FHFA, Bloomberg, Mortgage Bankers Association, and Green Street Advisors. 0.0 1.0 2.0 3.0 4.0 5.0 6.0 Last 4 Year Average Oct - 12 REO In Foreclosure Process 60+ Days Past Due Number of Delinquent Loans and REO (in millions) 14
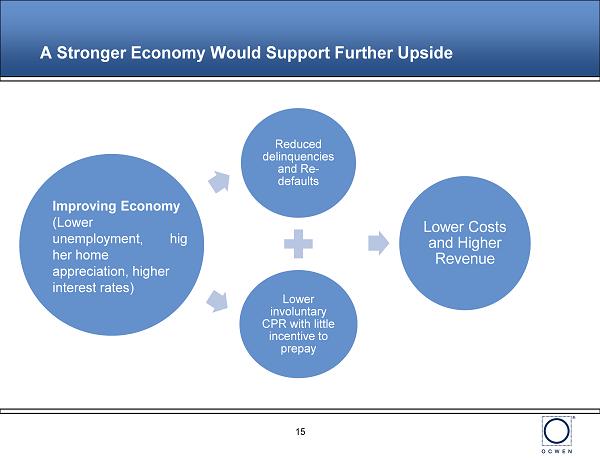
15 A Stronger Economy Would Support Further Upside Reduced delinquencies and Re - defaults Lower involuntary CPR with little incentive to prepay Lower Costs and Higher Revenue Improving Economy (Lower unemployment, hig her home appreciation, higher interest rates)
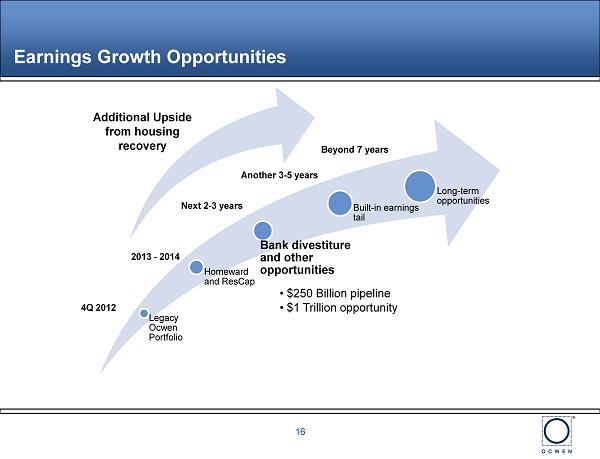
Earnings Growth Opportunities Legacy Ocwen Portfolio Homeward and ResCap Bank divestiture and other opportunities Built - in earnings tail Long - term opportunities 4Q 2012 2013 - 2014 Next 2 - 3 years Another 3 - 5 years Beyond 7 years • $250 Billion pipeline • $1 Trillion opportunity Additional Upside from housing recovery 16
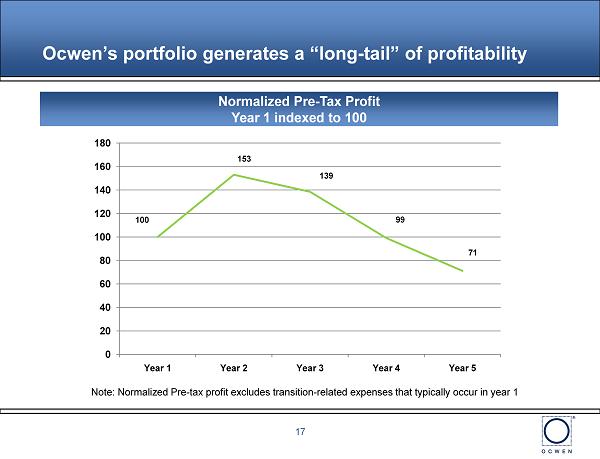
Ocwen’s portfolio generates a “long - tail” of profitability Note: Normalized Pre - tax profit excludes transition - related expenses that typically occur in year 1 17 Normalized Pre - Tax Profit Year 1 indexed to 100 100 153 139 99 71 0 20 40 60 80 100 120 140 160 180 Year 1 Year 2 Year 3 Year 4 Year 5
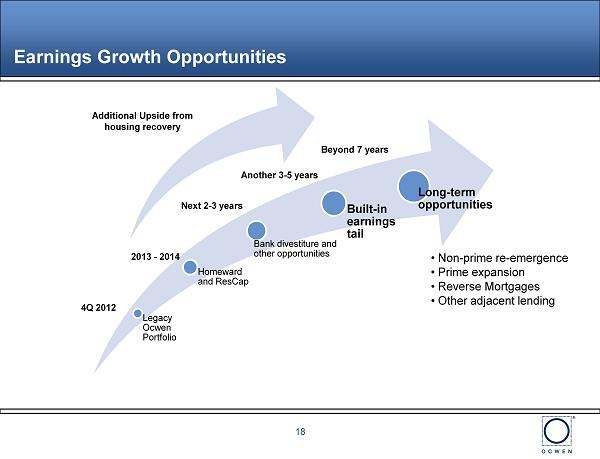
Earnings Growth Opportunities Legacy Ocwen Portfolio Homeward and ResCap Bank divestiture and other opportunities Built - in earnings tail Long - term opportunities 4Q 2012 2013 - 2014 Next 2 - 3 years Another 3 - 5 years Beyond 7 years • Non - prime re - emergence • Prime expansion • Reverse Mortgages • Other adjacent lending Additional Upside from housing recovery 18

High - quality earnings with cash - generation well in excess of earnings Investment Highlights 19 Embedded growth from recent acquisitions Substantial competitive advantages in cost, performance & scalability Significant pipeline from ongoing foreclosure crisis Long history of growth in UPB and profitability Long - term growth opportunities in large industry Long “tail” of earnings as book matures Sustainable growth strategy
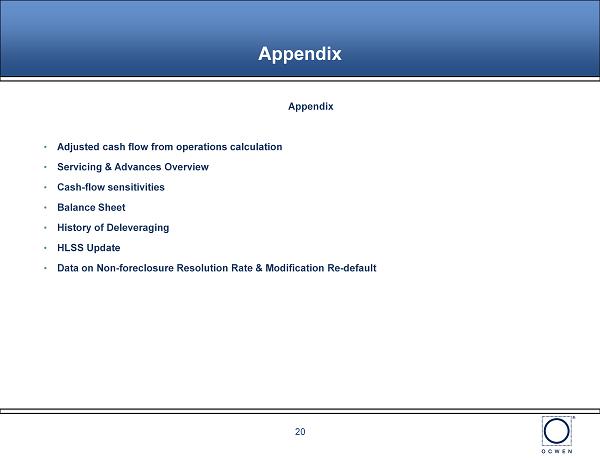
20 Appendix • Adjusted cash flow from operations calculation • Servicing & Advances Overview • Cash - flow sensitivities • Balance Sheet • History of Deleveraging • HLSS Update • Data on Non - foreclosure Resolution Rate & Modification Re - default Appendix
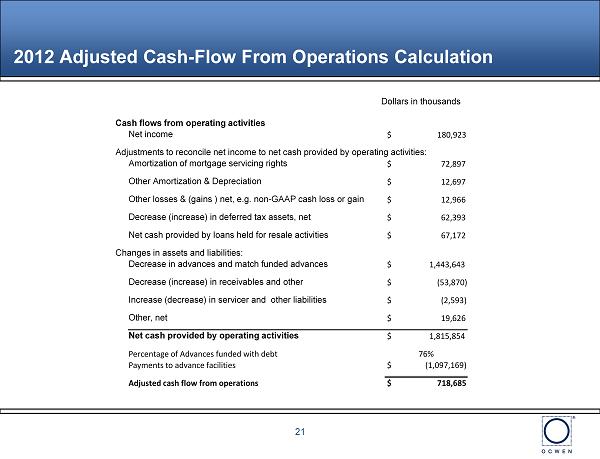
Adjusted Cash - Flow From Operations Calculation 21 Cash flows from operating activities Net income $ 180,923 Adjustments to reconcile net income to net cash provided by operating activities: Amortization of mortgage servicing rights $ 72,897 Other Amortization & Depreciation $ 12,697 Other losses & (gains ) net , e.g. non - GAAP cash losss or gain $ 12,966 Decrease (increase) in deferred tax assets, net $ 62,393 Net cash provided by loans held for resale activities $ 67,172 Changes in assets and liabilities: Decrease in advances and match funded advances $ 1,443,643 Decrease (increase) in receivables and other $ (53,870) Increase (decrease) in servicer and other liabilities $ (2,593) Other, net $ 19,626 Net cash provided by operating activities $ 1,815,854 Percentage of Advances funded with debt 76% Payments to advance facilities $ (1,097,169) Adjusted cash flow from operations $ 718,685 Dollars in thousands
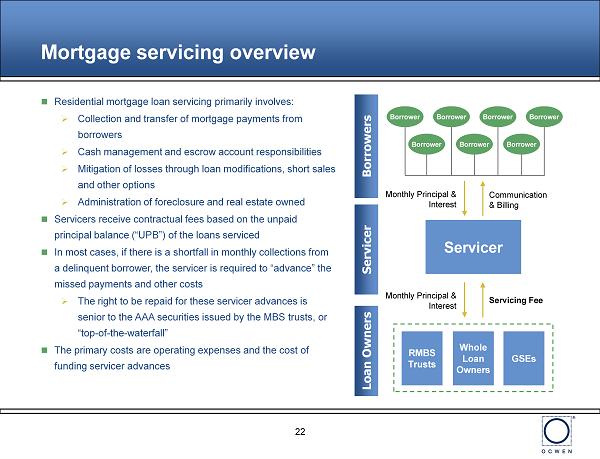
22 Mortgage servicing overview Residential mortgage loan servicing primarily involves: » Collection and transfer of mortgage payments from borrowers » Cash management and escrow account responsibilities » Mitigation of losses through loan modifications, short sales and other options » Administration of foreclosure and real estate owned Servicers receive contractual fees based on the unpaid principal balance (“UPB”) of the loans serviced In most cases, if there is a shortfall in monthly collections from a delinquent borrower, the servicer is required to “advance” the missed payments and other costs » The right to be repaid for these servicer advances is senior to the AAA securities issued by the MBS trusts, or “top - of - the - waterfall” The primary costs are operating expenses and the cost of funding servicer advances Borrowers Servicer Loan Owners Servicer Borrower Borrower Borrower Borrower Borrower Borrower Borrower Monthly Principal & Interest Communication & Billing Monthly Principal & Interest Servicing Fee GSEs RMBS Trusts Whole Loan Owners
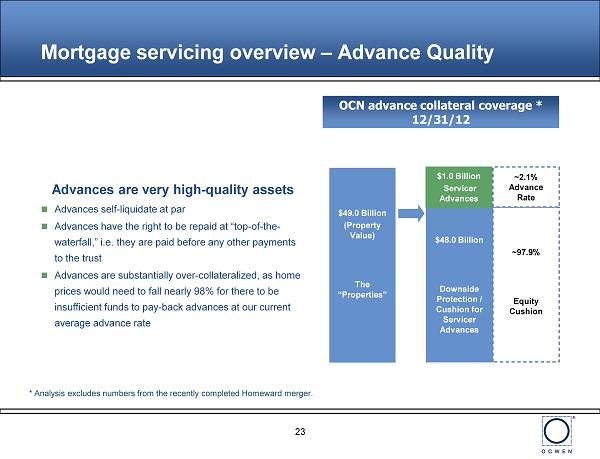
23 Mortgage servicing overview – Advance Quality Advances are very high - quality assets Advances self - liquidate at par Advances have the right to be repaid at “top - of - the - waterfall,” i.e. they are paid before any other payments to the trust Advances are substantially over - collateralized, as home prices would need to fall nearly 98% for there to be insufficient funds to pay - back advances at our current average advance rate OCN advance collateral coverage * 12/31/12 $49.0 Billion (Property Value) The “Properties” ~ 97.9% Equity Cushion $48.0 Billion Downside Protection / Cushion for Servicer Advances ~2.1% Advance Rate $1.0 Billion Servicer Advances * Analysis excludes numbers from the recently completed Homeward merger.
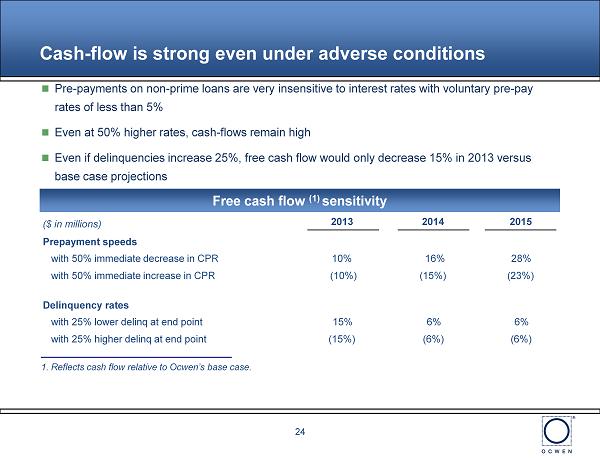
Cash - flow is strong even under adverse conditions 24 24 Pre - payments on non - prime loans are very insensitive to interest rates with voluntary pre - pay rates of less than 5% Even at 50% higher rates, cash - flows remain high Even if delinquencies increase 25%, free cash flow would only decrease 15% in 2013 versus base case projections 1. Reflects cash flow relative to Ocwen’s base case. Free cash flow (1) sensitivity ($ in millions) 2013 2014 2015 Prepayment speeds with 50% immediate decrease in CPR 10% 16% 28% with 50% immediate increase in CPR (10%) (15%) (23%) Delinquency rates with 25% lower delinq at end point 15% 6% 6% with 25% higher delinq at end point (15%) (6%) (6%)
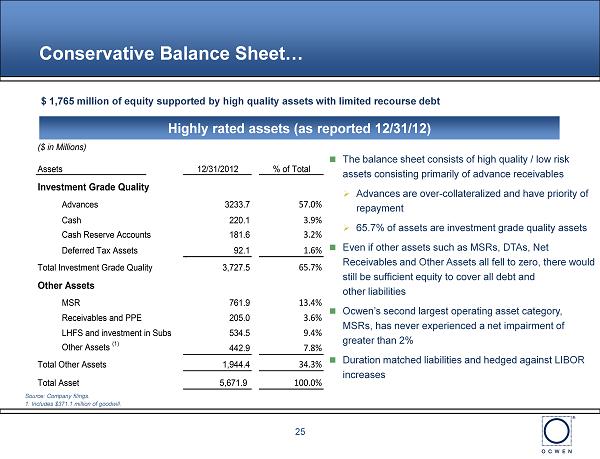
Conservative Balance Sheet… 25 Highly rated assets (as reported 12/31/12 ) $ 1,765 million of equity supported by high quality assets with limited recourse debt The balance sheet consists of high quality / low risk assets consisting primarily of advance receivables » Advances are over - collateralized and have priority of repayment » 65.7% of assets are investment grade quality assets Even if other assets such as MSRs, DTAs, Net Receivables and Other Assets all fell to zero, there would still be sufficient equity to cover all debt and other liabilities Ocwen’s second largest operating asset category, MSRs, has never experienced a net impairment of greater than 2% Duration matched liabilities and hedged against LIBOR increases Source: Company filings. 1. Includes $371.1 million of goodwill. ($ in Millions) Assets 12/31/2012 % of Total Investment Grade Quality Advances 3233.7 57.0% Cash 220.1 3.9% Cash Reserve Accounts 181.6 3.2% Deferred Tax Assets 92.1 1.6% . . Total Investment Grade Quality 3,727.5 65.7% Other Assets MSR 761.9 13.4% Receivables and PPE 205.0 3.6% LHFS and investment in Subs 534.5 9.4% Other Assets (1) 442.9 7.8% Total Other Assets 1,944.4 34.3% Total Asset 5,671.9 100.0%
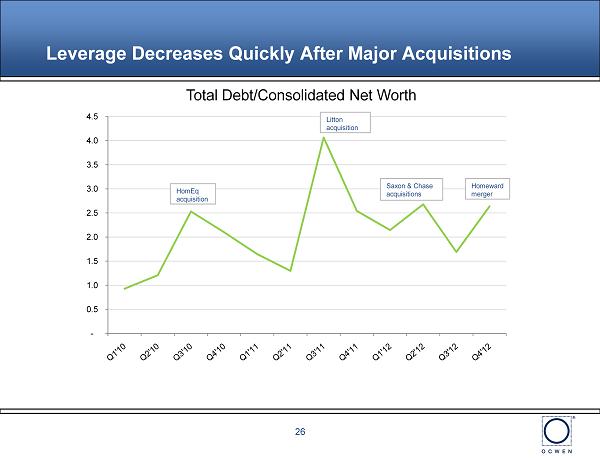
Leverage Decreases Quickly After Major Acquisitions 26 - 0.5 1.0 1.5 2.0 2.5 3.0 3.5 4.0 4.5 Litton acquisition Saxon & Chase acquisitions Homeward merger HomEq acquisition Total Debt/Consolidated Net Worth
27 On December 24, 2012, HLSS completed a successful follow - on equity offering raising $462 million at a share price of $ 19, up from the $14 price of the initial offering – the offering was substantially over - subscribed. We expect that HLSS should be able to continue raising funds to purchase assets from Ocwen On December 26, HLSS used most of the proceeds to purchase rights to approximately $34.6 billion in MSRs and related advances from Ocwen The effective cost of these funds is well below our capital return expectations for Ocwen, leading to improved returns to Ocwen shareholders Net income will fall as a result of these deals Required equity is expected to fall by more, increasing potential returns available to shareholders Further significant HLSS purchases are expected in near term, which will bolster our cash position for the acquisitions HLSS has been able to effectively tap both equity and debt markets in the recent past. We expect the benefit to be passed to us resulting in lower expense levels HLSS Transaction Update
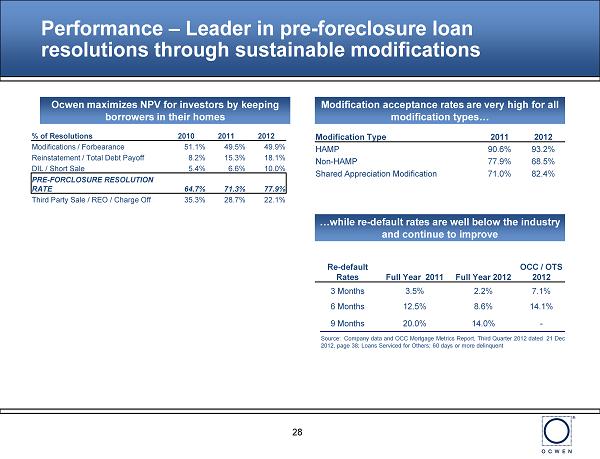
28 Performance – Leader in pre - foreclosure loan resolutions through sustainable modifications Ocwen maximizes NPV for investors by keeping borrowers in their homes Modification acceptance rates are very high for all modification types… Modification Type 2011 2012 HAMP 90.6% 93.2% Non - HAMP 77.9% 68.5% Shared Appreciation Modification 71.0% 82.4% …while re - default rates are well below the industry and continue to improve Re - default Rates Full Year 2011 Full Year 2012 OCC / OTS 2012 3 Months 3.5% 2.2% 7.1% 6 Months 12.5% 8.6% 14.1% 9 Months 20.0% 14.0% - Source: Company data and OCC Mortgage Metrics Report, Third Quarter 2012 dated 21 Dec 2012, page 38; Loans Serviced for Others; 60 days or more delinquent % of Resolutions 2010 2011 2012 Modifications / Forbearance 51.1% 49.5% 49.9% Reinstatement / Total Debt Payoff 8.2% 15.3% 18.1% DIL / Short Sale 5.4% 6.6% 10.0% PRE - FORCLOSURE RESOLUTION RATE 64.7% 71.3% 77.9% Third Party Sale / REO / Charge Off 35.3% 28.7% 22.1%