Attached files
| file | filename |
|---|---|
| 8-K - FORM 8-K - VIAD CORP | d500736d8k.htm |
Exhibit 99

| Investor Presentation Credit Suisse Global Services Conference - March 12, 2013 |
| 2 Forward Looking Statements As provided by the safe harbor provision under the Private Securities Litigation Reform Act of 1995, Viad cautions readers that, in addition to historical information contained herein, this presentation includes certain information, assumptions and discussions that may constitute forward-looking statements. These forward-looking statements are not historical facts, but reflect current estimates, projections, expectations, or trends concerning future growth, operating cash flows, availability of short-term borrowings, consumer demand, new or renewal business, investment policies, productivity improvements, ongoing cost reduction efforts, efficiency, competitiveness, legal expenses, tax rates and other tax matters, foreign exchange rates, and the realization of restructuring cost savings. Actual results could differ materially from those discussed in the forward-looking statements. Viad's businesses can be affected by a host of risks and uncertainties. Among other things, natural disasters, gains and losses of customers, consumer demand patterns, labor relations, purchasing decisions related to customer demand for exhibition and event services, existing and new competition, industry alliances, consolidation and growth patterns within the industries in which Viad competes, acquisitions, capital allocations, adverse developments in liabilities associated with discontinued operations and any deterioration in the economy, may individually or in combination impact future results. In addition to factors mentioned elsewhere, economic, competitive, governmental, technological, capital marketplace and other factors, including terrorist activities or war, a pandemic health crisis and international conditions, could affect the forward-looking statements in this press release. Additional information concerning business and other risk factors that could cause actual results to materially differ from those in the forward-looking statements can be found in Viad's annual and quarterly reports filed with the Securities and Exchange Commission. Information about Viad Corp obtained from sources other than the company may be out-of-date or incorrect. Please rely only on company press releases, SEC filings and other information provided by the company, keeping in mind that forward-looking statements speak only as of the date made. Viad undertakes no obligation to update any forward-looking statements, including prior forward-looking statements, to reflect events or circumstances arising after the date as of which the forward-looking statements were made. |

| Company Overview 3 |
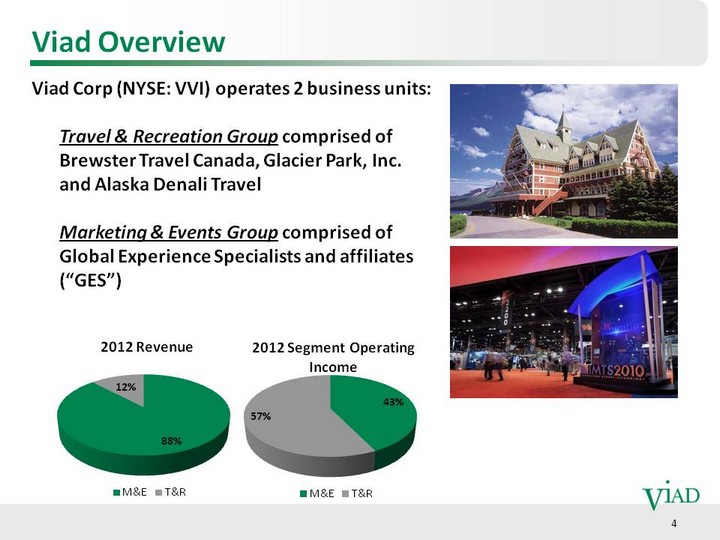
| 4 Viad Overview Viad Corp (NYSE: VVI) operates 2 business units: Travel & Recreation Group comprised of Brewster Travel Canada, Glacier Park, Inc. and Alaska Denali Travel Marketing & Events Group comprised of Global Experience Specialists and affiliates ("GES") ("GES") ("GES") ("GES") ("GES") ("GES") ("GES") ("GES") (CHART) (CHART) |
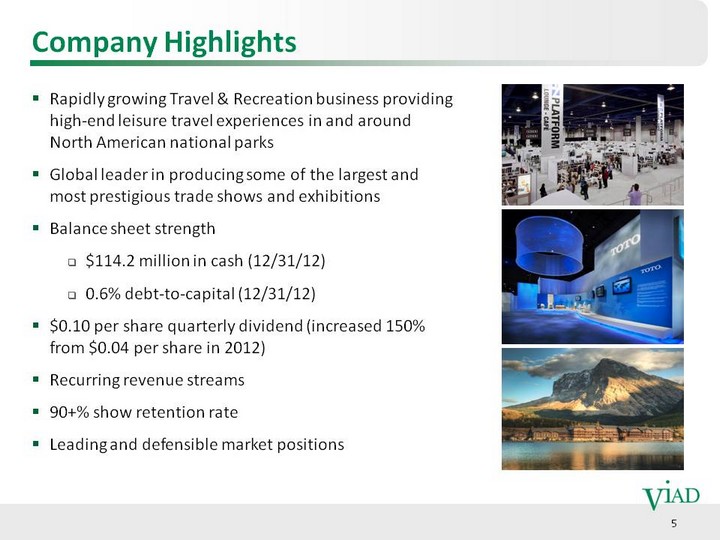
| 5 Company Highlights Rapidly growing Travel & Recreation business providing high-end leisure travel experiences in and around North American national parks Global leader in producing some of the largest and most prestigious trade shows and exhibitions Balance sheet strength $114.2 million in cash (12/31/12) 0.6% debt-to-capital (12/31/12) $0.10 per share quarterly dividend (increased 150% from $0.04 per share in 2012) Recurring revenue streams 90+% show retention rate Leading and defensible market positions |
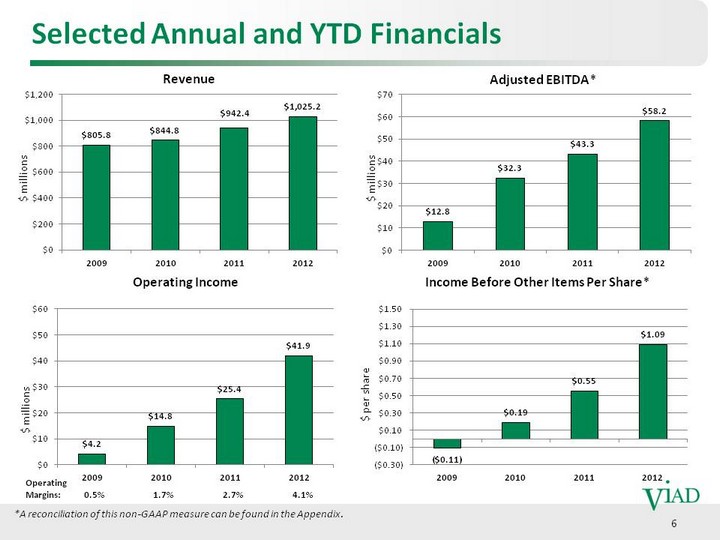
| 6 Selected Annual and YTD Financials Revenue (CHART) Operating Income (CHART) Income Before Other Items Per Share* (CHART) Adjusted EBITDA* (CHART) $ millions $ millions $ millions $ per share *A reconciliation of this non-GAAP measure can be found in the Appendix. Operating Margins: 0.5% 1.7% 2.7% 4.1% |

| Travel & Recreation Group 7 |
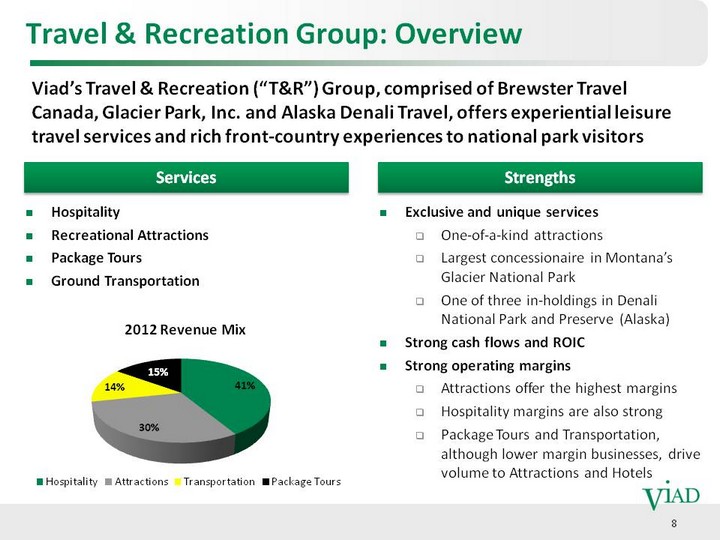
| Viad's Travel & Recreation ("T&R") Group, comprised of Brewster Travel Canada, Glacier Park, Inc. and Alaska Denali Travel, offers experiential leisure travel services and rich front-country experiences to national park visitors Travel & Recreation Group: Overview 8 Hospitality Recreational Attractions Package Tours Ground Transportation Services Strengths Exclusive and unique services One-of-a-kind attractions Largest concessionaire in Montana's Glacier National Park One of three in-holdings in Denali National Park and Preserve (Alaska) Strong cash flows and ROIC Strong operating margins Attractions offer the highest margins Hospitality margins are also strong Package Tours and Transportation, although lower margin businesses, drive volume to Attractions and Hotels (CHART) |
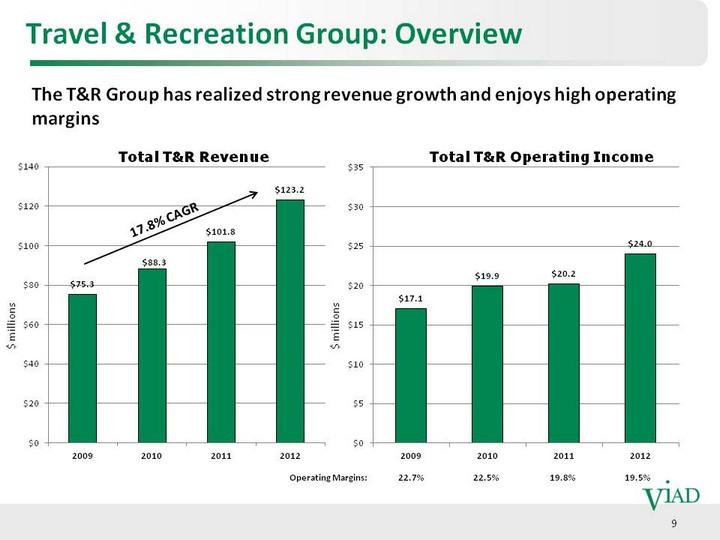
| The T&R Group has realized strong revenue growth and enjoys high operating margins Travel & Recreation Group: Overview (CHART) Total T&R Revenue (CHART) Total T&R Operating Income Operating Margins: 22.7% 22.5% 19.8% 19.5% 9 $ millions $ millions 17.8% CAGR |
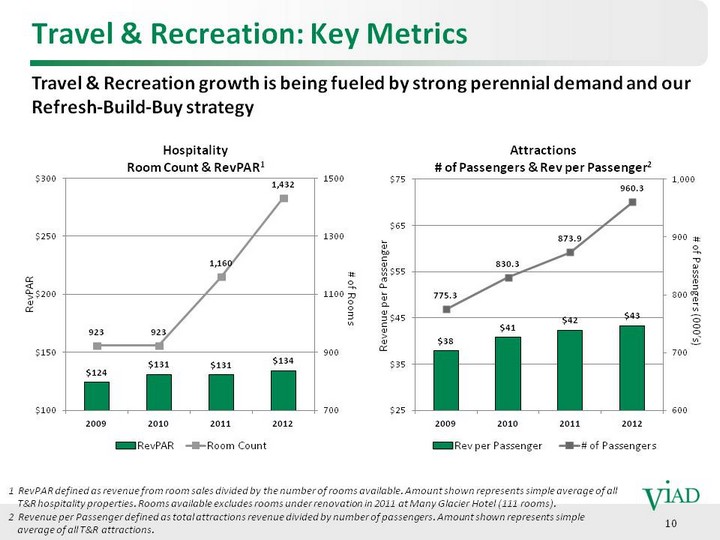
| 10 Travel & Recreation: Key Metrics RevPAR # of Rooms 2 Revenue per Passenger defined as total attractions revenue divided by number of passengers. Amount shown represents simple average of all T&R attractions. 1 RevPAR defined as revenue from room sales divided by the number of rooms available. Amount shown represents simple average of all T&R hospitality properties. Rooms available excludes rooms under renovation in 2011 at Many Glacier Hotel (111 rooms). Attractions # of Passengers & Rev per Passenger2 Revenue per Passenger (CHART) # of Passengers (000's) Travel & Recreation growth is being fueled by strong perennial demand and our Refresh-Build-Buy strategy |
| 11 Travel & Recreation: Asset Acquisition Criteria "Buy right" - location, asset, price, ROIC and terms Significant opportunity to add value to acquired assets Leverage economies of scale - e.g., leveraging our major suppliers, such as our service supplier, to lower the cost of purchases, leveraging G&A expenses Leverage economies of scope - e.g., cross-sell overnight guests into high margin recreational attractions; cross-sell visitors at one attraction to add on another attraction; utilize our extensive sales and marketing network to drive higher occupancy & RevPAR at acquired hotels Improve lodging amenities leading to enhanced visitor experience Apply Travel & Recreation professional facilities management to increase efficiency / asset productivity |

| Travel & Recreation: New Attraction Build 12 The Glacier Skywalk will be a stunning world-class attraction in Jasper National Park that will provide an immersive interpretive guided experience focusing on the unique ecosystem, glaciology, natural and aboriginal history of the Columbia Icefield area |
| Travel & Recreation: GNP Concession Contract Glacier Park, Inc. ("GPI") has been the chosen concessionaire in Glacier National Park ("GNP") since 1980 Concession contract covers all services provided by GPI within GNP 510 out of 1,015 total rooms in the GNP area are operated under the concession contract Concession contract was set to expire on 12/31/05 but has been extended on a year- to-year basis through 12/31/13 The prospectus was announced by the park service on 12/14/12; bids are due in April of 2013 The term of the new contract is 16 years Viad is well-positioned for contract bid process* * Company would receive its possessory interest of $25 million and the value of personal property used in connection with the in-Park concession business if the Company were not awarded the new contract. 13 |

| Marketing & Events Group |
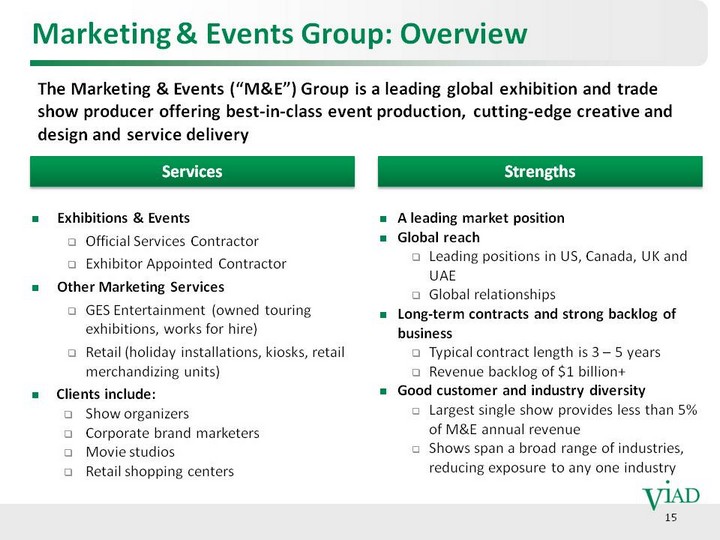
| 15 Marketing & Events Group: Overview The Marketing & Events ("M&E") Group is a leading global exhibition and trade show producer offering best-in-class event production, cutting-edge creative and design and service delivery Exhibitions & Events Official Services Contractor Exhibitor Appointed Contractor Other Marketing Services GES Entertainment (owned touring exhibitions, works for hire) Retail (holiday installations, kiosks, retail merchandizing units) Clients include: Show organizers Corporate brand marketers Movie studios Retail shopping centers Services Strengths A leading market position Global reach Leading positions in US, Canada, UK and UAE Global relationships Long-term contracts and strong backlog of business Typical contract length is 3 - 5 years Revenue backlog of $1 billion+ Good customer and industry diversity Largest single show provides less than 5% of M&E annual revenue Shows span a broad range of industries, reducing exposure to any one industry |
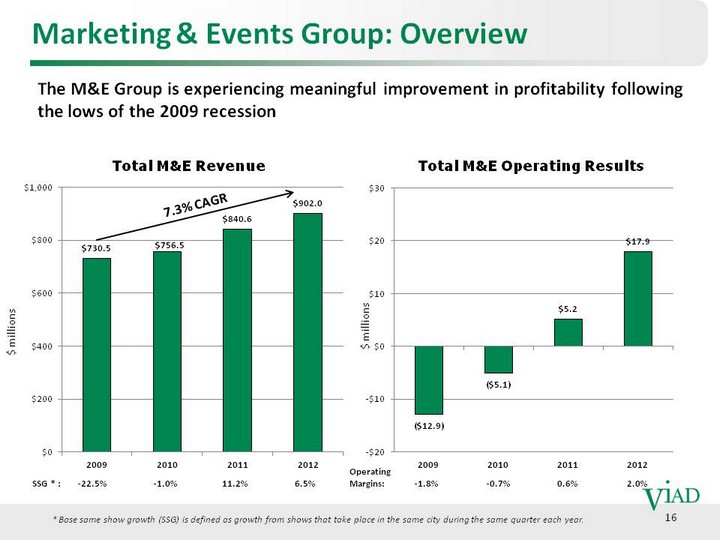
| 16 Marketing & Events Group: Overview The M&E Group is experiencing meaningful improvement in profitability following the lows of the 2009 recession (CHART) Total M&E Revenue (CHART) Total M&E Operating Results Operating Margins: -1.8% -0.7% 0.6% 2.0% SSG * : -22.5% -1.0% 11.2% 6.5% $ millions $ millions * Base same show growth (SSG) is defined as growth from shows that take place in the same city during the same quarter each year. 7.3% CAGR |
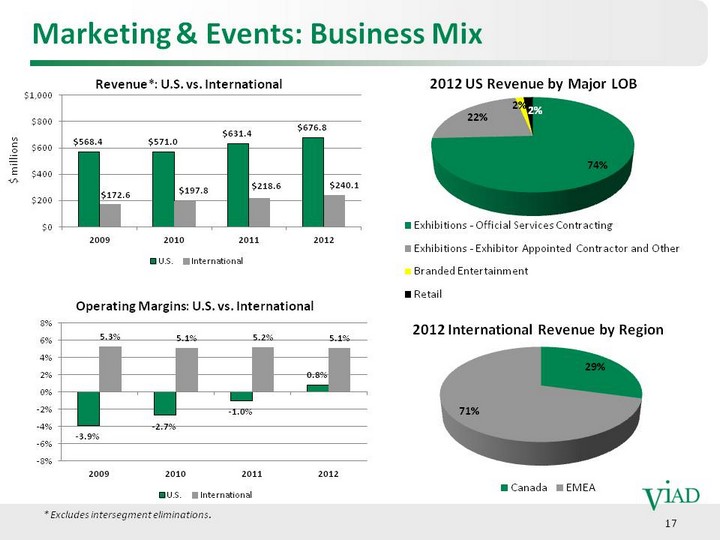
| 17 Marketing & Events: Business Mix Revenue*: U.S. vs. International (CHART) Operating Margins: U.S. vs. International (CHART) (CHART) (CHART) $ millions * Excludes intersegment eliminations. |
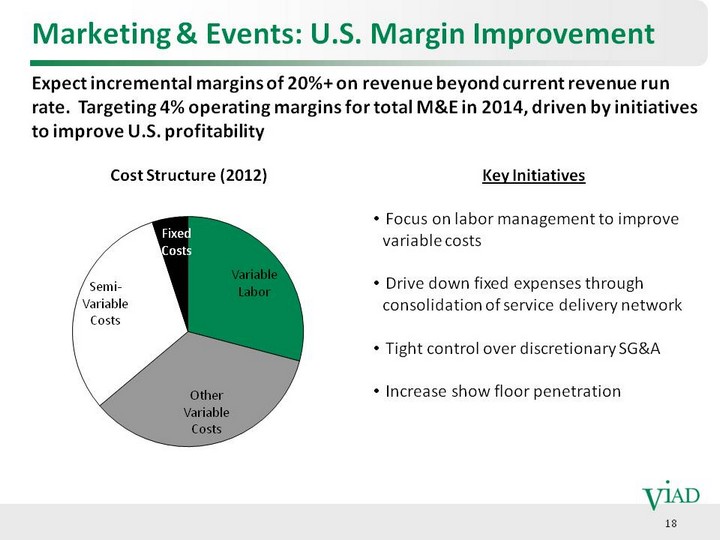
| 18 Marketing & Events: U.S. Margin Improvement Key Initiatives Focus on labor management to improve variable costs Drive down fixed expenses through consolidation of service delivery network Tight control over discretionary SG&A Increase show floor penetration Expect incremental margins of 20%+ on revenue beyond current revenue run rate. Targeting 4% operating margins for total M&E in 2014, driven by initiatives to improve U.S. profitability (CHART) |

| 19 Marketing & Events: U.S. Margin Improvement U.S. operating margins improved by 180 basis points from 2011 to 2012, driven by revenue growth and efficiency gains Labor productivity gains at show site Rigorous & strategic planning Introduction of new tools to support planning, measurement and benchmarking Mutually favorable union agreements Wage / benefits rates Work rules 50 bps improvement in U.S. base same-show labor-to-revenue ratio $2M reduction in U.S. facilities costs Labor Management Optimize U.S. Service Delivery Network Reduce invested capital and operating expenses through rationalization of facilities, inventory and equipment Analysis is ongoing Service Delivery Network |

| Summary |
| 21 Viad Opportunity Summary Two business units with leading and defensible market positions T&R Group enjoys high margins with strong revenue growth fueled by Refresh- Build-Buy strategy M&E Group is experiencing significant improvements in profits driven by margin initiatives and improved industry fundamentals Balance sheet strength $114.2 million in cash (12/31/12) 0.6% debt-to-capital (12/31/12) $0.10 per share quarterly dividend (increased 150% from $0.04 per share in 2012) Exploring opportunities to enhance shareholder value, including possible separation of T&R and M&E JP Morgan hired to assist with evaluation |

| 22 Appendix |
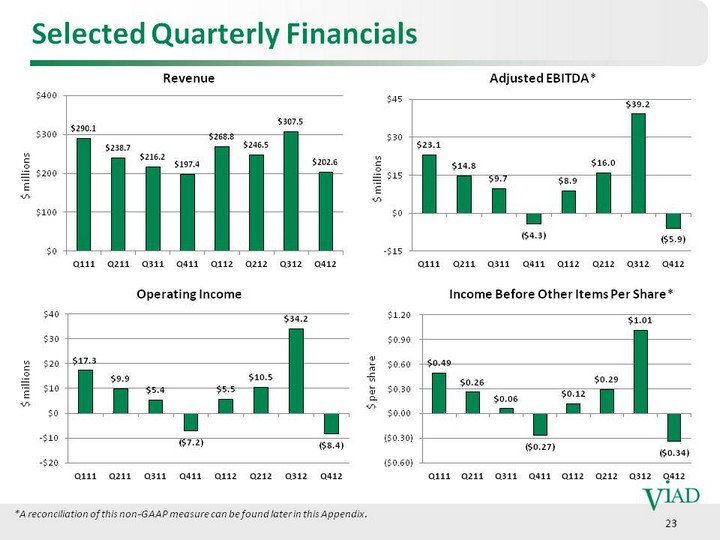
| 23 Selected Quarterly Financials Revenue Operating Income Income Before Other Items Per Share* Adjusted EBITDA* (CHART) (CHART) (CHART) $ millions $ per share $ millions $ millions (CHART) *A reconciliation of this non-GAAP measure can be found later in this Appendix. |
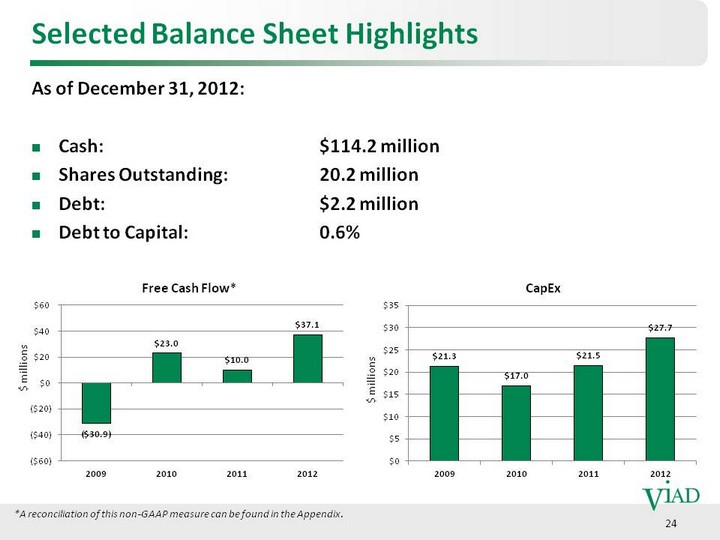
| 24 Selected Balance Sheet Highlights As of December 31, 2012: Cash: $114.2 million Shares Outstanding: 20.2 million Debt: $2.2 million Debt to Capital: 0.6% (CHART) (CHART) Free Cash Flow* CapEx $ millions $ millions *A reconciliation of this non-GAAP measure can be found in the Appendix. |
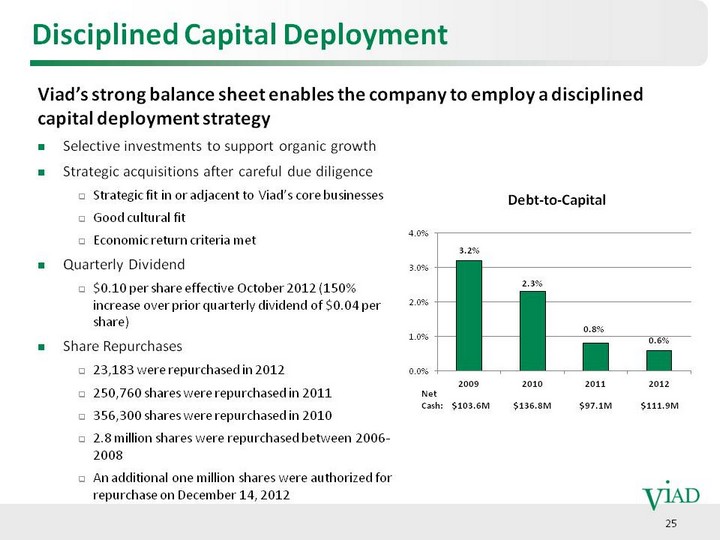
| 25 Disciplined Capital Deployment Selective investments to support organic growth Strategic acquisitions after careful due diligence Strategic fit in or adjacent to Viad's core businesses Good cultural fit Economic return criteria met Quarterly Dividend $0.10 per share effective October 2012 (150% increase over prior quarterly dividend of $0.04 per share) Share Repurchases 23,183 were repurchased in 2012 250,760 shares were repurchased in 2011 356,300 shares were repurchased in 2010 2.8 million shares were repurchased between 2006- 2008 An additional one million shares were authorized for repurchase on December 14, 2012 Viad's strong balance sheet enables the company to employ a disciplined capital deployment strategy Debt-to-Capital (CHART) Net Cash: $103.6M $136.8M $97.1M $111.9M |
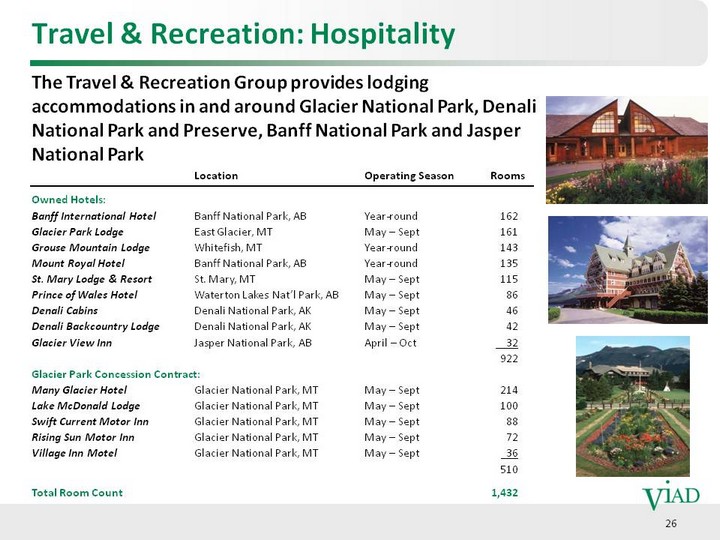
| 26 Travel & Recreation: Hospitality Travel & Recreation: Hospitality The Travel & Recreation Group provides lodging accommodations in and around Glacier National Park, Denali National Park and Preserve, Banff National Park and Jasper National Park National Park National Park National Park National Park Location Operating Season Rooms Owned Hotels: Banff International Hotel Banff National Park, AB Year-round 162 Glacier Park Lodge East Glacier, MT May - Sept 161 Grouse Mountain Lodge Whitefish, MT Year-round 143 Mount Royal Hotel Banff National Park, AB Year-round 135 St. Mary Lodge & Resort St. Mary, MT May - Sept 115 Prince of Wales Hotel Waterton Lakes Nat'l Park, AB May - Sept 86 Denali Cabins Denali National Park, AK May - Sept 46 Denali Backcountry Lodge Denali National Park, AK May - Sept 42 Glacier View Inn Jasper National Park, AB April - Oct 32 922 Glacier Park Concession Contract: Many Glacier Hotel Glacier National Park, MT May - Sept 214 Lake McDonald Lodge Glacier National Park, MT May - Sept 100 Swift Current Motor Inn Glacier National Park, MT May - Sept 88 Rising Sun Motor Inn Glacier National Park, MT May - Sept 72 Village Inn Motel Glacier National Park, MT May - Sept 36 510 Total Room Count 1,432 |
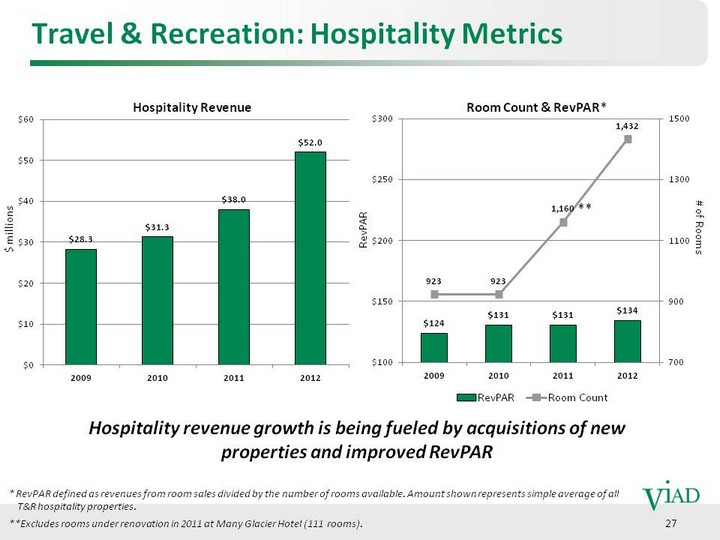
| 27 Travel & Recreation: Hospitality Metrics Hospitality Revenue (CHART) Room Count & RevPAR* (CHART) RevPAR # of Rooms $ millions ** **Excludes rooms under renovation in 2011 at Many Glacier Hotel (111 rooms). * RevPAR defined as revenues from room sales divided by the number of rooms available. Amount shown represents simple average of all T&R hospitality properties. Hospitality revenue growth is being fueled by acquisitions of new properties and improved RevPAR |

| 28 Travel & Recreation: Attractions The Travel & Recreation Group offers unique attractions that enhance the guest experience, including: The Banff Gondola, which offers visitors an unobstructed view of the Canadian Rockies and overlooks the town of Banff, Alberta Tours of the Athabasca Glacier on the Columbia Icefield aboard Ice Explorers Boat cruises on Lake Minnewanka in Banff Interpretive tours in Glacier National Park on authentic 1930s red touring buses Coming soon: Glacier Skywalk Coming soon: Glacier Skywalk Coming soon: Glacier Skywalk Coming soon: Glacier Skywalk Coming soon: Glacier Skywalk Coming soon: Glacier Skywalk Coming soon: Glacier Skywalk Coming soon: Glacier Skywalk Coming soon: Glacier Skywalk Coming soon: Glacier Skywalk Coming soon: Glacier Skywalk Coming soon: Glacier Skywalk Coming soon: Glacier Skywalk Coming soon: Glacier Skywalk |

| 29 Travel & Recreation: Attractions Metrics Attractions Revenue (CHART) # of Passengers & Rev per Passenger* (CHART) $ millions Revenue per Passenger # of Passengers (000's) * Rev per Passenger defined as total attractions revenue divided by number of passengers. Amount shown represents simple average of all T&R attractions. Attractions revenue growth driven by price and volume increases |
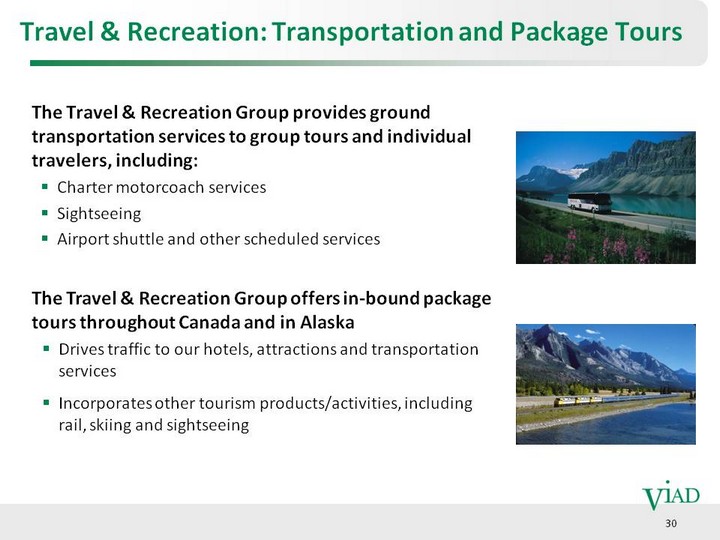
| 30 Travel & Recreation: Transportation and Package Tours The Travel & Recreation Group provides ground transportation services to group tours and individual travelers, including: Charter motorcoach services Sightseeing Airport shuttle and other scheduled services The Travel & Recreation Group offers in-bound package tours throughout Canada and in Alaska Drives traffic to our hotels, attractions and transportation services Incorporates other tourism products/activities, including rail, skiing and sightseeing |

| 31 Travel & Recreation: Transportation and Package Tours Transportation Revenue (CHART) $ millions Package Tours Revenue (CHART) $ millions Transportation and Package Tours revenues are also on the rise * Includes higher revenue from transportation business related to the 2010 Winter Olympic and Paralympic Games. * |
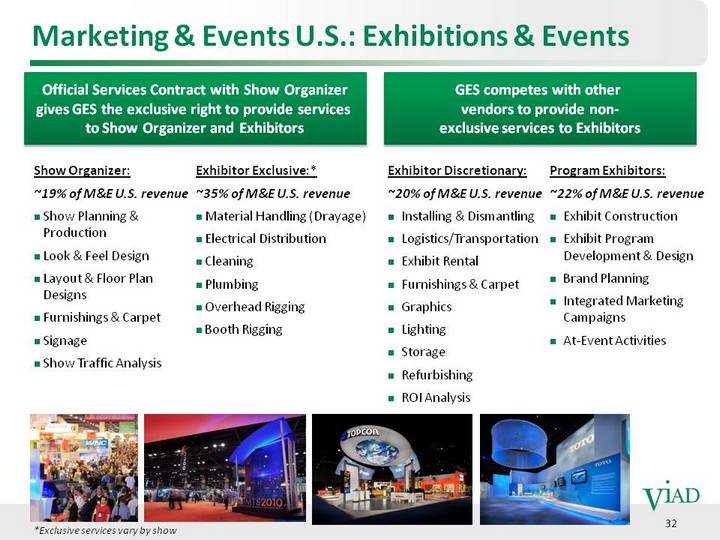
| Marketing & Events U.S.: Exhibitions & Events Exhibitor Discretionary: ~20% of M&E U.S. revenue Installing & Dismantling Logistics/Transportation Exhibit Rental Furnishings & Carpet Graphics Lighting Storage Refurbishing ROI Analysis Show Organizer: ~19% of M&E U.S. revenue Show Planning & Production Look & Feel Design Layout & Floor Plan Designs Furnishings & Carpet Signage Show Traffic Analysis GES competes with other vendors to provide non- exclusive services to Exhibitors *Exclusive services vary by show Exhibitor Exclusive:* ~35% of M&E U.S. revenue Material Handling (Drayage) Electrical Distribution Cleaning Plumbing Overhead Rigging Booth Rigging Official Services Contract with Show Organizer gives GES the exclusive right to provide services to Show Organizer and Exhibitors Program Exhibitors: ~22% of M&E U.S. revenue Exhibit Construction Exhibit Program Development & Design Brand Planning Integrated Marketing Campaigns At-Event Activities 32 |
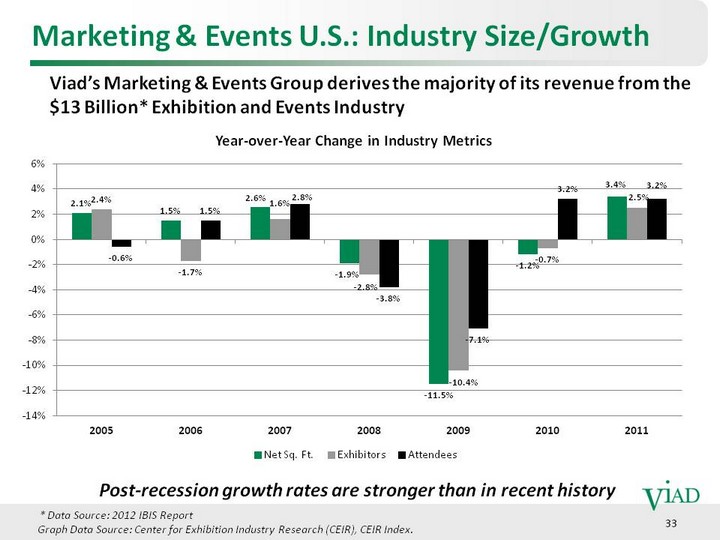
| Marketing & Events U.S.: Industry Size/Growth Viad's Marketing & Events Group derives the majority of its revenue from the $13 Billion* Exhibition and Events Industry Graph Data Source: Center for Exhibition Industry Research (CEIR), CEIR Index. (CHART) 33 * Data Source: 2012 IBIS Report Post-recession growth rates are stronger than in recent history |
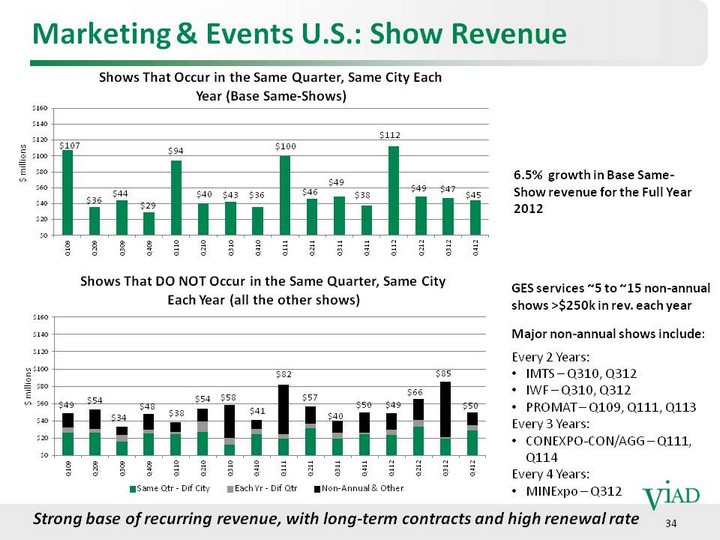
| (CHART) 34 Marketing & Events U.S.: Show Revenue (CHART) 6.5% growth in Base Same- Show revenue for the Full Year 2012 GES services ~5 to ~15 non-annual shows >$250k in rev. each year Major non-annual shows include: Every 2 Years: IMTS - Q310, Q312 IWF - Q310, Q312 PROMAT - Q109, Q111, Q113 Every 3 Years: CONEXPO-CON/AGG - Q111, Q114 Every 4 Years: MINExpo - Q312 $ millions $ millions Strong base of recurring revenue, with long-term contracts and high renewal rate |
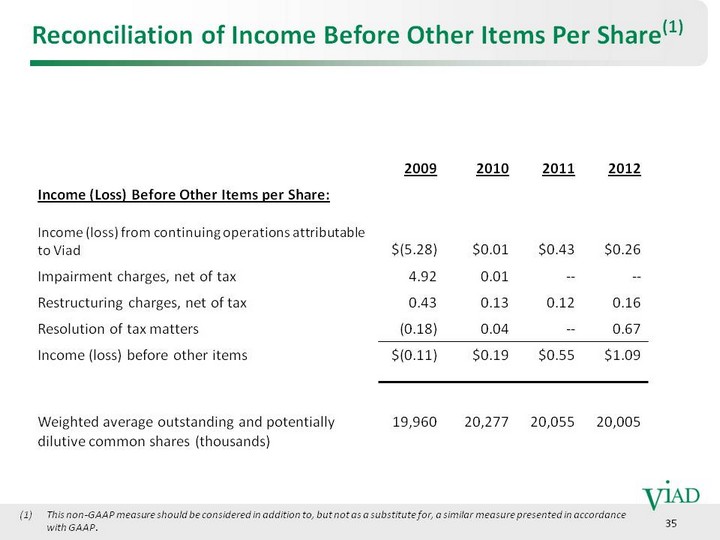
| 35 Reconciliation of Income Before Other Items Per Share(1) This non-GAAP measure should be considered in addition to, but not as a substitute for, a similar measure presented in accordance with GAAP. with GAAP. with GAAP. |
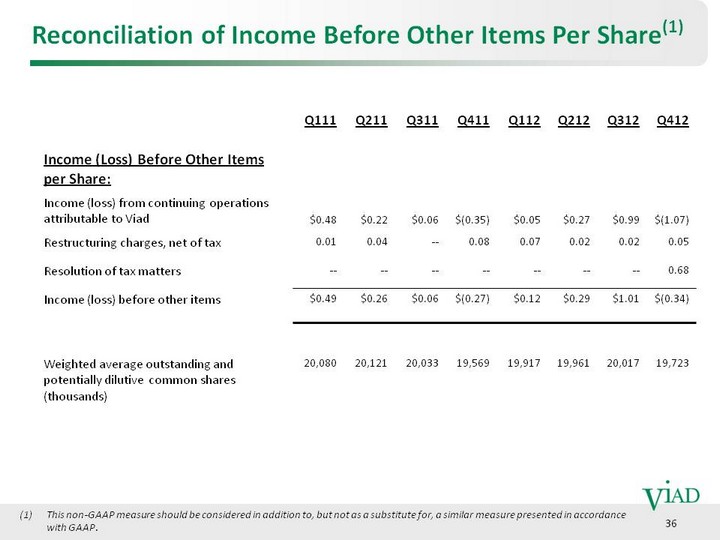
| 36 Reconciliation of Income Before Other Items Per Share(1) This non-GAAP measure should be considered in addition to, but not as a substitute for, a similar measure presented in accordance with GAAP. with GAAP. with GAAP. |
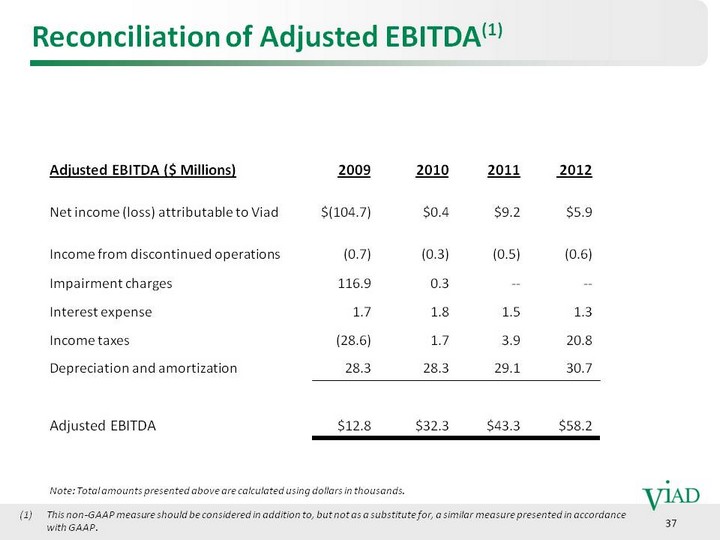
| 37 Reconciliation of Adjusted EBITDA(1) This non-GAAP measure should be considered in addition to, but not as a substitute for, a similar measure presented in accordance with GAAP. with GAAP. with GAAP. Note: Total amounts presented above are calculated using dollars in thousands. |
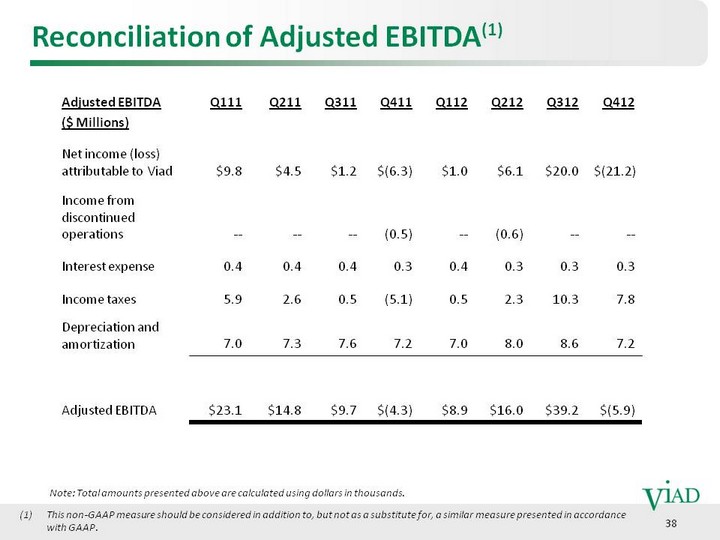
| 38 Reconciliation of Adjusted EBITDA(1) This non-GAAP measure should be considered in addition to, but not as a substitute for, a similar measure presented in accordance with GAAP. with GAAP. with GAAP. Note: Total amounts presented above are calculated using dollars in thousands. |
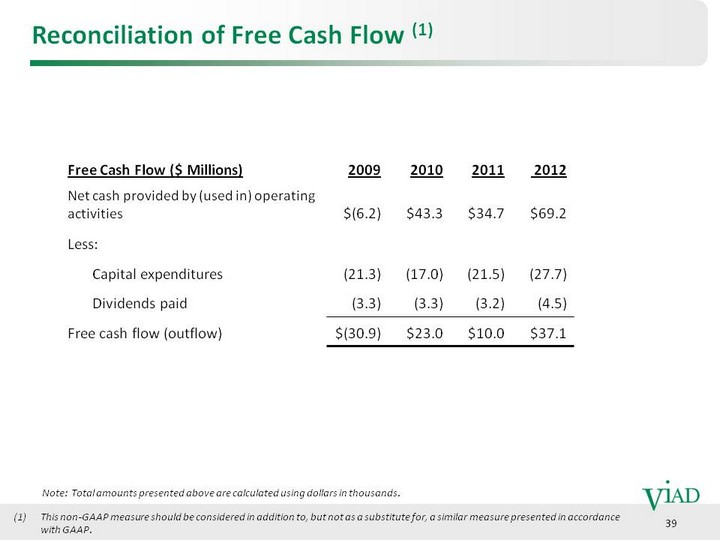
| 39 Reconciliation of Free Cash Flow (1) This non-GAAP measure should be considered in addition to, but not as a substitute for, a similar measure presented in accordance with GAAP. with GAAP. with GAAP. Note: Total amounts presented above are calculated using dollars in thousands. |