Attached files
| file | filename |
|---|---|
| EX-99.1 - EX-99.1 - PATHEON INC | d496420dex991.htm |
| 8-K - FORM 8-K - PATHEON INC | d496420d8k.htm |

Exhibit 99.2
Patheon
Fiscal 2013 First Quarter Results
March 8, 2013
Forward-looking statements
This presentation contains forward-looking statements or information which reflect our expectations regarding possible events, conditions, our future growth, results of operations, performance, and business prospects and opportunities. All statements, other than statements of historical fact, are forward-looking statements. Forward-looking statements necessarily involve significant known and unknown risks, assumptions and uncertainties that may cause our actual results in future periods to differ materially from those expressed or implied by such forward-looking statements. These risks are described in our 2012 Form 10-K and our subsequent filings with the U.S. Securities and Exchange Commission and the Canadian Securities Administration. Accordingly, you are cautioned not to place undue reliance on forward-looking statements. These forward-looking statements are made as of the date hereof, and except as required by law, we assume no obligation to update or revise them to reflect new events or circumstances.
Use of Non-GAAP Financial Measures
Commencing with the first quarter of fiscal 2013, we revised our calculation of Adjusted EBITDA to exclude stock-based compensation expense, consulting costs related to our operational initiatives and purchase accounting adjustments. We believe that excluding these items from Adjusted EBITDA better reflects our underlying performance. Based on the revisions to the definition of Adjusted EBITDA, we have recast the presentation of Adjusted EBITDA for prior periods to be consistent with the current period presentation. Our Adjusted EBITDA (as revised) is now income (loss) from continuing operations before repositioning expenses, interest expense, foreign exchange losses reclassified from other comprehensive income (loss), refinancing expenses, acquisition-related costs, gains and losses on sale of capital assets, income taxes, asset impairment charges, depreciation and amortization, stock-based compensation expense, consulting costs related to our operational initiatives, purchase accounting adjustments and other income and expenses. “Adjusted EBITDA margin” is Adjusted EBITDA as a percentage of revenues. Since Adjusted EBITDA is a non-GAAP measure that does not have a standardized meaning, it may not be comparable to similar measures presented by other issuers. Readers are cautioned that Adjusted EBITDA should not be construed as an alternative to net income (loss) determined in accordance with U.S. GAAP as an indicator of performance. Adjusted EBITDA is used by management as an internal measure of profitability. We have included Adjusted EBITDA because we believe that this measure is used by certain investors to assess our financial performance before non-cash charges and certain costs that we do not believe are reflective of our underlying business. Reconciliations of Adjusted EBITDA to the closest GAAP measures are included in the Appendix to this presentation.
1
Fiscal 2013 first quarter highlights
• Revenue increased by 38.7% from prior year
– Patheon standalone grew by 23.6% from prior year
• Conversion to a gross profit increase of 194.4% from prior year
– Patheon standalone increased by 152.8% from prior year
• Adjusted EBITDA increase of $21.7 million from prior year
– Patheon standalone increased by over $20 million from prior year
• Transformation continues to yield benefits
2
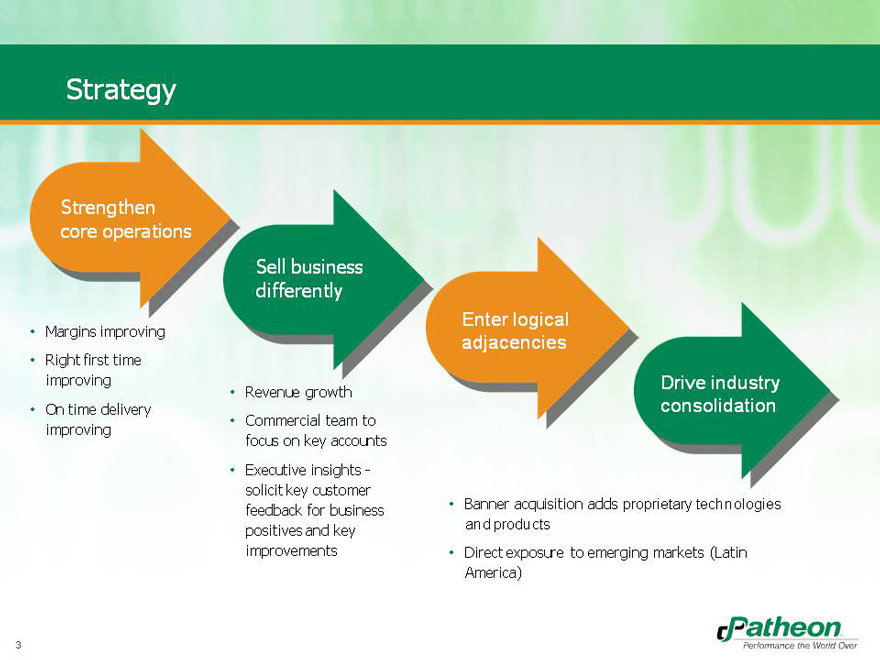
Strategy
Strengthen core operations
• Margins improving
• Right first time improving
• On time delivery improving
Sell business differently
• Revenue growth
• Commercial team to focus on key accounts
• Executive insights -solicit key customer feedback for business positives and key improvements
Enter logical adjacencies
• Banner acquisition adds proprietary technologies and products
• Direct exposure to emerging markets (Latin America)
Drive industry consolidation
3

Banner Integration Update
• We are working toward the full integration of Banner, at which time we expect the combined enterprise will be structured as three distinct business units
– CMO, PDS and Proprietary Products and Technology
• Combined enterprise will have a clear vision to drive value-creation through proprietary products and technology added by the Banner acquisition
• Banner manufacturing sites have been transitioned to CMO structure
• Launching operational efficiency initiatives to increase cost savings
• Consolidation of Olds, Alberta facility is consistent with our strategy to strengthen core operations through network rationalization
Fueling growth beyond a USD 1 billion enterprise
4
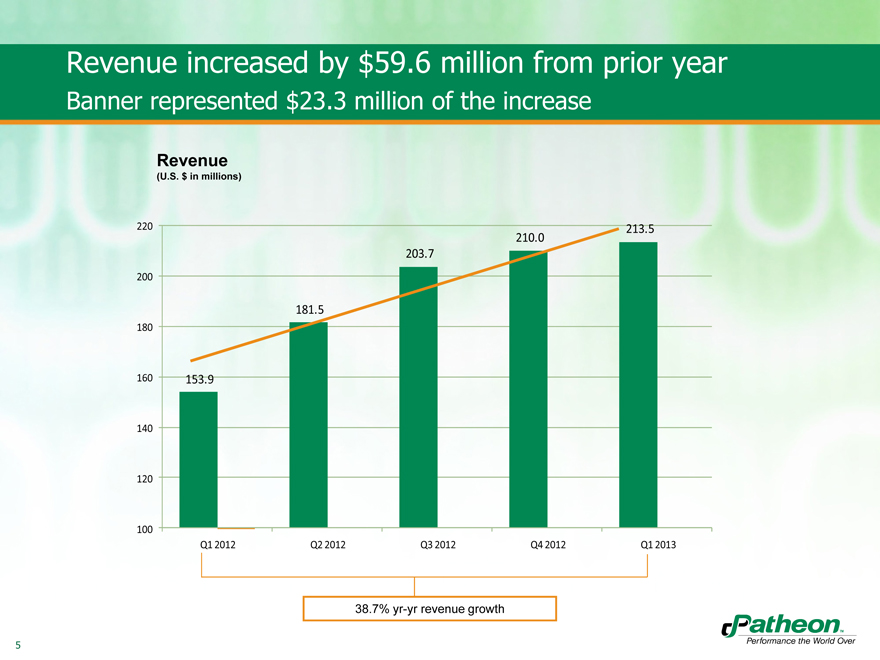
Revenue increased by $59.6 million from prior year
Banner represented $23.3 million of the increase
Revenue
(U.S. $ in millions)
220 213.5
210.0
203.7
200
181.5
180
160 153.9
140
120
100
Q1 2012 Q2 2012 Q3 2012 Q4 2012 Q1 2013
38.7% yr-yr revenue growth
5
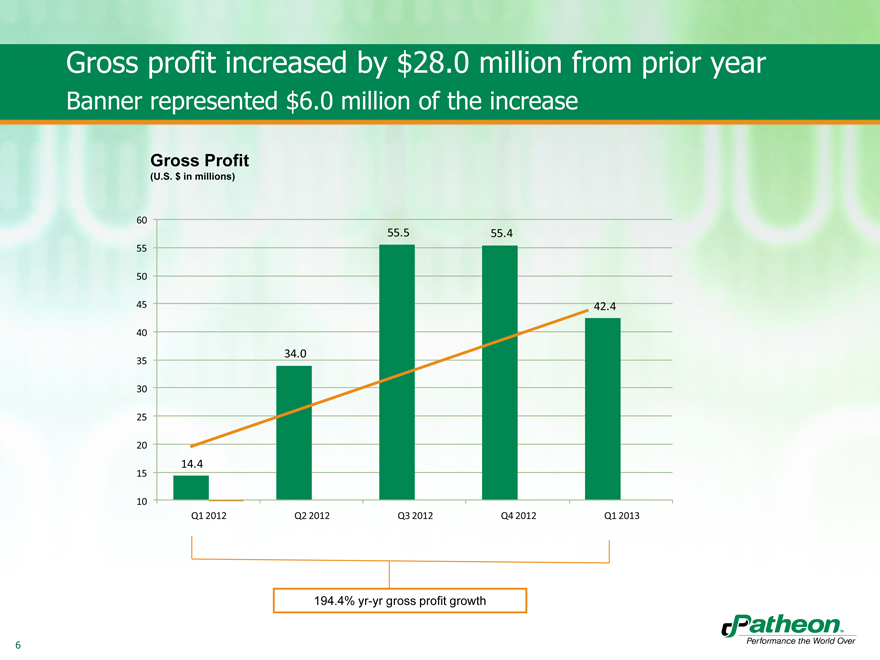
Gross profit increased by $28.0 million from prior year
Banner represented $6.0 million of the increase
Gross Profit
(U.S. $ in millions)
60
55.5 55.4
55
50
45 42.4
40
34.0
35
30
25
20
14.4
15
10
Q1 2012 Q2 2012 Q3 2012 Q4 2012 Q1 2013
194.4% yr-yr gross profit growth
6
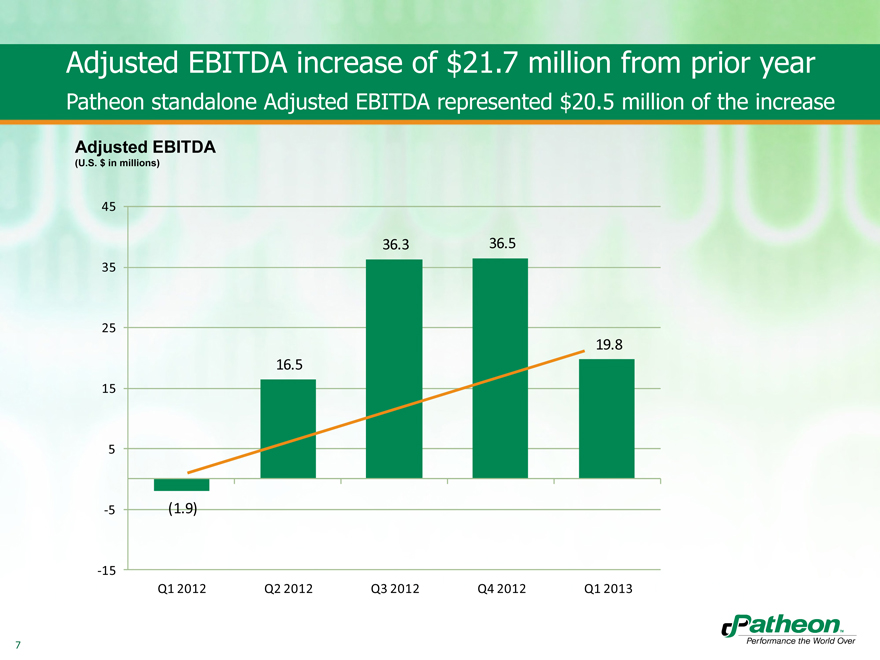
Adjusted EBITDA increase of $21.7 million from prior year
Patheon standalone Adjusted EBITDA represented $20.5 million of the increase
Adjusted EBITDA
(U.S. $ in millions)
45
36.3 36.5
35
25
19.8
16.5
15
5
-5(1.9)
-15
Q1 2012 Q2 2012 Q3 2012 Q4 2012 Q1 2013
7
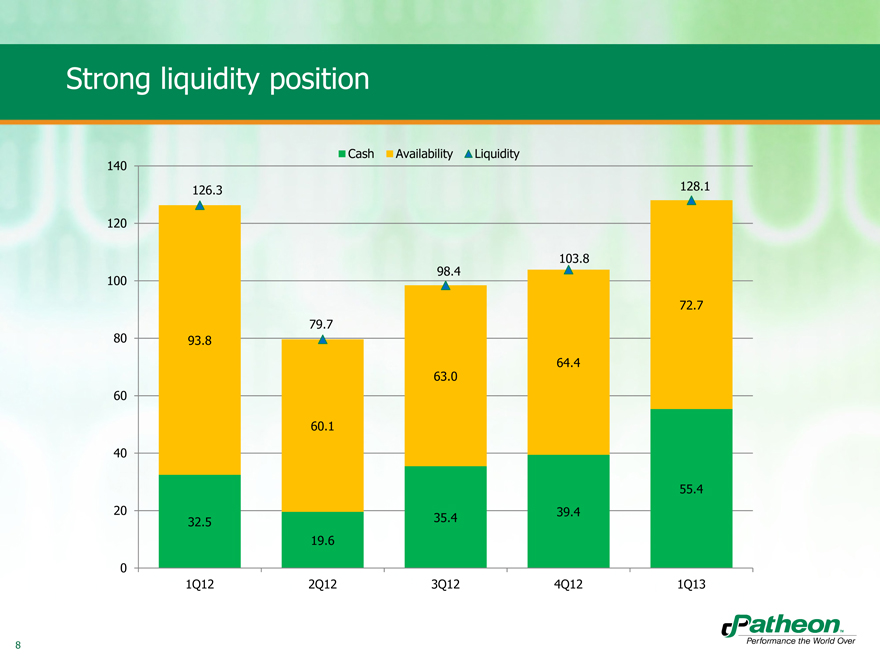
Strong liquidity position
Cash Availability Liquidity
140
126.3 128.1
120
103.8
98.4
100
72.7
79.7
80 93.8
64.4
63.0
60
60.1
40
55.4
20 39.4
32.5 35.4
19.6
0
1Q12 2Q12 3Q12 4Q12 1Q13
8
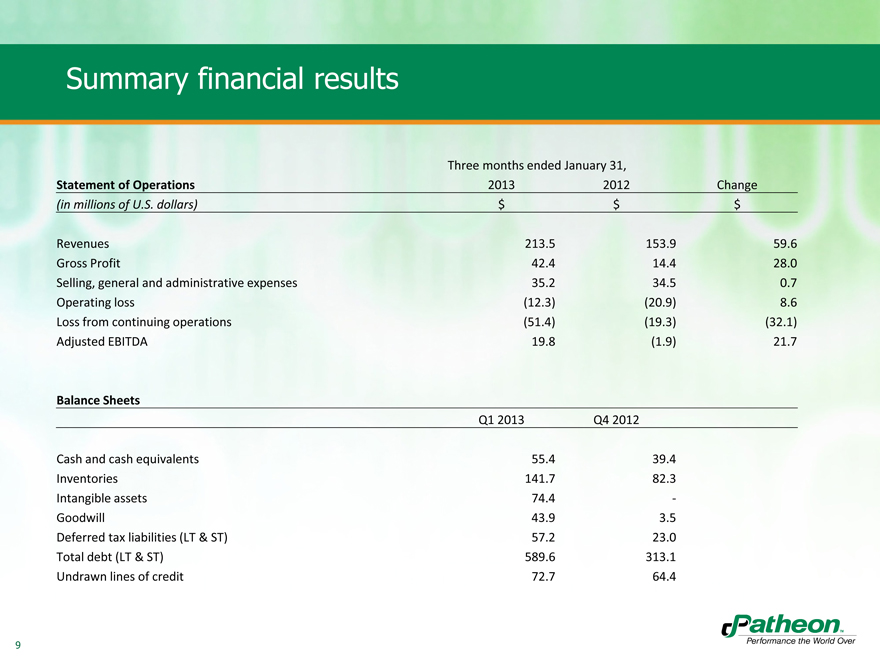
Summary financial results
Three months ended January 31,
Statement of Operations 2013 2012 Change
(in millions of U.S. dollars) $ $ $
Revenues 213.5 153.9 59.6
Gross Profit 42.4 14.4 28.0
,
Operating loss(12.3)(20.9) 8.6
Loss from continuing operations(51.4)(19.3)(32.1)
Adjusted EBITDA 19.8(1.9) 21.7
Balance Sheets
Q1 2013 Q4 2012
Cash and cash equivalents 55.4 39.4
Inventories 141.7 82.3
Intangible assets 74.4 -
Goodwill 43.9 3.5
Deferred tax liabilities (LT & ST) 57.2 23.0
Total debt (LT & ST) 589.6 313.1
Undrawn lines of credit 72.7 64.4
9
2013 priorities
• Drive customer performance
• Exceed industry growth rates
• Complete Banner integration
• Deliver strong financials
10

Thank you
11
Appendix
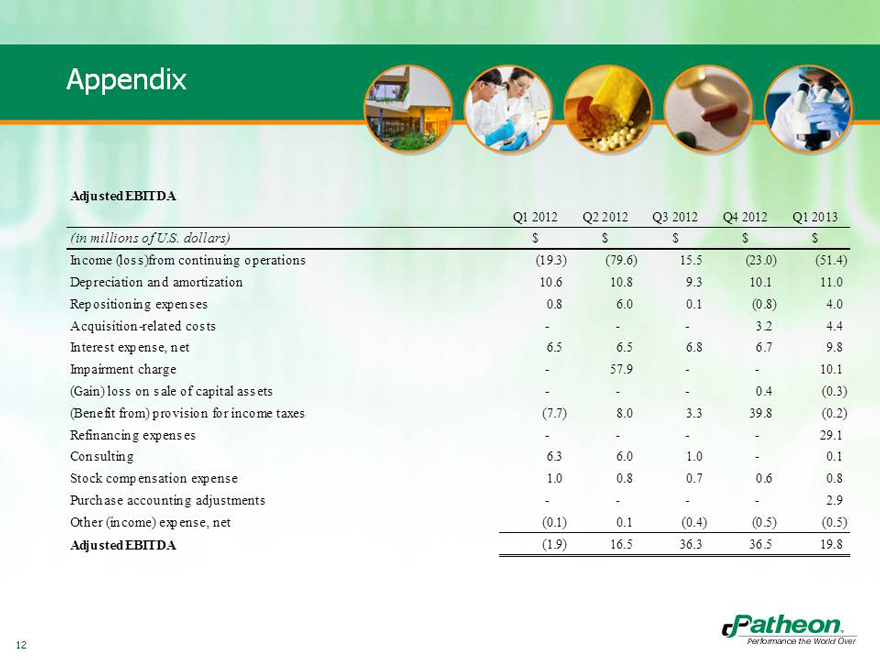
Adjusted EBITDA
Q1 2012 Q2 2012 Q3 2012 Q4 2012 Q1 2013
(in millions of U.S. dollars) $ $ $ $ $
Income (loss)from continuing operations(19.3)(79.6) 15.5(23.0)(51.4)
Depreciation and amortization 10.6 10.8 9.3 10.1 11.0
Repositioning expenses 0.8 6.0 0.1(0.8) 4.0
Acquisition-related costs ——3.2 4.4
Interest expense, net 6.5 6.5 6.8 6.7 9.8
Impairment charge—57.9 — 10.1
(Gain) loss on sale of capital assets ——0.4(0.3)
(Benefit from) provision for income taxes(7.7) 8.0 3.3 39.8(0.2)
Refinancing expenses — — 29.1
Consulting 6.3 6.0 1.0—0.1
Stock compensation expense 1.0 0.8 0.7 0.6 0.8
Purchase accounting adjustments — — 2.9
Other (income) expense, net(0.1) 0.1(0.4)(0.5)(0.5)
Adjusted EBITDA(1.9) 16.5 36.3 36.5 19.8
12