Attached files
| file | filename |
|---|---|
| 8-K - FORM 8-K - MERCURY SYSTEMS INC | d497897d8k.htm |
 ©
2013 Mercury Systems, Inc.
Mercury Systems, Inc.
Investor Presentation
Mark Aslett
President and CEO
Kevin Bisson
SVP and CFO
March 7, 2013
Exhibit 99.1 |
 2
©
2013 Mercury Systems, Inc.
Forward-looking safe harbor statement
This presentation contains certain forward-looking statements, as that term is defined in
the Private Securities Litigation Reform Act of 1995, including those relating to
business performance and the Company’s plans for growth and improvement in
profitability and cash flow. You can identify these statements by the use of the words “may,”
“will,”
“could,”
“should,”
“would,”
“plans,”
“expects,”
“anticipates,”
“continue,”
“estimate,”
“project,”
“intend,”
“likely,”
“forecast,”
“probable”
and
similar expressions. These forward-looking statements involve risks and uncertainties that
could cause actual results to differ materially from those projected or anticipated.
Such risks and uncertainties include, but are not limited to, continued funding of
defense programs, the timing of such funding, general economic and business conditions, including unforeseen weakness in
the Company’s markets, effects of continued geopolitical unrest and regional
conflicts, competition, changes in technology
and methods of marketing, delays in completing engineering and manufacturing programs, changes
in customer order patterns, changes in product mix, continued success in technological
advances and delivering technological innovations, changes in the U.S.
Government’s interpretation of federal procurement rules and regulations, market acceptance of the
Company's products, shortages in components, production delays due to performance quality
issues with outsourced components, inability to fully realize the expected benefits
from acquisitions or delays in realizing such benefits, challenges in integrating
acquired businesses and achieving anticipated synergies, changes to export regulations, increases in tax rates,
changes to generally accepted accounting principles, difficulties in retaining key employees
and customers, unanticipated costs under fixed-price service and system integration
engagements, and various other factors beyond our control. These risks and
uncertainties also include such additional risk factors as are discussed in the Company's filings with the U.S. Securities and
Exchange Commission, including its Annual Report on Form 10-K for the fiscal year ended
June 30, 2012. The Company cautions readers not to place undue reliance upon any such
forward-looking statements, which speak only as of the date made. The Company
undertakes no obligation to update any forward-looking statement to reflect events or circumstances
after the date on which such statement is made.
Use of Non-GAAP (Generally Accepted Accounting Principles) Financial Measures
In addition to reporting financial results in accordance with generally accepted accounting
principles, or GAAP, the Company provides adjusted EBITDA and free cash flow, which are
non-GAAP financial measures. Adjusted EBITDA excludes certain non- cash and
other specified charges. Free cash flow is defined as cash flow from operating activities less capital expenditures.
The Company believes these non-GAAP financial measures are useful to help investors better
understand its past financial performance and prospects for the future. However, the
presentation of adjusted EBITDA and free cash flow is not meant to be considered in
isolation or as a substitute for financial information provided in accordance with GAAP. Management
believes the adjusted EBITDA and free cash flow financial measures assist in providing a more
complete understanding of the Company’s underlying operational results and trends,
and management uses these measures along with the corresponding
GAAP financial measures to manage the Company’s business, to evaluate its performance
compared to prior periods and the marketplace, and to establish operational goals. A
reconciliation of GAAP to non-GAAP financial results discussed in this presentation
is contained in the Appendix hereto. 2
©
2013 Mercury Systems, Inc. |
 Introducing
Mercury Systems •
MRCY on NASDAQ
•
Real-time image, signal, Big
Data processing subsystems
•
Commercial Item company;
unique business model
•
Focused on Defense and
Intelligence priorities
•
Deployed on ~300 programs
with 25+ Primes
•
FY12 $245M revenues;
20% Adj. EBITDA margin.
770+ employees
•
Defense revenue 76%
growth (15% CAGR)
FY08–FY12
3
©
2013 Mercury Systems, Inc.
Best-of-breed provider of sensor and Big Data processing solutions |
 Defense industry
environment will remain challenging •
Potential for sequestration spending cuts
–
‘Soft’
sequestration already underway
•
Potential for a full year continuing resolution
–
Existing CR expires March 2013
•
New DoD roles and missions announced
–
Smaller force structure to protect readiness
–
Increased investment in key areas e.g. ISR, EW
–
Build capacity and capability of international partners
•
Defense procurement reform also underway
4
©
2013 Mercury Systems, Inc.
… due to budget and political uncertainty |
 Mercury investor
highlights Pure-play C4ISR electronics company embedded on a diverse mix of
programs and platforms aligned with existing and emerging priorities
Best-of-breed provider of open sensor and Big Data processing
subsystems to defense Primes and to the Intelligence Community
Increased ISR use, shift to onboard processing / exploitation, new EW
threats and Big Data driving greater demand for Mercury solutions
Well positioned to benefit from DoD procurement reform and slower
defense spending, which are increasing outsourcing by defense Primes
Well-defined strategy with a demonstrated track record of
double-digit defense revenue growth and improved profitability
Successful transformation has positioned the business for rebound
in organic growth supplemented through strategic acquisitions
5
©
2013 Mercury Systems, Inc.
Leading Market
Position
Differentiated
Capabilities
Favorable Macro
Industry Trends
Unique Business
Model
Proven
Management
Team
Well Positioned
for Growth |
 1.
Expand our capabilities and offerings for sensor and Big Data processing
2.
Grow business by sensor modality and within the Intelligence Community
3.
Penetrate customers, programs and platforms through new design wins
4.
Capitalize on Prime outsourcing and supply chain consolidation
5.
Acquire to scale our sensor processing and intelligence businesses
Growth strategy summary
Mercury has strategically positioned its business to grow
6
©
2013 Mercury Systems, Inc. |
 7
©
2013 Mercury Systems, Inc.
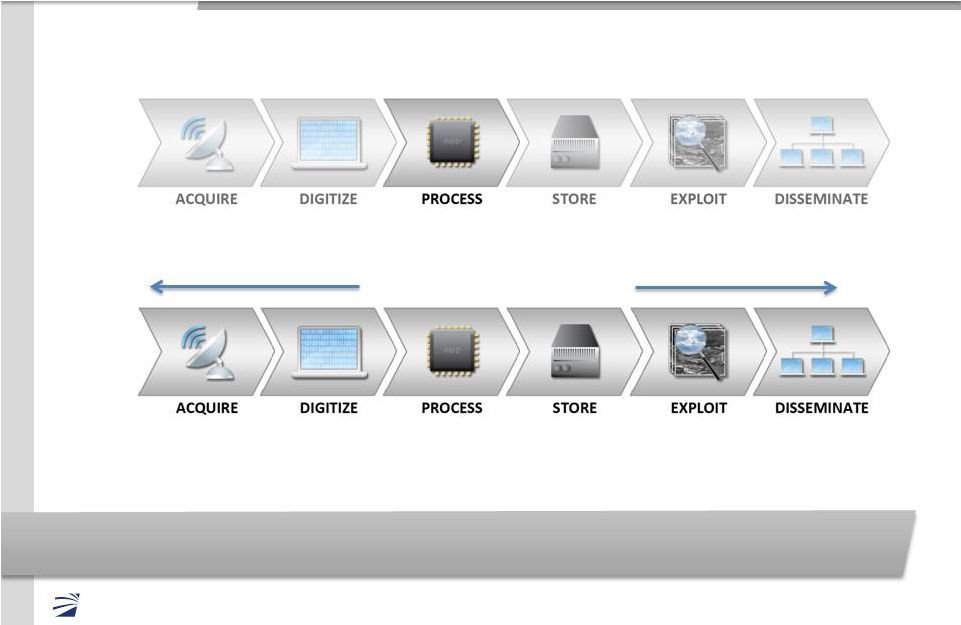
We are the only commercial item company with the
end-to-end capabilities and differentiated technology …
Services and Systems Integration
To
RACE++ Boards
From
Open Sensor Processing Subsystems
7
©
2013 Mercury Systems, Inc.
… to build today’s sophisticated sensor processing subsystems targeting new platforms or upgrades |
 8
©
2013 Mercury Systems, Inc.
EW
EW
Radar
Radar
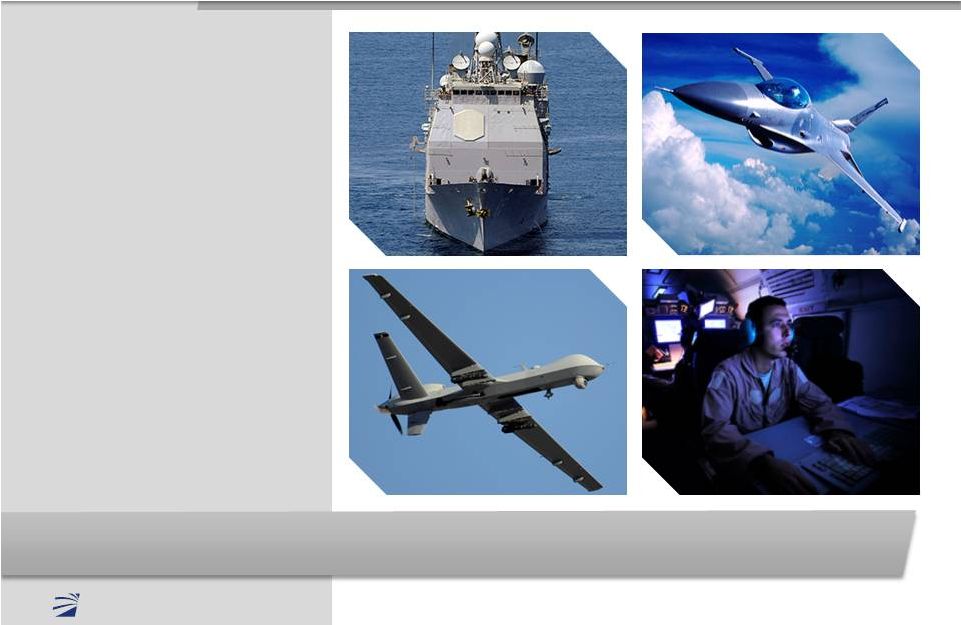
Increased demand for ISR and rapidly evolving threats …
•
More and better sensors.
Overwhelming data.
•
EW: new and rapidly
evolving threats
•
Radar: smaller, faster
targets. New technologies
•
EO/IR: leap in resolution,
onboard exploitation and
real-time tactical access
•
C4I: Net-centric command,
control and collaboration
•
Time to actionable
intelligence key
C4I
C4I
EO/IR
EO/IR
8
©
2013 Mercury Systems, Inc.
… drive demand for our onboard sensor processing
solutions |
 9
©
2013 Mercury Systems, Inc.
We are deployed on 300+ programs with 25+ Primes
RADAR
EW
EO/IR –
C4I
BAMS; NATO AGS
Global Hawk
BAMS; NATO AGS
Global Hawk
SEWIP
SEWIP
AEGIS
AEGIS Ashore
AEGIS
AEGIS Ashore
F-15
F-15
Patriot
Patriot
AH-64 Apache
AH-64 Apache
ReaperGorgon
Stare
ReaperGorgon
Stare
F-16
F-16
Badger/Buzzard
Badger/Buzzard
Shadow
Shadow
Global Hawk
Global Hawk
F-35
F-35
F-35
F-35
F-16
F-16
P-8
P-8 |
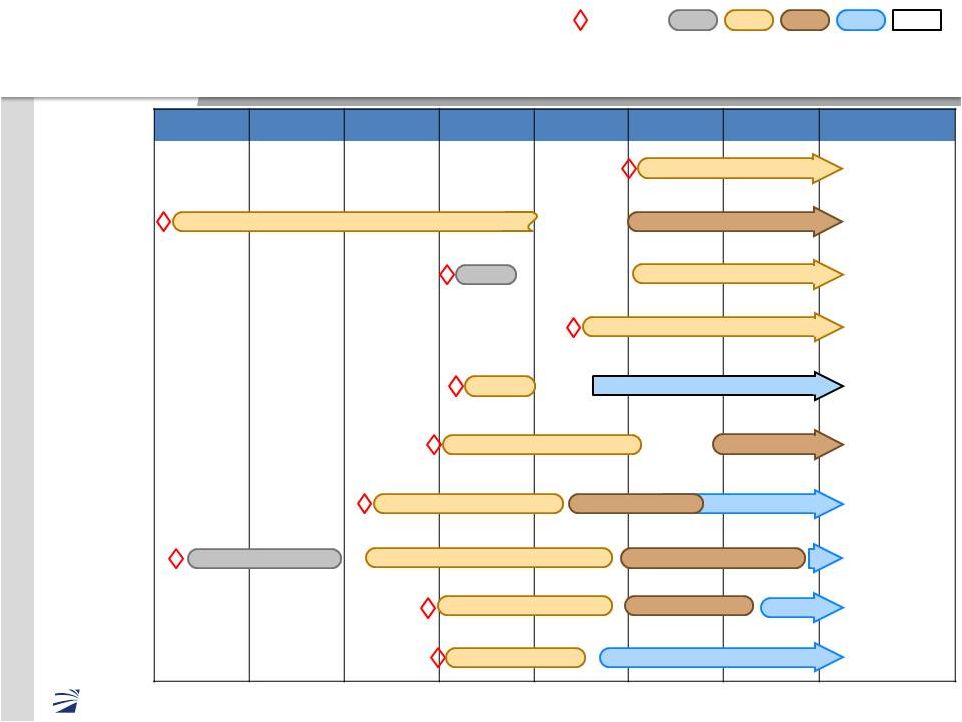
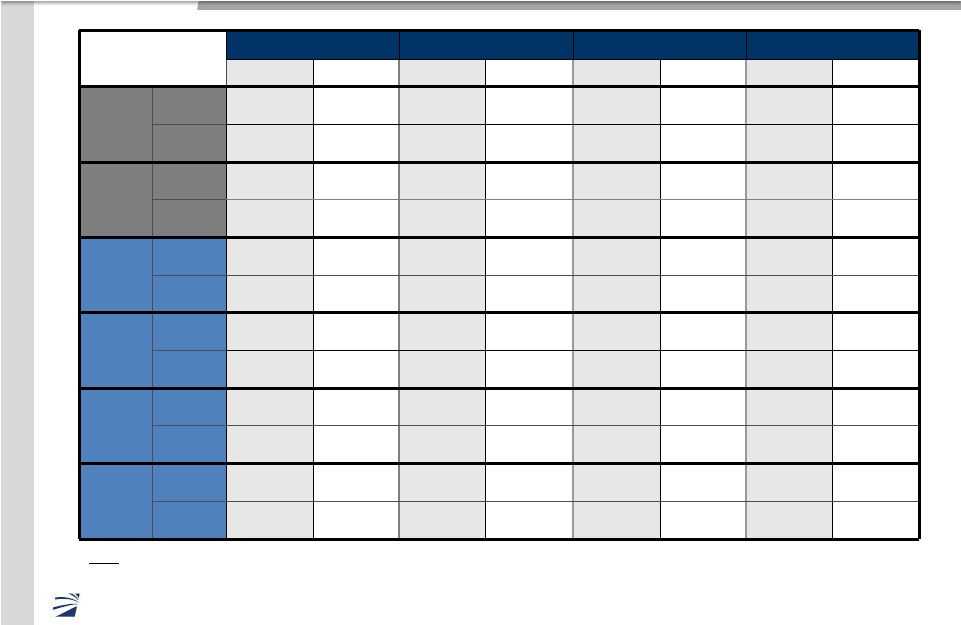
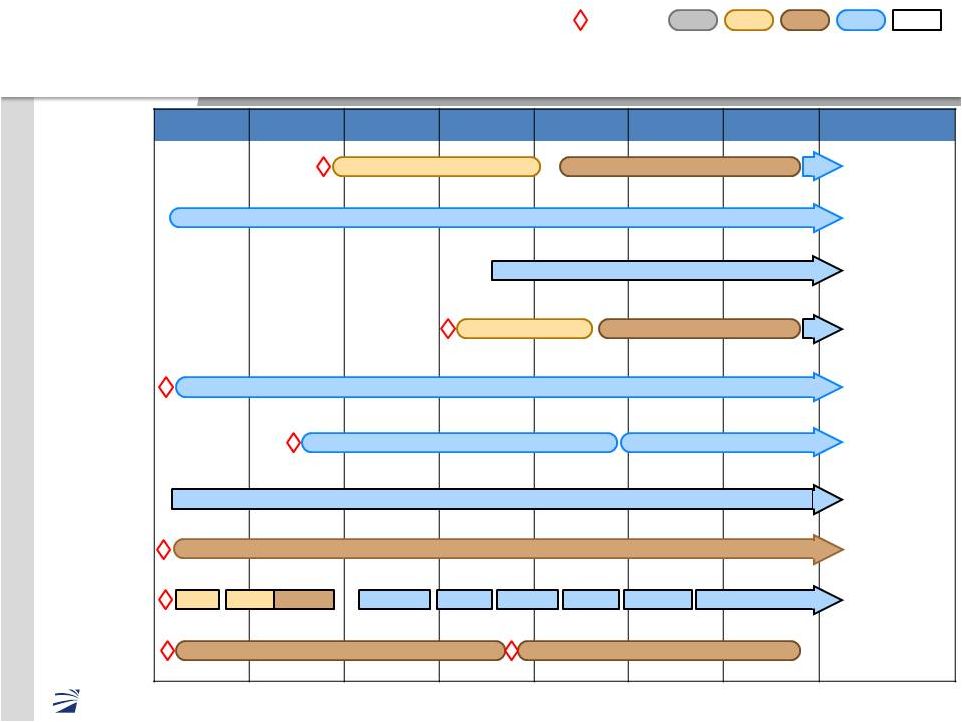 Key programs
in production Mercury’s
perspective
on
phase,
timing
and
potential
value
1
Gorgon Stare
$15-$30M
Predator/
Reaper Radar
$70-$150M
AEGIS SPY-1
$75M
F-15 EW
$60-$110M
P8-MMA
$40-$85M
UAE
TAIWAN
SAUDI
KUWAIT
Patriot FMS
$50M
QATAR
TURKEY
OTHERS
IDIQ 1
Filthy Badger
DRFM
$70M
IDIQ 2
SIRFC/AIDEWS
$35-$70M
JSF
$60M
SEWIP Blk 2
$225-$285M
10
©
2013 Mercury Systems, Inc.
1
Notes: Remaining potential values and timing reflect Management’s current
estimates and are subject to change.
**
Programs are currently being competed with multiple Primes.
= Design Win
TD
EMD
FRP
FMS
Inc 1 QRC
Inc 2 QRC
FY09
~ Remaining
Potential Value
FY10
FY11
FY12
FY13
FY14
FY15
LRIP |
 11
©
2013 Mercury Systems, Inc.
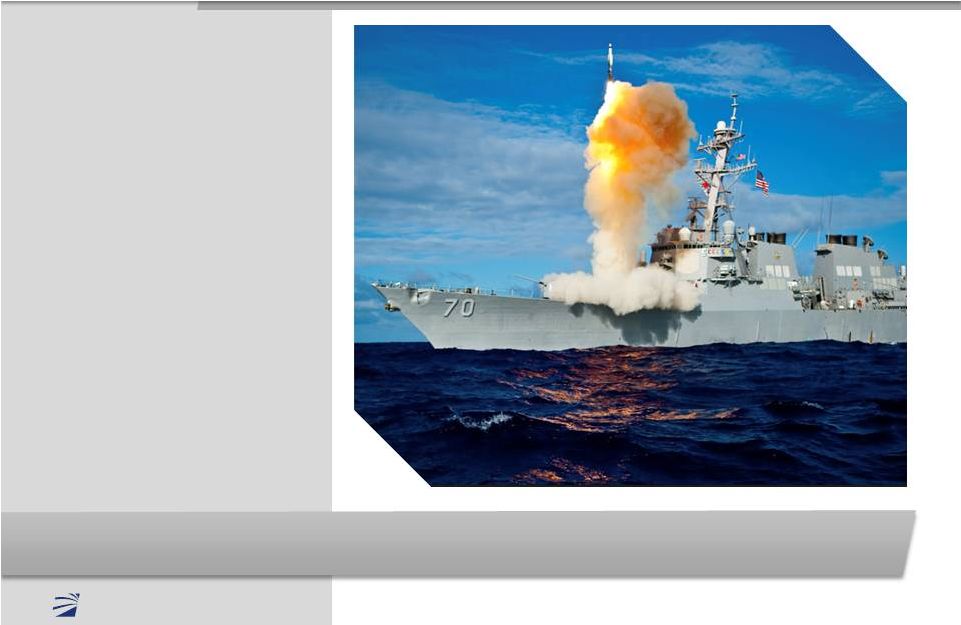
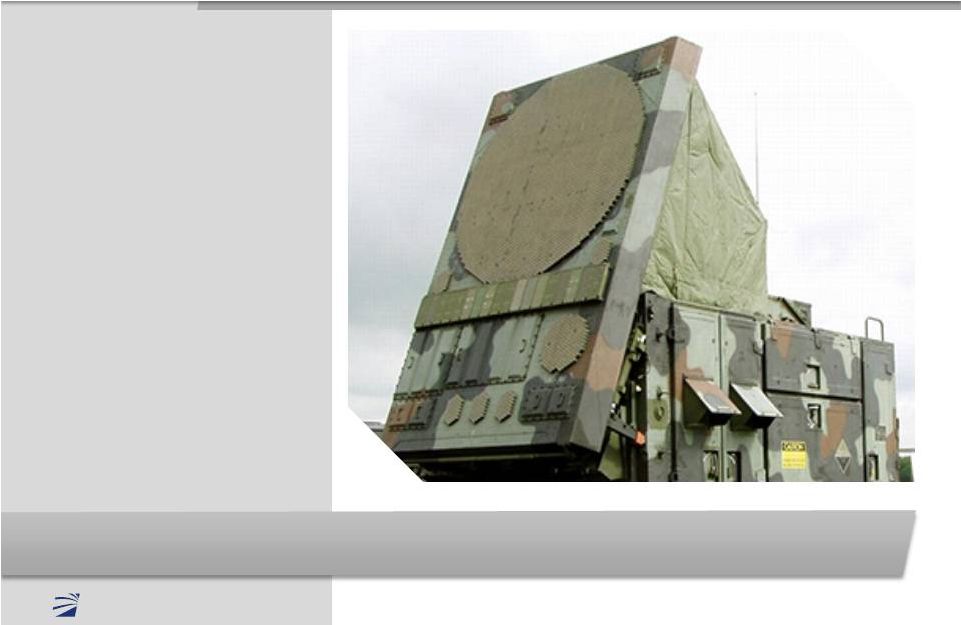
Aegis ballistic missile defense: SPY-1 BMD Radar
Countering rogue nations’
ballistic missile threats
•
Highest performance radar
processor Application Ready
Subsystem
•
$9M booked in FY12,
$85M+ booked to date
•
Additional 27 ship sets
expected through GFY16
•
AMDR selection in FY13
–
SPY-1 replacement Radar
–
FY16 introduction expected
–
Partnering with LM
11
©
2013 Mercury Systems, Inc.
Mercury’s largest single program in production to date
|
 12
©
2013 Mercury Systems, Inc.
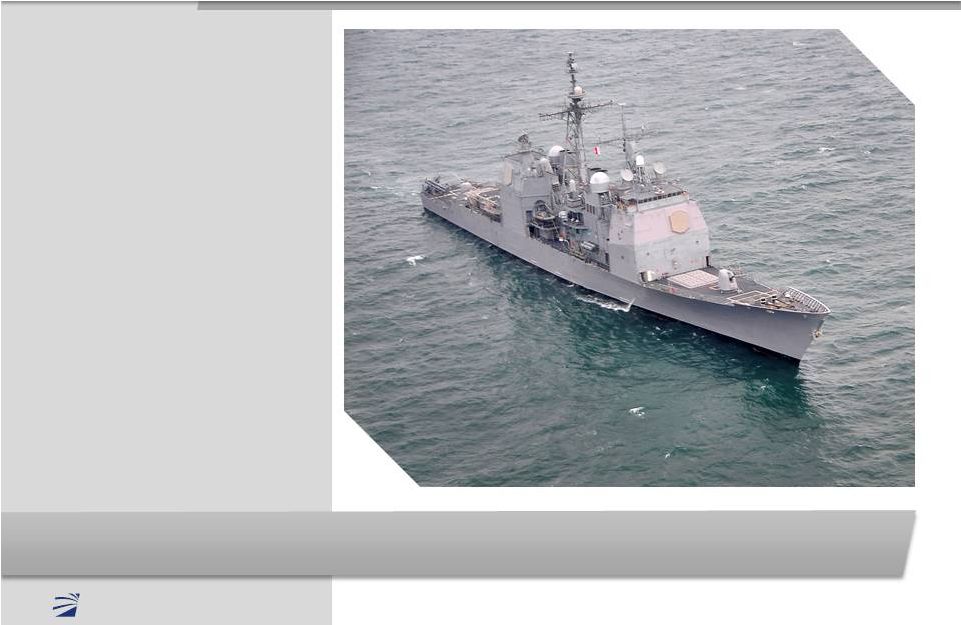
SEWIP: Countering new emerging peer threats
Delivered best-of-breed RF, microwave and digital receiver subsystems
•
Naval surface fleet EW
upgrade: 100+ ships
•
Block 2:
–
Upgrade to AN/SLQ-32
passive detection
–
Opportunity to expand
through LNX & Micronetics
–
Entering LRIP; production
expected GFY15
•
Block 3:
–
Electronic attack
–
Lockheed and Raytheon
partnering
–
Upside opportunity due to
strategic supplier relationship
with Lockheed on Block 2
12
©
2013 Mercury Systems, Inc.
Strong partnership with Prime driving Mercury content
expansion |
 13
©
2013 Mercury Systems, Inc.
Patriot missile defense: Next-generation ground radar
Services-led
design
win
–
Prime
outsourcing
example
•
Sophisticated radar
processor Application
Ready Subsystem
•
Production awards received
to date: $41M
–
UAE, Taiwan, Saudi Arabia
•
Potential future FMS awards
–
Up to 15 countries including
Kuwait, Qatar and Turkey etc
•
US Army Patriot upgrade
–
First PO received for US Army
Foreign Military and US Army potential upgrades driving
growth |
 14
Healthy mix of design wins
Mercury’s perspective on phase, timing and potential value
1
TD
EMD
LRIP
FRP
= Design Win
1
Notes: Remaining potential values and timing reflect Management’s current
estimates and are subject to change.
**
Programs are currently being competed with multiple Primes.
14
©
2013 Mercury Systems, Inc.
FMS
BOA
$300-$375M
$350M?
$45-$185M
$100-$165M
$60-$120M
$35-$105M
$55-$85M
$40-60M
$35-$55M
$50M
IRAD
AMDR**
JCREW I1B1
ADAS DVE
**
SEWIP Blk 3**
F-16 AESA**
Radar Upgrade
E2D Hawkeye
**
Filthy Buzzard
DRFM
BAMS Radar
SSEE Mods
Patriot US Army
~ Remaining
Potential Value
FY15
FY09
FY10
FY11
FY12
FY13
FY14 |
 15
©
2013 Mercury Systems, Inc.
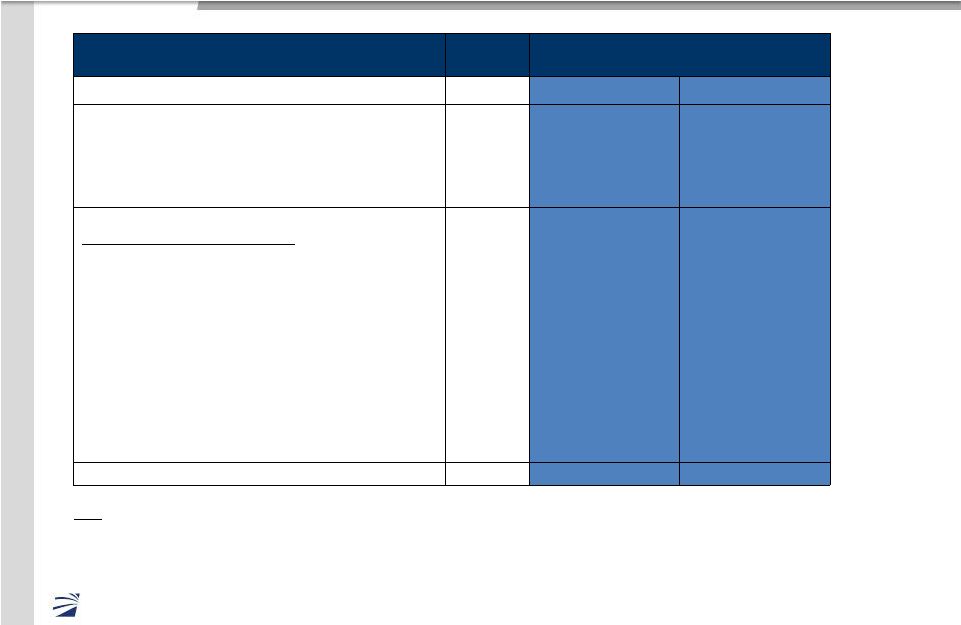
Embedded
computing consolidation
Primes reducing in-house engineering while
consolidating supply chain for subsystem
design & integration
Primes retaining platform system design & integration
RF component
/ assembly consolidation
Outsourcing by large defense Prime contractors could
substantially increase our market opportunity
•
Reduce risk given firm-fixed
price contracts
•
Address high-fixed cost
operating model
•
Increase success rate on new
programs and production
recompetes
•
Develop differentiated, more
affordable solutions with fewer
internal R&D dollars
•
Compress upgrade
development and deployment
cycles
•
Consolidate supply base at
subsystem level
15
©
2013 Mercury Systems, Inc.
Mercury has strategically positioned its business to help |
 16
©
2013 Mercury Systems, Inc.
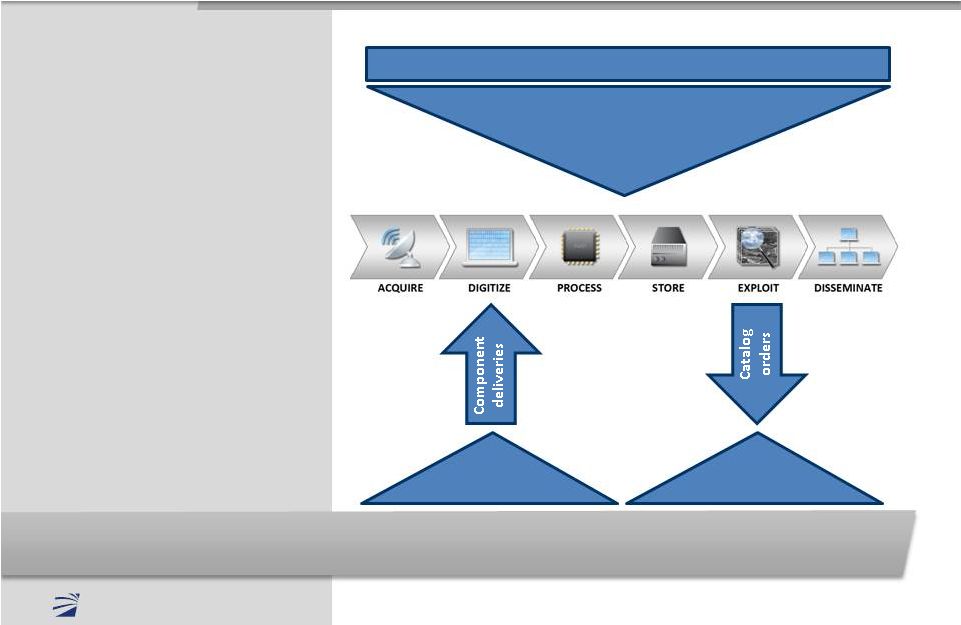
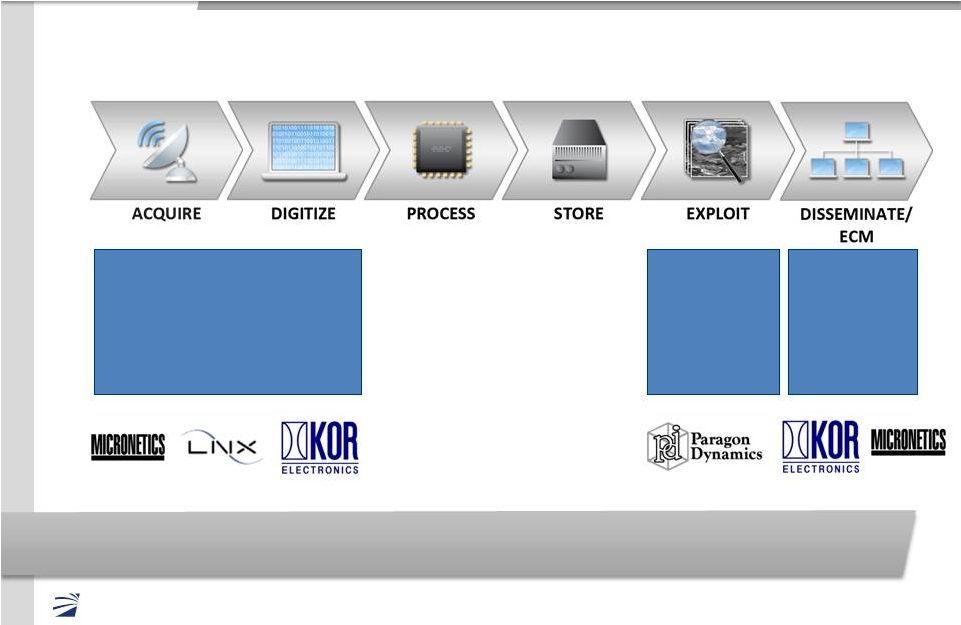
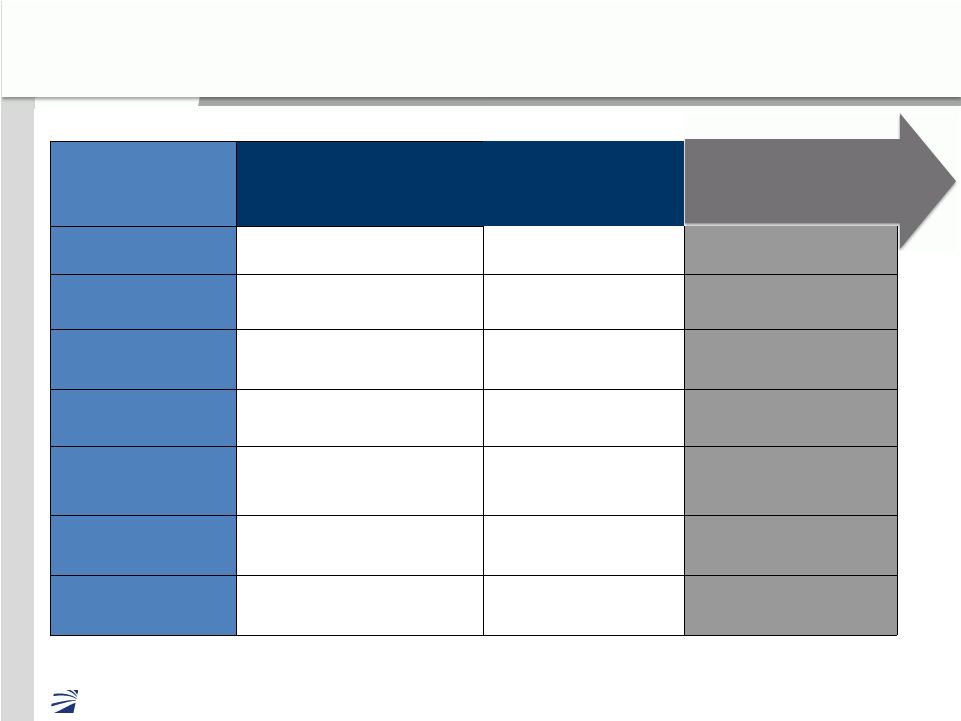
Exploitation
and
Fusion
Tailored feeds
directly to field
forces or ECM
RF acquisition targets:
RF transmitters / receivers
Power amplifiers
Synthesizers
DRFM
Through acquisition we have created a unique, scalable
microwave, RF and digital solutions platform
Sensor Processing Chain
We view our market opportunity as providing end-to-end,
open sensor processing subsystems to the Primes |
 17
©
2013 Mercury Systems, Inc.
Well positioned for market rebound
•
Focused on important defense and intelligence priorities
•
Well positioned on key programs and platforms
•
Capabilities help address today’s and tomorrow’s threats
•
Business model aligned with defense procurement reform
•
Outsourcing partner to Primes for open sensor subsystems
•
Pursuing acquisitions, when end market conditions improve, to
gain additional capability and scale |
 Financial
Overview ©
2013 Mercury Systems, Inc. |
 19
©
2013 Mercury Systems, Inc.
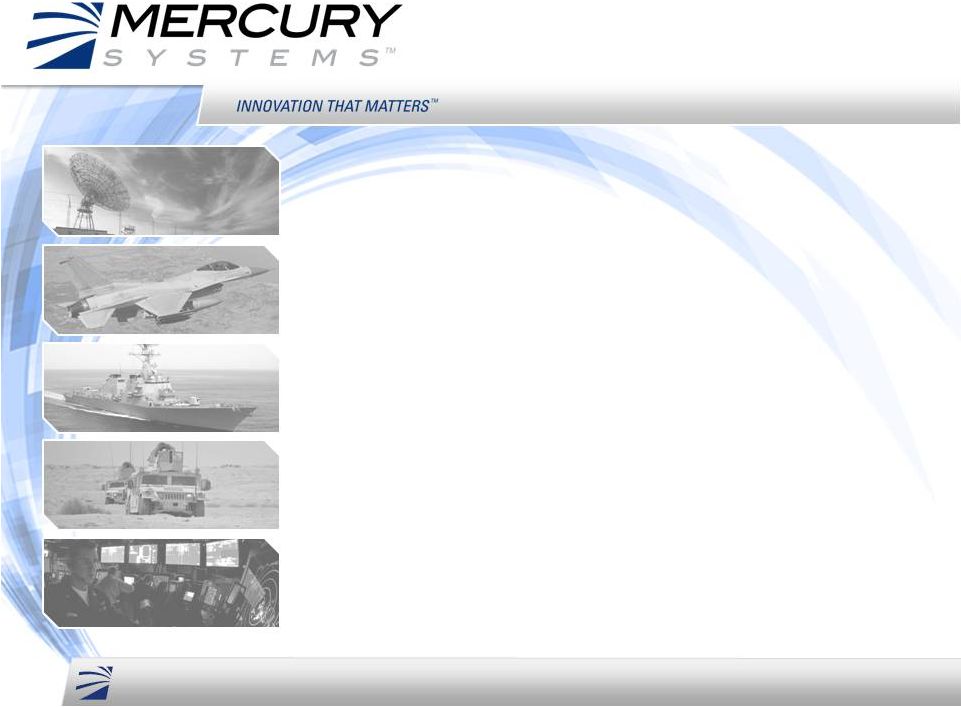
Revenue summary by market
Defense revenue CAGR of 15% FY08-FY12 130
145
158
181
230
60
44
42
48
15
0
50
100
150
200
250
FY08
FY09
FY10
FY11
FY12
Revenue ($M)
Defense
Commercial
190
189
200
229
245
Notes:
•
FY08-10 figures adjusted for discontinued operations. |
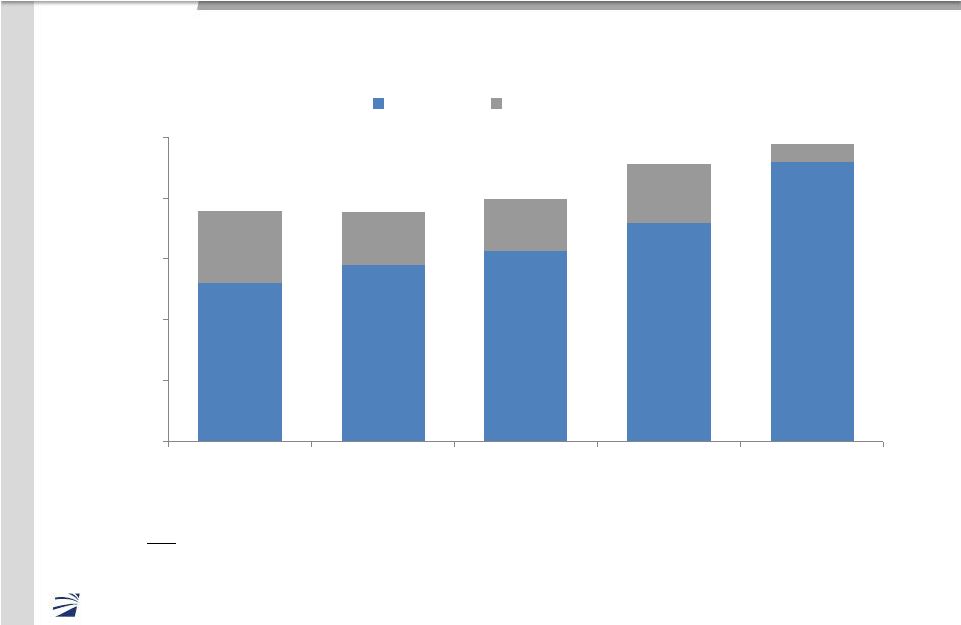
 FY08
– FY12: Improved financial performance
GAAP
FY08
Actual
FY09
Actual
FY10
Actual
FY11
Actual
FY12
Actual
Bookings ($M)
199
210
206
202
231
Revenue ($M)
190
189
200
229
245
Gross Margin
% Revenue
57.8%
55.8%
56.3%
56.8%
55.6%
Operating Expenses ($M)
Amort/Acq. Costs
Restructuring Expense
115
5
4
98
2
2
95
2
105
2
106
5
3
Operating Income ($M)
% Revenue
(5)
(2.8%)
8
4.1%
17
8.7%
25
10.9%
30
12.3%
EPS (Continuing)
EPS (Amort/Acq. Costs)
($0.21)
$0.35
$1.22
$0.71
($0.06)
$0.75
($0.12)
Adj EBITDA ($M)
% Revenue
23
11.8%
23
12.1%
30
14.9%
41
17.9%
49
20.0%
Operating Cash Flow ($M)
14
11
16
31
32
20
©
2013 Mercury Systems, Inc. |
 21
©
2013 Mercury Systems, Inc.
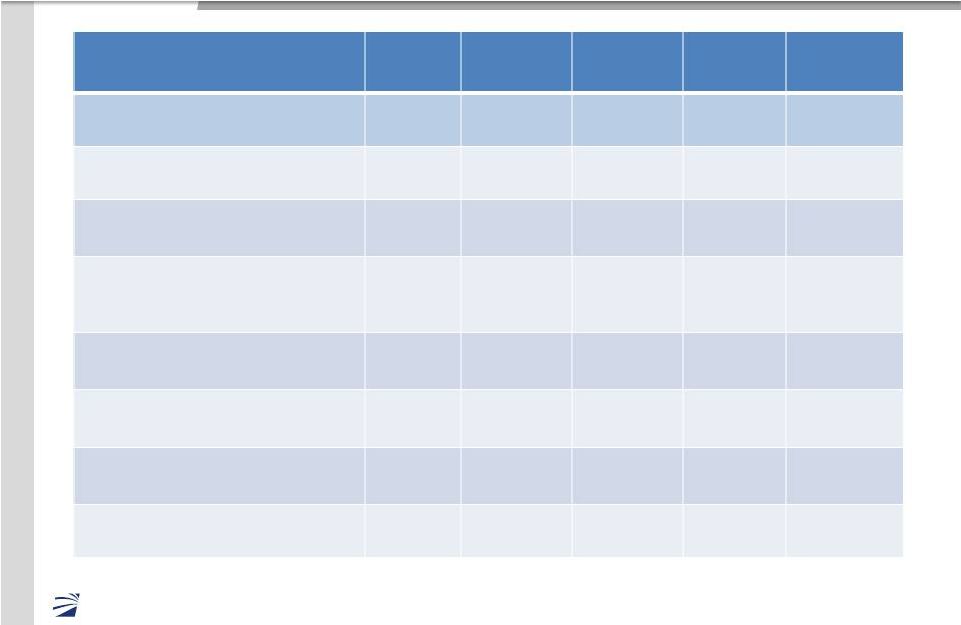
Profitability restored and improved through FY12
Notes:
(5)
8
17
25
30
($0.21)
$0.35
$1.22
$0.71
$0.75
-10
0
10
20
30
40
FY08
FY09
FY10
FY11
FY12
Operating Income $M
Earnings per Share
FY08 – FY12 figures are as reported in the Company’s fiscal 2012 Form 10K. FY10 Earnings per Share
of $1.22 were positively influenced by $0.68 from the partial reversal of the valuation allowance against deferred tax assets and
an effective FY10 tax rate benefit of approximately 5%. FY11 and FY12 EPS
includes the impact of 5.6M additional shares from our follow-on public stock offering on February 16, 2011. |
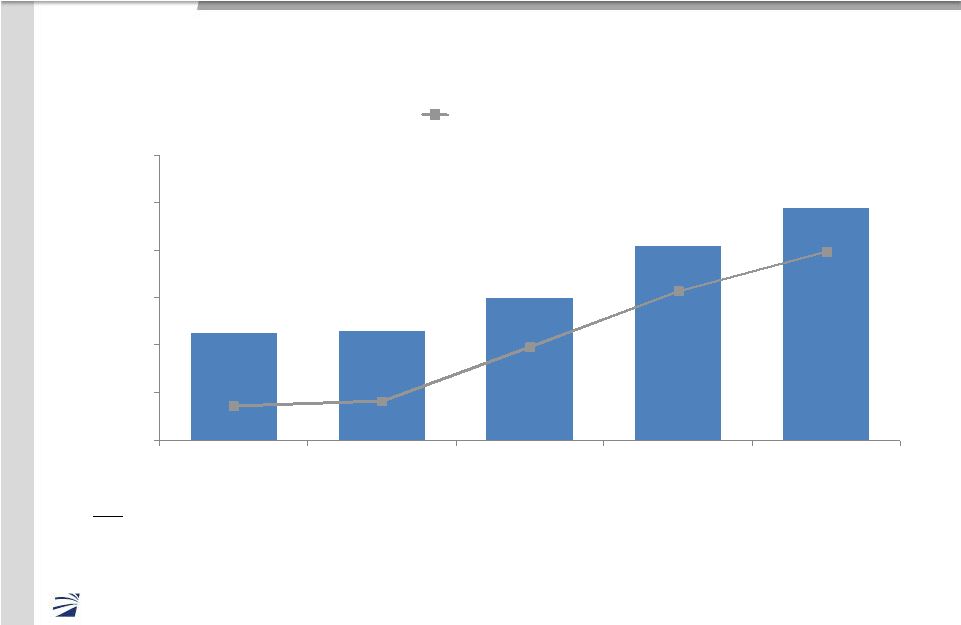 22
©
2013 Mercury Systems, Inc.
Adjusted EBITDA more than doubled FY08-FY12
23
23
30
41
49
12%
12%
15%
18%
20%
0
10
20
30
40
50
60
FY08
FY09
FY10
FY11
FY12
Adj. EBITDA ($M, %)
EBITDA Margin %
•
FY08-FY09 figures are as reported in the Company’s fiscal 2010 Form 10K. FY10-12
figures are as reported in the Company’s fiscal 2012 Form 10K.
•
Adjusted EBITDA excludes interest income and expense, income taxes, depreciation,
amortization of acquired intangible assets, restructuring expense, impairment of
long-lived assets, acquisition and other related expenses, fair value adjustments from
purchase accounting, and stock-based compensation costs.
Notes: |
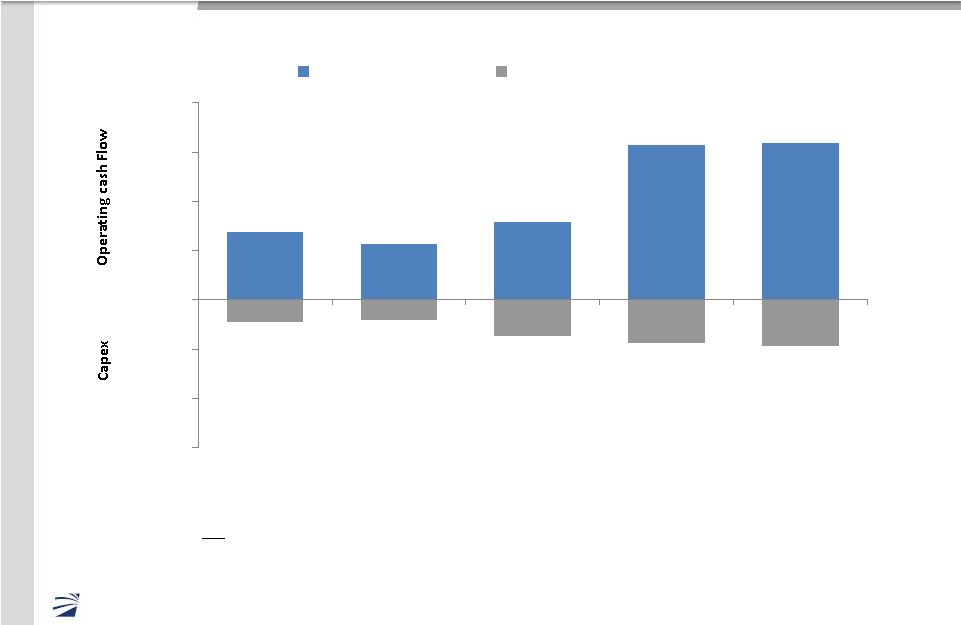 23
©
2013 Mercury Systems, Inc.
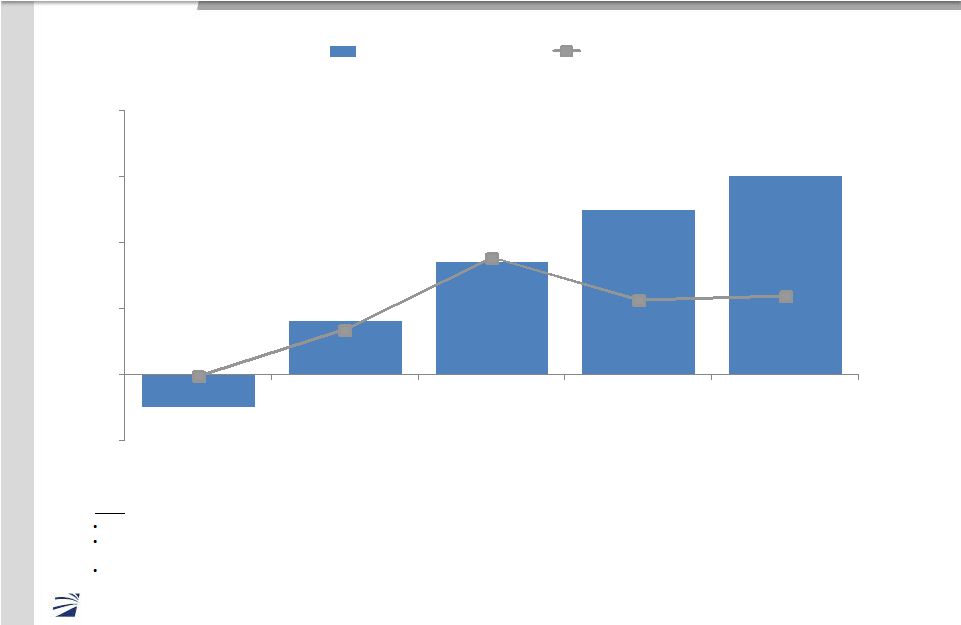
Ended FY12 with healthy free cash flow from operations
Note:
•
Free cash flow is defined as cash provided by operating activities less capital
expenditures. 14
11
15
32
32
(5)
(4)
(7)
(9)
(10)
-30
-20
-10
0
10
20
30
40
FY08
FY09
FY10
FY11
FY12
Free Cash Flow $M
Operating cash flow
Capital expenditures
9
7
8
23
22 |
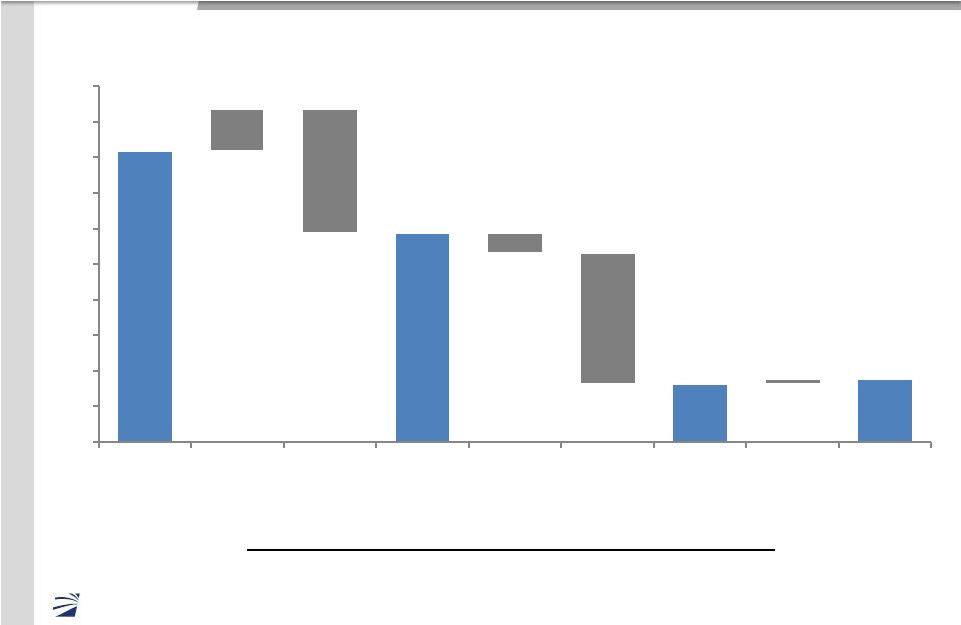 24
©
2013 Mercury Systems, Inc.
Healthy balance sheet with sufficient liquidity
No debt and expanded credit facility
•
$500M Shelf Registration
•
$200M senior unsecured revolving line of credit
(no drawdowns)
Other financing sources available
163
31
(70)
116
(11)
(74)
3
34
0
20
40
60
80
100
120
140
160
180
200
FY11 Ending
Free Cash
Flow & Other
KOR Acq
FY12 Ending
Free Cash
Flow & Other
Micronetics
Acq
Q1'13 Ending
Free Cash
Flow & Other
Q2'13 Ending
Cash and Marketable Securities ($M)
23 |
 25
©
2013 Mercury Systems, Inc.
Achieved historic target business model in FY12
GAAP
FY08
FY09
FY10
FY11
Revenue
100%
100%
100%
100%
100%
100%
Gross Margin
58%
56%
56%
57%
56%
54+%
SG&A and
other OPEX
(1)
37%
29%
27%
26%
25%
Low-mid 20’s
R&D
24%
22%
21%
19%
19%
High Teens
Operating Income
(3%)
4%
9%
11%
12%
12-13%
Adj. EBITDA
12%
12%
15%
18%
20%
17-18%
FY12
Target
Business
Model
(1)
Other OPEX includes Amortization of Acquired Intangible Assets, Impairment of Goodwill and
Long Lived Assets, Change in the fair value of the liability related to the LNX earn-out,
Restructuring, Gain on Sale of Long Lived Assets, and Acquisition Costs and Other Related
Expenses. |
 26
©
2013 Mercury Systems, Inc.
Guidance: Strong performance track record
Q1
Q2
Q3
Q4
Reported
Guidance
Reported
Guidance
Reported
Guidance
Reported
Guidance
2008
Revenue ($M)
49.2
48.0
52.6
51.0
56.5
53.0-55.0
55.2
53.0-56.0
EPS ($)
0.09
(0.08)
0.04
(0.05)
0.04
(0.04)-0.00
0.01
(0.05)-0.01
2009
Revenue ($M)
49.1
47.0-49.0
50.7
47.0-49.0
50.6
48.0-50.0
48.4
46.0-48.0
EPS ($)
0.07
(0.07)-(0.03)
0.03
(0.05)-0.00
0.20
0.05-0.09
0.13
0.05-0.08
2010
Revenue ($M)
47.4
43.0-45.0
45.2
40.0-42.0
43.6
41.0-43.0
63.6
58.0-60.0
EPS ($)
0.19
0.03-0.08
0.08
(0.08)-(0.04)
0.16
(0.15)-(0.11)
0.77
0.25-0.28
2011
Revenue ($M)
52.1
48.0-50.0
55.5
54.0-55.0
59.9
58.0-60.0
61.2
57.0-59.0
EPS ($)
0.16
0.03-0.06
0.22
0.10-0.12
0.20
0.16-0.18
0.14
0.11-0.13
2012
Revenue ($M)
49.1
54.0-56.0
68.0
67.0-69.0
67.0
65.0-68.0
60.9
60.0-66.0
EPS ($)
0.09
0.10-0.12
0.30
0.24-0.27
0.17
0.09-0.11
0.19
0.04-0.10
2013
Revenue ($M)
49.4
51.0-57.0
49.8
43.0-49.0
44.0-50.0
EPS ($)
(0.24)
(0.05)-0.00
(0.16)
(0.24)-(0.17)
(0.08)-(0.02)
(1)
(1)
Notes:
(1)
The guidance included herein is from the Company’s earnings release and is as of the
date of the earnings release for the preceding quarter. The Company is neither reconfirming such
guidance as of the date of this presentation nor assuming any obligation to update or revise
such guidance. |
 Defense
industry conditions are currently challenging •
Adversely impacting financial results
•
Restructuring lead to $25M of recurring annualized savings
•
Forecasting more conservatively
•
Focused on managing controllable items to preserve liquidity
•
Solid balance sheet with improved financial flexibility
©
2013 Mercury Systems, Inc.
27
Substantial operating leverage when defense market rebounds
|
 28
©
2013 Mercury Systems, Inc.
Q3 FY13 guidance (as of January 29, 2013)
Q2 FY13
Actual
Quarter Ending March 31, 2013
Low
High
Revenue
$50
$44
$50
GAAP EPS (Continuing)
($0.16)
($0.08)
($0.02)
Adj EBITDA
$1.0
($2.5)
$1.0
Note -
Adj EBITDA Adjustments:
Net income (Continuing)
(4.8)
(2.3)
(0.5)
Interest (income) expense, net
0.0
0.0
0.0
Income tax (benefit) expense
(2.2)
(7.2)
(5.5)
Depreciation
2.2
2.1
2.1
Amortization of acquired intangible assets
2.2
2.4
2.4
Acquisition costs and other related expenses
0.1
0.0
0.0
Restructuring expenses
0.2
0.5
0.5
Fair value adjustments from purchase accounting
1.3
0.1
0.1
Stock-based compensation cost
2.0
1.9
1.9
Adj EBITDA
$1.0
($2.5)
$1.0
(1)
Notes:
(1)
The guidance included herein is from the Company’s earnings release and is as of the
date of the earnings release for the preceding quarter. The Company is neither reconfirming such
guidance as of the date of this presentation nor assuming any obligation to update or revise
such guidance. |
 29
©
2013 Mercury Systems, Inc.
Updated business model raises Adjusted EBITDA target
In a more normalized industry environment
(1)
Other OPEX includes, Impairment of Goodwill and Long Lived Assets, Change in the fair value of
the liability related to the LNX earn-out, Restructuring, Gain on Sale of Long Lived Assets,
and Acquisition Costs and Other Related Expenses.
(2)
Amortization includes fair value adjustment from purchase accounting and $4.9M LNX earnout
reversal in FY12. GAAP
FY12
Historic
Target Business
Model
Revenue
100%
100%
100%
Gross Margin
56%
54+%
45-50%
SG&A and
other OPEX
(1)
25%
Low-mid 20’s
Low 20’s
R&D
19%
High Teens
11-13%
Amortization
(2)
0%
—
2-3%
Operating Income
12%
12-13%
12-13%
Adj EBITDA
20%
17-18%
18-22%
Current Target
Business Model
Current Target
Business Model |
 30
©
2013 Mercury Systems, Inc.
Financial summary
•
15% Defense revenue CAGR FY08-FY12
•
Profitability restored and improved through FY12
•
Converted earnings growth to healthy free cash flows through FY12
•
Healthy balance sheet; zero debt; $200M revolving credit facility
•
Exceeded historic target model in FY12; new targets established (for a
more normalized industry environment)
•
Reduced cost structure in response to challenging industry environment
•
Substantial operating leverage when industry conditions improve |