Attached files
| file | filename |
|---|---|
| 8-K - 8-K - Extra Space Storage Inc. | a13-6929_18k.htm |
Exhibit 99.1
|
|
Well Managed, Well Positioned, Well Capitalized. |
|
|
LEADING THE INDUSTRY BY DESIGN Industry-leading performance Operational excellence and focus Experienced management team Leading by design with an experienced management team, a robust technology platform and a high-quality, well-located portfolio. WELL-MANAGED, WELL POSITIONED, WELL CAPITALIZED. |
|
|
LEADING THE INDUSTRY BY DESIGN Strong, stable industry High-quality portfolio Strong acquisitions pipeline WELL-MANAGED, WELL POSITIONED, WELL CAPITALIZED. Leading by design with an experienced management team, a robust technology platform and a high-quality, well-located portfolio. |
|
|
LEADING THE INDUSTRY BY DESIGN Robust financial structure providing optionality Disciplined deployment of capital Dividend policy to naturally deliver and fuel growth WELL-MANAGED, WELL POSITIONED, WELL CAPITALIZED. Leading by design with an experienced management team, a robust technology platform and a high-quality, well-located portfolio. |
|
|
DRIVING OUR DOUBLE DIGIT GROWTH DRIVING GROWTH Leading by Design Core Property Performance Third-party Management ManagementPlus Peace of Mind Acquisitions Intelligent growth Development Accretive lease up Leading platform and people Tenant Insurance |
|
|
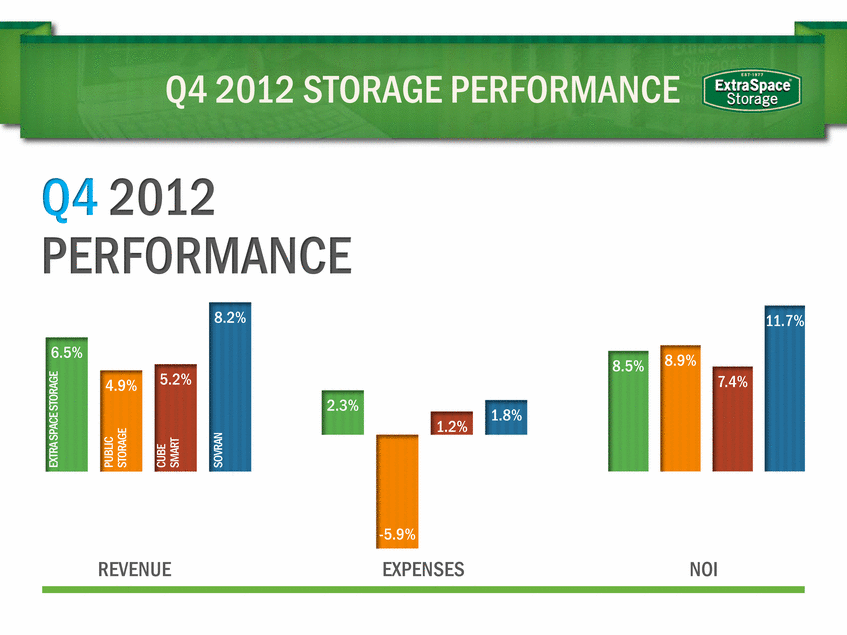
Q4 2012 STORAGE PERFORMANCE 2.3% -5.9% 1.2% 1.8% Q4 2012 PERFORMANCE 6.5% 4.9% 5.2% 8.2% 8.5% 8.9% 7.4% 11.7% REVENUE EXPENSES NOI SOVRAN PUBLIC STORAGE CUBE SMART EXTRA SPACE STORAGE |
|
|
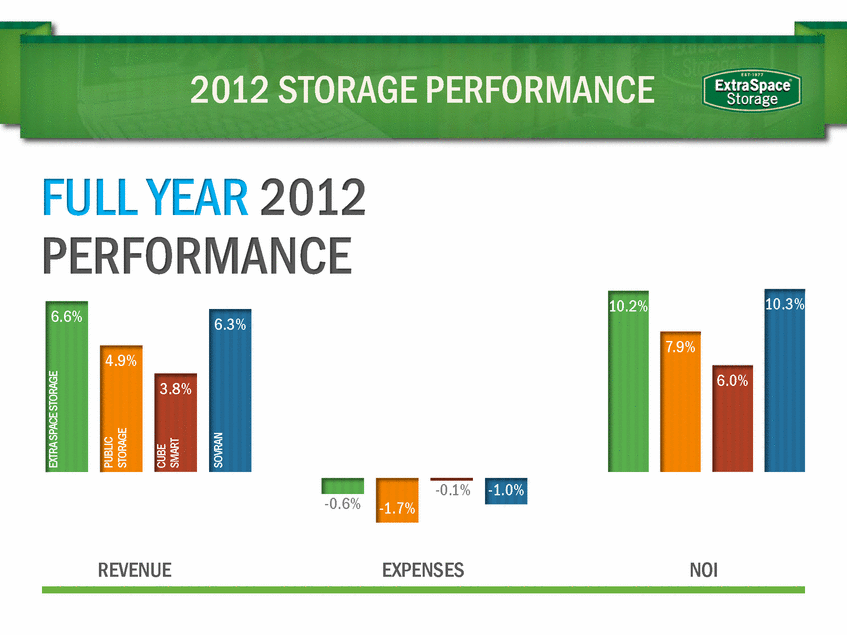
2012 STORAGE PERFORMANCE -0.6% -1.7% -0.1% -1.0% FULL YEAR 2012 PERFORMANCE 6.6% 4.9% 3.8% 6.3% 10.2% 7.9% 6.0% 10.3% REVENUE EXPENSES NOI SOVRAN PUBLIC STORAGE CUBE SMART EXTRA SPACE STORAGE |
|
|
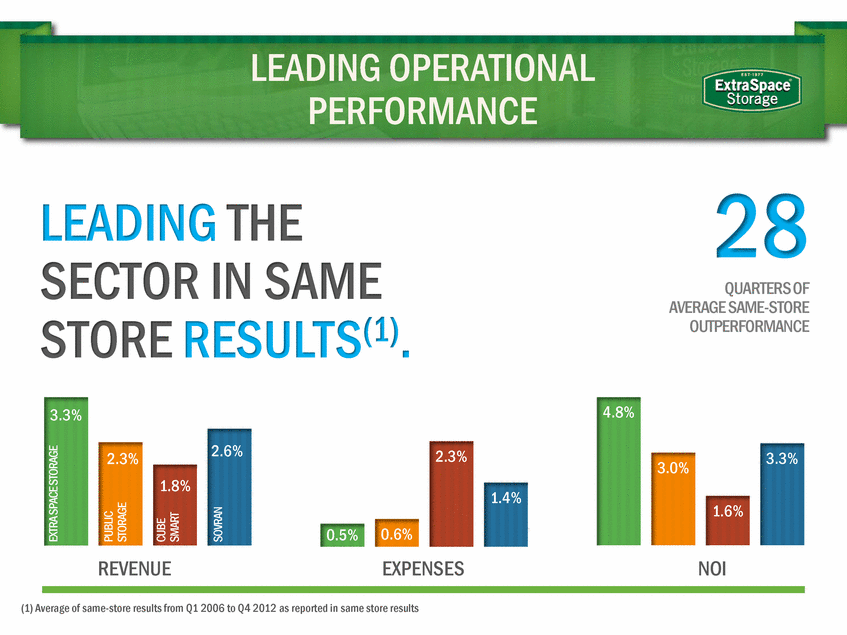
LEADING OPERATIONAL PERFORMANCE 28 QUARTERS OF AVERAGE SAME-STORE OUTPERFORMANCE 3.3% 2.3% 1.8% 2.6% 0.5% 0.6% 2.3% 1.4% 4.8% 3.0% 1.6% 3.3% REVENUE EXPENSES NOI SOVRAN PUBLIC STORAGE CUBE SMART EXTRA SPACE STORAGE (1) Average of same-store results from Q1 2006 to Q4 2012 as reported in same store results LEADING THE SECTOR IN SAME STORE RESULTS(1). |
|
|
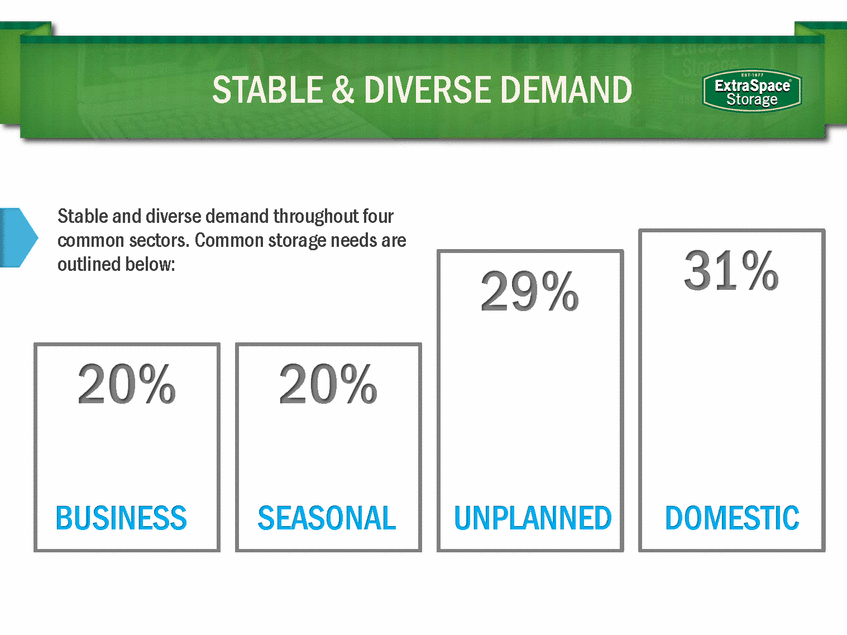
STABLE & DIVERSE DEMAND 20% 20% 29% 31% Stable and diverse demand throughout four common sectors. Common storage needs are outlined below: BUSINESS SEASONAL UNPLANNED DOMESTIC |
|
|
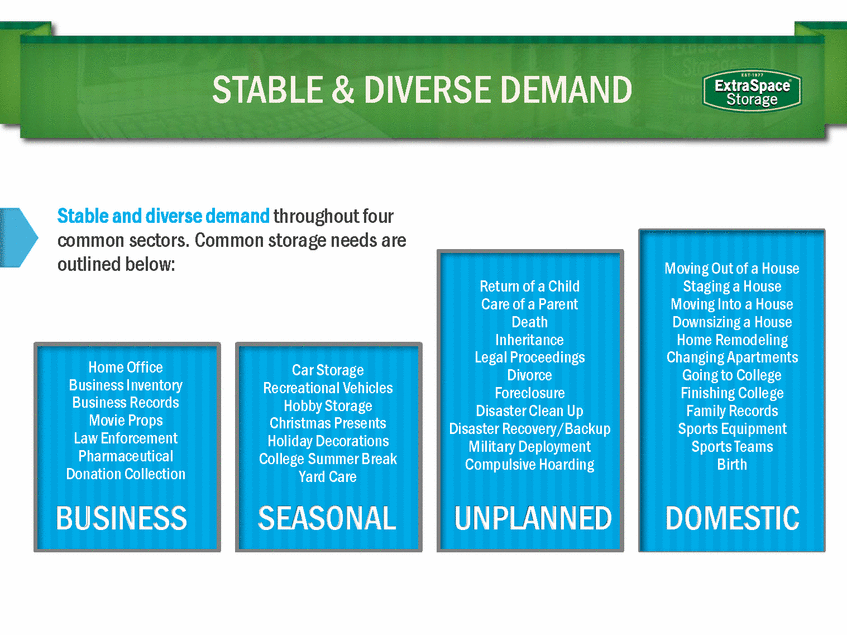
STABLE & DIVERSE DEMAND Moving Out of a House Staging a House Moving Into a House Downsizing a House Home Remodeling Changing Apartments Going to College Finishing College Family Records Sports Equipment Sports Teams Birth Stable and diverse demand throughout four common sectors. Common storage needs are outlined below: BUSINESS SEASONAL UNPLANNED DOMESTIC Home Office Business Inventory Business Records Movie Props Law Enforcement Pharmaceutical Donation Collection Car Storage Recreational Vehicles Hobby Storage Christmas Presents Holiday Decorations College Summer Break Yard Care Return of a Child Care of a Parent Death Inheritance Legal Proceedings Divorce Foreclosure Disaster Clean Up Disaster Recovery/Backup Military Deployment Compulsive Hoarding |
|
|
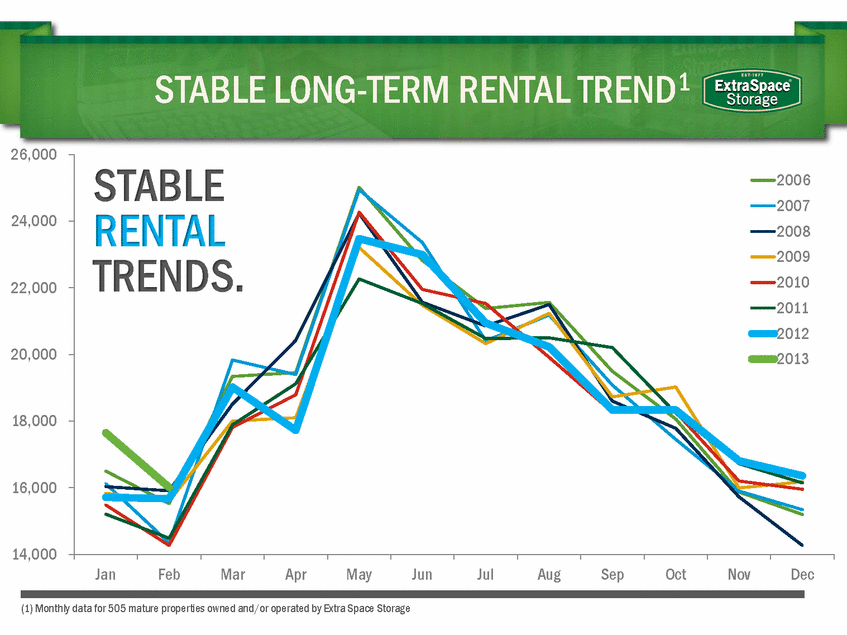
STABLE LONG-TERM RENTAL TREND1 (1) Monthly data for 505 mature properties owned and/or operated by Extra Space Storage STABLE RENTAL TRENDS. 14,000 16,000 18,000 20,000 22,000 24,000 26,000 Jan Feb Mar Apr May Jun Jul Aug Sep Oct Nov Dec 2006 2007 2008 2009 2010 2011 2012 2013 |
|
|
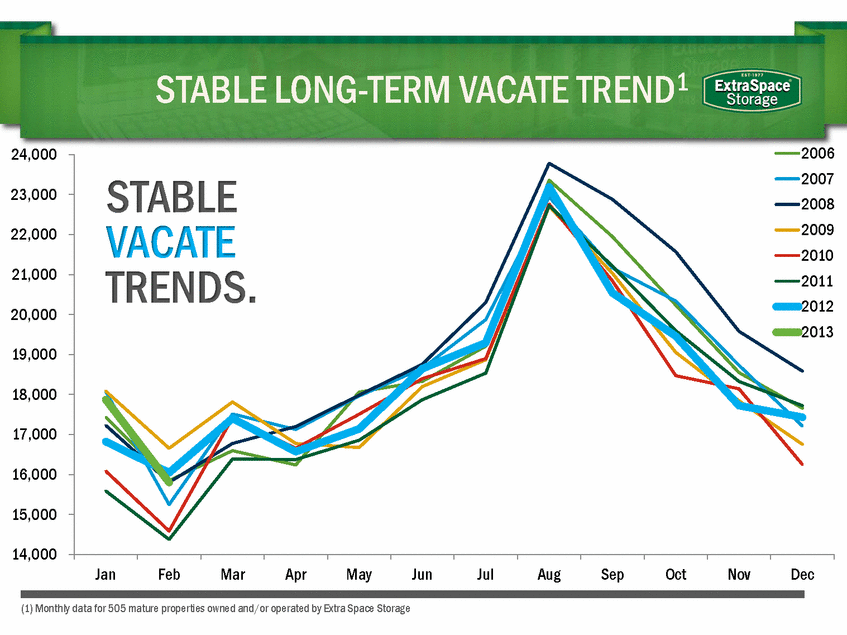
STABLE LONG-TERM VACATE TREND1 (1) Monthly data for 505 mature properties owned and/or operated by Extra Space Storage STABLE VACATE TRENDS. 14,000 15,000 16,000 17,000 18,000 19,000 20,000 21,000 22,000 23,000 24,000 Jan Feb Mar Apr May Jun Jul Aug Sep Oct Nov Dec 2006 2007 2008 2009 2010 2011 2012 2013 |
|
|
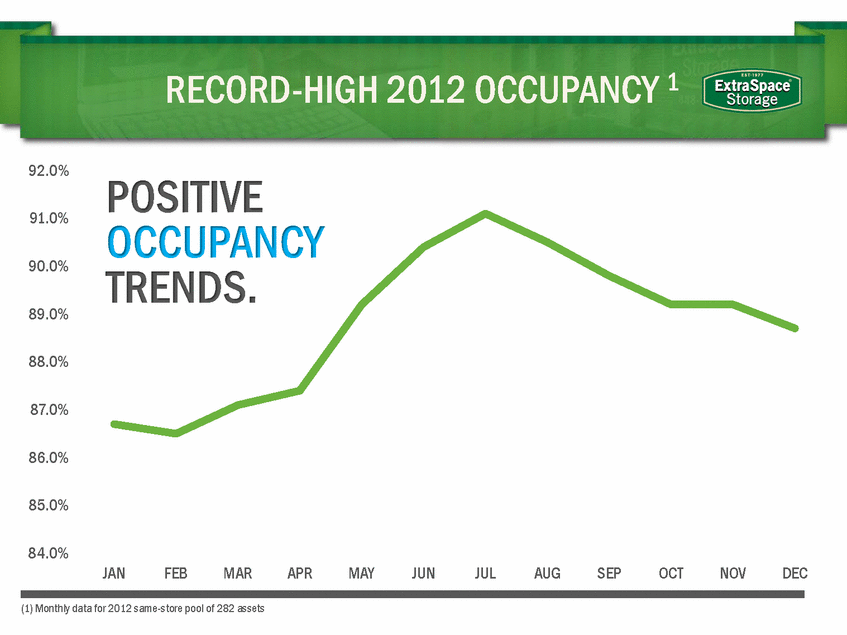
RECORD-HIGH 2012 OCCUPANCY 1 84.0% 85.0% 86.0% 87.0% 88.0% 89.0% 90.0% 91.0% 92.0% JAN FEB MAR APR MAY JUN JUL AUG SEP OCT NOV DEC (1) Monthly data for 2012 same-store pool of 282 assets POSITIVE OCCUPANCY TRENDS. |
|
|
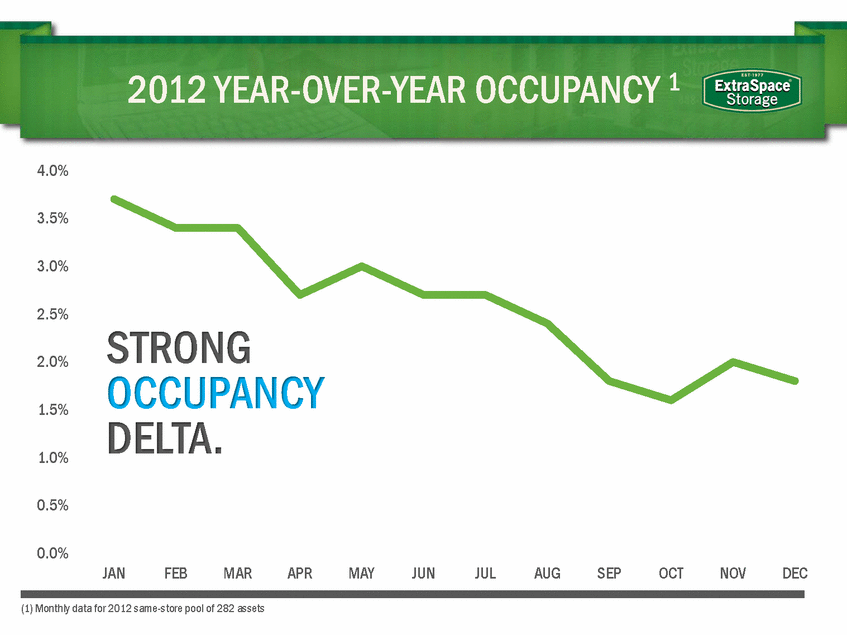
2012 YEAR-OVER-YEAR OCCUPANCY 1 0.0% 0.5% 1.0% 1.5% 2.0% 2.5% 3.0% 3.5% 4.0% JAN FEB MAR APR MAY JUN JUL AUG SEP OCT NOV DEC (1) Monthly data for 2012 same-store pool of 282 assets STRONG OCCUPANCY DELTA. |
|
|
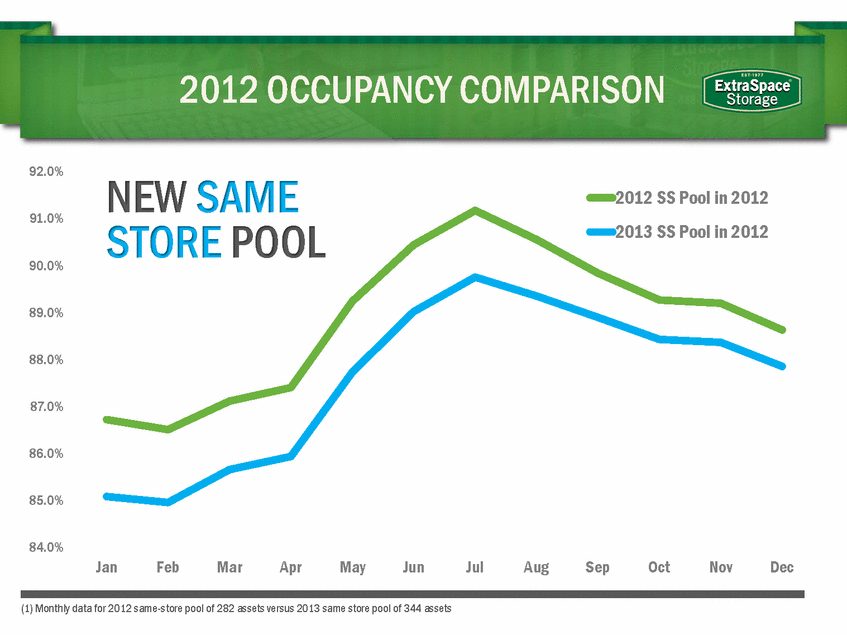
2012 OCCUPANCY COMPARISON (1) Monthly data for 2012 same-store pool of 282 assets versus 2013 same store pool of 344 assets NEW SAME STORE POOL 84.0% 85.0% 86.0% 87.0% 88.0% 89.0% 90.0% 91.0% 92.0% Jan Feb Mar Apr May Jun Jul Aug Sep Oct Nov Dec 2012 SS Pool in 2012 2013 SS Pool in 2012 |
|
|
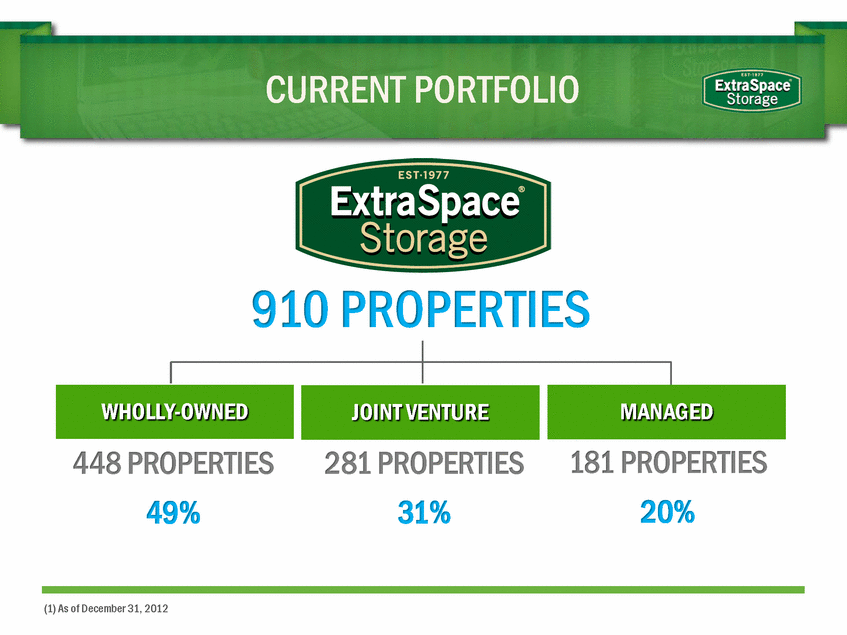
CURRENT PORTFOLIO (1) As of December 31, 2012 JOINT VENTURE MANAGED 448 PROPERTIES 49% WHOLLY-OWNED 281 PROPERTIES 31% 181 PROPERTIES 20% 910 PROPERTIES |
|
|
HIGH CONCENTRATION IN TOP MARKETS |
|
|
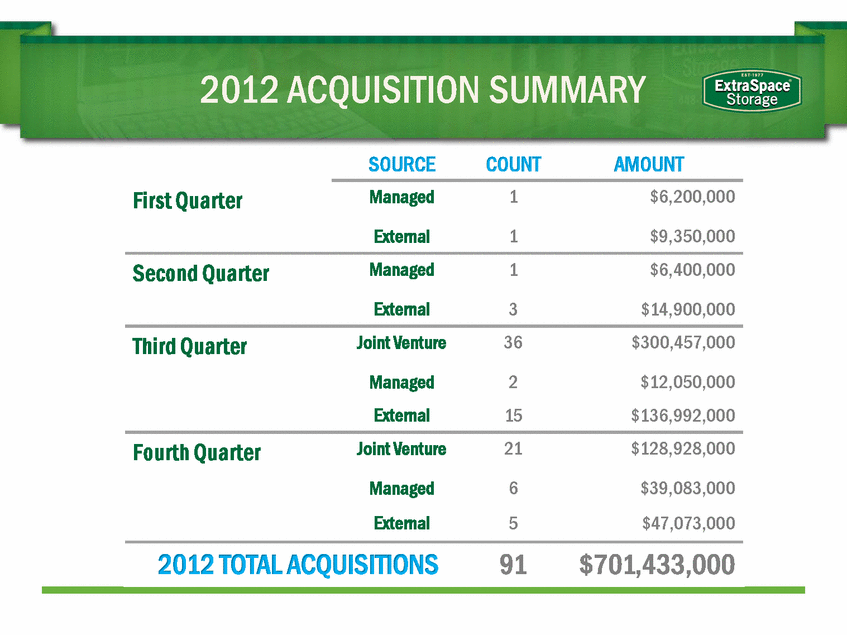
2012 ACQUISITION SUMMARY SOURCE COUNT AMOUNT First Quarter Managed 1 $6,200,000 External 1 $9,350,000 Second Quarter Managed 1 $6,400,000 External 3 $14,900,000 Third Quarter Joint Venture 36 $300,457,000 Managed 2 $12,050,000 External 15 $136,992,000 Fourth Quarter Joint Venture 21 $128,928,000 Managed 6 $39,083,000 External 5 $47,073,000 2012 TOTAL ACQUISITIONS 91 $701,433,000 |


