Attached files
| file | filename |
|---|---|
| 8-K - 8-K - ATLANTIC POWER CORP | a12-29803_48k.htm |
Exhibit 99.1
|
|
Q4 and YE 2012 Investor Presentation March 2013 |
|
|
Cautionary Note Regarding Forward-looking Statements 2 To the extent any statements made in presentation contain information that is not historical, these statements are forward-looking statements or forward-looking information, as applicable, within the meaning of Section 27A of the U.S. Securities Act of 1933, as amended, and Section 21E of the U.S. Securities Exchange Act of 1934, as amended, and under Canadian securities law (collectively “forward-looking statements”). These forward-looking statements relate to, among other things: Atlantic Power Corporation’s (“AT”, “Atlantic Power” or the “Company”) expectations regarding the outcome of recontracting discussions related to certain projects; expectations regarding project cash flows; expectations regarding the completion of construction at the Piedmont project and expected date for commercial operation thereof; expectations regarding growth, acquisitions and leverage related to such acquisitions; expectations regarding the availability of tax equity investments; and outlook on growth at Atlantic Power. Forward-looking statements can generally be identified by the use of words such as “should,” “intend,” “may,” “expect,” “believe,” “anticipate,” “estimate,” “continue,” “plan,” “project,” “will,” “could,” “would,” “target,” “potential” and other similar expressions. In addition, any statements that refer to expectations, projections or other characterizations of future events or circumstances are forward-looking statements. Although AT believes that the expectations reflected in such forward-looking statements are reasonable, such statements involve significant risks and uncertainties, should not be read as guarantees of future performance or results, and will not necessarily be accurate indications of whether or not or the times at or by which such performance or results will be achieved, and undue reliance should not be placed on such statements. Certain material factors or assumptions are applied in making forward-looking statements which may prove to be incorrect, including, but not limited to, third party projections of regional fuel and electric capacity and energy prices or cash flows that are based on assumptions about future economic conditions and courses of action as well as factors and assumptions set out below. Actual results may differ materially from those expressed or implied in such statements. Important factors that could cause actual results to differ materially from these expectations include, among other things: (i) the availability to AT of investment and acquisition opportunities; (ii) Atlantic Power’s access to capital and the state of the capital markets; (iii) the amount of distributions expected to be received from the company’s projects; (iv) the amount of dividends expected to be paid by AT in 2013; (v) the ability of the Company to syndicate its tax equity investment at Canadian Hills; (vi) the other risk factors relating to the Company and the power industry, as detailed from time to time in the Company’s filings with the SEC and Canadian securities regulators. Additional information about these factors and about the material factors or assumptions underlying such forward-looking statements may be found in the Company’s Form 10-K for the year ended December 31, 2012, under the section entitled “Risk Factors”. These forward-looking statements are made as of the date of this communication and, except as expressly required by applicable law, AT assumes no obligation to update or revise them to reflect new events or circumstances. All amounts in this presentation are in US$ unless otherwise stated and all amounts are approximate. There are non-GAAP measures used in this communication, including Project Adjusted EBITDA, Cash Available for Distribution and Payout Ratio. Atlantic Power believes that such non-GAAP measures are appropriate measures of the operating performance of Atlantic Power. Atlantic Power’s calculation of these measures may differ from the methodology used by other issuers and, accordingly, may not be comparable to other issuers. Project Adjusted EBITDA is defined as project income plus interest, taxes, depreciation and amortization (including non-cash impairment charges) and changes in fair value of derivative instruments. Project Adjusted EBITDA is not a measure recognized under GAAP and is therefore unlikely to be comparable to similar measures presented by other issuers and does not have a standardized meaning prescribed by GAAP. Management uses Project Adjusted EBITDA at the Project-level to provide comparative information about project performance. A reconciliation of Project Adjusted EBITDA to Project Income is provided on slide 34. A reconciliation of Cash Provided by Operating Activities to Cash Available for Distribution is provided on slide 33. Investors are cautioned that the Company may calculate this measure in a manner that is different from other issuers. The Company has not reconciled non-GAAP financial measures relating to the Projects Held for Sale to the directly comparable GAAP measures due to the difficulty in making the relevant adjustments on an individual project basis. The Company has not provided a reconciliation of forward-looking non-GAAP measures, due primarily to variability and difficulty in making accurate forecasts and projections, as not all of the information necessary for a quantitative reconciliation is available to the Company without unreasonable efforts. Disclaimer – Non-GAAP Measures |
|
|
OVERVIEW Atlantic Power 3 |

|
|
Company Overview 4 A Unique Power Infrastructure Company with an attractive yield Diversified fleet of 29 power generation projects totaling 2,117 MW of generating capacity in operation in 11 states and 2 provinces in North America An additional 53 MW under construction in Georgia Cash flows are largely contracted, producing stable cash flows intended to sustain a current monthly dividend (Cdn$0.40/share/year); current yield of approximately 7.0% Target accretive growth through proprietary / partnership development opportunities Dividend sustainability is supported by on-going accretive acquisitions As of March 6, market capitalization of approx. $660 MM and Enterprise Value of $2.7 Bn Access to capital in public markets in the United States and Canada Listed on both the TSX (TSX:ATP) and NYSE (NYSE:AT) Approx. 119.3 million shares outstanding |
|
|
Committed to Attractive and Balanced Total Return 5 Sustainable dividend Leverage core competencies and proven track record Capitalize on attractive growth opportunities Operating projects Mid- to late-stage development projects Ridgeline wind and solar development pipeline Target investment mix ~2/3 operating, ~1/3 construction and development Accretive to cash flows and net beneficial to leverage Focus on clean fuels, long-term PPAs, limited commodity exposure Solid growth + Recently Revised Payout Ratio Improved financial flexibility Enhance our ability to deliver on strategic and financial objectives Reduce leverage over time Sustainable over long term under a wide range of scenarios Stable income representing attractive yield Underpins growth component of total return Investment Overview |
|
|
Key Investment Considerations 6 Diversified portfolio – fuels, markets, counterparties Stable contracted cash flows; remaining pro forma PPA life averages 11.4 years Environmentally-friendly fuel mix; increasing renewables Proactive asset management approach Conservative risk management Reducing leverage over time Sustainable dividend and attractive yield Disciplined growth strategy; focus on accretive deals |
|
|
RECENT DEVELOPMENTS & OUTLOOK Atlantic Power 7 |
|
|
2012 Highlights 8 Record year for Project Adjusted EBITDA, Project Cash Distributions and Cash Available for Distribution Achieved dividend Payout Ratio of 100%, within our guidance range Added 450 MW operating capacity to our portfolio 2,117 net MW in operation post all asset sales Canadian Hills project (300 MW, wind) on line in December On budget and in time to qualify for production tax credits Arranged tax equity financing in December; paid off $265 million construction loan Completed acquisition of Ridgeline Energy, renewable energy developer, in December Meadow Creek project (120 MW, wind) went into commercial operation in December Advanced construction of Piedmont (53 MW, biomass); now expected on-line in March In January, announced agreement to sell three of our Florida projects for $136 million Increased average remaining PPA life by 58% to 11.4 years from 7.2 years, pro forma for asset sales and new plant additions |
|
|
Recent Developments Affecting Projections 9 Ontario Three projects have PPAs expiring in next few years Tunis in 2014, Kapuskasing and North Bay in 2017 Not in first group of recontracting discussions with Ontario Power Authority (“OPA”) Process behind schedule; appears increasingly challenging Impact of higher TransCanada tolls and reduced flows/ waste heat on project economics Florida Continued deterioration of recontracting outlook throughout 2012 Not selected by Progress Energy Florida in its RFP Tampa Electric announced self-build combined-cycle plant Decision to sell plants rather than operate on merchant basis Loss of cash flows post-sale Continued lower demand levels and power prices in New York Lower recontracting expectations for Selkirk post PPA expiration in 2014 Continued pressure on small existing merchant component at Selkirk Increased share of growth investments going into construction and development Development/construction spend upfront Contribution of cash flows lags |
|
|
Update on Construction and Asset Sales 10 Piedmont expected on line in late March Repairs to steam turbine completed and restart is under way Liquidated damages cover additional costs Cash distributions now expected to average $6 to $8 million annually (lower REC values) Potential sequestration impacts on Piedmont and Meadow Creek are not expected to be material 1603 federal cash grant for Piedmont – expect to receive $51 million, and have built-in components that can mitigate possible shortfall in amount granted by the program 1603 federal cash grant for Meadow Creek – expect to receive $56.5 million, and have guarantee in place from the seller to offset potential shortfall from sequestration Continuing portfolio rationalization program Florida asset sale currently expected to close in March; net proceeds $111 million Delta-Person sale currently expected to close in third quarter; net proceeds $9 million Sale process in second round for both Gregory and Path 15 |
|
|
Outlook for Acquisitions and Development 11 Continued support for renewable energy Renewable portfolio standards (RPS) Tax credits recently extended one year (U.S.) Production tax credit (PTC) or 30% investment tax credit (ITC) in lieu of PTC Must begin construction in 2013 Focusing Ridgeline’s efforts on wind and solar that can take advantage, including through acquisitions Also reviewing potential Rollcast biomass project with long-term PPA Other target areas Operating projects Mid- to late-stage development and construction Corporate acquisitions Acquisition opportunities look at least as strong as in 2012 Expect to invest $140 to $150 million in 2H 2013 |
|
|
Operations and Portfolio Optimization 12 Continuing to optimize performance of portfolio 10-year extensions of PPA and fuel supply agreement at Nipigon Installation of inlet fogging at Tunis to improve turbine efficiency New programmable controller at Mamquam to reduce ramping and improve water flow Nipigon – proposed replacement of Heat Recovery Steam Generator Capitalized cost of $11 million Payback would occur through increased efficiency and output beginning in 2014 Other significant maintenance projects scheduled in 2013 Tunis gas turbine major maintenance Mamquam turbine overhaul and Morris HRSG economizer 2013 major maintenance expense expected to be $34 million, plus $11 million capitalized expenditure for Nipigon HRSG 2012 major maintenance expense was $31.5 million |
|
|
2012 FINANCIAL RESULTS Atlantic Power 13 |
|
|
Presentation of “Assets Held for Sale” 14 Income statement impacts Included in “Income from discontinued operations” Excluded from Revenues, Project Income and our calculation of Project Adjusted EBITDA Cash flow statement impacts Cash flows received until closing Included in “Cash flows from operating activities” Included in our calculation of Cash Available for Distribution For Florida asset sales, cash received from 1/1/13 through closing is deducted from purchase price Adjusted asset sale proceeds included in “Cash flows from investing activities” 2012 Results of “Assets Held for Sale”: Project Adjusted EBITDA: $106.9 million (excluded from calculation) Cash Available for Distribution: $77 million (included in calculation) Projects included in “Assets Held for Sale”: Auburndale, Lake and Pasco (Florida projects) Path 15 (California transmission line) |
|
|
Full-Year 2012 Financial Results ($ millions) 15 2012 2011 Incr./(Decr.) Audited Project revenue (1) $440.4 $93.9 $346.5 Project (loss) (1) (31.9) (5.4) (26.5) Cash flows from operating activities 167.1 55.9 111.1 Unaudited Project Adjusted EBITDA (1) $225.6 $84.9 $140.7 Cash Available for Distribution 131.6 79.0 52.6 Total dividends declared to shareholders 131.8 86.4 45.5 Payout Ratio 100% 109% N/A (1) The Path 15, Auburndale, Lake and Pasco projects (the “Projects Held for Sale”) have been classified as assets held for sale. Accordingly, the revenues, project (loss) and Project Adjusted EBITDA of these assets have been classified as discontinued operations for the years ended December 31, 2012 and 2011, which means that the results from these discontinued operations are excluded from these figures. Project income (loss) attributable to the Projects Held for Sale was $18.3 million for the year ended December 31, 2012, compared to $39.0 million for the same period in 2011. Project Adjusted EBITDA attributable to the Projects Held for Sale was $106.9 million for the year ended December 31, 2012, compared to $100.4 million for the same period in 2011. The Company has not reconciled non-GAAP financial measures relating to the Projects Held for Sale to the directly comparable GAAP measures due to the difficulty in making the relevant adjustments on an individual project basis. Note: Project Adjusted EBITDA, Cash Available for Distribution and Payout Ratio are not recognized measures under GAAP and do not have any standardized meaning prescribed by GAAP; therefore, these measures may not be comparable to similar measures presented by other companies. Please refer to Slide 33 for Reg G reconciliations of these measures to GAAP. Twelve Months Ended December 31, |
|
|
2012 Project Adjusted EBITDA ($ millions) 16 +$120 2011 2012 Capital Power Income LP acquisition New Projects (Rockland) Changes to existing portfolio Chambers DuPont Settlement +$3 +$8 +$10 $226 $85 |
|
|
Capitalization ($ millions) 17 December 31, 2012 Debt Senior secured credit facility $67.0 Senior unsecured notes 460.0 Senior unsecured debt (Legacy CPILP) 626.1 Project-level debt (non-recourse) 158.1 Construction debt (non-recourse) (1) 336.1 Convertible debentures 424.2 Total debt $2,071.6 69% Preferred shares 221.3 7% Common shares 729.6 24% Total equity 950.9 Total capitalization $3,022.5 100% (1) Included in construction debt: Meadow Creek $208.7; Piedmont $127.4 Portion of construction debt bridging 1603 cash grants: Meadow Creek $56.5; Piedmont $51.0 |
|
|
Liquidity ($ millions) 18 2012 2011 Cash and cash equivalents $60.2 $60.7 Restricted cash 28.6 21.4 Total cash, cash equivalents and restricted cash $88.8 $82.1 Revolving credit facility availability 120.1 134.7 Total liquidity $209.0 $216.8 December 31, Projected Mid-2013 (1) Unrestricted cash $190 - $200 Less: planned cash reserve $50 Revolver capacity less letters of credit $210 - $225 Total liquidity $350 - $375 Cash available for investment without drawing on revolver $140 - $150 (1) Expected liquidity mid-2013 is after paying down the revolver by $64 million to zero with cash from asset sales |
|
|
2013 OUTLOOK Atlantic Power 19 |
|
|
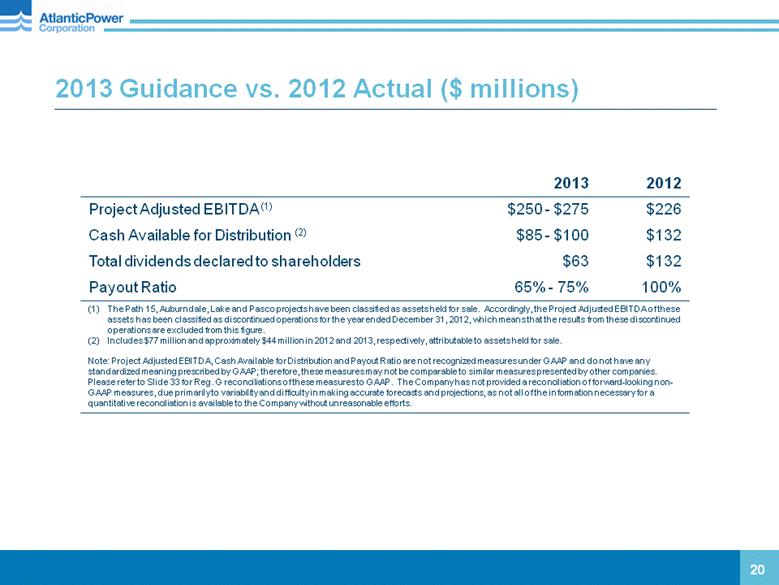
2013 Guidance vs. 2012 Actual ($ millions) 20 2013 2012 Project Adjusted EBITDA (1) $250 - $275 $226 Cash Available for Distribution (2) $85 - $100 $132 Total dividends declared to shareholders $63 $132 Payout Ratio 65% - 75% 100% The Path 15, Auburndale, Lake and Pasco projects have been classified as assets held for sale. Accordingly, the Project Adjusted EBITDA of these assets has been classified as discontinued operations for the year ended December 31, 2012, which means that the results from these discontinued operations are excluded from this figure. Includes $77 million and approximately $44 million in 2012 and 2013, respectively, attributable to assets held for sale. Note: Project Adjusted EBITDA, Cash Available for Distribution and Payout Ratio are not recognized measures under GAAP and do not have any standardized meaning prescribed by GAAP; therefore, these measures may not be comparable to similar measures presented by other companies. Please refer to Slide 33 for Reg. G reconciliations of these measures to GAAP. The Company has not provided a reconciliation of forward-looking non-GAAP measures, due primarily to variability and difficulty in making accurate forecasts and projections, as not all of the information necessary for a quantitative reconciliation is available to the Company without unreasonable efforts. (1) (2) |
|
|
Project Adjusted EBITDA ($ millions) 221 Actual $333 $48 - $65 $(11) - $(14) New Projects Canadian Hills $19 - $25 Piedmont $11 - $14 Meadow Creek Goshen Rockland (+20% ownership interest) $20 - $26 Changes to Existing Portfolio Chambers DuPont settlement in 2012 $(107) 2012 Reported $226 $(10) Guidance $250 to $275 2012 2013 $(2) Potential Asset Sales (Delta-Person and Gregory) Assets Held for Sale Florida $82 Path 15 $25 Nipigon and Tunis (outages and other factors) $1 - $4 |
|
|
Cash Available for Distribution ($ millions) 22 2012 Actual 2013 Guidance Total Disc. Ops. Cont'g. Ops. Total Disc. Ops. Cont’g. Ops. Project Adjusted EBITDA (1) 333 107 226 280 - 305 30 250 - 275 Project debt service (79) (27) (52) (72) (1) (71) Corporate debt costs (2) (104) 0 (104) (107) 0 (107) Capitalized maintenance capex (3) (3) (2) (1) (13) 0 (13) Corporate G&A & other (28) 0 (28) (38) - (40) 0 (38) – (40) Other, including changes in working capital 13 (1) 14 27 - 35 15 12 - 20 Cash Available for Distribution (1) 132 77 55 85 - 100 44 41 - 56 (1) Project Adjusted EBITDA andCash Available for Distribution are not recognized measures under GAAP and do not have any standardized meaning prescribed by GAAP; therefore, these measures may not be comparable to similar measures presented by other companies. Please refer to Slide 33 for Reg. G reconciliations of these measures to GAAP. The Company has not provided a reconciliation of forward-looking non-GAAP measures, due primarily to variability and difficulty in making accurate forecasts and projections, as not all of the information necessary for a quantitative reconciliation is available to the Company without unreasonable efforts. (2) Includes cost of preferred equity (3) 2013 guidance includes $11 million to replace HRSG at Nipigon (capitalized) |
|
|
Capital Structure Management 23 Plan to delever gradually over time Project debt amortizes over life of project’s PPA (helps to delever) Refinance Partnership debt at parent with 50/50 debt/equity Other potential initiatives to reduce leverage Tax equity stimulus at Piedmont and Meadow Creek to monetize tax benefits Structure new Ridgeline projects with tax equity stimulus Target growth projects with lower leverage Growth capital (beyond $140 to $150 million) Conservative leverage: Targeting 50% project debt / 50% capital raised (equity or converts) Flexibility to issue debt at corporate or project level |
|
|
Corporate Debt Maturity Schedule 24 (callable in November 2014) US$ (mm) $190 Curtis Palmer Cdn$45 Convertible Debs |
|
|
Upcoming Milestones in 2013 25 March Closing of Florida Assets Sale ($111 million net proceeds) Piedmont commercial operation First Half / By Mid-year Syndicate $44 million tax equity investment in Canadian Hills Potential asset sale agreements for Path 15 and Gregory Receive 1603 grants for Meadow Creek and Piedmont Third Quarter Closing of Delta-Person asset sale ($9 million net proceeds) Second Half Begin investing $140 - $150 million |
|
|
Appendix 26 Cash Flows Supported by Contracted Generation (Slide 27) Current Capital Structure (Slide 28) Project-level Debt Amortization (Slide 29) Canadian Hills Update (Slide 30) Piedmont Update (Slide 31) Dividend Payout Ratio for 2013 (Slide 32) Reg. G Disclosure (Slide 33) Summary of Operating Projects (Slides 34 & 35) |
|
|
PPA Length by MW (years) 27 Cash Flows Supported by Contracted Generation AT’s portfolio has a pro forma average remaining PPA life of 11.4 years (1) (1) Excludes Auburndale, Delta-Person, Lake, Pasco, and Path 15 but includes Piedmont, which is under construction, and is weighted by MW as of 2/28/13. (2) Based on $226 million in Project Adjusted EBITDA for the twelve months ended December 31, 2012; does not include Project Adjusted EBITDA for Auburndale, Lake, Pasco or Path 15, as they are currently being held for sale. Unallocated corporate expenses are excluded from project percentage allocation. Pro Forma Offtaker Credit Rating by 2012 Adjusted Project EBITDA No single project contributed more than 12% to 2012 Adjusted Project EBITDA(2) No project in the Other category contributes more than 4% to Project EBITDA |
|
|
CPILP U.S. Assets Maturity Amount Curtis Palmer 2014 $190 AP US GP Notes 2015 $150 AP US GP Notes 2017 $75 Preferred shares N/A C$125 Preferred shares N/A C$100 Capital Structure 12/31/12 ($ millions) CPILP Canadian Assets AT Assets without Project Debt AT Assets with Project Debt $487 Existing Project Debt (1) (1) Includes minority-owned project debt of $144M, accounts for repayment of Piedmont’s $51 million bridge loan in 2013 using federal grant proceeds and the repayment of approximately $57 million of Meadow Creek’s construction debt in 2013 using federal grant proceeds, and is adjusted to reflect the Company’s 50% ownership interest in its consolidated Rockland Wind project; excludes debt at Curtis Palmer; excludes debt at Path 15 and Auburndale, as they are classified as assets held for sale. Current book Debt-to-Capital is 69%, but includes short-term construction debt at Piedmont and Meadow Creek that we expect to be taken out by the federal 1603 grant program in 2013 AT plans to refinance CPILP indebtedness with a mix of 50/50 debt and equity at the corporate parent level as it matures, beginning with the $190MM Curtis Palmer, due 2014 28 Atlantic Power Corporate Debt Maturity Amount Senior Credit Facility 2015 $300 APC Unsecured Notes 2018 $460 APC Convertible Debentures 2014 C$45.8 APC Convertible Debentures 2017 C$67.4 APC Convertible Debentures 2017 C$80.5 APC Convertible Debentures 2019 $130 APC Convertible Debentures 2019 C$100 APLP Debt 2036 C$210 |
|
|
Project Level Debt Amortization 29 AT Existing Non-Recourse Project Level Debt Repayment Schedule (1) (1) Does not include the repayment of Piedmont’s $51 million bridge loan in 2013 using federal grant proceeds or the repayment of approximately $57 million of Meadow Creek’s project-level debt in 2013 using federal grant proceeds. In addition, project-level debt at the projects classified as held for sale, Path 15 and Auburndale, has been excluded, and debt at our consolidated Rockland Wind project has been adjusted to reflect our 50% ownership interest. Delta-Person and Gregory are expected to be sold in 2013 and have project-level repayments of approximately $3 to $4 million per year through 2017. US$ (mm) Atlantic’s debt structure has a balance of project level non-recourse debt that amortizes over the life of the project assets $30.4 $25.0 $27.3 $26.3 $26.5 |
|
|
300MW wind project outside of Oklahoma City, OK Canadian Hills 30 Commercial Operation achieved in December 2012 Project has five 20 to 25 year PPAs with strong counterparties Project is expected to contribute $15 to $19 million in cash distributions starting in 2013 and through 2020, after which time we anticipate distributions to increase $270 million in tax equity investments committed in December 2012; $44 million from Atlantic and the remaining from other tax equity investors We expect to syndicate our tax equity investment in the first half of 2013 |
|
|
Piedmont Green Power 31 53MW biomass project outside of Atlanta, GA Commercial operation delayed due to issues discovered in late-stage testing Repaired steam turbine rotor is on site and being tested Project is expected to commence commercial operations in March 2013 and is within budget 20 year PPA with Georgia Power with fuel price pass-through mechanism Project is expected to contribute $6 to $8 million in cash distributions for each full year |
|
|
Dividend Payout Ratio Guidance for 2013 32 Actual Basis Dividend rate 2 months @ Cdn$0.09583 10 months @ Cdn$0.03333 ($US millions) Total dividend $63 Cash Available for Distribution $85 - $100 Payout Ratio 65% - 75% Pro Forma Basis Dividend rate 12 months @ Cdn$0.03333 ($US millions) Total dividend $48 Cash Available for Distribution $85 - $100 Less: Cash from Disc. Ops. $44 Cash from Cont’g. Ops. Only $41 - $56 Payout Ratio (1) ~100% (1) Using midpoint of Cash Available for Distribution guidance Annualizing the new rate Remove cash flow attributable to assets held for sale |
|
|
Regulation G Disclosures Project Adjusted EBITDA is defined as project income plus interest, taxes, depreciation and amortization (including non-cash impairment charges) and changes in fair value of derivative instruments. Project Adjusted EBITDA is not a measure recognized under GAAP and is therefore unlikely to be comparable to similar measures presented by other issuers and does not have a standardized meaning prescribed by GAAP. Management uses Project Adjusted EBITDA at the Project-level to provide comparative information about project performance. A reconciliation of Project Adjusted EBITDA to project income is provided below. Investors are cautioned that the Company may calculate this measure in a manner that is different from other issuers. Cash Available for Distribution and Payout Ratio are not a measures recognized under U.S. generally accepted accounting principles ("GAAP") and do not have a standardized meaning prescribed by GAAP. Management believes Cash Available for Distribution is a relevant supplemental measure of the Company's ability to earn and distribute cash returns to investors. A reconciliation of Cash Flows from Operating Activities to Cash Available for Distributions is provided below. Investors are cautioned that the Company may calculate this measure in a manner that is different from other companies. 33 (Unaudited) Years ended Dec 31, 2012 2011 2010 Project Adjusted EBITDA $225,570 $84,911 $53,915 Depreciation and amortization 164,958 55,608 25,493 Interest expense, net 24,122 15,178 9,613 Change in the fair value of derivative instruments 56,579 17,152 321 Other (income) expense 11,819 2,416 3,642 Project income (loss) $(31,908) $(5,443) $14,846 Administrative and other expenses (income) 112,954 77,479 26,810 Income tax expense (benefit) (28,083) (11,104) 16,018 Income from discontinued operations, net of tax 16,459 36,117 24,127 Net loss $(100,320) $(35,641) $(3,855) Adjustments to reconcile to net cash provided by operating activities 264,709 103,842 83,851 Change in other operating balances 2,689 (12,266) 6,957 Cash provided by operating activities $167,078 $55,935 $86,953 Project-level debt repayments (19,574) (21,589) (18,882) Purchases of property, plant and equipment (1) (2,902) (2,035) (2,549) Transaction costs (2) - 33,402 - Realized foreign currency losses on hedges associated with the Partnership transaction (3) - 16,492 - Dividends on preferred shares of a subsidiary company (13,049) (3,247) - Cash Available for Distribution (4) $131,553 $78,958 $65,522 Total cash dividends declared to shareholders 131,832 86,357 65,648 Payout Ratio 100% 109% 100% (1) Excludes construction-in-progress costs related to our Piedmont biomass project and construction costs for our completed Canadian Hills project; (2) Represents costs incurred associated with the Partnership acquisition.; (3) Represents realized foreign currency losses associated with foreign exchange forwards entered into in order to hedge a portion of the foreign currency exchange risks associated with the closing of the Partnership acquisition; (4) Cash Available for Distribution is not a recognized measure under GAAP and does not have any standardized meaning prescribed by GAAP. Therefore, this measure may not be comparable to similar measures presented by other companies. See “Supplementary Non-GAAP Financial Information” above. |
|
|
Project Name Location Type Total MW Economic Interest Net MW Electricity Purchaser Contract Expiry S&P Credit Rating Cadillac Michigan Woody Biomass 40 100% 40 Consumers of Michigan 2028 BBB- Chambers New Jersey Coal 263 40% 89 Atlantic City Electric 2024 BBB+ 16 DuPont 2024 A Kenilworth New Jersey Natural Gas 30 100% 30 Merck, & Co., Inc. 2012 AA Curtis Palmer New York Hydro 60 100% 60 Niagara Mohawk 2027 A- Selkirk New York Natural Gas 345 17.7% 49 Consolidated Edison 2014 A- 15 Merchant N/A N/R Calstock Ontario Biomass 35 100% 35 Ontario Electricity Financial Corp 2020 AA- Kapuskasing Ontario Natural Gas 40 100% 40 Ontario Electricity Financial Corp 2017 AA- Nipigon Ontario Natural Gas 40 100% 40 Ontario Electricity Financial Corp 2022 AA- North Bay Ontario Natural Gas 40 100% 40 Ontario Electricity Financial Corp 2017 AA- Tunis Ontario Natural Gas 43 100% 43 Ontario Electricity Financial Corp 2014 AA- Auburndale Florida Natural Gas 155 100% 155 Progress Energy Florida 2013 BBB+ Lake Florida Natural Gas 121 100% 121 Progress Energy Florida 2013 BBB+ Pasco Florida Natural Gas 121 100% 121 Tampa Electric Co. 2018 BBB Orlando Florida Natural Gas 129 50% 46 Progress Energy Florida 2023 BBB+ 19 Reedy Creek Improvement District 2013 A- Piedmont Georgia Biomass 54 98.0% 53 Georgia Power Company 2032 A Summary of Operating Projects 34 Operating projects are diversified across geography and investment-grade utility customers Partnership projects indicated by light blue shading; Projects Held for Sale or expected to be sold in 2013 in dark blue shading |
|
|
Summary of Operating Projects (continued) 35 Project Name Location Type Total MW Economic Interest Net MW Electricity Purchaser Contract Expiry S&P Credit Rating Mamquam B.C. Hydro 50 100% 50 BC Hydro 2027 AAA Moresby Lake B.C. Hydro 6 100% 6 BC Hydro 2022 AAA Williams Lake B.C. Biomass 66 100% 66 BC Hydro 2018 AAA Idaho Wind Idaho Wind 183 27.6% 50 Idaho Power Company 2030 BBB Rockland Idaho Wind 80 50% 40 Idaho Power Company 2036 BBB Goshen North Idaho Wind 125 12.5% 16 Southern California Edison 2030 BBB+ Meadow Creek Idaho Wind 120 100% 120 PacifiCorp 2032 A- Frederickson Washington Natural Gas 250 50% 125 3 Public Utility Districts 2022 AA- to A+ Koma Kulshan Washington Hydro 13 49.8% 7 Puget Sound Energy 2037 BBB Naval Station California Natural Gas 47 100% 47 San Diego Gas & Electric 2019 A Naval Training Center California Natural Gas 25 100% 25 San Diego Gas & Electric 2019 A North Island California Natural Gas 40 100% 40 San Diego Gas & Electric 2019 A Oxnard California Natural Gas 49 100% 49 Southern California Edison 2020 BBB+ Path 15 California Transmission N/A 100% N/A California Utilities via CAISO 2034 BBB+ to A Greeley Colorado Natural Gas 72 100% 72 Public Service Company of Colorado 2013 A- Manchief Colorado Natural Gas 300 100% 300 Public Service Company of Colorado 2022 A- Morris Illinois Natural Gas 177 100% 77 Merchant N/A NR 100 Equistar 2023 BBB- Delta-Person New Mexico Natural Gas 132 40% 53 Public Service of New Mexico 2020 BBB- Canadian Hills Oklahoma Wind 298.5 99% 200 Southwestern Electric Power Co. 2032 BBB 49 Oklahoma Municipal Power Authority 2037 N/R 48 Grand River Dam Authority 2032 A Gregory Texas Natural Gas 400 17.1% 59 Fortis Energy Marketing and Trading 2013 A- 9 Sherwin Alumina 2020 N/R Partnership projects indicated by light blue shading; Projects Held for Sale or expected to be sold in 2013 in dark blue shading |