Attached files
| file | filename |
|---|---|
| 8-K - FORM 8-K - CAPSTEAD MORTGAGE CORP | d496856d8k.htm |
| EX-99.2 - EX-99.2 - CAPSTEAD MORTGAGE CORP | d496856dex992.htm |
 CAPSTEAD
Information as of December 31, 2012
Investor Presentation
Exhibit 99.1 |
 Safe
Harbor Statement - Private Securities Litigation Reform Act of 1995
Cautionary Statement Concerning Forward-looking Statements
This
document
contains
“forward-looking
statements”
within
the
meaning
of
the
Private
Securities
Litigation
Reform
Act
of
1995.
Forward-looking
statements
include,
without
limitation,
any
statement
that
may
predict,
forecast,
indicate
or
imply
future
results,
performance
or
achievements,
and
may
contain
the
words
“believe,”
“anticipate,”
“expect,”
“estimate,”
“intend,”
“will
be,”
“will
likely
continue,”
“will
likely
result,”
or
words
or
phrases
of
similar
meaning.
Forward-looking
statements
are
based
largely
on
the
expectations
of
management
and
are
subject
to
a
number
of
risks
and
uncertainties
including,
but
not
limited
to,
the
following:
In addition to the above considerations, actual results and liquidity are affected
by other risks and uncertainties which could cause actual results to be
significantly different from those expressed or implied by any forward-looking statements included herein. It is not
possible to identify all of the risks, uncertainties and other factors that may
affect future results. In light of these risks and uncertainties, the
forward-looking events and circumstances discussed herein may not occur and actual results could differ materially from those
anticipated or implied in the forward-looking statements.
Forward-looking statements speak only as of the date the statement is made
and
the
Company
undertakes
no
obligation
to
update
or
revise
any
forward-looking
statements,
whether
as
a
result
of
new
information,
future events or otherwise. Accordingly, readers of this document are
cautioned not to place undue reliance on any forward-looking statements
included herein. –
changes in general economic conditions;
–
fluctuations in interest rates and levels of mortgage
prepayments;
–
the effectiveness of risk management strategies;
–
the impact of differing levels of leverage employed;
–
liquidity of secondary markets and credit markets;
–
the availability of financing at reasonable levels and terms to
support investing on a leveraged basis;
–
the availability of new investment capital;
–
the availability of suitable qualifying investments from both
an investment return and regulatory perspective;
–
changes in legislation or regulation affecting Fannie Mae and
Freddie Mac (together, the “GSEs”) and similar federal
government agencies and related guarantees;
–
deterioration in credit quality and ratings of existing or future
issuances of GSE or Ginnie Mae Securities;
–
changes in legislation or regulation affecting exemptions for
mortgage REITs from regulation under the Investment
Company Act of 1940; and
–
increases in costs and other general competitive factors.
2 |
 Company Summary
Proven Strategy
Experienced
Management Team
Aligned with
Stockholders
Overview of Capstead Mortgage Corporation
•
Founded in 1985, Capstead is the oldest publicly-traded Agency mortgage
REIT. •
At December 31, 2012, we had a residential ARM securities portfolio of $13.85
billion, supported by long-term investment capital of $1.60 billion
levered 8.00 times.* •
Our five-year compound annual total return of 12.4% exceeded the Russell 2000
Index and the NAREIT Mortgage REIT Index.**
•
We invest exclusively in residential adjustable-rate mortgage (ARM) securities
issued and guaranteed by Fannie Mae, Freddie Mac or Ginnie Mae.
Agency-guaranteed mortgage securities are considered to have little, if
any, credit risk. •
Our
focus
on
short-duration
ARM
securities
augmented
with
2-year
interest
rate
swap
agreements
differentiates
us
from
our
peers
because
ARM
securities
reset
to
more
current
interest
rates
within
a
relatively
short
period
of
time.
This
allows
for
the
recovery
of
financing
spreads
diminished
during
periods
of
rising
interest
rates
and
smaller
fluctuations
in
portfolio
values
from
changes
in
interest
rates
compared
to
fixed-rate
mortgage
securities.
With
this
strategy,
Capstead
is
recognized
as
the
most
defensively-positioned
Agency
mortgage
REIT
from
an
interest
rate
risk
perspective.
•
Our prudently leveraged portfolio provides financial flexibility
to manage changing market
conditions.
•
Our top four executive officers have over 85 years of combined mortgage finance
industry experience, including over 80 years at Capstead.
•
We
are
self-managed
with
low
operating
costs
and
a
focus
on
performance-based
compensation
for
our
executive
officers.
This
structure
greatly
enhances
the
alignment
of
management
interests
with
those
of
our
stockholders.
3
*
Long-term
investment
capital
includes
stockholders’
equity
and
unsecured
borrowings,
net
of
investments
in
related
unconsolidated
affiliates.
**
Compound
annual
growth
rate
is
based
on
cumulative
total
returns
assuming
an
investment
in
Capstead
was
made
December
31,
2007
and
dividends
were
reinvested. |
 Perpetual Preferred
Trust
Total Long-Term
Common
Series A
Series B
Preferred
Investment Capital
NYSE Stock Ticker
CMO
CMOPRA
CMOPRB
Shares outstanding
96,229
186
16,493
Cost of preferred capital
11.44%
11.15%
8.49%
10.23%
Price as of March 1, 2013
$12.44
$21.03
$15.25
Book Value per common share
$13.58
Price as a multiple of
December 31, 2012 book value
91.6%
Recorded value
$1,308,133
$2,604
$186,388
$99,978
$1,597,103
Market capitalization as of March 1, 2013
$1,197,089
$3,912
$251,518
$99,978
$1,552,497
(a)
As of December 31, 2012.
Market Snapshot
(dollars in thousands, except per share amounts)
4
(a)
(a)
(a)
(a) |
 Capstead’s Prudent Use of Leverage
5
**
Borrowings under repurchase arrangements divided by long-term investment
capital. Portfolio leverage remained stable throughout 2012 at approximately
eight times long-term investment capital. In our view, borrowing
at current levels represents an appropriate and prudent use of leverage for an agency-guaranteed ARM securities
portfolio in today’s market conditions.
Through September 2012, we raised $142 million in new common equity capital using
our at-the-market continuous offering program. This program
was suspended with the October 30, 2012 announcement of a $100 million common stock buy back
program. As of December 31, 2012, we repurchased $35 million in
common shares under this authorization and an
additional $7 million in early January 2013. |
 33%
67%
42%
58%
Capstead’s Proven Short-Duration Investment Strategy
6
As of December 31, 2012
As of December 31, 2012
Low risk agency-guaranteed residential ARM securities financed primarily with
30-90 day “repo” borrowings, augmented with two-year
interest rate swap agreements for hedging purposes. Residential ARM Securities
Portfolio Repurchase Arrangements & Similar Borrowings
Total: $12.78 billion
* Based on fair market value as of the indicated balance sheet
date. Total: $13.85 billion*
•
Most of our securities are backed by well-seasoned mortgage
loans with coupon interest rates that reset at least annually or
begin doing so after an initial fixed-rate period of five years or
less.
•
We have long-term relationships with numerous lending
counterparties. As of December 31, 2012, we had borrowings
outstanding with 23 counterparties.
•
Fourth quarter 2012 unhedged borrowing rates averaged 45
basis points, up from 41 basis points during the third quarter
(0.63% after considering currently-paying interest rate swaps).
•
At December 31, 2012 we held $4.20 billion notional amount of
currently-paying two-year interest rate swaps requiring fixed
rate payments averaging 0.75% with average maturities of nine
months.
An
additional
$2.40
billion
notional
amount
of
two-year
forward-starting swaps were held at year-end that will begin
requiring fixed rate payments averaging 0.47% for two-year
periods beginning on various dates between January 2013 and
December 2013.
•
The duration of our investment portfolio and related ‘repo’
borrowings
was
approximately
10
months
and
8¼
months,
respectively, at December 31, 2012. This resulted in a net
duration
gap
of
approximately
1¾
months.
Duration
is
a
measure of market price sensitivity to interest rate movements.
Longer-to-Reset
ARMs
$5.76 Billion
Current-Reset
ARMs
$8.09 Billion
Borrowings Hedged with
Currently-Paying
Interest Rate Swaps
$4.20 Billion
(excludes forward-
starting swaps)
Unhedged
Borrowings
$8.58 Billion |
 Financing Spread Analysis
As of December 31, 2012 (unaudited)
7 |
 Capstead’s Stockholder Friendly Structure
8
Quarter
Year
Ended
Ended
Dec. 31, 2012
*
Dec. 31, 2012
*
Compensation-related expenses:
Fixed:
Salaries and related deferred compensation match,
payroll taxes, insurance and other benefits
0.22%
0.23%
Variable:
Incentive Compensation
**
0.12
0.26
58% and 67% of quarter and
Dividend Equivalent Rights
0.05
0.06
year-to-date compensation -
Performance Stock Awards
0.11
0.12
related expenses, respectively,
Related deferred compensation match and payroll taxes
0.02
0.03
were performance-based
0.30
0.47
0.52
0.70
Other platform expenses
0.27
0.27
0.79%
0.97%
*
Expressed as a percentage of average long-term investment capital (LTIC).
**
Incentive compensation is based on a 10% participation in returns on LTIC in excess
of benchmark returns (greater of 10% or the average 10-year Treasury rate
plus 2.0%), capped at 50 basis points of LTIC and subject to Compensation Committee
discretion. •
Self-managed with low operating costs.
•
Our
board
of
directors
requires
management
to
hold
a
significant
amount
of
CMO
stock
based
on
a
multiple of each executive’s base salary. As of February 25, 2013 our
directors and executive officers beneficially owned 1.8% of our common
shares. •
Pay structure is variable through compensation elements that focus on “pay for
performance.” •
Management is incented to grow the Company by issuing common equity capital when it
is accretive to book
value
and
earnings
as
opposed
to
increasing
compensation
or
external
management
fees.
•
Bottom line: our management prospers when our stockholders prosper.
|
 *
Net WAC, or weighted average coupon, is the weighted average interest rate of the
mortgage loans underlying the indicated investments, net of servicing and other fees, as of December 31,
2012. Net WAC is expressed as a percentage calculated on an annualized basis
on the unpaid principal balance of the mortgage loans underlying these investments. Fully indexed WAC
represents the weighted average coupon upon one or more resets using interest rate
indexes and net margins, as of December 31, 2012. Gross WAC is the weighted average interest rate of
the mortgage loans underlying the indicated investments, including servicing and
other fees paid by borrowers, as of December 31, 2012. NOTE: Excludes
$9 million of fixed-rate investments. Fully
Average
Months
Principal
Investment
Amortized Cost Basis
Fair Market
Net
Indexed
Net
to
Balance
Premiums
($)
%
Value
WAC*
WAC*
Margins
Roll
Current-reset ARMs:
Fannie Mae Agency Securities
$
5,106,160
$121,326
$
5,227,486
102.38
$5,411,503
2.45%
2.29%
1.70%
5.2
Freddie Mac Agency Securities
1,801,631
49,091
1,850,722
102.72
1,917,255
2.67
2.42
1.84
6.2
Ginnie Mae Agency Securities
722,922
16,563
739,485
102.29
754,178
2.48
1.70
1.51
6.2
Residential Mortgage Loans
5,031
20
5,051
100.40
5,119
3.51
2.38
2.04
4.5
7,635,744
187,000
7,822,744
102.45
8,088,055
2.51
2.27
1.71
5.5
Longer-to-reset ARMs:
Fannie Mae Agency Securities
2,840,886
112,623
2,953,509
103.96
2,981,497
2.97
2.61
1.76
43.7
Freddie Mac Agency Securities
1,799,277
73,606
1,872,883
104.09
1,888,667
2.97
2.67
1.84
47.4
Ginnie Mae Agency Securities
843,827
31,685
875,512
103.75
892,941
3.01
1.68
1.51
30.1
5,483,990
217,914
5,701,904
103.97
5,763,105
2.98
2.48
1.75
42.8
$13,119,734
$404,914
$13,524,648
103.09
$13,851,160
2.70
2.36
1.73
21.1
Gross WAC (rate paid by borrowers)*
3.33
Key Elements of Capstead’s ARM Portfolio
As of December 31, 2012 (dollars in thousands, unaudited)
9 |
 CAPSTEAD
Appendix
CAPSTEAD
10
*
*
*
*
* |
 Capstead’s Fourth Quarter 2012 Highlights
•
Earnings of $35.1 million or $0.31
per diluted common share
•
Financing spreads on residential mortgage investments declined 17 basis points to
1.13% •
Book value
decreased $0.30 to $13.58 per common share
•
Repurchased $42 million in common shares through early January 2013
•
Portfolio leverage maintained at eight times long-term investment capital
•
Operating costs as a percentage of average long-term investment capital decreased
9 basis points to 0.79% •
Comments from our January 30, 2013 earnings press release:
“During
the
fourth
quarter
yields
on
our
portfolio
were
pressured
by
moderately
higher
mortgage
prepayments
as
well
as
lower
coupon
resets
reflecting
declines
in
recent
quarters
in
the
six-
and
twelve-month
LIBOR
indexes.
Meanwhile,
our
borrowing
costs
were higher, in part reflecting higher market rates over year-end as well as an
increase in our currently-paying swap position. Together, these
factors contributed to a 17 basis point decline in our financing spreads to 1.13%, and a $0.04 reduction in our
earnings to $0.31 per diluted common share.
“Although results have trended lower in recent quarters, we expect 2013
results will be more stable. This belief reflects our confidence in
our investment strategy of investing solely in short-duration ARM securities. Approximately 93% of the mortgages
underlying our current-reset ARM securities were originated prior to 2008 and
carry coupon interest rates at or below prevailing fixed
mortgage
rates
diminishing
the
economic
advantage,
if
any,
of
refinancing.
Additionally,
refinancing
for
many
of
these
homeowners continues to be hampered by low housing prices and credit
problems. Newer originations, primarily held in our longer-
to-reset portfolio, remain more susceptible to refinancing because it is easier
for many of these borrowers to qualify for new mortgages
and
it
may
be
more
attractive
to
do
so
from
a
rate
perspective
in
the
current
low
mortgage
interest
rate
environment.
On
an
overall
basis,
we
expect
mortgage
prepayment
levels
to
remain
manageable
in
the
coming
quarters
absent
additional
government intervention to lower mortgage interest rates beyond the Federal
Reserve's current bond buying program. This should help
contain
investment
premium
amortization
costs,
which
increased
$2.2
million
this
quarter
to
$29.3
million.
Also,
further
declines in weighted average coupons should be muted given that an increasing
number of mortgage loans underlying our current- reset
ARM
securities
are
at
or
near
fully-indexed
levels,
which
now
reflect
six-
and
twelve-month
indices
that
have
largely
returned
to the lower levels prevailing in late 2010. With respect to our borrowing
costs, we have experienced lower market rates subsequent
to
year-end.
Additionally,
$2.90
billion
of
our
currently-paying
interest
rate
swaps
with
average
fixed
rates
of
0.85%
will
mature during 2013 and have already been largely replaced at significantly lower
rates. “We
remain
confident
in
and
focused
on
our
investment
strategy
of
managing
a
conservatively
leveraged
portfolio
of
agency-
guaranteed residential ARM securities that can produce attractive risk-adjusted
returns over the long term while reducing, but not eliminating, sensitivity
to changes in interest rates.” 11 |
 Capstead’s Quarterly Income Statements
(dollars in thousands, except per share amounts) (unaudited)
12
* The constant prepayment rate, or CPR, represents only
prepayments. |
 Capstead’s Annual Income Statements –
Five Years Ended 2012
(dollars in thousands, except per share amounts) (unaudited)
13
December
December
December
December
December
2012
2011
2010
2009
2008
Interest income:
Residential mortgage investments
255,931
$
243,077
$
198,488
$
313,676
$
394,729
$
Other
698
301
1,290
919
5,760
256,629
243,378
199,778
314,595
400,489
Interest expense:
Repurchase arrangements and similar borrowings
(69,101)
(57,328)
(47,502)
(120,083)
(249,706)
Unsecured borrowings
(8,747)
(8,747)
(8,747)
(8,747)
(8,747)
Other
-
(5)
(2)
-
-
(77,848)
(66,080)
(56,251)
(128,830)
(258,453)
178,781
177,298
143,527
185,765
142,036
Other revenue (expense):
Miscellaneous other revenue (expense)
(171)
(1,023)
(904)
(40,641)
(1,593)
Incentive compensation
(4,129)
(5,697)
(5,055)
(4,769)
(6,000)
Salaries and benefits
(6,843)
(6,701)
(6,097)
(5,655)
(4,978)
Other general and administrative expense
(4,271)
(3,932)
(4,834)
(5,696)
(3,801)
(15,414)
(17,353)
(16,890)
(56,761)
(16,372)
Income before equity in earnings of unconsolidated affiliates
163,367
159,945
126,637
129,004
125,664
Equity in earnings of unconsolidated affiliates
259
259
259
259
259
Net income
163,626
$
160,204
$
126,896
$
129,263
$
125,923
$
Net income per diluted common share
$1.50
$1.75
$1.52
$1.66
$1.93
Average long-term investment capital
1,567,232
$
1,284,057
$
1,120,647
$
1,032,853
$
813,428
$
Average balance of mortgage assets
13,190,380
10,839,749
7,665,796
7,604,530
7,630,958
Investment premium amortization
96,677
68,077
57,634
29,426
29,336
Average CPR*
Average financing spreads on residential mortgage investments
1.68
16.1% Year Ended
16.6%
1.67
16.0%
1.93
29.1%
2.42
1.38
17.2% * The constant prepayment
rate, or CPR, represents only prepayments. |
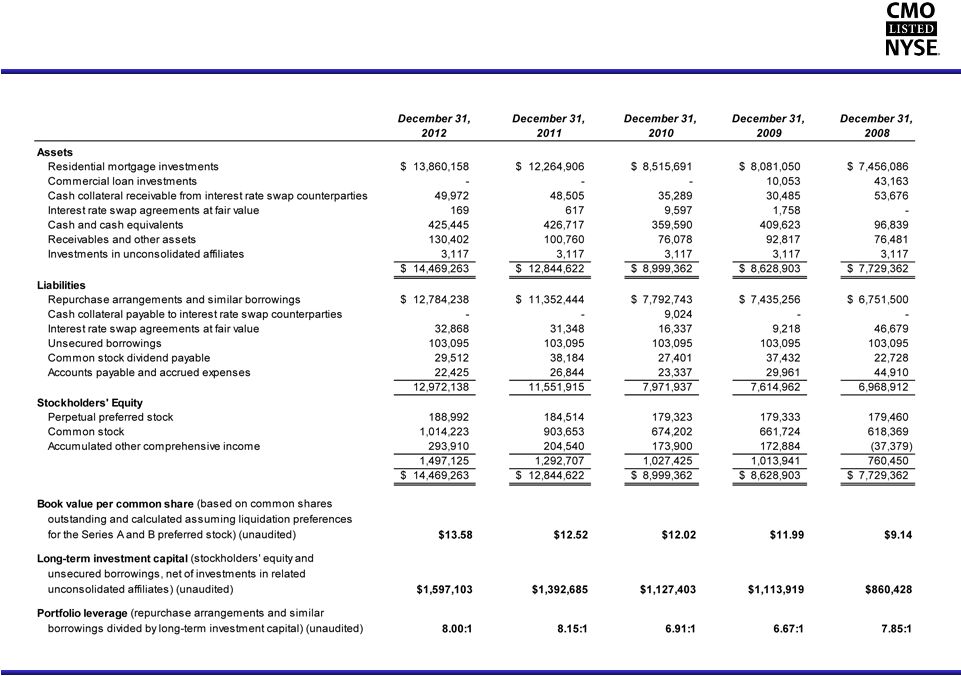 Capstead’s Comparative Balance Sheets
(dollars in thousands, except per share amounts)
14 |
 Experienced Management Team
15
Over 85 years of combined mortgage finance industry experience, including over 80
years at Capstead. Andrew
F.
Jacobs
–
President
and
Chief
Executive
Officer,
Director
–
Has served as president and chief executive officer since 2003 and has held various
executive positions at Capstead since 1988 –
Certified Public Accountant (“CPA”), member of the Executive Board of the
National Association of Real Estate Investment Trusts (“NAREIT”),
chairman of NAREIT’s Council of Mortgage REITs, member of the Executive Committee of the Chancellors Council of
the University of Texas System, the Executive Council of the Real Estate Finance
and Investment Center at the University of Texas at Austin, the American
Institute of Certified Public Accountants (“AICPA”), and the Financial Executives International (“FEI”)
Phillip
A.
Reinsch
–
Executive
Vice
President
and
Chief
Financial
Officer,
Secretary
–
Has
held
various
financial
accounting
and
reporting
positions
at
Capstead
since
1993
–
Formerly employed by Ernst & Young LLP as an audit senior manager focusing on
mortgage banking and asset securitization –
CPA, Member AICPA, FEI
Robert
A.
Spears
–
Executive
Vice
President,
Director
of
Residential
Mortgage
Investments
–
Has served in asset and liability management positions at Capstead since 1994
–
Formerly Vice President of secondary marketing with NationsBanc Mortgage
Corporation Michael
W.
Brown
–
Senior
Vice
President,
Asset
and
Liability
Management,
Treasurer
–
Has served in asset and liability management positions at Capstead since 1994
–
MBA, Southern Methodist University, Dallas, Texas |