Attached files
| file | filename |
|---|---|
| 8-K - FORM 8-K - US BANCORP \DE\ | d497959d8k.htm |
Exhibit 99.1
| Citi 2013 Financial Services Conference Richard K. Davis Chairman, President and CEO March 5, 2013 |

| Forward-looking Statements and Additional Information The following information appears in accordance with the Private Securities Litigation Reform Act of 1995: This presentation contains forward-looking statements about U.S. Bancorp. Statements that are not historical or current facts, including statements about beliefs and expectations, are forward-looking statements and are based on the information available to, and assumptions and estimates made by, management as of the date made. These forward-looking statements cover, among other things, anticipated future revenue and expenses and the future plans and prospects of U.S. Bancorp. Forward-looking statements involve inherent risks and uncertainties, and important factors could cause actual results to differ materially from those anticipated. Global and domestic economies could fail to recover from the recent economic downturn or could experience another severe contraction, which could adversely affect U.S. Bancorp's revenues and the values of its assets and liabilities. Global financial markets could experience a recurrence of significant turbulence, which could reduce the availability of funding to certain financial institutions and lead to a tightening of credit, a reduction of business activity, and increased market volatility. Continued stress in the commercial real estate markets, as well as a delay or failure of recovery in the residential real estate markets, could cause additional credit losses and deterioration in asset values. In addition, U.S. Bancorp's business and financial performance is likely to be negatively impacted by recently enacted and future legislation and regulation. U.S. Bancorp's results could also be adversely affected by deterioration in general business and economic conditions; changes in interest rates; deterioration in the credit quality of its loan portfolios or in the value of the collateral securing those loans; deterioration in the value of securities held in its investment securities portfolio; legal and regulatory developments; increased competition from both banks and non-banks; changes in customer behavior and preferences; effects of mergers and acquisitions and related integration; effects of critical accounting policies and judgments; and management's ability to effectively manage credit risk, residual value risk, market risk, operational risk, interest rate risk and liquidity risk. For discussion of these and other risks that may cause actual results to differ from expectations, refer to U.S. Bancorp's Annual Report on Form 10-K for the year ended December 31, 2012, on file with the Securities and Exchange Commission, including the sections entitled "Risk Factors" and "Corporate Risk Profile" contained in Exhibit 13, and all subsequent filings with the Securities and Exchange Commission under Sections 13(a), 13(c), 14 or 15(d) of the Securities Exchange Act of 1934. Forward-looking statements speak only as of the date they are made, and U.S. Bancorp undertakes no obligation to update them in light of new information or future events. This presentation includes non-GAAP financial measures to describe U.S. Bancorp's performance. The reconciliations of those measures to GAAP measures are provided within or in the appendix of the presentation. These disclosures should not be viewed as a substitute for operating results determined in accordance with GAAP, nor are they necessarily comparable to non-GAAP performance measures that may be presented by other companies. |
| U.S. Bancorp Overview Capital Management Business Lines 1Q13 Update Summary |

| U.S. Bancorp Businesses * As of March 1, 2013 Asset Size $354 billion Deposits $249 billion Loans $223 billion Customers 17.6 million NYSE Traded USB Market Capitalization* $63 billion Founded 1863 Bank Branches 3,084 ATMs 5,065 4Q12 Dimensions Overview |

| Diversification 2012 full year, taxable-equivalent basis Excluding securities gains (losses) net Revenue Mix By Business Line (CHART) Consumer and Small Business Banking 47% Payment Services 26% Wealth Mgmt and Securities Services 8% Wholesale Banking and Commercial Real Estate 19% Fee Income / Total Revenue 55% 45% (CHART) Overview |
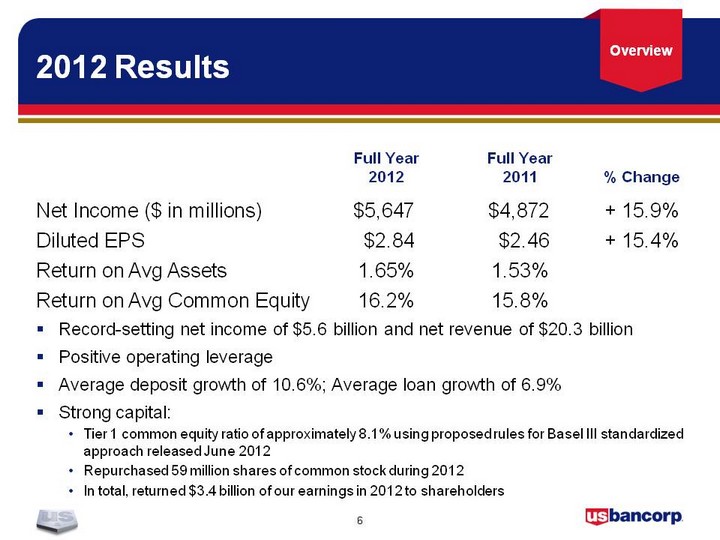
| 2012 Results Net Income ($ in millions) $5,647 $4,872 + 15.9% Diluted EPS $2.84 $2.46 + 15.4% Return on Avg Assets 1.65% 1.53% Return on Avg Common Equity 16.2% 15.8% Record-setting net income of $5.6 billion and net revenue of $20.3 billion Positive operating leverage Average deposit growth of 10.6%; Average loan growth of 6.9% Strong capital: Tier 1 common equity ratio of approximately 8.1% using proposed rules for Basel III standardized approach released June 2012 Repurchased 59 million shares of common stock during 2012 In total, returned $3.4 billion of our earnings in 2012 to shareholders Full Year 2012 Full Year 2011 % Change Overview |
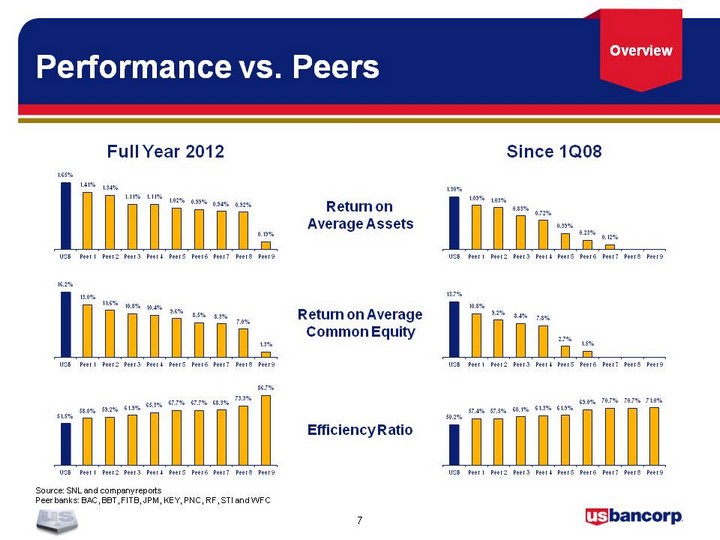
| Performance vs. Peers Source: SNL and company reports Peer banks: BAC, BBT, FITB, JPM, KEY, PNC, RF, STI and WFC Return on Average Assets Return on Average Common Equity Efficiency Ratio Since 1Q08 Full Year 2012 (CHART) (CHART) (CHART) (CHART) (CHART) (CHART) Overview |

| Revenue Growth * Gain on merchant processing agreement settlement $ in millions, taxable-equivalent basis (CHART) (CHART) Prior 5 Years Year-Over-Year Growth 4.4% 13.6% 8.9% 5.3% 6.2% Prior 5 Quarters Year-Over-Year Growth 8.1% 9.1% 8.1% 8.0% 0.2% USB Record Revenue 2012 5.6% excluding merchant settlement gain Overview |
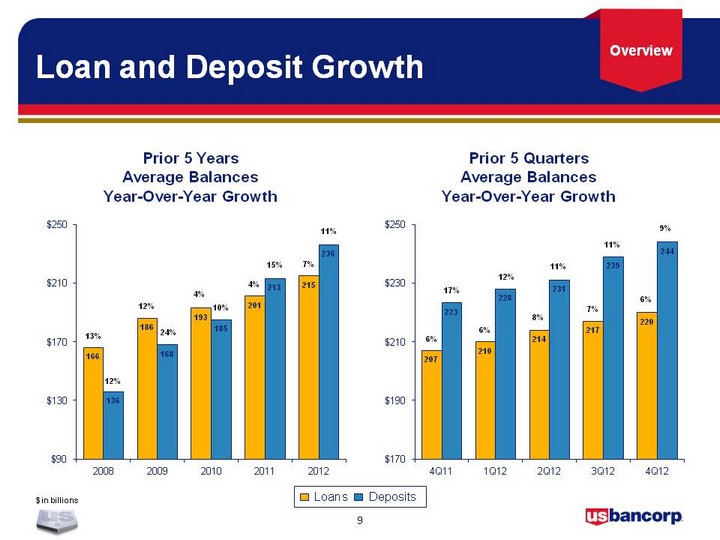
| Loan and Deposit Growth $ in billions (CHART) (CHART) 6% 12% 8% 6% 9% 6% 11% 11% 17% 4% 4% 11% 13% 12% 10% 15% 7% 12% 24% Loans Deposits Prior 5 Years Average Balances Year-Over-Year Growth Prior 5 Quarters Average Balances Year-Over-Year Growth 7% Overview |

| Credit Quality * Excluding Covered Assets (assets subject to loss sharing agreements with FDIC) ** Related to a regulatory clarification in the treatment of residential mortgage and other consumer loans to borrowers who have exited bankruptcy but continue to make payments on their loans *** Excluding $54 million of incremental charge-offs Net Charge-offs Nonperforming Assets* (CHART) (CHART) $622 $571 $520 $538 $468 $2,574 $2,423 $2,256 $2,188 $2,088 Net Charge-offs (Left Scale) NCOs to Avg Loans (Right Scale) Nonperforming Assets (Left Scale) NPAs to Loans plus ORE (Right Scale) Overview |

| Acquisitions Payments FSV Payment Systems TransCard's heavy truck fuel card network Financial institutions credit card portfolio of FIA Card Services Merchant processing portfolio of Santander-Mexico Merchant processing portfolio of Citizens National Bank Credit card portfolios from Citi Merchant processing portfolio of MB Financial Bank Credit card portfolio of Town North Bank Southern DataComm AIMS Logistics Numerous small portfolios Joint ventures: Brazil merchant services company Syncada Consumer and Wholesale Banking operations of BankEast (Knoxville, Tennessee) Banking operations of First Community Bank (New Mexico) Banking subsidiaries of FBOP Corporation BB&T's Nevada banking operations First Bank of Idaho Downey Savings & Loan Association PFF Bank & Trust Mellon 1st Business Bank Trust Businesses AIS Fund Administration Institutional trust business of Union Bank Indiana corporate trust business of UMB Bank Bank of America's securitization trust administration business Corporate trust administration business of F.N.B. Corporation Corporate trust business of AmeriServ Financial Bond trustee business of First Citizens bank Mutual fund servicing division of Fiduciary Management, Inc Divestitures Divestiture of FAF Advisors long-term asset management business Acquisitions (CHART) Consumer and Small Business Banking Payment Services Wealth Management and Securities Services Wholesale Banking and Commercial Real Estate Loans $30 billion Deposits $30 billion Card Assets $3 billion Trust Assets under Administration $1 trillion Acquired Since 1Q08 Overview |

| Growing Market Share Middle Market Loan 19th 6th Bookrunner Investment Grade Loan 11th 5th Bookrunner Investment Grade Bond NA 8th Lead / Co-lead Source: Thomson Reuters based on number of issues 2012 2007 USB Market Rank Market Share Change Core Deposits 2.0% 2.6% Consumer Loans 1.8% 3.2% Mortgage Origination 0.7% 4.8% C&I Loans 3.2% 3.6% CRE Loans 1.6% 2.5% Source: SNL and Inside Mortgage Finance (mortgage origination data as of 3Q12) 4Q12 1Q07 USB Market Share Market Share Change 2012 2007 USB Market Share Market Share Change Credit Card (total volume) 4% 6% Fund Services (# of funds) 18% 22% Wealth Management (AUM) 1% 1% Source: Nilson (credit card), Visa and MasterCard issuers; Investment Co Institute (fund services, data as of 2011); Barron's (wealth management), accounts over $5 million Municipal Trust 27% 29% Corporate Trust 8% 24% Structured Trust 12% 21% Source: Securities Data Corp based on number of issues 2012 2007 USB Market Share Market Share Change Overview |
| U.S. Bancorp Overview Capital Management Business Lines 1Q13 Update Summary |

| Capital Position $ in billions * Approximated using proposed rules for Basel III standardized approach released June 2012 (CHART) TARP Equity Tier 1 Capital Tier 1 Capital Ratio Tier 1 Common Ratio 4Q12 Tier 1 Common Ratio Basel III: 8.1%* Capital Management |
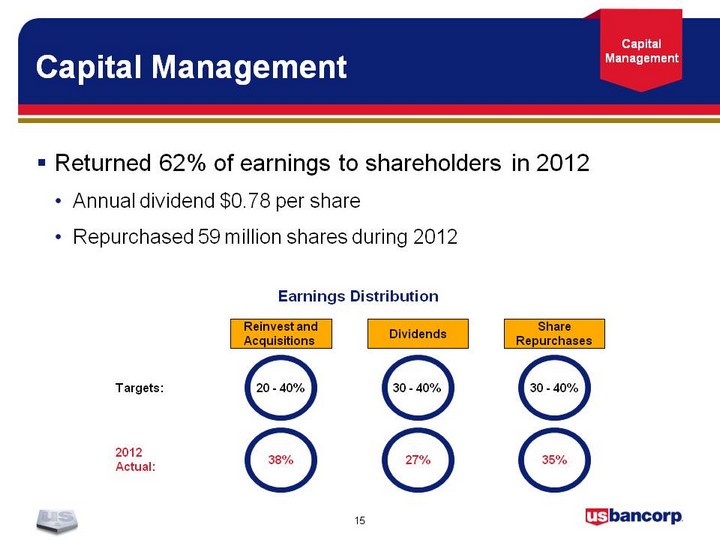
| Capital Management Returned 62% of earnings to shareholders in 2012 Annual dividend $0.78 per share Repurchased 59 million shares during 2012 Reinvest and Acquisitions Dividends Share Repurchases 20 - 40% Targets: 30 - 40% 30 - 40% 38% 2012 Actual: 35% 27% Earnings Distribution Capital Management |

| CCAR Process 1/7/13 - Capital plans were due 3/7/13 - Dodd-Frank Act Stress Test results will be released Assumes no changes to current dividend levels and no common stock repurchases Will include data such as capital ratios, revenue, and loss estimates under the severely adverse scenario Banks required to publish a summary of their own stress test results and methodologies no later than 3/31/13 3/14/13 - CCAR results will be released Reflecting planned capital actions under severely adverse scenario Banks provided Object / No Object decision on capital distributions Capital Management |

| U.S. Bancorp Overview Capital Management Business Lines 1Q13 Update Summary |
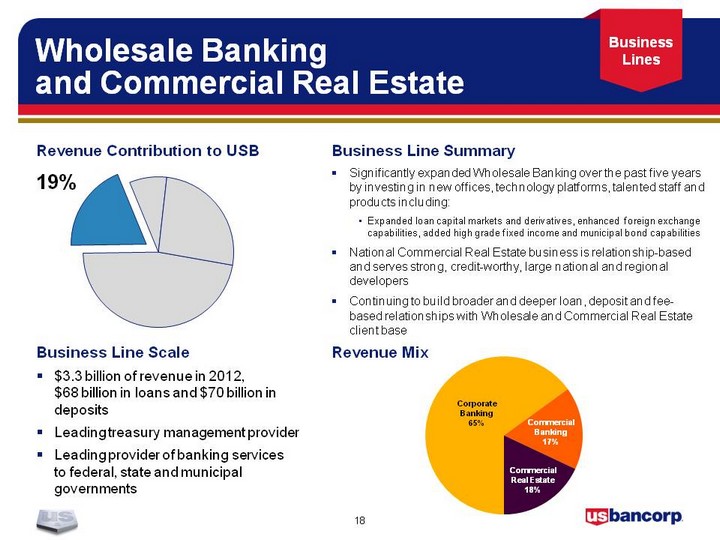
| Wholesale Banking and Commercial Real Estate Business Line Summary Significantly expanded Wholesale Banking over the past five years by investing in new offices, technology platforms, talented staff and products including: Expanded loan capital markets and derivatives, enhanced foreign exchange capabilities, added high grade fixed income and municipal bond capabilities National Commercial Real Estate business is relationship-based and serves strong, credit-worthy, large national and regional developers Continuing to build broader and deeper loan, deposit and fee- based relationships with Wholesale and Commercial Real Estate client base Business Line Scale $3.3 billion of revenue in 2012, $68 billion in loans and $70 billion in deposits Leading treasury management provider Leading provider of banking services to federal, state and municipal governments (CHART) Corporate Banking 65% Commercial Real Estate 18% Commercial Banking 17% Revenue Contribution to USB Revenue Mix (CHART) 19% Business Lines |

| Consumer and Small Business Banking Source: SNL and Inside Mortgage Finance (mortgage origination data as of 3Q12) (CHART) Business Line Summary Differentiating U.S. Bank from competitors through continued improvement in the client experience, investments in innovative products and deeper customer relationships Significantly expanded market share nationally in Mortgage Banking by investing in offices, technology and people Expanding Small Business Banking through investment in new products, services and staffing Provides clients with best in class service, leverages branch managers into an effective sales and relationship management force, supported by dedicated small business bankers (4Q12 deposits up 14%, new customers up 6%) Business Line Scale 25 contiguous state distribution footprint; #4 branch network in U.S; #1 in-store and on-site branch network in U.S. #3 U.S. mortgage originator Leading SBA lender Leading U.S. auto lender (CHART) 47% In-store and On-site Banking 6% Metropolitan Banking 24% Community Banking 26% Mortgage Banking 32% Consumer Lending 12% Revenue Contribution to USB Revenue Mix Business Lines |

| Wealth Management and Securities Services Source: Securities Data Corp based on number of issues (CHART) Business Line Summary Provides full array of wealth management services through service delivery models tailored to meet the needs of clients efficiently and effectively Newly created Ascent Private Capital Management recently won "Best Newcomer - Private Wealth Manager" in the 2013 Private Asset Management (PAM) Awards A top provider of corporate trust services in the U.S. with a new international presence Continued opportunity to expand all segments through new products and services, building deeper relationships and strategic acquisitions Business Line Scale $93 billion in assets under management and $5 trillion in assets under administration #1 U.S. municipal trustee, #2 U.S. corporate trustee and #2 U.S. structured trustee (CHART) 8% Fund Services 15% IT&C 9% Corporate Trust 35% Wealth Management 41% Revenue Contribution to USB Revenue Mix Business Lines |
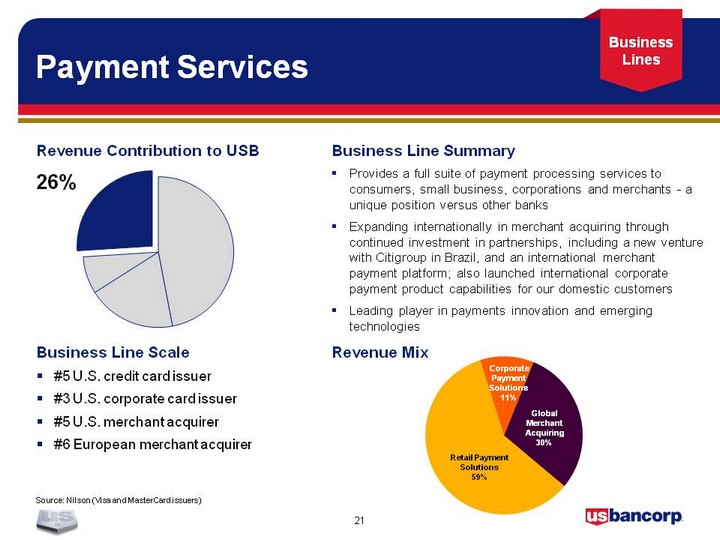
| Payment Services Source: Nilson (Visa and MasterCard issuers) (CHART) Business Line Summary Provides a full suite of payment processing services to consumers, small business, corporations and merchants - a unique position versus other banks Expanding internationally in merchant acquiring through continued investment in partnerships, including a new venture with Citigroup in Brazil, and an international merchant payment platform; also launched international corporate payment product capabilities for our domestic customers Leading player in payments innovation and emerging technologies Business Line Scale #5 U.S. credit card issuer #3 U.S. corporate card issuer #5 U.S. merchant acquirer #6 European merchant acquirer (CHART) 26% Retail Payment Solutions 59% Global Merchant Acquiring 30% Corporate Payment Solutions 11% Revenue Contribution to USB Revenue Mix Business Lines |

| U.S. Bancorp Overview Capital Management Business Lines 1Q13 Update Summary |

| 1Q13 Update Business Climate Mortgage Activity Loan Growth Net Interest Margin 1Q13 Update |
| U.S. Bancorp Overview Capital Management Business Lines 1Q13 Update Summary |
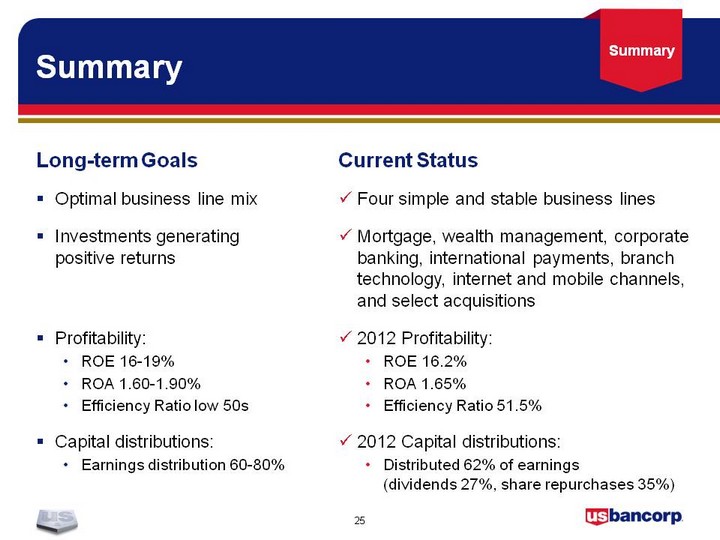
| Summary Long-term Goals Optimal business line mix Investments generating positive returns Profitability: ROE 16-19% ROA 1.60-1.90% Efficiency Ratio low 50s Capital distributions: Earnings distribution 60-80% Current Status Four simple and stable business lines Mortgage, wealth management, corporate banking, international payments, branch technology, internet and mobile channels, and select acquisitions 2012 Profitability: ROE 16.2% ROA 1.65% Efficiency Ratio 51.5% 2012 Capital distributions: Distributed 62% of earnings (dividends 27%, share repurchases 35%) Summary |

| Appendix Citi 2013 Financial Services Conference |
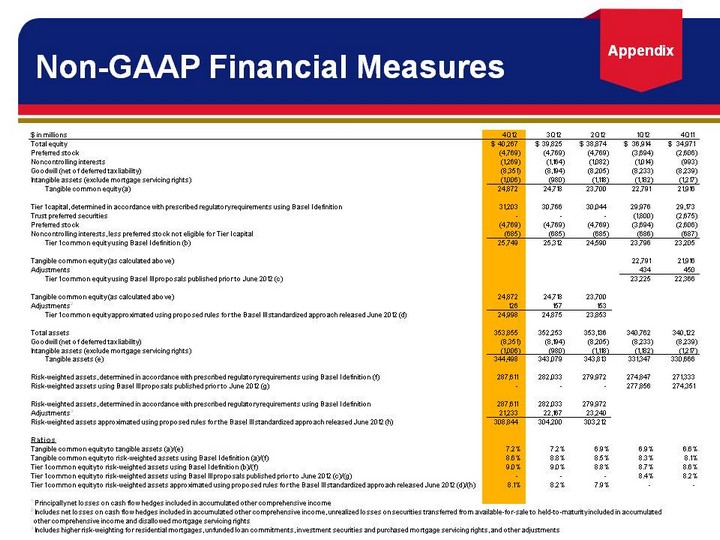
| Non-GAAP Financial Measures Appendix |

| Citi 2013 Financial Services Conference |