Attached files
| file | filename |
|---|---|
| 8-K - 8-K - Rockwood Holdings, Inc. | a13-6732_18k.htm |
Exhibit 99.1
|
|
[LOGO] |
|
|
Forward Looking Statements This presentation may contain certain "forward-looking statements" within the meaning of the Private Securities Litigation Reform Act of 1995 concerning the business, operations and financial condition of Rockwood Holdings, Inc. and its subsidiaries (“Rockwood”). Although Rockwood believes the expectations reflected in such forward-looking statements are based upon reasonable assumptions, there can be no assurance that its expectations will be realized. "Forward-looking statements" consist of all non-historical information, including the statements referring to the prospects and future performance of Rockwood. Actual results could differ materially from those projected in Rockwood’s forward-looking statements due to numerous known and unknown risks and uncertainties, including, among other things, the "Risk Factors" described in Rockwood’s periodic reports on file with the Securities and Exchange Commission. Rockwood does not undertake any obligation to publicly update any forward-looking statement to reflect events or circumstances after the date on which any such statement is made or to reflect the occurrence of unanticipated events. |
|
|
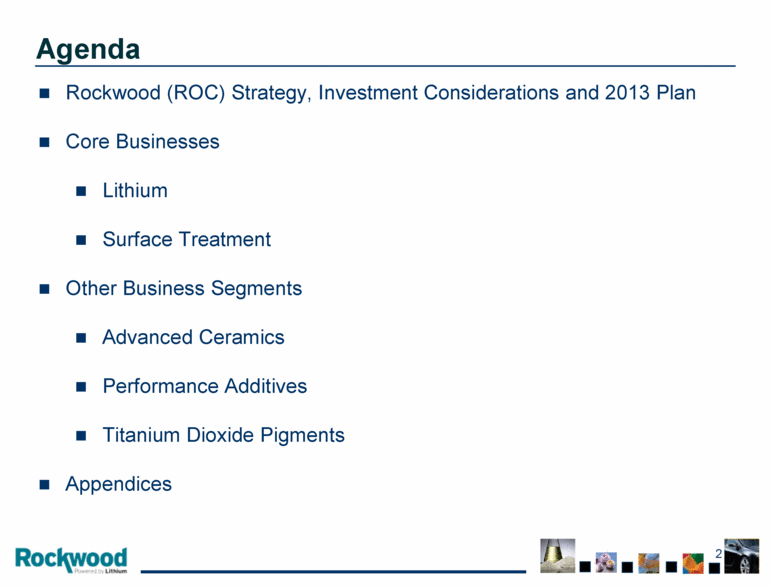
Agenda Rockwood (ROC) Strategy, Investment Considerations and 2013 Plan Core Businesses Lithium Surface Treatment Other Business Segments Advanced Ceramics Performance Additives Titanium Dioxide Pigments Appendices |
|
|
Rockwood Strategy and Business Overview |
|
|
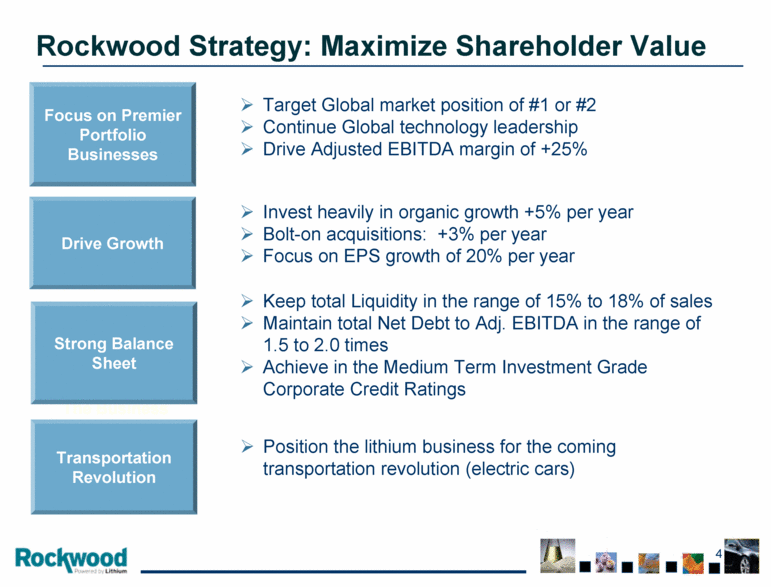
Rockwood Strategy: Maximize Shareholder Value Focus Portfolio Focus The Business Focus on Premier Portfolio Businesses Drive Growth Strong Balance Sheet Transportation Revolution Invest heavily in organic growth +5% per year Bolt-on acquisitions: +3% per year Focus on EPS growth of 20% per year Keep total Liquidity in the range of 15% to 18% of sales Maintain total Net Debt to Adj. EBITDA in the range of 1.5 to 2.0 times Achieve in the Medium Term Investment Grade Corporate Credit Ratings Position the lithium business for the coming transportation revolution (electric cars) Target Global market position of #1 or #2 Continue Global technology leadership Drive Adjusted EBITDA margin of +25% |
|
|
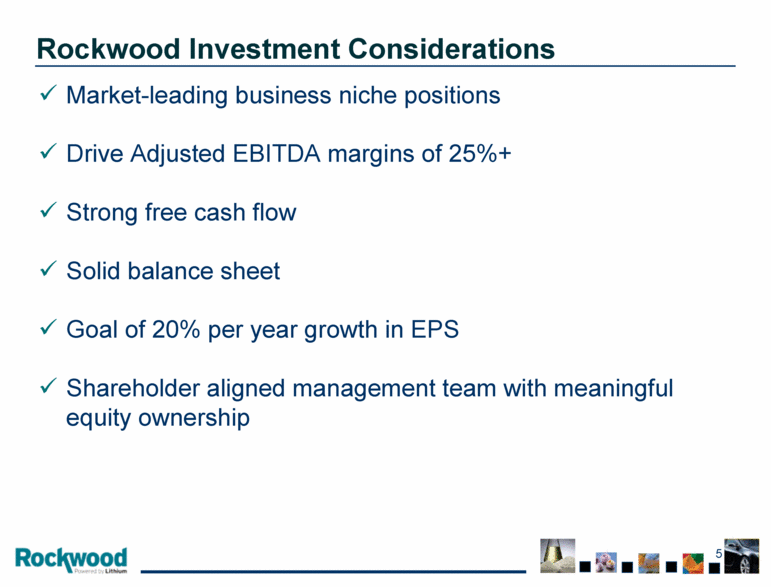
Rockwood Investment Considerations Market-leading business niche positions Drive Adjusted EBITDA margins of 25%+ Strong free cash flow Solid balance sheet Goal of 20% per year growth in EPS Shareholder aligned management team with meaningful equity ownership |
|
|
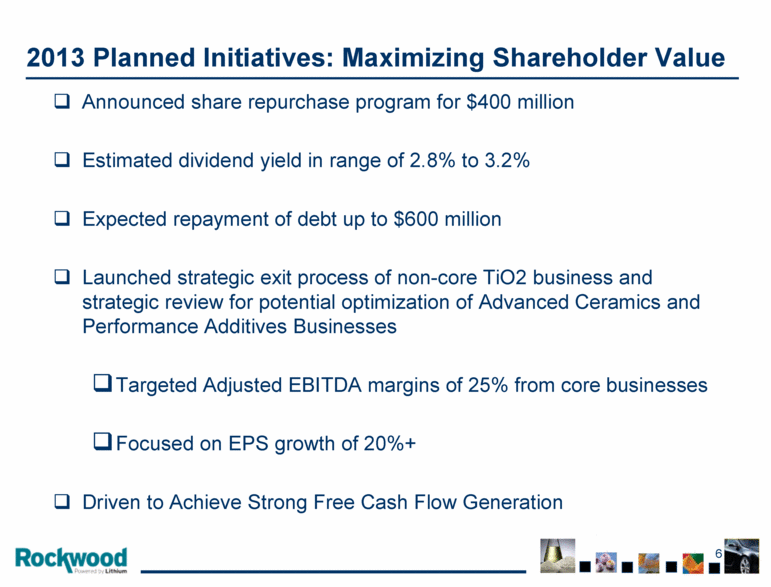
2013 Planned Initiatives: Maximizing Shareholder Value Announced share repurchase program for $400 million Estimated dividend yield in range of 2.8% to 3.2% Expected repayment of debt up to $600 million Launched strategic exit process of non-core TiO2 business and strategic review for potential optimization of Advanced Ceramics and Performance Additives Businesses Targeted Adjusted EBITDA margins of 25% from core businesses Focused on EPS growth of 20%+ Driven to Achieve Strong Free Cash Flow Generation |
|
|
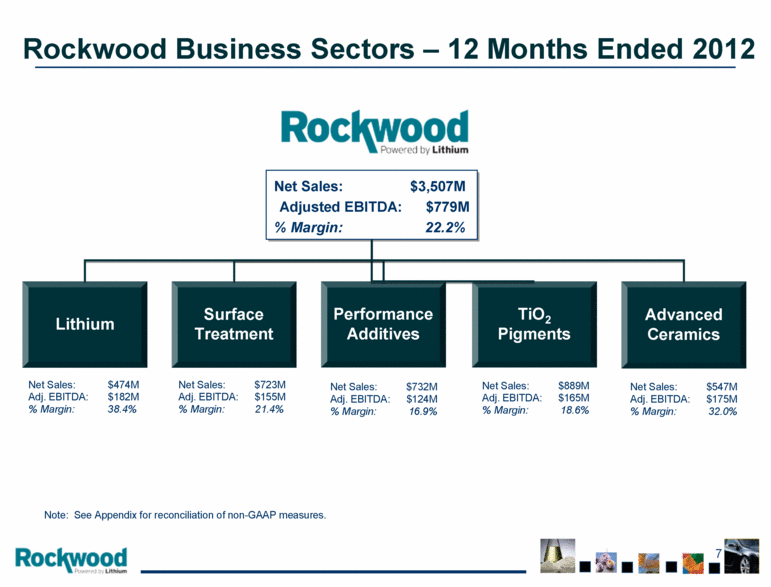
Rockwood Business Sectors – 12 Months Ended 2012 Advanced Ceramics Performance Additives Surface Treatment Net Sales: $723M Adj. EBITDA: $155M % Margin: 21.4% Net Sales: $732M Adj. EBITDA: $124M % Margin: 16.9% Net Sales: $889M Adj. EBITDA: $165M % Margin: 18.6% Net Sales: $3,507M Adjusted EBITDA: $779M % Margin: 22.2% Note: See Appendix for reconciliation of non-GAAP measures. TiO2 Pigments Net Sales: $547M Adj. EBITDA: $175M % Margin: 32.0% Lithium Net Sales: $474M Adj. EBITDA: $182M % Margin: 38.4% |
|
|
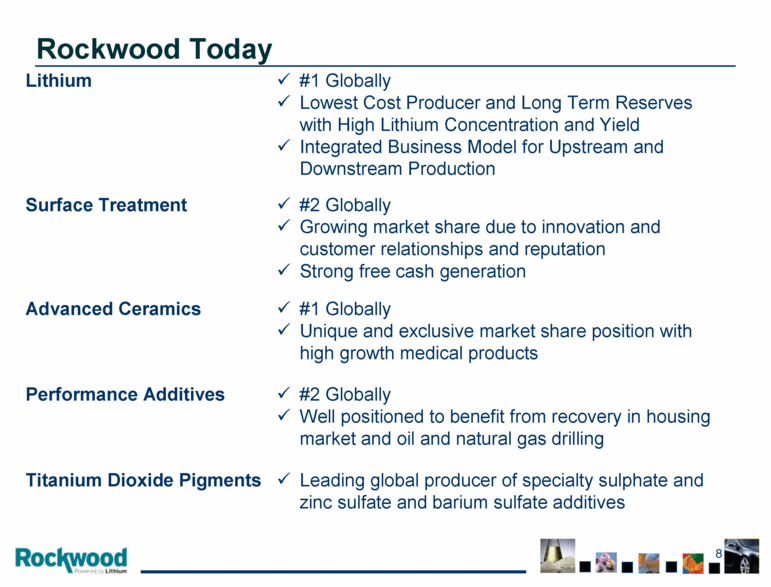
Rockwood Today Lithium #1 Globally Lowest Cost Producer and Long Term Reserves with High Lithium Concentration and Yield Integrated Business Model for Upstream and Downstream Production Surface Treatment #2 Globally Growing market share due to innovation and customer relationships and reputation Strong free cash generation Advanced Ceramics #1 Globally Unique and exclusive market share position with high growth medical products Performance Additives #2 Globally Well positioned to benefit from recovery in housing market and oil and natural gas drilling Titanium Dioxide Pigments Leading global producer of specialty sulphate and zinc sulfate and barium sulfate additives |
|
|
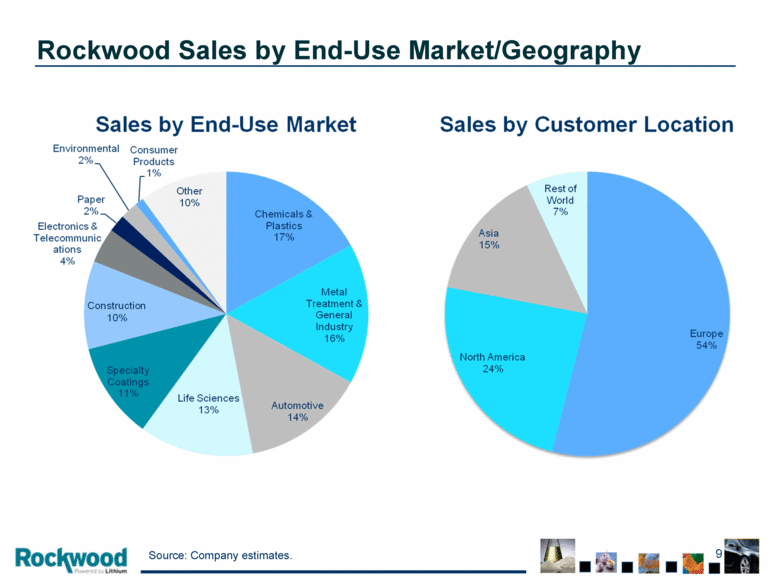
Rockwood Sales by End-Use Market/Geography Source: Company estimates. |
|
|
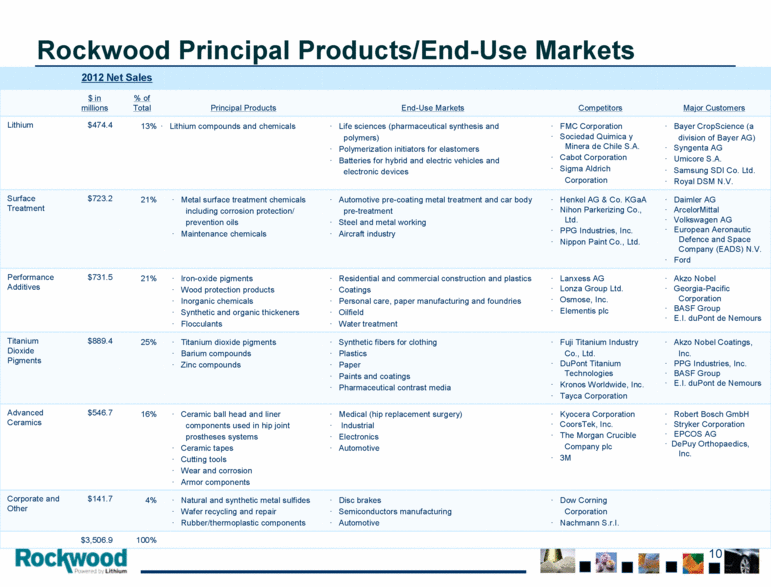
Rockwood Principal Products/End-Use Markets 2012 Net Sales $ in millions % of Total Principal Products End-Use Markets Competitors Major Customers Lithium $474.4 13% · Lithium compounds and chemicals · Life sciences (pharmaceutical synthesis and polymers) · Polymerization initiators for elastomers · Batteries for hybrid and electric vehicles and electronic devices · FMC Corporation · Sociedad Quimica y Minera de Chile S.A. · Cabot Corporation · Sigma Aldrich Corporation · Bayer CropScience (a division of Bayer AG) · Syngenta AG · Umicore S.A. · Samsung SDI Co. Ltd. · Royal DSM N.V. Surface Treatment $723.2 21% · Metal surface treatment chemicals including corrosion protection/ prevention oils · Maintenance chemicals · Automotive pre-coating metal treatment and car body pre-treatment · Steel and metal working · Aircraft industry · Henkel AG & Co. KGaA · Nihon Parkerizing Co., Ltd. · PPG Industries, Inc. · Nippon Paint Co., Ltd. · Daimler AG · ArcelorMittal · Volkswagen AG · European Aeronautic Defence and Space Company (EADS) N.V. · Ford Performance Additives $731.5 21% · Iron-oxide pigments · Wood protection products · Inorganic chemicals · Synthetic and organic thickeners · Flocculants · Residential and commercial construction and plastics · Coatings · Personal care, paper manufacturing and foundries · Oilfield · Water treatment · Lanxess AG · Lonza Group Ltd. · Osmose, Inc. · Elementis plc · Akzo Nobel · Georgia-Pacific Corporation · BASF Group · E.I. duPont de Nemours Titanium Dioxide Pigments $889.4 25% · Titanium dioxide pigments · Barium compounds · Zinc compounds · Synthetic fibers for clothing · Plastics · Paper · Paints and coatings · Pharmaceutical contrast media · Fuji Titanium Industry Co., Ltd. · DuPont Titanium Technologies · Kronos Worldwide, Inc. · Tayca Corporation · Akzo Nobel Coatings, Inc. · PPG Industries, Inc. · BASF Group · E.I. duPont de Nemours Advanced Ceramics $546.7 16% · Ceramic ball head and liner components used in hip joint prostheses systems · Ceramic tapes · Cutting tools · Wear and corrosion · Armor components · Medical (hip replacement surgery) · Industrial · Electronics · Automotive · Kyocera Corporation · CoorsTek, Inc. · The Morgan Crucible Company plc · 3M · Robert Bosch GmbH · Stryker Corporation · EPCOS AG · DePuy Orthopaedics, Inc. Corporate and Other $141.7 4% · Natural and synthetic metal sulfides · Wafer recycling and repair · Rubber/thermoplastic components · Disc brakes · Semiconductors manufacturing · Automotive · Dow Corning Corporation · Nachmann S.r.I. $3,506.9 100% |
|
|
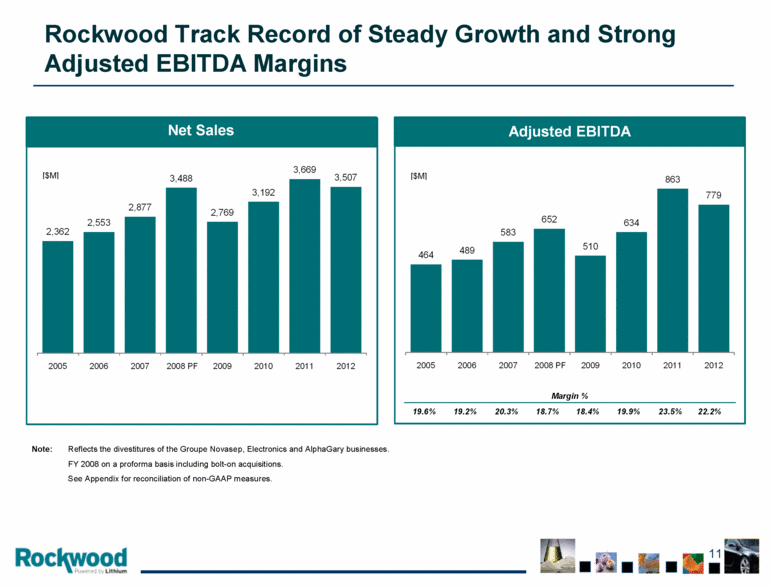
Rockwood Track Record of Steady Growth and Strong Adjusted EBITDA Margins Note: Reflects the divestitures of the Groupe Novasep, Electronics and AlphaGary businesses. FY 2008 on a proforma basis including bolt-on acquisitions. See Appendix for reconciliation of non-GAAP measures. 2,362 2,553 2,877 3,488 2,769 3,192 3,669 3,507 2005 2006 2007 2008 PF 2009 2010 2011 2012 464 489 583 652 510 634 863 779 2005 2006 2007 2008 PF 2009 2010 2011 2012 Adjusted EBITDA Net Sales [$M] [$M] 19.6% 19.2% 20.3% 18.7% 18.4% 19.9% 23.5% 22.2% Margin % |
|
|
Core Rockwood: Lithium and Surface Treatment |
|
|
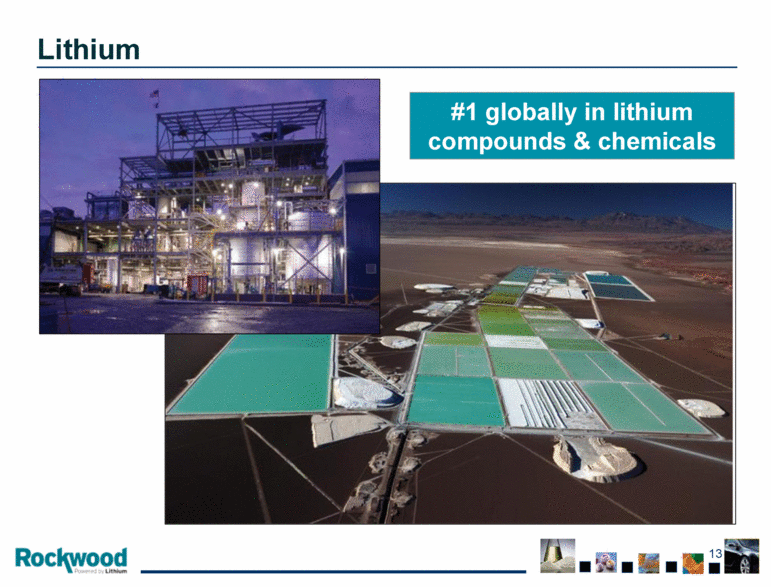
#1 globally in lithium compounds & chemicals Lithium |
|
|
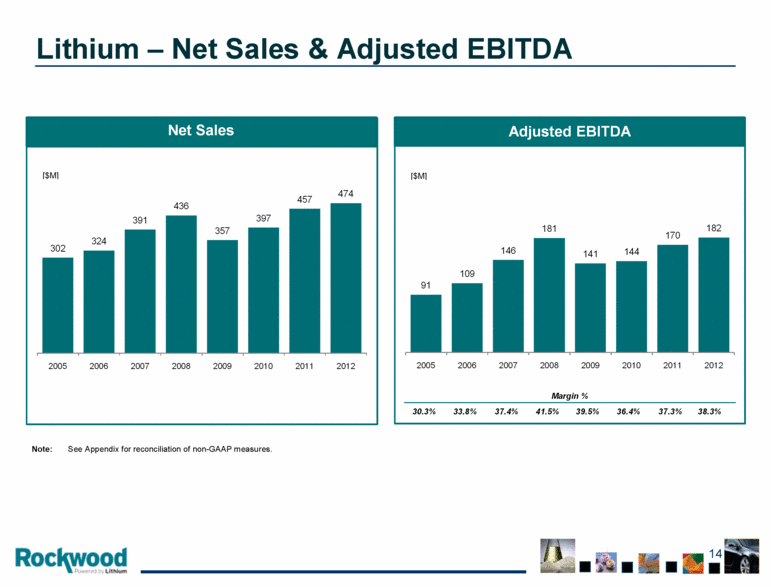
Lithium – Net Sales & Adjusted EBITDA Note: See Appendix for reconciliation of non-GAAP measures. 302 324 391 436 357 397 457 474 2005 2006 2007 2008 2009 2010 2011 2012 91 109 146 181 141 144 170 182 2005 2006 2007 2008 2009 2010 2011 2012 Adjusted EBITDA Net Sales [$M] [$M] 30.3% 33.8% 37.4% 41.5% 39.5% 36.4% 37.3% 38.3% Margin % |
|
|
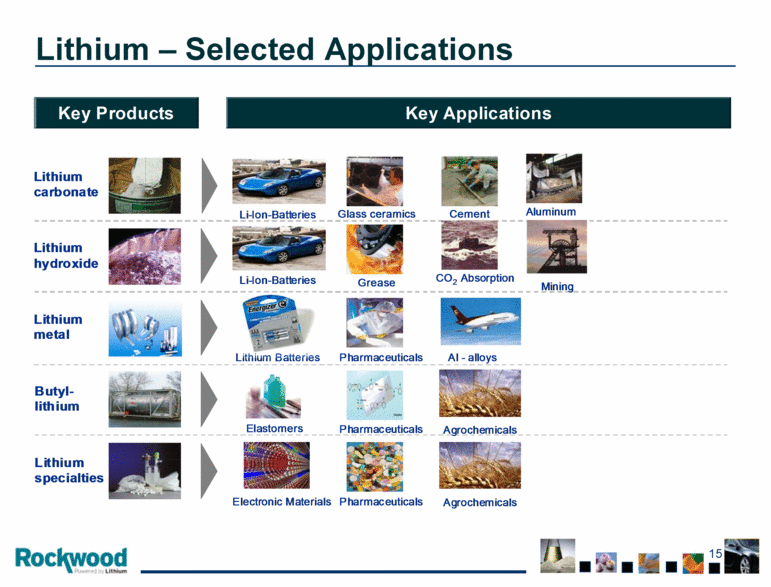
Lithium – Selected Applications Lithium carbonate Butyl - lithium Lithium metal Lithium hydroxide Lithium specialties Pharmaceuticals ceramics Grease Pharmaceuticals Pharmaceuticals Pharmaceuticals Glass ceramics Grease CO 2 Absorption Elastomers Aluminum Lithium Batteries Electronic Materials Cement Cement Al - alloys Mining Agrochemicals Agrochemicals Li-Ion - Batteries Li-Ion - Batteries Key Products Key Applications |
|
|
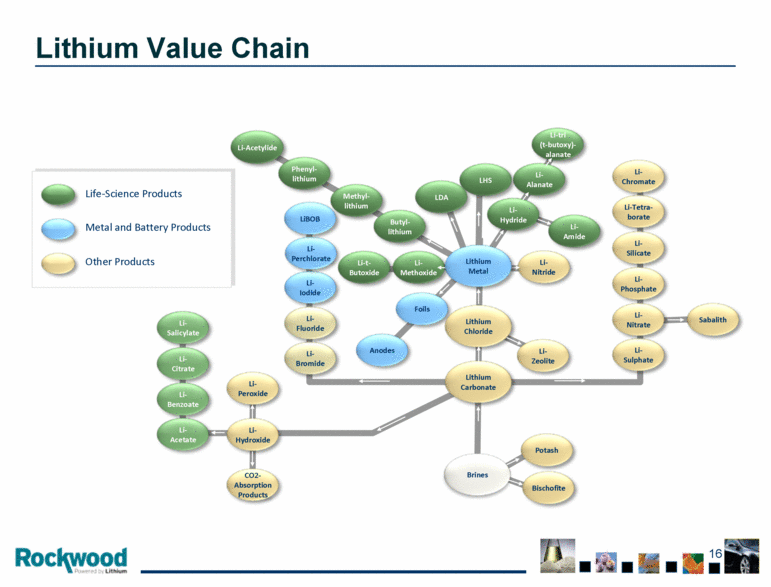
Li-Acetylide Methyl- lithium Phenyl- lithium LDA LHS Li-t- Butoxide Li-Methoxide Li-Hydride Li-tri (t-butoxy)- alanate Li-Amide Li-Salicylate Li-Citrate Li-Benzoate Li-Acetate Li-Zeolite Potash Bischofite Li-Sulphate Li-Nitrate Li-Phosphate Li-Silicate Li-Tetra- borate Li-Chromate Sabalith Li-Nitride Li-Bromide Li-Fluoride Li-Peroxide Li-Hydroxide CO2- Absorption Products Li-Iodide Li-Perchlorate LiBOB Anodes Foils Lithium Carbonate Lithium Chloride Brines Butyl- lithium Li-Alanate Lithium Metal Life-Science Products Metal and Battery Products Other Products Lithium Value Chain |
|
|
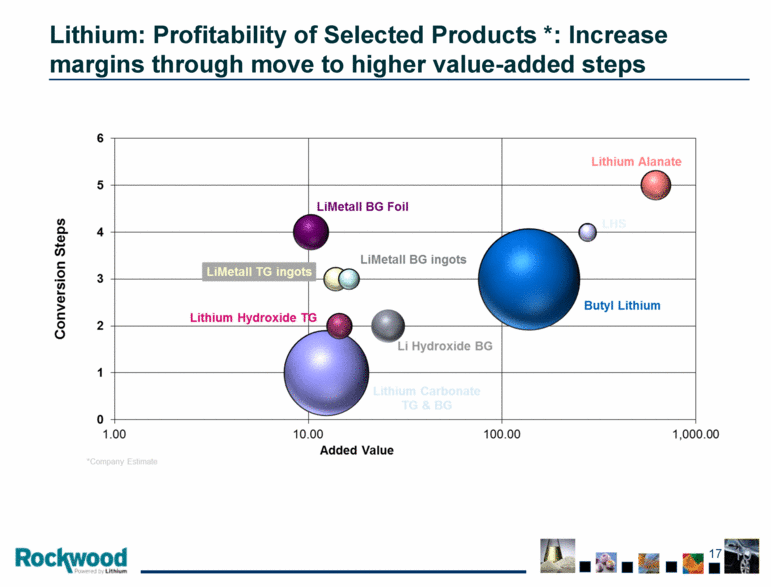
Lithium: Profitability of Selected Products *: Increase margins through move to higher value-added steps |
|
|
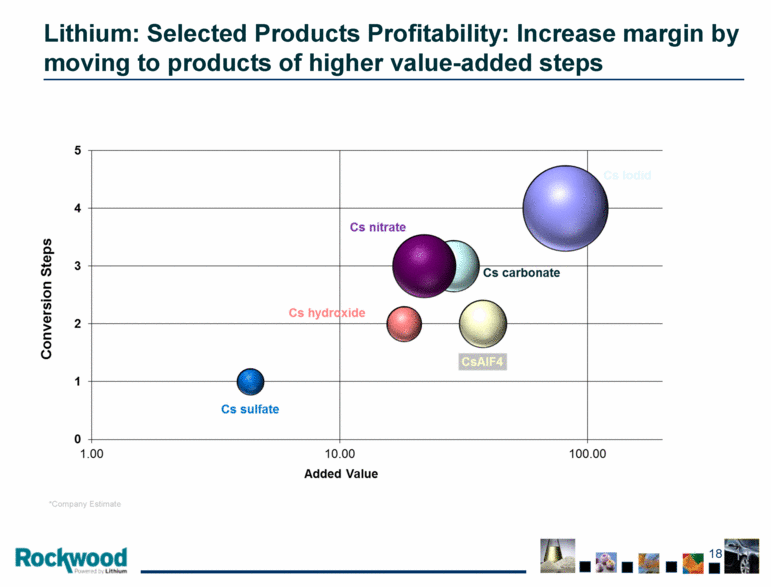
*Company Estimate Lithium: Selected Products Profitability: Increase margin by moving to products of higher value-added steps |
|
|
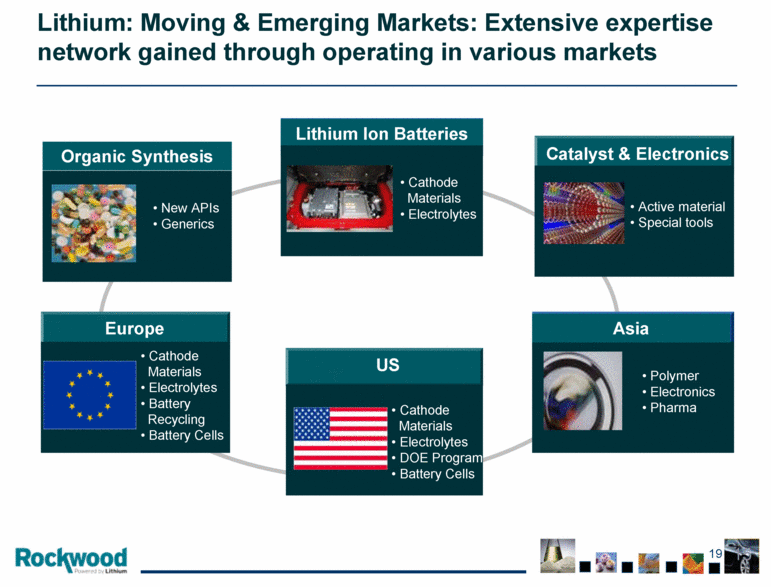
Lithium Ion Batteries Cathode Materials Electrolytes Catalyst & Electronics Active material Special tools Asia Polymer Electronics Pharma US Cathode Materials Electrolytes DOE Program Battery Cells Cathode Materials Electrolytes Battery Recycling Battery Cells Europe New APIs Generics Organic Synthesis Lithium: Moving & Emerging Markets: Extensive expertise network gained through operating in various markets |
|
|
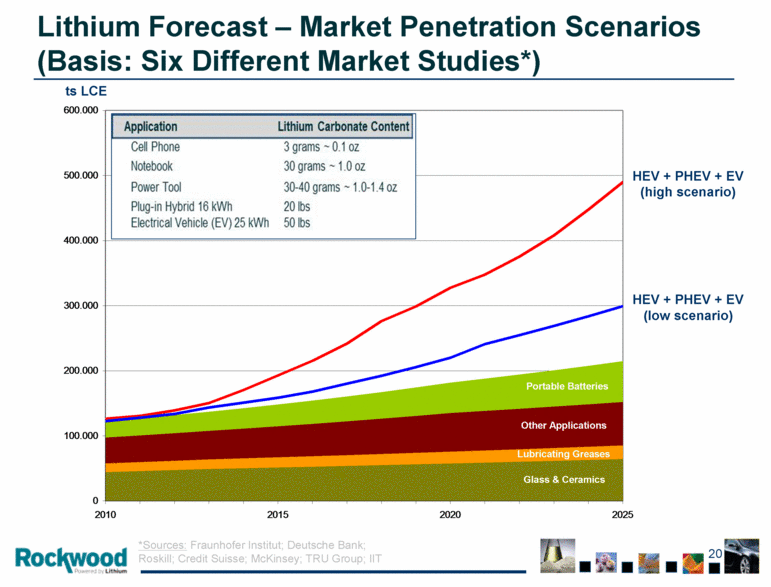
HEV + PHEV + EV (low scenario) HEV + PHEV + EV (high scenario) LCE *Sources: Fraunhofer Institut; Deutsche Bank; Roskill; Credit Suisse; McKinsey; TRU Group; IIT Lithium Forecast – Market Penetration Scenarios (Basis: Six Different Market Studies*) Glass & Ceramics Lubricating Greases Other Applications Portable Batteries 0 100.000 200.000 300.000 400.000 500.000 600.000 2010 2015 2020 2025 |
|
|
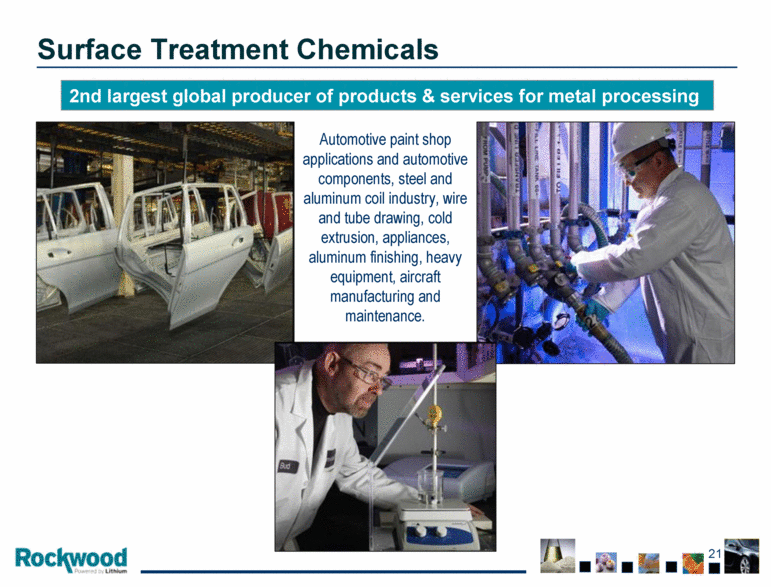
Surface Treatment Chemicals 2nd largest global producer of products & services for metal processing Automotive paint shop applications and automotive components, steel and aluminum coil industry, wire and tube drawing, cold extrusion, appliances, aluminum finishing, heavy equipment, aircraft manufacturing and maintenance. |
|
|
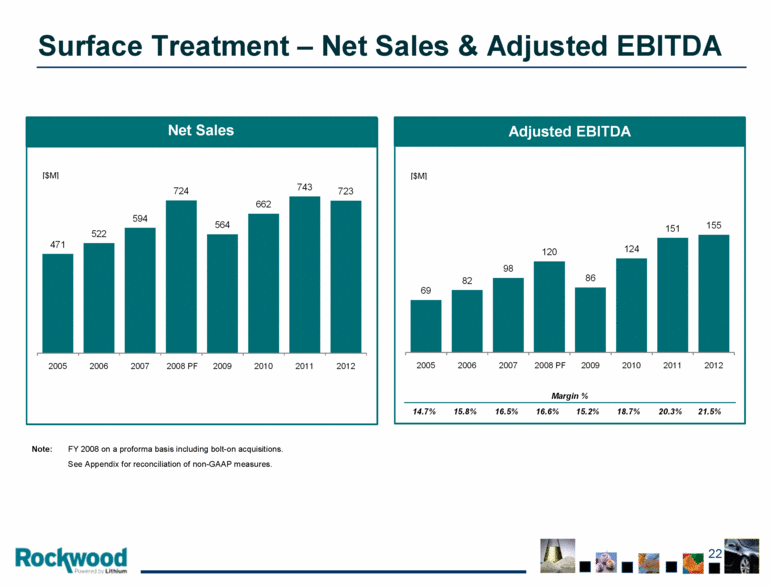
Surface Treatment – Net Sales & Adjusted EBITDA Note: FY 2008 on a proforma basis including bolt-on acquisitions. See Appendix for reconciliation of non-GAAP measures. 471 522 594 724 564 662 743 723 2005 2006 2007 2008 PF 2009 2010 2011 2012 69 82 98 120 86 124 151 155 2005 2006 2007 2008 PF 2009 2010 2011 2012 Adjusted EBITDA Net Sales [$M] [$M] 14.7% 15.8% 16.5% 16.6% 15.2% 18.7% 20.3% 21.5% Margin % |
|
|
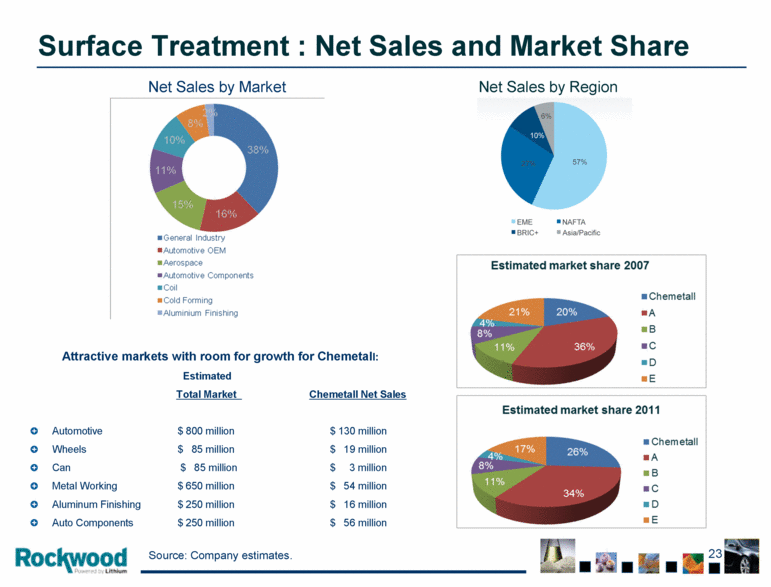
Surface Treatment : Net Sales and Market Share Net Sales by Region Attractive markets with room for growth for Chemetall: Estimated Total Market Chemetall Net Sales Automotive $ 800 million $ 130 million Wheels $ 85 million $ 19 million Can $ 85 million $ 3 million Metal Working $ 650 million $ 54 million Aluminum Finishing $ 250 million $ 16 million Auto Components $ 250 million $ 56 million Net Sales by Market Source: Company estimates. |
|
|
Other Businesses |
|
|
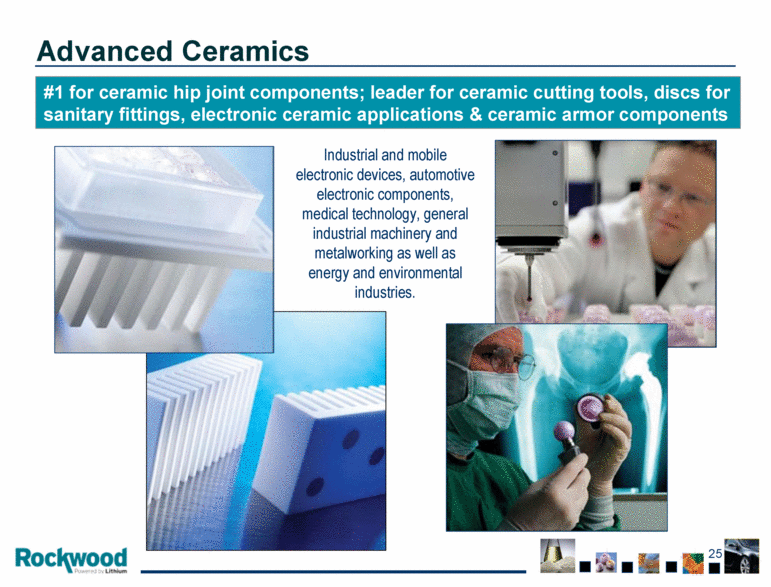
Advanced Ceramics #1 for ceramic hip joint components; leader for ceramic cutting tools, discs for sanitary fittings, electronic ceramic applications & ceramic armor components Industrial and mobile electronic devices, automotive electronic components, medical technology, general industrial machinery and metalworking as well as energy and environmental industries. |
|
|
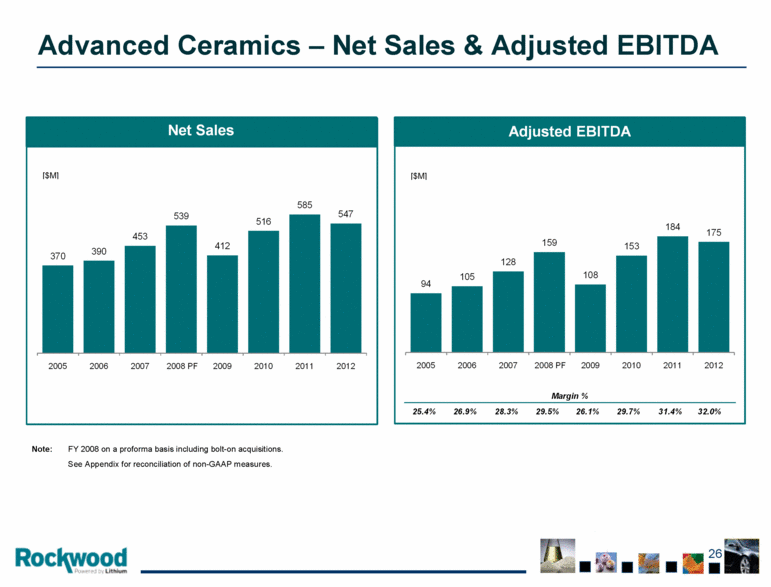
Advanced Ceramics – Net Sales & Adjusted EBITDA Note: FY 2008 on a proforma basis including bolt-on acquisitions. See Appendix for reconciliation of non-GAAP measures. 370 390 453 539 412 516 585 547 2005 2006 2007 2008 PF 2009 2010 2011 2012 94 105 128 159 108 153 184 175 2005 2006 2007 2008 PF 2009 2010 2011 2012 Adjusted EBITDA Net Sales [$M] [$M] 25.4% 26.9% 28.3% 29.5% 26.1% 29.7% 31.4% 32.0% Margin % |
|
|
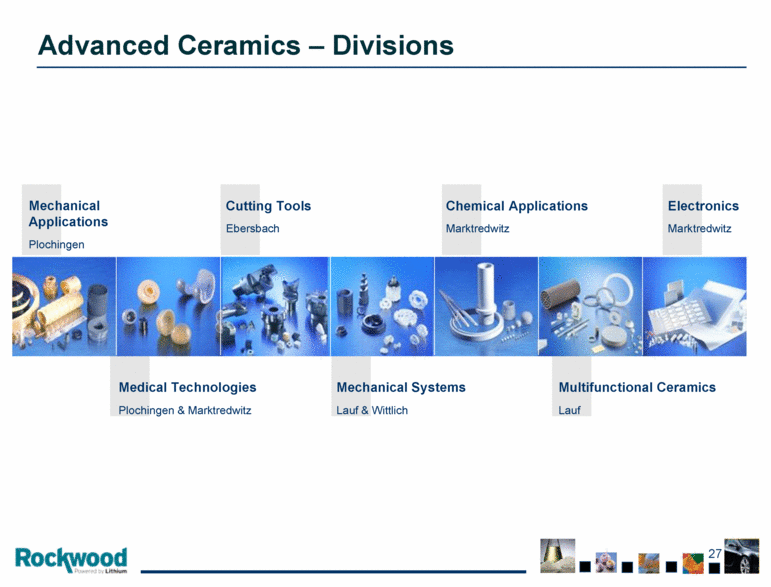
Chemical Applications Marktredwitz Medical Technologies Plochingen & Marktredwitz Cutting Tools Ebersbach Mechanical Systems Lauf & Wittlich Electronics Marktredwitz Multifunctional Ceramics Lauf Mechanical Applications Plochingen Advanced Ceramics – Divisions |
|
|
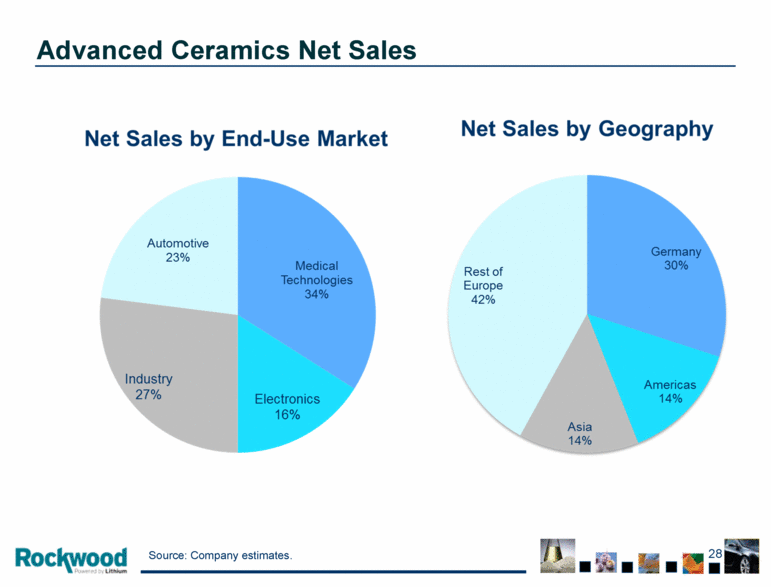
Advanced Ceramics Net Sales Source: Company estimates. |
|
|
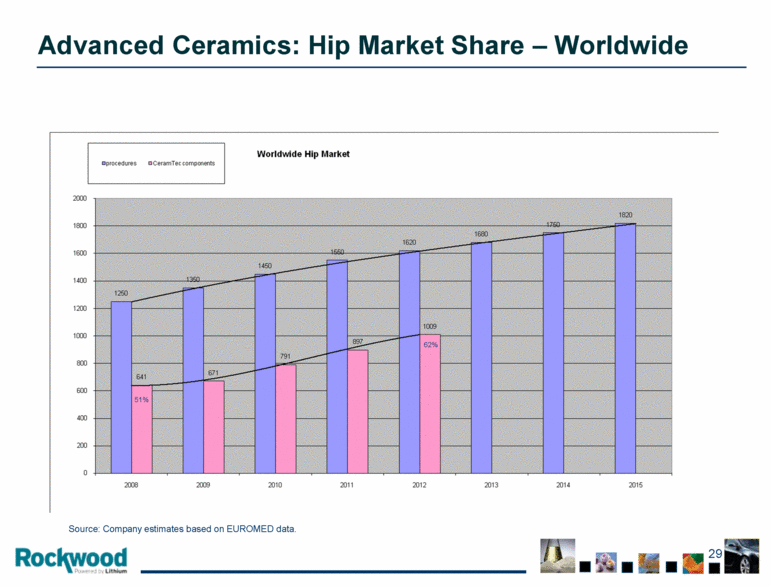
62% 51% Source: Company estimates based on EUROMED data. Advanced Ceramics: Hip Market Share – Worldwide |
|
|
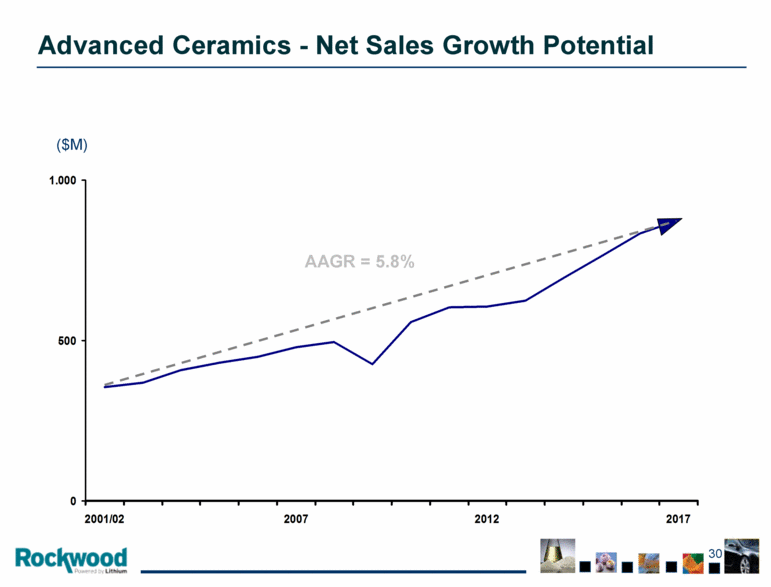
AAGR = 5.8% ($M) Advanced Ceramics - Net Sales Growth Potential 0 500 1.000 2001/02 2007 2012 2017 |
|
|
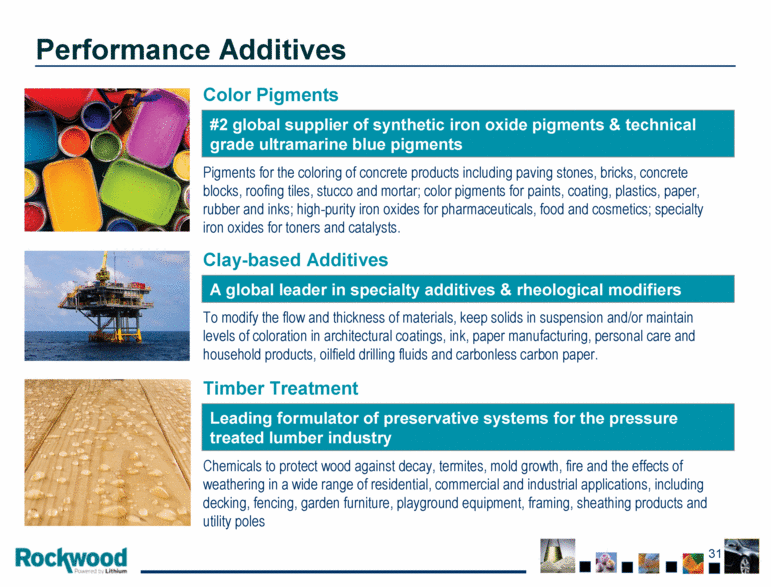
Performance Additives #2 global supplier of synthetic iron oxide pigments & technical grade ultramarine blue pigments Pigments for the coloring of concrete products including paving stones, bricks, concrete blocks, roofing tiles, stucco and mortar; color pigments for paints, coating, plastics, paper, rubber and inks; high-purity iron oxides for pharmaceuticals, food and cosmetics; specialty iron oxides for toners and catalysts. Color Pigments Clay-based Additives A global leader in specialty additives & rheological modifiers To modify the flow and thickness of materials, keep solids in suspension and/or maintain levels of coloration in architectural coatings, ink, paper manufacturing, personal care and household products, oilfield drilling fluids and carbonless carbon paper. Timber Treatment Leading formulator of preservative systems for the pressure treated lumber industry Chemicals to protect wood against decay, termites, mold growth, fire and the effects of weathering in a wide range of residential, commercial and industrial applications, including decking, fencing, garden furniture, playground equipment, framing, sheathing products and utility poles |
|
|
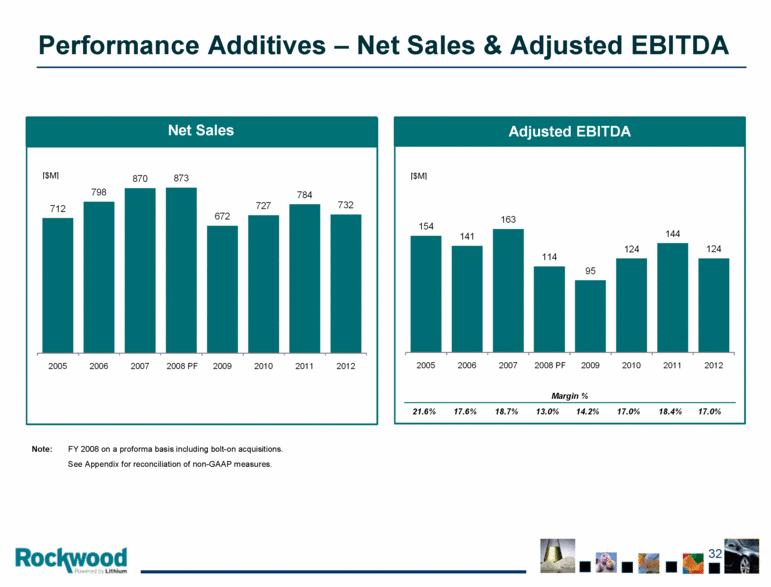
Performance Additives – Net Sales & Adjusted EBITDA Note: FY 2008 on a proforma basis including bolt-on acquisitions. See Appendix for reconciliation of non-GAAP measures. 712 798 870 873 672 727 784 732 2005 2006 2007 2008 PF 2009 2010 2011 2012 154 141 163 114 95 124 144 124 2005 2006 2007 2008 PF 2009 2010 2011 2012 Adjusted EBITDA Net Sales [$M] [$M] 21.6% 17.6% 18.7% 13.0% 14.2% 17.0% 18.4% 17.0% Margin % |
|
|
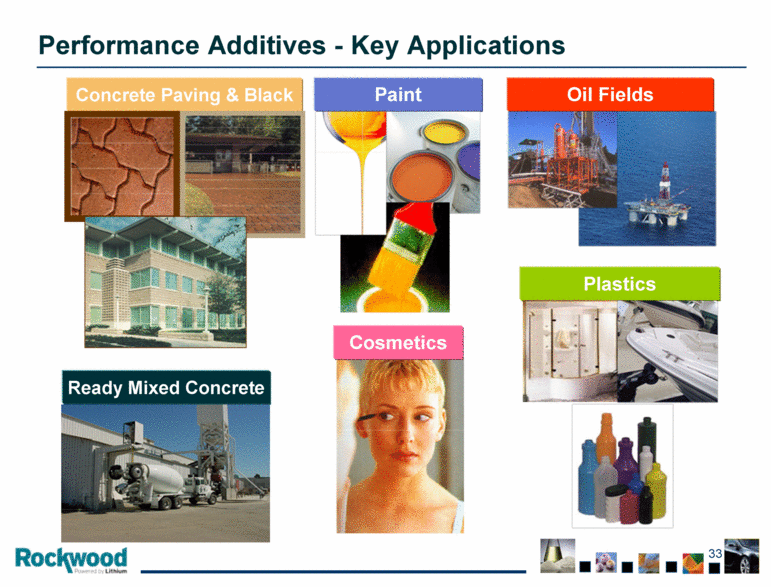
Ready Mixed Concrete Concrete Paving & Black Plastics Paint Oil Fields Cosmetics Performance Additives - Key Applications |
|
|
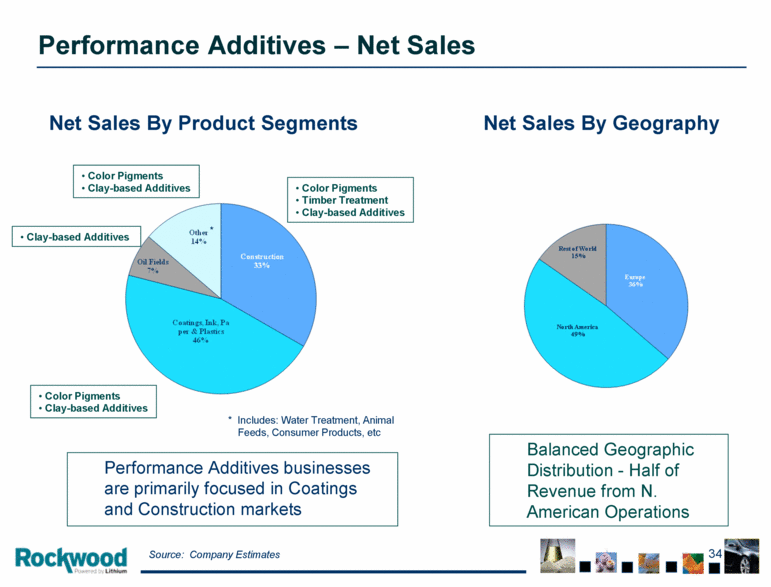
Performance Additives businesses are primarily focused in Coatings and Construction markets Color Pigments Timber Treatment Clay-based Additives Color Pigments Clay-based Additives * Includes: Water Treatment, Animal Feeds, Consumer Products, etc * Source: Company Estimates Clay-based Additives Color Pigments Clay-based Additives Net Sales By Product Segments Net Sales By Geography Performance Additives – Net Sales Balanced Geographic Distribution - Half of Revenue from N. American Operations |
|
|
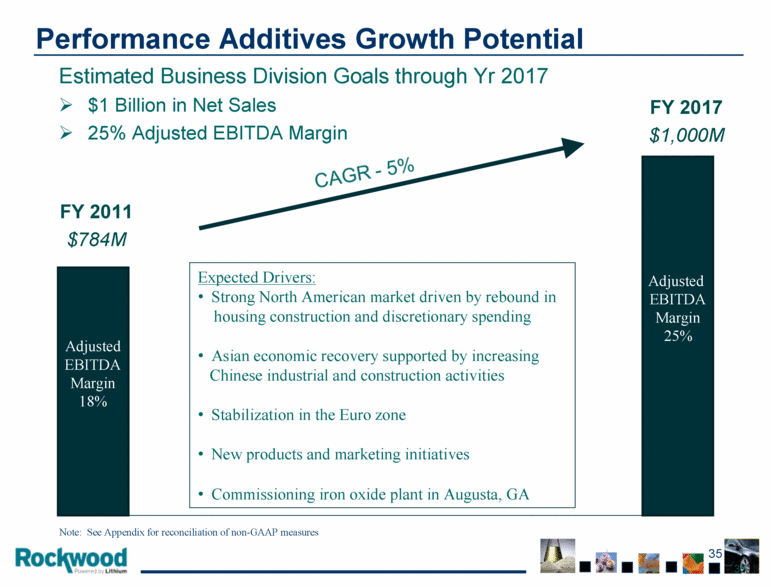
Performance Additives Growth Potential Estimated Business Division Goals through Yr 2017 $1 Billion in Net Sales 25% Adjusted EBITDA Margin FY 2011 $784M FY 2017 $1,000M Expected Drivers: Strong North American market driven by rebound in housing construction and discretionary spending Asian economic recovery supported by increasing Chinese industrial and construction activities Stabilization in the Euro zone New products and marketing initiatives Commissioning iron oxide plant in Augusta, GA Adjusted EBITDA Margin 18% Adjusted EBITDA Margin 25% Note: See Appendix for reconciliation of non-GAAP measures 35 |
|
|
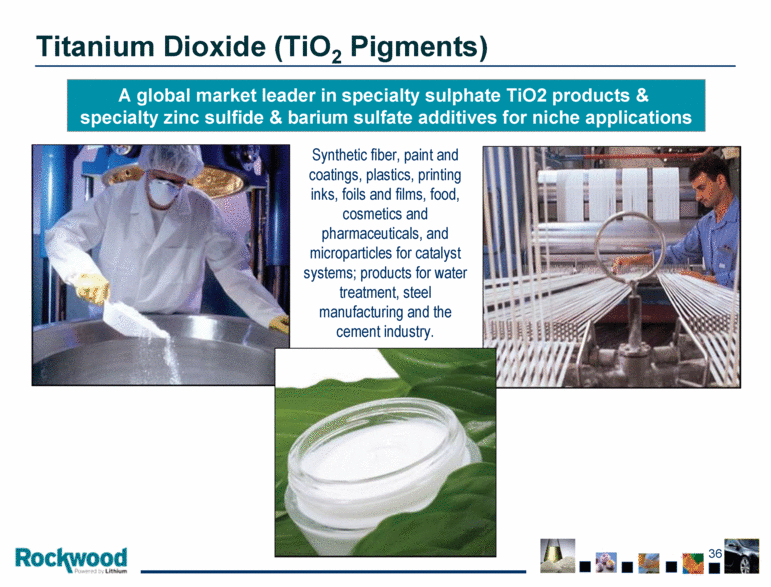
Titanium Dioxide (TiO2 Pigments) A global market leader in specialty sulphate TiO2 products & specialty zinc sulfide & barium sulfate additives for niche applications Synthetic fiber, paint and coatings, plastics, printing inks, foils and films, food, cosmetics and pharmaceuticals, and microparticles for catalyst systems; products for water treatment, steel manufacturing and the cement industry. |
|
|
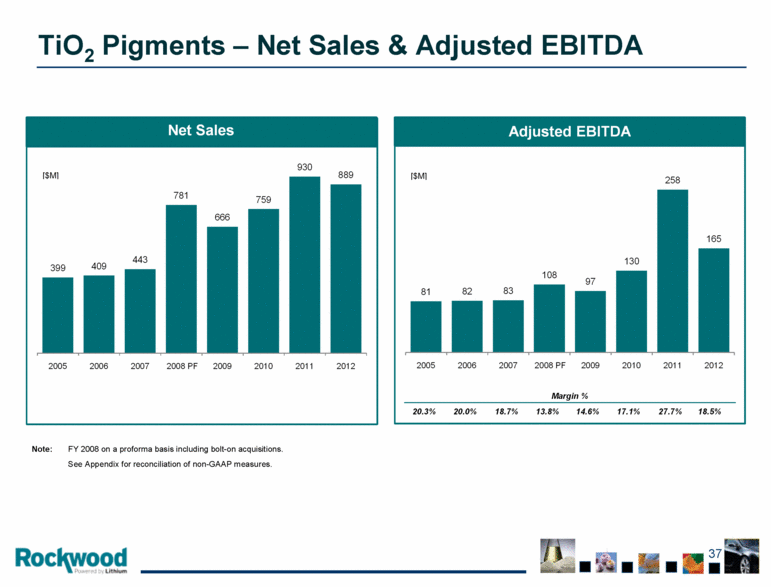
TiO2 Pigments – Net Sales & Adjusted EBITDA Note: FY 2008 on a proforma basis including bolt-on acquisitions. See Appendix for reconciliation of non-GAAP measures. 399 409 443 781 666 759 930 889 2005 2006 2007 2008 PF 2009 2010 2011 2012 81 82 83 108 97 130 258 165 2005 2006 2007 2008 PF 2009 2010 2011 2012 Adjusted EBITDA Net Sales [$M] [$M] 20.3% 20.0% 18.7% 13.8% 14.6% 17.1% 27.7% 18.5% Margin % |
|
|
Appendices |
|
|
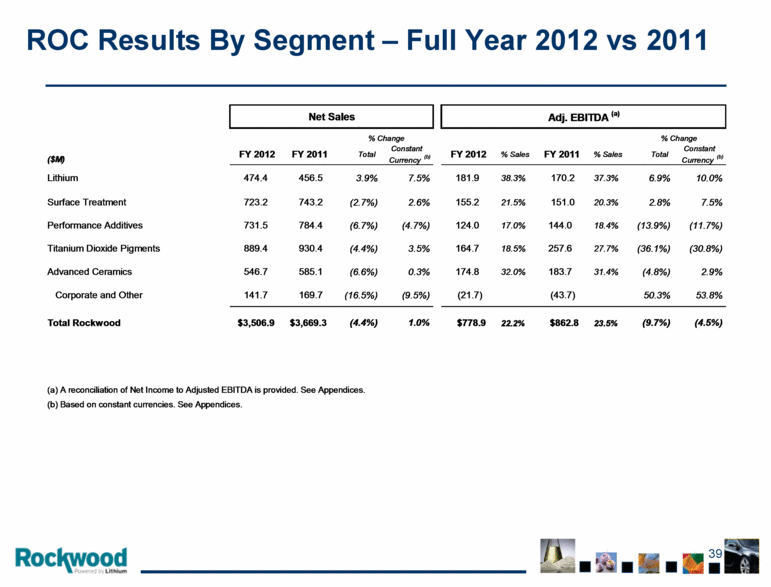
ROC Results By Segment – Full Year 2012 vs 2011 Net Sales Adj. EBITDA (a) % Change % Change ($M) FY 2012 FY 2011 Total Constant Currency (b) FY 2012 % Sales FY 2011 % Sales Total Constant Currency (b) Lithium 474.4 456.5 3.9% 7.5% 181.9 38.3% 170.2 37.3% 6.9% 10.0% Surface Treatment 723.2 743.2 (2.7%) 2.6% 155.2 21.5% 151.0 20.3% 2.8% 7.5% Performance Additives 731.5 784.4 (6.7%) (4.7%) 124.0 17.0% 144.0 18.4% (13.9%) (11.7%) Titanium Dioxide Pigments 889.4 930.4 (4.4%) 3.5% 164.7 18.5% 257.6 27.7% (36.1%) (30.8%) Advanced Ceramics 546.7 585.1 (6.6%) 0.3% 174.8 32.0% 183.7 31.4% (4.8%) 2.9% Corporate and Other 141.7 169.7 (16.5%) (9.5%) (21.7) (43.7) 50.3% 53.8% Total Rockwood $3,506.9 $3,669.3 (4.4%) 1.0% $778.9 22.2% $862.8 23.5% (9.7%) (4.5%) (a) A reconciliation of Net Income to Adjusted EBITDA is provided. See Appendices. (b) Based o n constant currencies. See Appendices. |
|
|
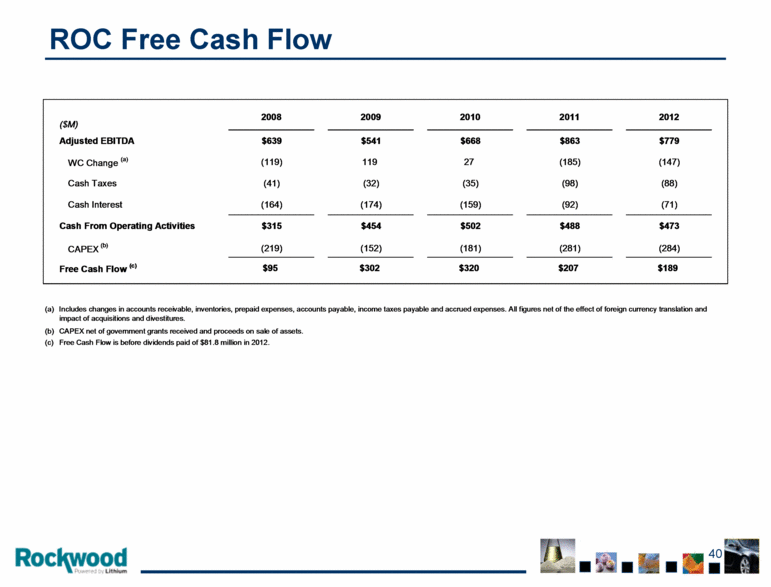
ROC Free Cash Flow ($M) 2008 2009 2010 2011 2012 Adjusted EBITDA $639 $541 $668 $863 $779 WC Change (a) (119) 119 27 (185) (147) Cash Taxes (41) (32) (35) (98) (88) Cash Interest (164) (174) (159) (92) (71) Cash From Operating Activities $315 $454 $502 $488 $473 CAPEX (b) (219) (152) (181) (281) (284) Free Cash Flow (c) $95 $302 $320 $207 $189 (a) (b) CAPEX net of government grants received and proceeds on sale of assets. (c) Includes changes in accounts receivable, inventories, prepaid expenses, accounts payable, income taxes payable and accrued expenses. All figures net of the effect of foreign currency translation and impact of acquisitions and divestitures. Free Cash Flow is before dividends paid of $81.8 million in 2012. |
|
|
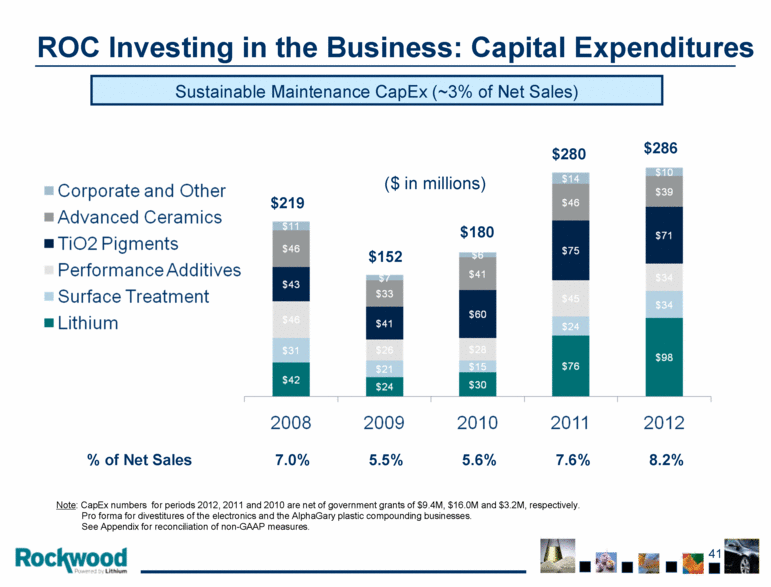
ROC Investing in the Business: Capital Expenditures Note: CapEx numbers for periods 2012, 2011 and 2010 are net of government grants of $9.4M, $16.0M and $3.2M, respectively. Pro forma for divestitures of the electronics and the AlphaGary plastic compounding businesses. See Appendix for reconciliation of non-GAAP measures. Sustainable Maintenance CapEx (~3% of Net Sales) ($ in millions) % of Net Sales 7.0% 5.5% 5.6% 7.6% 8.2% $219 $152 $180 $280 $286 |
|
|
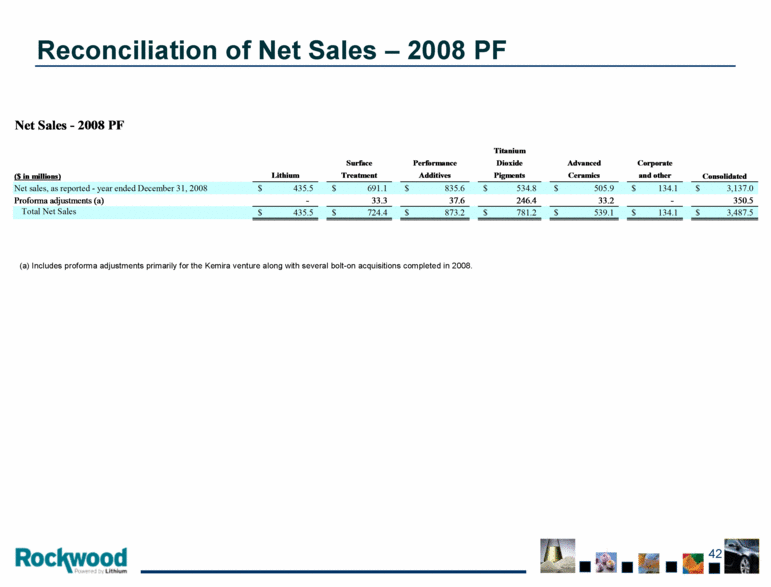
Reconciliation of Net Sales – 2008 PF (a) Includes proforma adjustments primarily for the Kemira venture along with several bolt-on acquisitions completed in 2008. $ 3,487.5 $ 134.1 $ 539.1 $ 781.2 $ 873.2 $ 724.4 $ 435.5 Total Net Sales 350.5 - 33.2 246.4 37.6 33.3 - Proforma adjustments (a) $ 3,137.0 $ 134.1 $ 505.9 $ 534.8 $ 835.6 $ 691.1 $ 435.5 Net sales, as reported - year ended December 31, 2008 and other Ceramics Pigments Additives Treatment Lithium Corporate Advanced Dioxide Performance Surface Consolidated Titanium ($ in millions) Net Sales - 2008 PF |
|
|
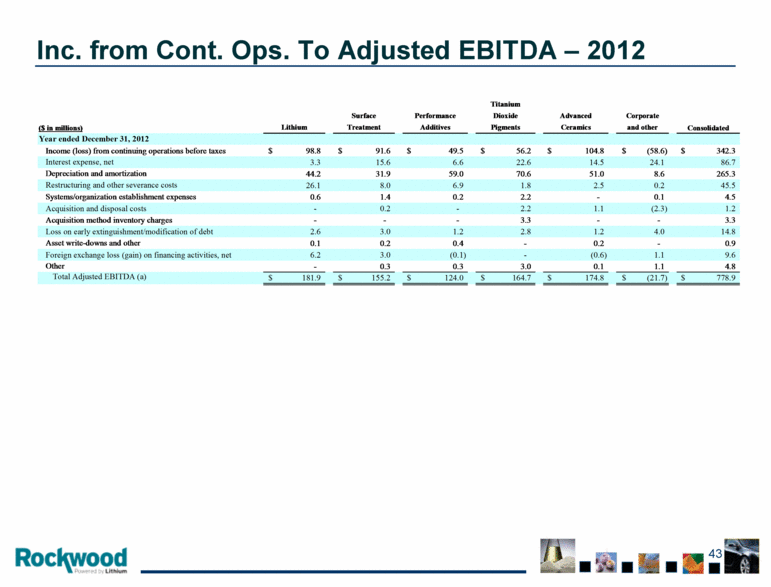
Inc. from Cont. Ops. To Adjusted EBITDA – 2012 Titanium Surface Performance Dioxide Advanced Corporate Lithium Treatment Additives Pigments Ceramics and other Year ended December 31, 2012 Income (loss) from continuing operations before taxes 98.8 $ 91.6 $ 49.5 $ 56.2 $ 104.8 $ (58.6) $ 342.3 $ Interest expense, net 3.3 15.6 6.6 22.6 14.5 24.1 86.7 Depreciation and amortization 44.2 31.9 59.0 70.6 51.0 8.6 265.3 Restructuring and other severance costs 26.1 8.0 6.9 1.8 2.5 0.2 45.5 Systems/ organization establishment expenses 0.6 1.4 0.2 2.2 - 0.1 4.5 Acquisition and disposal costs - 0.2 - 2.2 1.1 (2.3) 1.2 Acquisition method inventory charges - - - 3.3 - - 3.3 Loss on early extinguishment/ modification of debt 2.6 3.0 1.2 2.8 1.2 4.0 14.8 Asset write-downs and other 0.1 0.2 0.4 - 0.2 - 0.9 Foreign exchange loss (gain) on financing activities, net 6.2 3.0 (0.1) - (0.6) 1.1 9.6 Other - 0.3 0.3 3.0 0.1 1.1 4.8 Total Adjusted EBITDA (a) 181.9 $ 155.2 $ 124.0 $ 164.7 $ 174.8 $ (21.7) $ 778.9 $ ($ in millions) Consolidated |
|
|
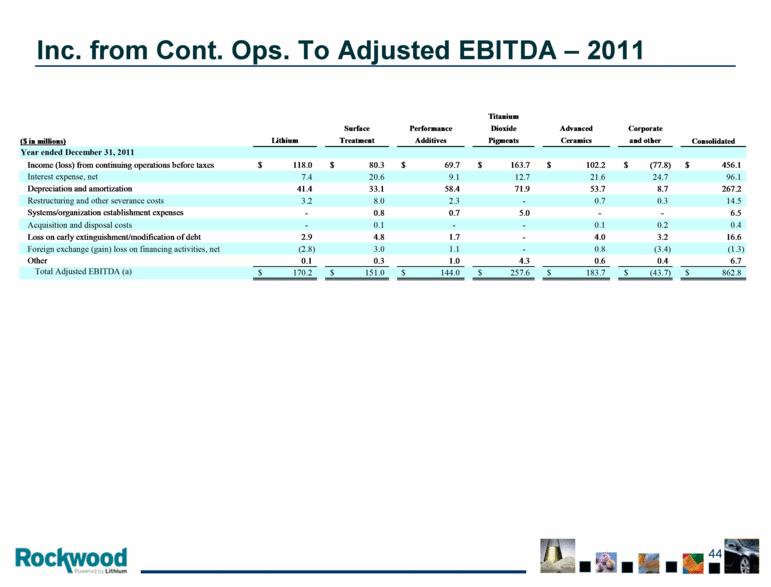
Inc. from Cont. Ops. To Adjusted EBITDA – 2011 $ 862.8 $ (43.7) $ 183.7 $ 257.6 $ 144.0 $ 151.0 $ 170.2 Total Adjusted EBITDA (a) 6.7 0.4 0.6 4.3 1.0 0.3 0.1 Other (1.3) (3.4) 0.8 - 1.1 3.0 (2.8) Foreign exchange (gain) loss on financing activities, net 16.6 3.2 4.0 - 1.7 4.8 2.9 Loss on early extinguishment/ modification of debt 0.4 0.2 0.1 - - 0.1 - Acquisition and disposal costs 6.5 - - 5.0 0.7 0.8 - Systems/ organization establishment expenses 14.5 0.3 0.7 - 2.3 8.0 3.2 Restructuring and other severance costs 267.2 8.7 53.7 71.9 58.4 33.1 41.4 Depreciation and amortization 96.1 24.7 21.6 12.7 9.1 20.6 7.4 Interest expense, net $ 456.1 $ (77.8) $ 102.2 $ 163.7 $ 69.7 $ 80.3 $ 118.0 Income (loss) from continuing operations before taxes Year ended December 31, 2011 and other Ceramics Pigments Additives Treatment Lithium Corporate Advanced Dioxide Performance Surface Consolidated Titanium ($ in millions) |
|
|
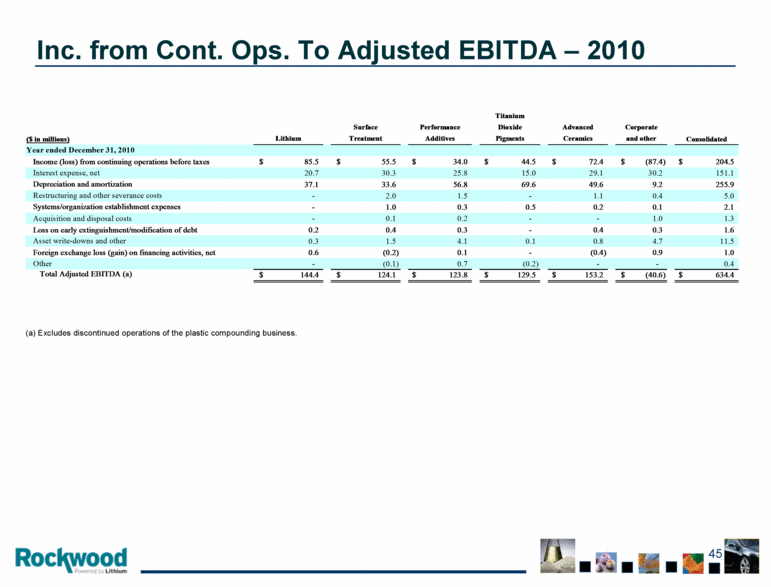
Inc. from Cont. Ops. To Adjusted EBITDA – 2010 (a) Excludes discontinued operations of the plastic compounding business. $ 634.4 $ (40.6) $ 153.2 $ 129.5 $ 123.8 $ 124.1 $ 144.4 Total Adjusted EBITDA (a) 0.4 - - (0.2) 0.7 (0.1) - Other 1.0 0.9 (0.4) - 0.1 (0.2) 0.6 Foreign exchange loss (gain) on financing activities, net 11.5 4.7 0.8 0.1 4.1 1.5 0.3 Asset write-downs and other 1.6 0.3 0.4 - 0.3 0.4 0.2 Loss on early extinguishment/ modification of debt 1.3 1.0 - - 0.2 0.1 - Acquisition and disposal costs 2.1 0.1 0.2 0.5 0.3 1.0 - Systems/ organization establishment expenses 5.0 0.4 1.1 - 1.5 2.0 - Restructuring and other severance costs 255.9 9.2 49.6 69.6 56.8 33.6 37.1 Depreciation and amortization 151.1 30.2 29.1 15.0 25.8 30.3 20.7 Interest expense, net $ 204.5 $ (87.4) $ 72.4 $ 44.5 $ 34.0 $ 55.5 $ 85.5 Income (loss) from continuing operations before taxes Year ended December 31, 2010 and other Ceramics Pigments Additives Treatment Lithium Corporate Advanced Dioxide Performance Surface Consolidated Titanium ($ in millions) |
|
|
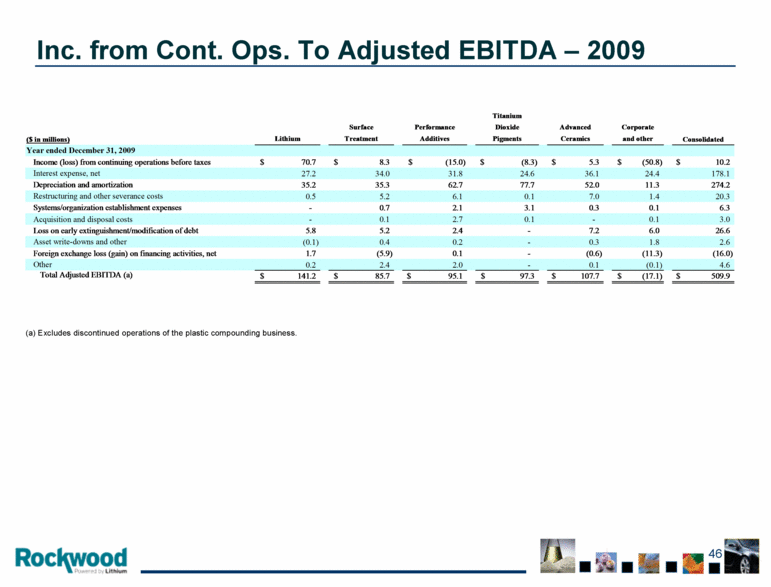
Inc. from Cont. Ops. To Adjusted EBITDA – 2009 (a) Excludes discontinued operations of the plastic compounding business. $ 509.9 $ (17.1) $ 107.7 $ 97.3 $ 95.1 $ 85.7 $ 141.2 Total Adjusted EBITDA (a) 4.6 (0.1) 0.1 - 2.0 2.4 0.2 Other (16.0) (11.3) (0.6) - 0.1 (5.9) 1.7 Foreign exchange loss (gain) on financing activities, net 2.6 1.8 0.3 - 0.2 0.4 (0.1) Asset write-downs and other 26.6 6.0 7.2 - 2.4 5.2 5.8 Loss on early extinguishment/ modification of debt 3.0 0.1 - 0.1 2.7 0.1 - Acquisition and disposal costs 6.3 0.1 0.3 3.1 2.1 0.7 - Systems/ organization establishment expenses 20.3 1.4 7.0 0.1 6.1 5.2 0.5 Restructuring and other severance costs 274.2 11.3 52.0 77.7 62.7 35.3 35.2 Depreciation and amortization 178.1 24.4 36.1 24.6 31.8 34.0 27.2 Interest expense, net $ 10.2 $ (50.8) $ 5.3 $ (8.3) $ (15.0) $ 8.3 $ 70.7 Income (loss) from continuing operations before taxes Year ended December 31, 2009 and other Ceramics Pigments Additives Treatment Lithium Corporate Advanced Dioxide Performance Surface Consolidated Titanium ($ in millions) |
|
|
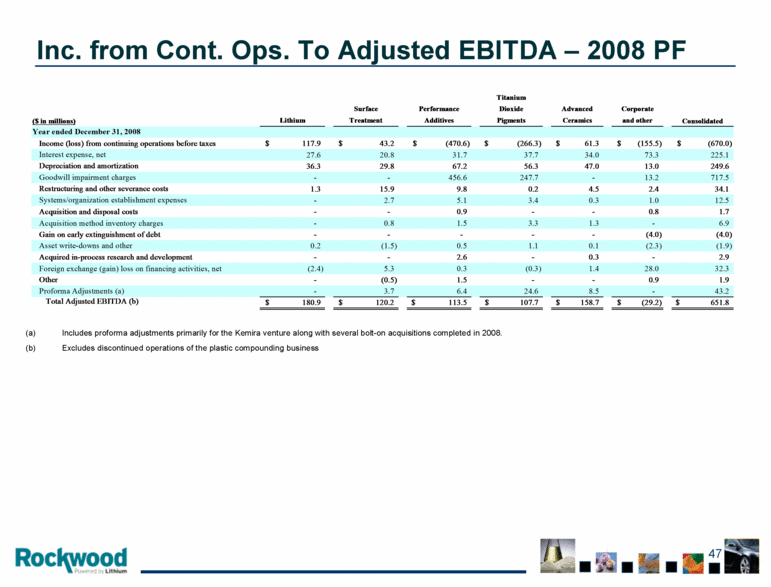
Inc. from Cont. Ops. To Adjusted EBITDA – 2008 (a) PF Includes proforma adjustments primarily for the Kemira venture along with several bolt-on acquisitions completed in 2008. (b) Excludes discontinued operations of the plastic compounding business $ 651.8 $ (29.2) $ 158.7 $ 107.7 $ 113.5 $ 120.2 $ 180.9 Total Adjusted EBITDA (b) 43.2 - 8.5 24.6 6.4 3.7 - Proforma Adjustments (a) 1.9 0.9 - - 1.5 (0.5) - Other 32.3 28.0 1.4 (0.3) 0.3 5.3 (2.4) Foreign exchange (gain) loss on financing activities, net 2.9 - 0.3 - 2.6 - - Acquired in-process research and development (1.9) (2.3) 0.1 1.1 0.5 (1.5) 0.2 Asset write-downs and other (4.0) (4.0) - - - - - Gain on early extinguishment of debt 6.9 - 1.3 3.3 1.5 0.8 - Acquisition method inventory charges 1.7 0.8 - - 0.9 - - Acquisition and disposal costs 12.5 1.0 0.3 3.4 5.1 2.7 - Systems/ organization establishment expenses 34.1 2.4 4.5 0.2 9.8 15.9 1.3 Restructuring and other severance costs 717.5 13.2 - 247.7 456.6 - - Goodwill impairment charges 249.6 13.0 47.0 56.3 67.2 29.8 36.3 Depreciation and amortization 225.1 73.3 34.0 37.7 31.7 20.8 27.6 Interest expense, net $ (670.0) $ (155.5) $ 61.3 $ (266.3) $ (470.6) $ 43.2 $ 117.9 Income (loss) from continuing operations before taxes Year ended December 31, 2008 and other Ceramics Pigments Additives Treatment Lithium Corporate Advanced Dioxide Performance Surface Consolidated Titanium ($ in millions) |
|
|
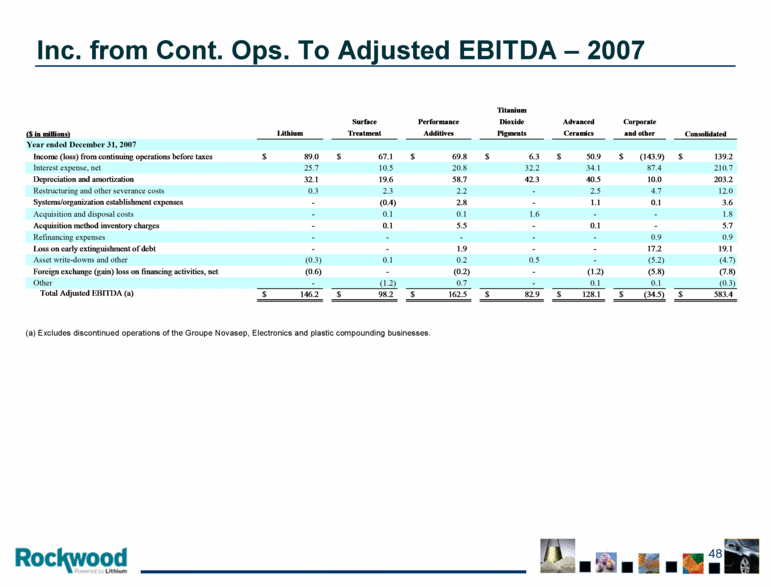
Inc. from Cont. Ops. To Adjusted EBITDA – 2007 (a) Excludes discontinued operations of the Groupe Novasep, Electronics and plastic compounding businesses. $ 583.4 $ (34.5) $ 128.1 $ 82.9 $ 162.5 $ 98.2 $ 146.2 Total Adjusted EBITDA (a) (0.3) 0.1 0.1 - 0.7 (1.2) - Other (7.8) (5.8) (1.2) - (0.2) - (0.6) Foreign exchange (gain) loss on financing activities, net (4.7) (5.2) - 0.5 0.2 0.1 (0.3) Asset write-downs and other 19.1 17.2 - - 1.9 - - Loss on early extinguishment of debt 0.9 0.9 - - - - - Refinancing expenses 5.7 - 0.1 - 5.5 0.1 - Acquisition method inventory charges 1.8 - - 1.6 0.1 0.1 - Acquisition and disposal costs 3.6 0.1 1.1 - 2.8 (0.4) - Systems/ organization establishment expenses 12.0 4.7 2.5 - 2.2 2.3 0.3 Restructuring and other severance costs 203.2 10.0 40.5 42.3 58.7 19.6 32.1 Depreciation and amortization 210.7 87.4 34.1 32.2 20.8 10.5 25.7 Interest expense, net $ 139.2 $ (143.9) $ 50.9 $ 6.3 $ 69.8 $ 67.1 $ 89.0 Income (loss) from continuing operations before taxes Year ended December 31, 2007 and other Ceramics Pigments Additives Treatment Lithium Corporate Advanced Dioxide Performance Surface Consolidated Titanium ($ in millions) |
|
|
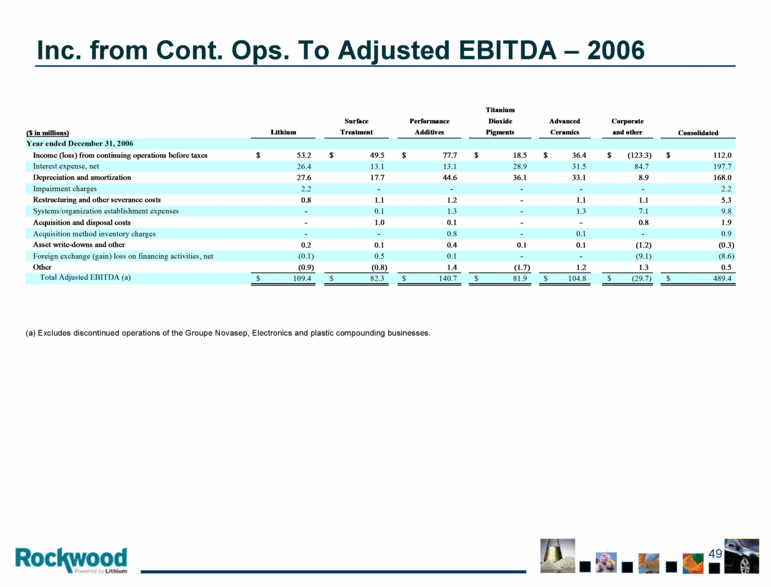
Inc. from Cont. Ops. To Adjusted EBITDA – 2006 (a) Excludes discontinued operations of the Groupe Novasep, Electronics and plastic compounding businesses. $ 489.4 $ (29.7) $ 104.8 $ 81.9 $ 140.7 $ 82.3 $ 109.4 Total Adjusted EBITDA (a) 0.5 1.3 1.2 (1.7) 1.4 (0.8) (0.9) Other (8.6) (9.1) - - 0.1 0.5 (0.1) Foreign exchange (gain) loss on financing activities, net (0.3) (1.2) 0.1 0.1 0.4 0.1 0.2 Asset write-downs and other 0.9 - 0.1 - 0.8 - - Acquisition method inventory charges 1.9 0.8 - - 0.1 1.0 - Acquisition and disposal costs 9.8 7.1 1.3 - 1.3 0.1 - Systems/ organization establishment expenses 5.3 1.1 1.1 - 1.2 1.1 0.8 Restructuring and other severance costs 2.2 - - - - - 2.2 Impairment charges 168.0 8.9 33.1 36.1 44.6 17.7 27.6 Depreciation and amortization 197.7 84.7 31.5 28.9 13.1 13.1 26.4 Interest expense, net $ 112.0 $ (123.3) $ 36.4 $ 18.5 $ 77.7 $ 49.5 $ 53.2 Income (loss) from continuing operations before taxes Year ended December 31, 2006 and other Ceramics Pigments Additives Treatment Lithium Corporate Advanced Dioxide Performance Surface Consolidated Titanium ($ in millions) |
|
|
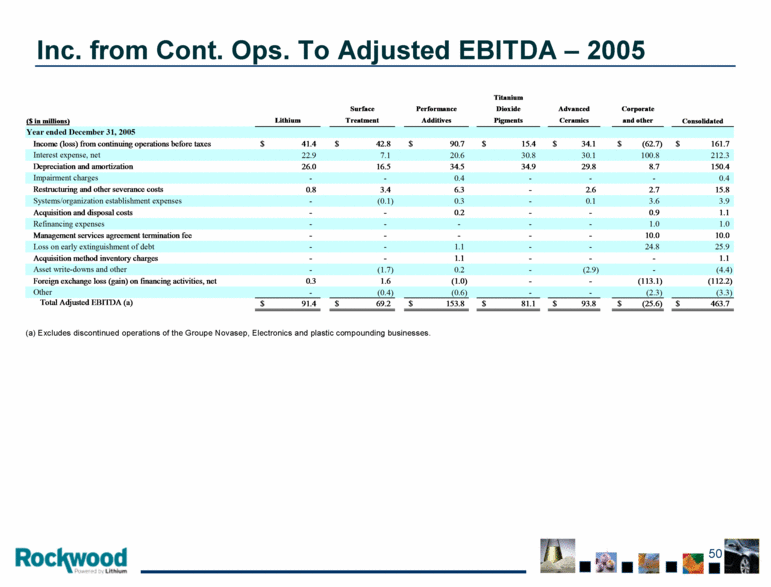
Inc. from Cont. Ops. To Adjusted EBITDA – 2005 (a) Excludes discontinued operations of the Groupe Novasep, Electronics and plastic compounding businesses. $ 463.7 $ (25.6) $ 93.8 $ 81.1 $ 153.8 $ 69.2 $ 91.4 Total Adjusted EBITDA (a) (3.3) (2.3) - - (0.6) (0.4) - Other (112.2) (113.1) - - (1.0) 1.6 0.3 Foreign exchange loss (gain) on financing activities, net (4.4) - (2.9) - 0.2 (1.7) - Asset write-downs and other 1.1 - - - 1.1 - - Acquisition method inventory charges 25.9 24.8 - - 1.1 - - Loss on early extinguishment of debt 10.0 10.0 - - - - - Management services agreement termination fee 1.0 1.0 - - - - - Refinancing expenses 1.1 0.9 - - 0.2 - - Acquisition and disposal costs 3.9 3.6 0.1 - 0.3 (0.1) - Systems/ organization establishment expenses 15.8 2.7 2.6 - 6.3 3.4 0.8 Restructuring and other severance costs 0.4 - - - 0.4 - - Impairment charges 150.4 8.7 29.8 34.9 34.5 16.5 26.0 Depreciation and amortization 212.3 100.8 30.1 30.8 20.6 7.1 22.9 Interest expense, net $ 161.7 $ (62.7) $ 34.1 $ 15.4 $ 90.7 $ 42.8 $ 41.4 Income (loss) from continuing operations before taxes Year ended December 31, 2005 and other Ceramics Pigments Additives Treatment Lithium Corporate Advanced Dioxide Performance Surface Consolidated Titanium ($ in millions) |
|
|
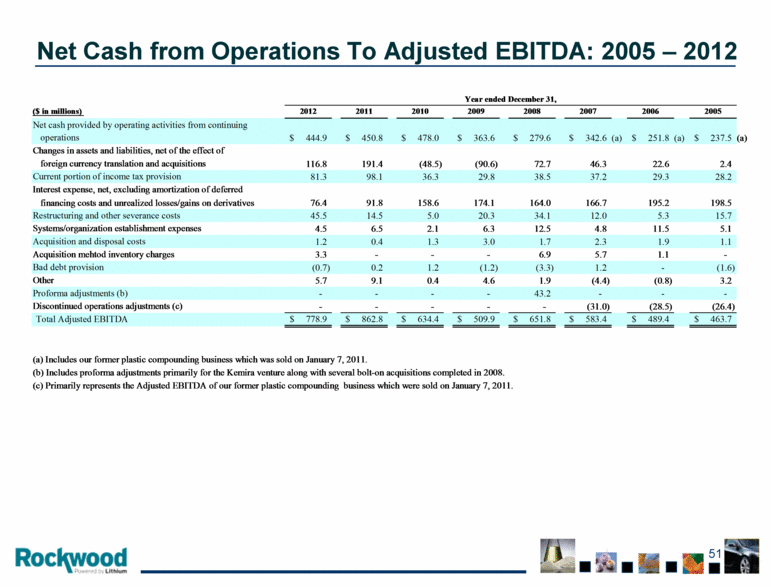
Net Cash from Operations To Adjusted EBITDA: 2005 – 2012 ($ in millions) 2012 2011 2010 2009 2008 2007 2006 2005 Net cash provided by operating activities from continuing operations 444.9 $ 450.8 $ 478.0 $ 363.6 $ 279.6 $ 342.6 $ (a) 251.8 $ (a) 237.5 $ (a) Changes in assets and liabilities, net of the effect of foreign currency translation and acquisitions 116.8 191.4 (48.5) (90.6) 72.7 46.3 22.6 2.4 Current portion of income tax provision 81.3 98.1 36.3 29.8 38.5 37.2 29.3 28.2 Interest expense, net, excluding amortization of deferred financing costs and unrealized losses/gains on derivatives 76.4 91.8 158.6 174.1 164.0 166.7 195.2 198.5 Restructuring and other severance costs 45.5 14.5 5.0 20.3 34.1 12.0 5.3 15.7 Systems/ organization establishment expenses 4.5 6.5 2.1 6.3 12.5 4.8 11.5 5.1 Acquisition and disposal costs 1.2 0.4 1.3 3.0 1.7 2.3 1.9 1.1 Acquisition mehtod inventory charges 3.3 - - - 6.9 5.7 1.1 - Bad debt provision (0.7) 0.2 1.2 (1.2) (3.3) 1.2 - (1.6) Other 5.7 9.1 0.4 4.6 1.9 (4.4) (0.8) 3.2 Proforma adjustments (b) - - - - 43.2 - - - Discontinued operations adjustments (c) - - - - - (31.0) (28.5) (26.4) Total Adjusted EBITDA 778.9 $ 862.8 $ 634.4 $ 509.9 $ 651.8 $ 583.4 $ 489.4 $ 463.7 $ (a) Includes our former plastic compounding business which was sold on January 7, 2011. (b) Includes proforma adjustments primarily for the Kemira venture along with several bolt-on acquisitions completed in 2008. (c) Primarily represents the Adjusted EBITDA of our former plastic compounding business which were sold on January 7, 2011. Year ended December 31, |
|
|
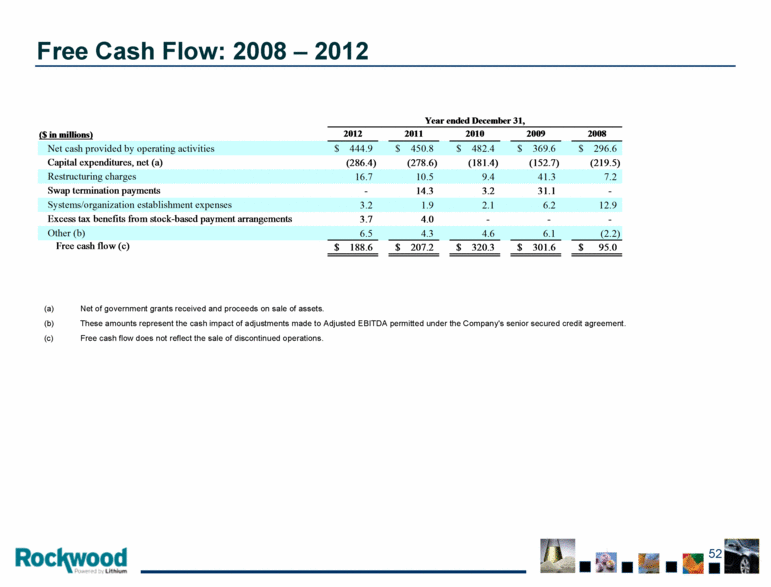
Free Cash Flow: 2008 – 2012 Net of government grants received and proceeds on sale of assets. These amounts represent the cash impact of adjustments made to Adjusted EBITDA permitted under the Company's senior secured credit agreement. Free cash flow does not reflect the sale of discontinued operations. $ 95.0 $ 301.6 $ 320.3 $ 207.2 $ 188.6 Free cash flow (c) (2.2) 6.1 4.6 4.3 6.5 Other (b) - - - 4.0 3.7 Excess tax benefits from stock-based payment arrangements 12.9 6.2 2.1 1.9 3.2 Systems/ organization establishment expenses - 31.1 3.2 14.3 - Swap termination payments 7.2 41.3 9.4 10.5 16.7 Restructuring charges (219.5) (152.7) (181.4) (278.6) (286.4) Capital expenditures, net (a) $ 296.6 $ 369.6 $ 482.4 $ 450.8 $ 444.9 Net cash provided by operating activities 2008 2009 2010 2011 2012 Year ended December 31, ($ in millions) (a) (b) (c) |