Attached files
| file | filename |
|---|---|
| 8-K - FORM 8-K - PUBLIC SERVICE ELECTRIC & GAS CO | d495947d8k.htm |
 PSEG
CHAIRMAN, PRESIDENT AND
CHIEF EXECUTIVE OFFICER
Caroline Dorsa
EXECUTIVE VICE PRESIDENT AND
CHIEF FINANCIAL OFFICER
Kathleen Lally
VICE PRESIDENT,
INVESTOR RELATIONS
Ralph Izzo
EXHIBIT 99 |
 Forward Looking Statement
Readers are cautioned that statements contained in this presentation about our
future performance, including future revenues, earnings, strategies,
prospects, consequences and all other statements that are not purely
historical, are forward- looking statements for purposes of the safe
harbor provisions under The Private Securities Litigation Reform Act of
1995. When used herein, the words “anticipate”,
“intend”, “estimate”, “believe”,
“expect”, “plan”, “should”, “hypothetical”, “potential”,
“forecast”, “project”, variations of such words and similar
expressions are intended to identify forward-looking
statements. Although we believe that our expectations are based on
reasonable assumptions, they are subject to risks and uncertainties and we
can give no assurance they will be achieved. The results or developments
projected or predicted in these statements may differ materially from
what may actually occur. Factors which could cause results or
events to differ from current expectations include, but are not limited
to: •
adverse changes in the demand for or the price of the capacity and energy that
we sell into wholesale electricity markets,
•
adverse changes in energy industry law, policies and regulation, including
market structures and a potential shift away from competitive markets
toward subsidized market mechanisms, transmission planning and cost
allocation rules, including rules regarding how transmission is planned
and who is permitted to build transmission in the future, and
reliability standards, •
any inability of our transmission and distribution businesses to obtain
adequate and timely rate relief and regulatory approvals from federal
and state regulators, •
changes in federal and state environmental regulations that could increase our
costs or limit our operations,
•
changes in nuclear regulation and/or general developments in the nuclear power
industry, including various impacts from any accidents or incidents
experienced at our facilities or by others in the industry, that could
limit operations of our nuclear generating units,
•
actions or activities at one of our nuclear units located on a multi-unit
site that might adversely affect our ability to continue to operate that
unit or other units located at the same site,
•
any inability to balance our energy obligations, available supply and
risks, •
any deterioration in our credit quality or the credit quality of our
counterparties, including in our leveraged leases,
•
availability of capital and credit at commercially reasonable terms and
conditions and our ability to meet cash needs,
•
changes in the cost of, or interruption in the supply of, fuel and other
commodities necessary to the operation of our generating units, delays
in receipt of necessary permits and approvals for our construction and
development activities, •
delays or unforeseen cost escalations in our construction and development
activities,
•
any inability to achieve, or continue to sustain, our expected levels of
operating performance,
•
any equipment failures, accidents, severe weather events or other incidents
that impact our ability to provide safe and reliable service to our
customers, •
increase in competition in energy supply markets as well as competition for
certain rate-based transmission projects,
•
any inability to realize anticipated tax benefits or retain tax credits,
•
challenges associated with recruitment and/or retention of a qualified
workforce, •
adverse performance of our decommissioning and defined benefit plan trust fund
investments and changes in funding requirements, and changes in
technology and customer usage patterns.
For further information, please refer to our Annual Report on Form 10-K,
including Item 1A. Risk Factors, and subsequent reports on Form
10-Q and Form 8-K filed with the Securities and Exchange
Commission. These documents address in further detail our
business, industry issues and other factors that could cause actual results to
differ materially from those indicated in this presentation. In
addition, any forward- looking statements included herein represent
our estimates only as of today and should not be relied upon as
representing our estimates as of any subsequent date. While we
may elect to update forward-looking statements from time to time
3 |
 GAAP Disclaimer
PSEG presents Operating Earnings in addition to its Net Income reported in
accordance with accounting principles generally accepted in the United
States (GAAP). Operating Earnings is a non-GAAP financial
measure that differs from Net Income because it excludes gains or losses
associated with Nuclear Decommissioning Trust (NDT),
Mark-to-Market (MTM) accounting, and other material one-time
items. PSEG presents Operating Earnings because management
believes that it is appropriate for investors to consider results
excluding these items in addition to the results reported in accordance with
GAAP. PSEG believes that the non-GAAP financial measure of
Operating Earnings provides a consistent and comparable measure of
performance of its businesses to help shareholders understand
performance trends. This information is not
intended to be viewed as an alternative to GAAP information.
The last slide in this presentation includes a list of items excluded from
Income from Continuing Operations to reconcile to Operating Earnings,
with a reference to that slide included on each of the slides where the
non-GAAP information appears.
4 |
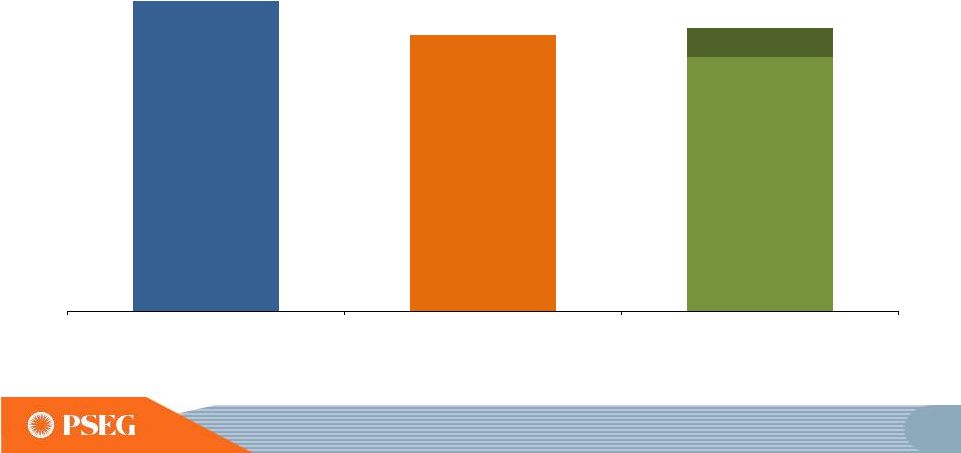 9
2013 Operating Earnings Guidance
$2.74
$2.44
$2.25 -
$2.50 E
2011 Operating Earnings*
2012 Operating Earnings*
2013 Guidance
* SEE PAGE A FOR ITEMS EXCLUDED FROM INCOME FROM CONTINUING
OPERATIONS TO RECONCILE TO OPERATING
EARNINGS. E = ESTIMATE. |
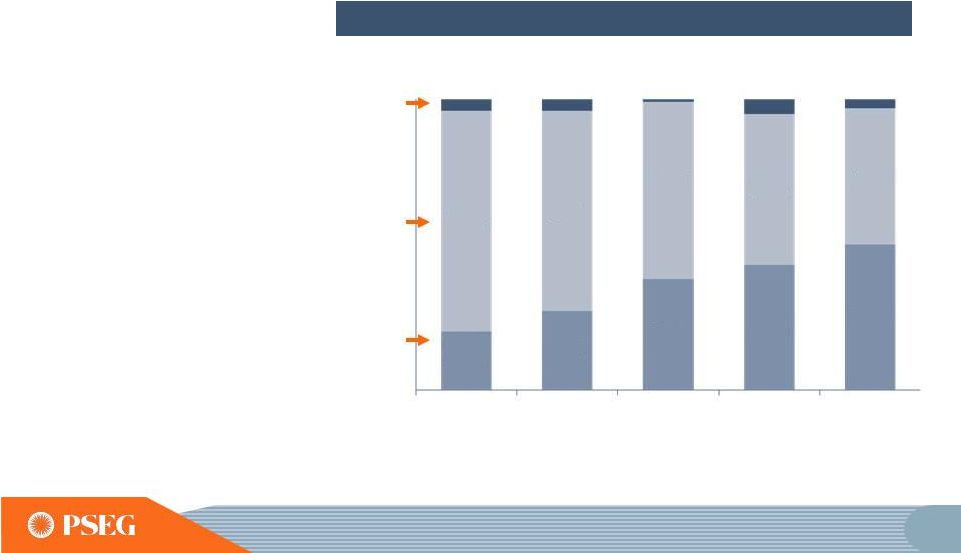 10
2013 Operating Earnings
*
*SEE PAGE A FOR ITEMS EXCLUDED FROM INCOME FROM CONTINUING OPERATIONS TO
RECONCILE TO OPERATING EARNINGS; ALL PERIODS REFLECT TEXAS IN
DISCONTINUED OPERATIONS. E = ESTIMATE. Investment in the
regulated business
has changed the
earnings mix
Our 2009-2013
investment focus has
brought us to a 50/50
mix for 2013
PSE&G’s 2013-2017
Energy Strong Program
and ongoing transmission
investments will support
continued growth in
PSE&G’s earnings
Percent of Operating Earnings Contribution by Subsidiary
PSE&G
Power
Other
$2.74
$2.44
$2.25 -$2.50E
$3.09
$3.12
69%
61%
52%
47%
76%
20%
27%
38%
43%
50%
2013E
2012
2011
2010
2009 |
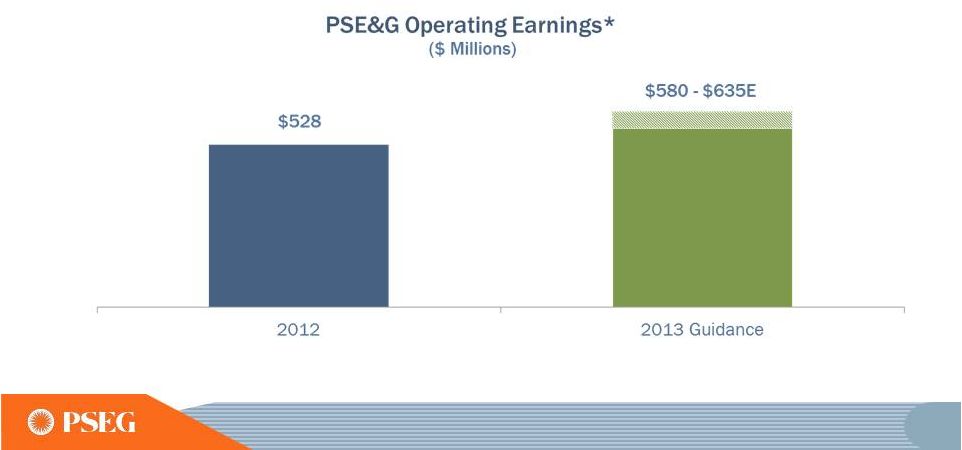 47
PSE&G’s 2013 operating earnings
is benefiting from transmission growth and
cost containment initiatives
E= ESTIMATE
*SEE SLIDE A FOR ITEMS EXCLUDED FROM INCOME FROM CONTINUING OPERATIONS TO
RECONCILE TO OPERATING EARNINGS. |
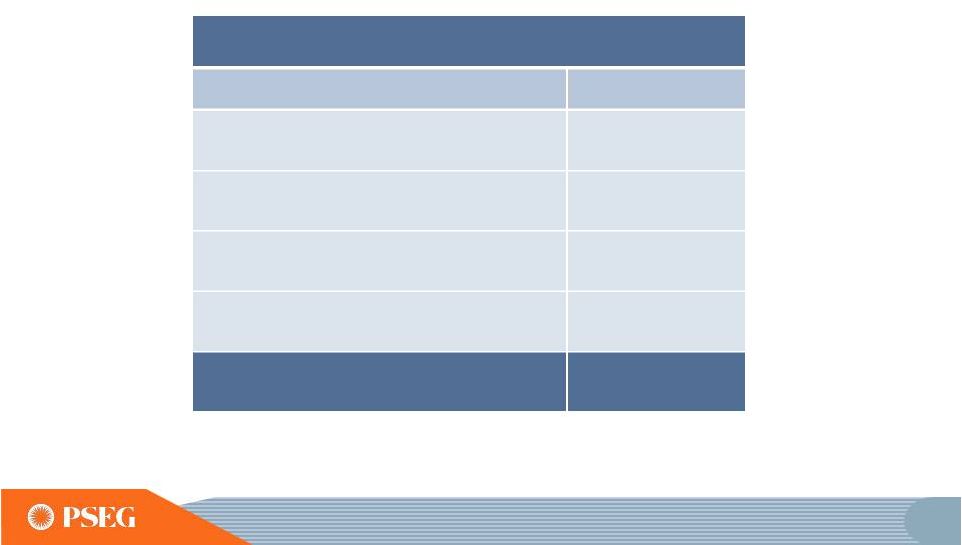 89
2013 guidance in same range as 2012
PSEG Operating Earnings
$ Millions (except EPS)
2013E
PSEG Power
$535 -
$600
PSE&G
$580 -
$635
PSEG Energy Holdings/Parent
$25 -
$35
Operating Earnings*
$1,140 -
$1,270
2013 Earnings Guidance
$2.25
-
$2.50
E = ESTIMATE
*SEE SLIDE A FOR ITEMS EXCLUDED FROM INCOME FROM CONTINUING OPERATIONS TO
RECONCILE TO OPERATING EARNINGS. |
 102
PSEG Summary
•
Operating
Earnings
Guidance
for
2013
of
$2.25
-
$2.50
per
share
with earnings mix shifting to 50% regulated
•
Double digit operating earnings growth at PSE&G starting in 2013,
and continuing through 2015 driven by transmission investments
and approved programs
•
Power’s continued focus on operational excellence, market expertise
and financial strength reduces risk in low price environment
•
Strong Balance Sheet and Cash Flow support full capital program
without the need for equity
•
Long history of returning cash to the shareholder through the common
dividend, with opportunity for further growth |
 104
Full-year Operating Earnings by
Subsidiary
Operating Earnings
Earnings per Share
$ millions (except EPS)
2012
2011
2012
2011
PSEG Power
$ 644
$ 845
$ 1.27
$ 1.67
PSE&G
528
521
1.04
1.03
PSEG Energy Holdings/
Enterprise
64
23
0.13
0.04
Operating Earnings*
$ 1,236
$ 1,389
$ 2.44
$ 2.74
Twelve Months ended December 31
•See Page A for Items excluded from Income from Continuing Operations to
reconcile to Operating Earnings. |
 105
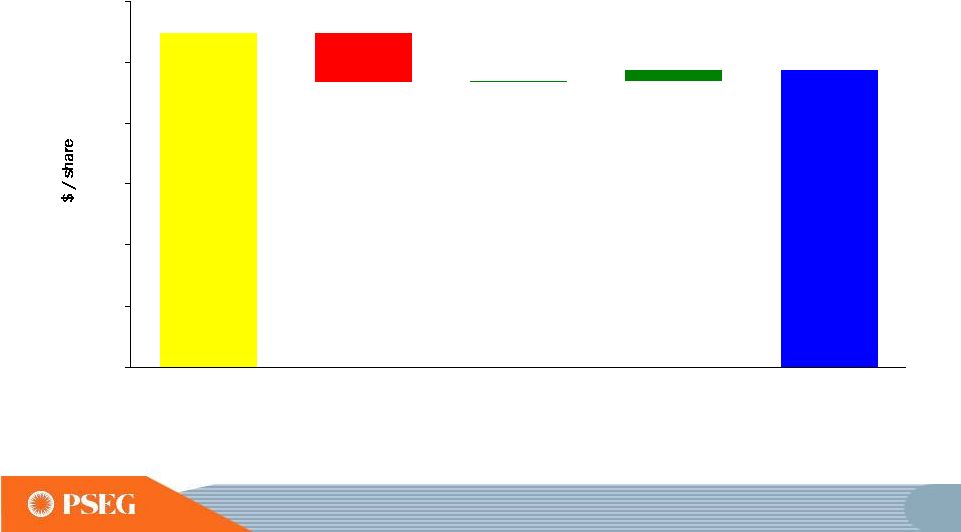
$2.74
.01
.09
$2.44
(.40)
0.00
0.50
1.00
1.50
2.00
2.50
3.00
PSEG EPS Reconciliation –
Full-year
2012 versus Full-year 2011
Lower Pricing (.40)
Lower Volume (.03)
O&M .05
Financing Costs .03
Lower
Coal Sales
& Other (.05)
Transmission .10
Distribution (.03)
Non-Storm O&M (.09)
Storm (.02)
Weather .01
D&A (.03)
Tax
Settlement & Other .04
Other Income
(Including AFUDC) .03
2012
Operating
Earnings*
2011
Operating
Earnings*
PSEG Power
PSE&G
PSEG Energy
Holdings/
Enterprise
Tax
Settlement .08
Solar
Investments .02
Lower Lease
Revenues &
Other (.01)
* See Page A for Items excluded from Income from Continuing Operations to
reconcile to Operating Earnings. |
 Items Excluded from Income from
Continuing Operations to Reconcile to Operating Earnings
A
PLEASE SEE PAGE 4 FOR AN EXPLANATION OF PSEG’S USE OF OPERATING
EARNINGS AS A NON-GAAP FINANCIAL MEASURE AND HOW IT DIFFERS FROM NET
INCOME. 2012
2011
2010
2009
2008
Earnings
Impact
($
Millions)
Gain (Loss) on Nuclear Decommissioning Trust (NDT)
Fund Related Activity (PSEG Power)
52
$
50
$
46
$
9
$
(71)
$
Gain (Loss) on Mark-to-Market (MTM) (PSEG Power)
(10)
107
(1)
(11)
14
Lease Transaction Activity (Energy Holdings)
36
(173)
-
29
(490)
Storm O&M (PSEG Power)
(39)
-
-
-
-
Market Transition Charge Refund (PSE&G)
-
-
(72)
-
-
Gain (Loss) on Asset Sales and Impairments (Energy Holdings)
-
34
-
-
(13)
Total Pro-forma adjustments
39
$
18
$
(27)
$
27
$
(560)
$
Fully Diluted Average Shares Outstanding (in Millions)
507
507
507
507
508
Per
Share
Impact
(Diluted)
Gain (Loss) on NDT Fund Related Activity (PSEG Power)
0.10
$
0.10
$
0.09
$
0.02
$
(0.14)
$
Gain (Loss) on MTM (PSEG Power)
(0.02)
0.21
-
(0.02)
0.03
Lease TransactionActivity (Energy Holdings)
0.07
(0.34)
-
0.05
(0.96)
Storm O&M (PSEG Power)
(0.08)
-
-
-
-
Market Transition Charge Refund (PSE&G)
-
-
(0.14)
-
-
Gain (Loss) on Asset Sales and Impairments (Energy Holdings)
-
0.06
-
-
(0.03)
Total Pro-forma adjustments
0.07
$
0.03
$
(0.05)
$
0.05
$
(1.10)
$
For the Year Ended
December 31,
Reconciling
Items
Excluded
from
Continuing
Operations
to
Compute
Operating
Earnings
(Unaudited)
Pro-forma Adjustments, net of tax |