Attached files
| file | filename |
|---|---|
| 8-K - FORM 8-K - HOLOGIC INC | d495775d8k.htm |
 Presentation to Lenders
March 5, 2013
Exhibit 99.1 |
 Forward-Looking Statements
2
This presentation contains forward-looking information that involves risks and uncertainties,
including statements about the Company’s plans, objectives, expectations and intentions.
Such statements include, without limitation: financial or other information included herein based upon or otherwise incorporating
judgments or estimates relating to future performance, events or expectations; the anticipated
benefits of the Gen-Probe acquisition, including anticipated synergies; the expected timing
of the completion of the Company's LIFECODES' sale; the anticipated timing of a reimbursement code for 3D tomosynthesis and
any other governmental or regulatory approvals or clearances; and the Company's outlook and financial
and other guidance. These forward-looking statements are based upon assumptions made by the
Company as of the date hereof and are subject to known and unknown risks and uncertainties that could cause actual
results to differ materially from those anticipated.
Risks and uncertainties that could adversely affect the Company’s business and prospects, and
otherwise cause actual results to differ materially from those anticipated, include without
limitation: U.S., European and general worldwide economic conditions and related uncertainties; the Company’s reliance on third-party
reimbursement policies to support the sales and market acceptance of its products, including the
possible adverse impact of government regulation and changes in the availability and amount of
reimbursement and uncertainties for new products or product enhancements; uncertainties regarding the recently enacted or
future healthcare reform legislation, including associated tax provisions, or budget reduction or
other cost containment efforts; changes in guidelines, recommendations and studies published by
various organizations that could affect the use of the Company’s products; uncertainties inherent in the development of
new products and the enhancement of existing products, including FDA approval and/or clearance and
other regulatory risks, technical risks, cost overruns and delays; the risk that products may
contain undetected errors or defects or otherwise not perform as anticipated; risks associated with acquisitions, including without
limitation, the Company’s ability to successfully integrate acquired businesses, the risks that
the acquired businesses may not operate as effectively and efficiently as expected even if
otherwise successfully integrated, the risks that acquisitions may involve unexpected costs or unexpected liabilities, including the risks and
challenges associated with the Company’s recent acquisition of Gen-Probe and operations in
China; the risk that prospective acquisitions or dispositions may not close when anticipated,
if at all, including as a result of failure to fulfill conditions closing, obtaining the necessary regulatory approvals or clearances, or otherwise;
manufacturing risks, including the Company’s reliance on a single or limited source of supply for
key components, and the need to comply with especially high standards for the manufacture of
many of its products; the Company’s ability to predict accurately the demand for its products, and products under development,
and to develop strategies to address its markets successfully; the early stage of market development
for certain of the Company’s products; the Company’s leverage risks, including the
Company’s obligation to meet payment obligations and financial covenants associated with its debt; risks related to the use and
protection of intellectual property; expenses, uncertainties and potential liabilities relating to
litigation, including, without limitation, commercial, intellectual property, employment and
product liability litigation; technical innovations that could render products marketed or under development by the Company obsolete; competition;
the risks of conducting business internationally, including the effect of exchange rate fluctuations
on those operations; and the Company’s ability to attract and retain qualified personnel.
The risks included above are not exhaustive. Other factors that could adversely affect the combined
company's business and prospects are described in the filings made by the Company with the SEC.
The Company expressly disclaims any obligation or undertaking to release publicly any updates or revisions to any such
statements presented herein to reflect any change in expectations or any change in events, conditions
or circumstances on which any such statements are based. Hologic, APTIMA, Dimensions, Gen-Probe, LIFECODES, PANTHER, Prodesse ProGastro SSCS and TIGRIS and
associated logos, as may be used throughout this presentation, are trademarks and/or registered
trademarks of Hologic, Inc. and/or its subsidiaries in the United States and/or other countries.
|
 Transaction Overview
¹
See the definition of non-GAAP financial measures and the reconciliation of
GAAP to non-GAAP in the Appendix. 3
Hologic, Inc. ("Hologic" or "the Company") (NASDAQ: HOLX) is a
leading developer, manufacturer and supplier of premium diagnostics
products, medical imaging systems and surgical products dedicated to serving
the healthcare needs of women Hologic has continued to demonstrate strong
financial performance Hologic is seeking to reprice its Revolver and Term
Loan A pricing In conjunction with the repricing, the Company is seeking an
amendment to certain other provisions of the Credit Agreement
For the LTM period ended December 29, 2012, the Company generated $2,186 million
of non- GAAP revenue, $761 million of Adjusted EBITDA and $980 million
of Consolidated Adjusted EBITDA as defined in the Credit Agreement. The
Company's GAAP Revenue and GAAP net Hologic has total secured
leverage of 2.5x and net total leverage of 4.9x 1
loss for the same LTM period were $2,161 million and $91 million,
respectively |
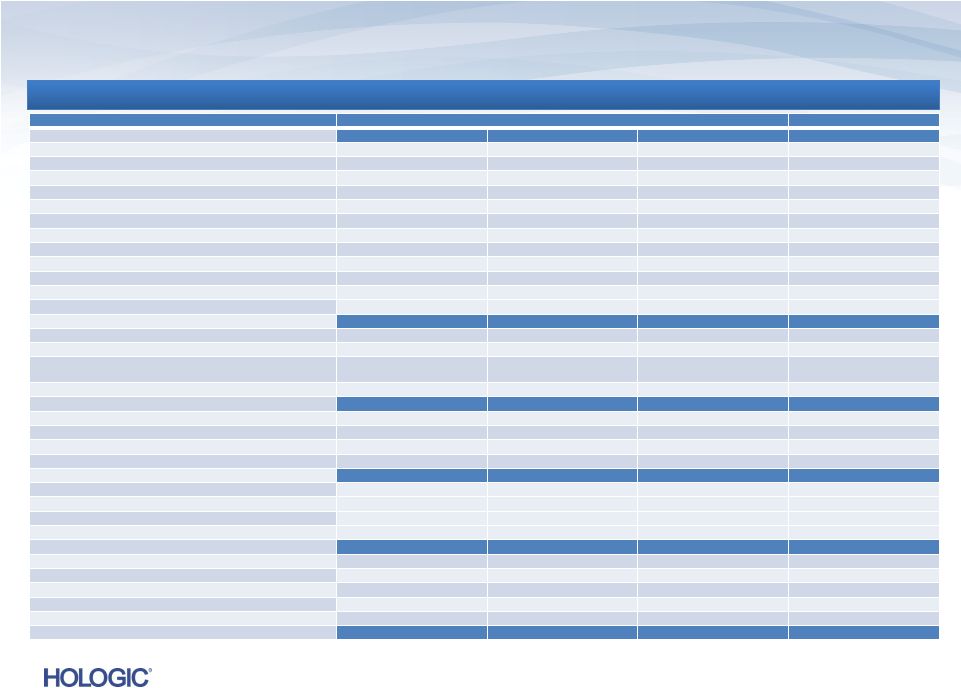
 Pro
Forma Capitalization 4
Leverage
Current
CCR: B1 / BB
Amount
Coupon
Floor
Cash
$718.5
Revolver ($300)
-
L+300
-
Term Loan A
979.7
L+300
-
Term Loan B
1,482.0
L+350
1.00%
Total Secured Debt
2,461.7
2.5 x
Senior Unsecured Notes
1,000.0
6.25%
Total Guaranteed Debt
3,461.7
3.5 x
2.00%
Convertible
Sr.
Notes
(1)
734.5
2.00%
2.00%
Exchange
Convertible
Sr.
Notes
(2)
379.8
2.00%
2.00%
Exchange
Convertible
Sr.
Notes
(3)
460.0
2.00%
Total Debt
5,036.0
5.1 x
Net
Debt
(4)
4,786.0
4.9 x
LTM
12/29/12
Consolidated
Adjusted EBITDA
(5)
$ 980.0
Maturity
Put Date
Aug-17
Aug-17
Aug-19
Aug-20
Dec-37
Dec-13
Dec-37
Dec-16
Mar-42
Mar-18
Amounts as of December 29, 2012
($ in millions)
Source: Public filings
¹
Principal amount is $775 million. Principal amount listed net of the unamortized discount. Conversion
price of approximately $38.59 per share. Effective 02/21/2013, the
Company retired $370 million of notes due 2037 in exchange for $370 million of new notes due
2043. Leverage ratios could change once the accounting for the exchange
is completed.
²
Principal amount is $450 million. Principal amount listed net of the unamortized discount.
Conversion price of approximately $23.03 per share.
³ Principal amount is $500 million. Principal amount listed net of the unamortized
discount. Conversion price of approximately $31.18 per share.
4
Debt net of $250 million of cash as permitted by Credit Agreement for covenant compliance.
As defined in the Credit Agreement. Includes an increase to the Company’s non-GAAP Adjusted
EBITDA of $219 million, as calculated pursuant to the terms of the Credit Agreement, to
reflect the Company's acquisition of Gen-Probe and certain other adjustments.
|
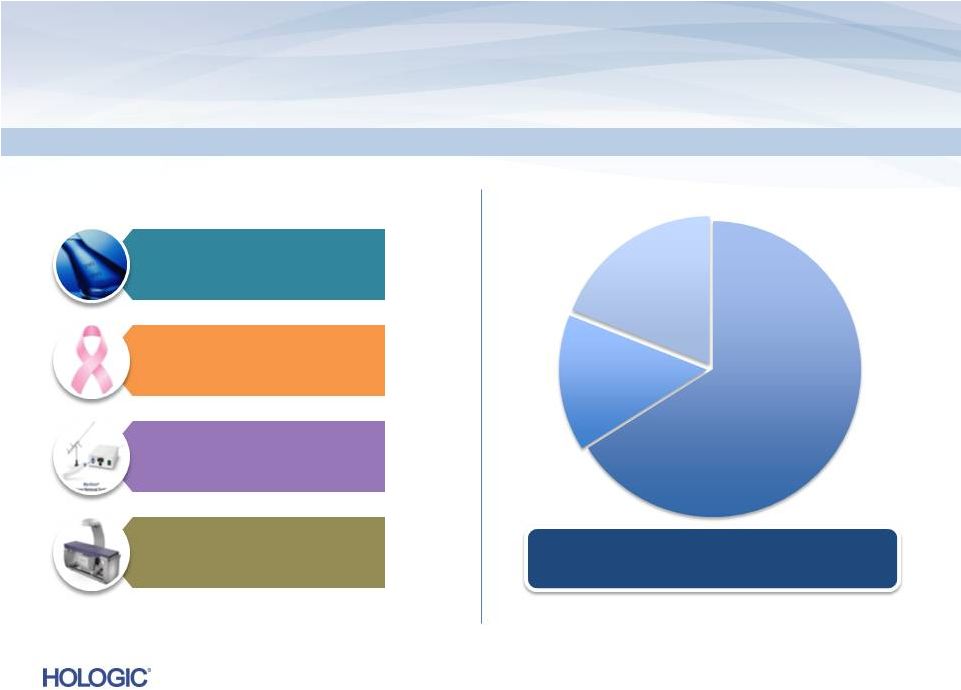 Non-GAAP
Adjusted
Q1’13
Revenues
of
$644.6M
(unaudited)
Consumables/Service ~81%
Capital Equipment ~19%
Consumables/Service ~81%
Capital Equipment ~19%
Total Diagnostics $319.2M*
49%
Breast Health $220.8M
34%
GYN Surgical $80.9M
13%
Skeletal Health $23.7M
4%
* See the definition of non-GAAP financial measures and the reconciliation of
GAAP to non-GAAP in the Appendix. Total Revenues by Business Segment
5
Consumables
$427.9
Service
$96.2M
Capital
$120.5M
Consolidated |
 Business and Product Update
PANTHER launch progressing smoothly with positive early traction
FDA
approval
of
APTIMA
16
18/45
Genotype
Assay
for
use
on
TIGRIS
announced
on
October 16, 2012
Definitive agreement announced on January 3, 2013 to sell the Company’s
LIFECODES business to Immucor, Inc. for $85 million in cash, subject to
certain adjustments, and $10 million in a potential contingent payment
FDA clearance of APTIMA Trichomonas vaginalis Assay for use on our
fully-automated PANTHER System announced on January 14, 2013
FDA clearance of Prodesse ProGastro SSCS assay, a real-time multiplex
polymerase chain reaction (PCR) in vitro diagnostic test for the
qualitative detection of the most common bacterial pathogens associated
with gastroenteritis Oslo
study
published
on
January
7,
2013,
in
Radiology,
reporting
that
the
addition
of
the
Company’s 3D mammography screening technology to a 2D breast screening exam
significantly increased cancer detection while reducing the number of false
positives 6
—
Expected to close in Q2 FY 2013 |
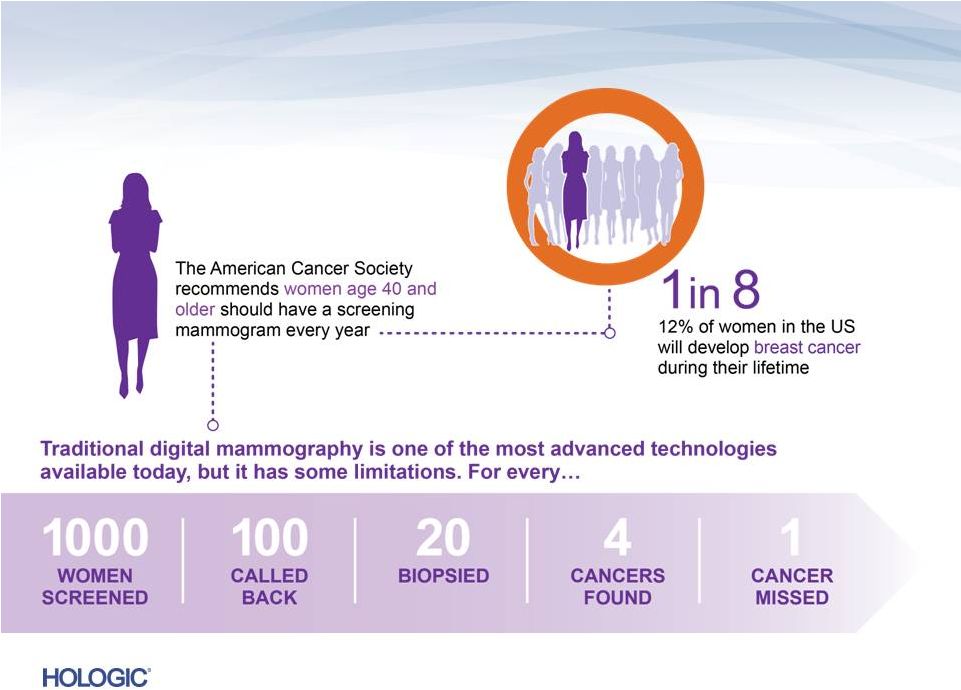 Advancing Breast Cancer Screening
7 |
 8
3D Dimensions Tomosynthesis
Superior
Next-Generation
Digital
Mammography
Superiority
Superiority
over 2D Digital
over 2D Digital
Mammography
Mammography
Improved
Tissue
Visualization
and Detection
Lower
Recall Rates
8
Tomosynthesis…uptake ahead of expectations
•
U.S.
installed
base
of
~
11,000
digital
systems
–
potential
for
conversion
to
Tomo
•
On track to ship 500 to 700 units within first two years of approval
(by end of fiscal Q2’13)
•
Expect to double installed base during FY’13 |
 Tomosynthesis Clinical Efficacy
Oslo Tomosynthesis Screening Trial
reported breast cancer screening
with Hologic’s Tomosynthesis significantly
improves
cancer
detection
•
All
age
groups
and
breast
densities
benefit
from
the
addition
of
Hologic’s
Tomosynthesis
screening
1
•
Body of clinical evidence continuing to grow
Compared to 2D, U.S. sites report a
significant reduction in recalls with
Hologic’s
tomosynthesis
9
1
2-3
in invasive
cancer detection
40%
overall in
cancer detection
27%
20-40% reduction
in recall rates
(based on site practices)
1
2
3
Skaane P. et. al. Comparison of Digital Mammography Alone and Digital Mammography
Plus Tomosynthesis in a Population-based Screening Program. Radiology. 2013 Jan 7
(published electronically).
Philpotts
L.
et
al.
Initial
Experience
With
Digital
Breast Tomosynthesis
in
Screening
Mammography.
Presented
at
the
ARRS
2012,
Scientific
Session
22
-
Breast
Imaging:
Screening/Emerging Technologies.
Destounis S. et al. Experience with Combination 2D/3D Breast Tomosynthesis vs
FFDM in the Screening Environment. Radiological Society of North America annual meeting.
Chicago, Il, 2012. |
 Q1
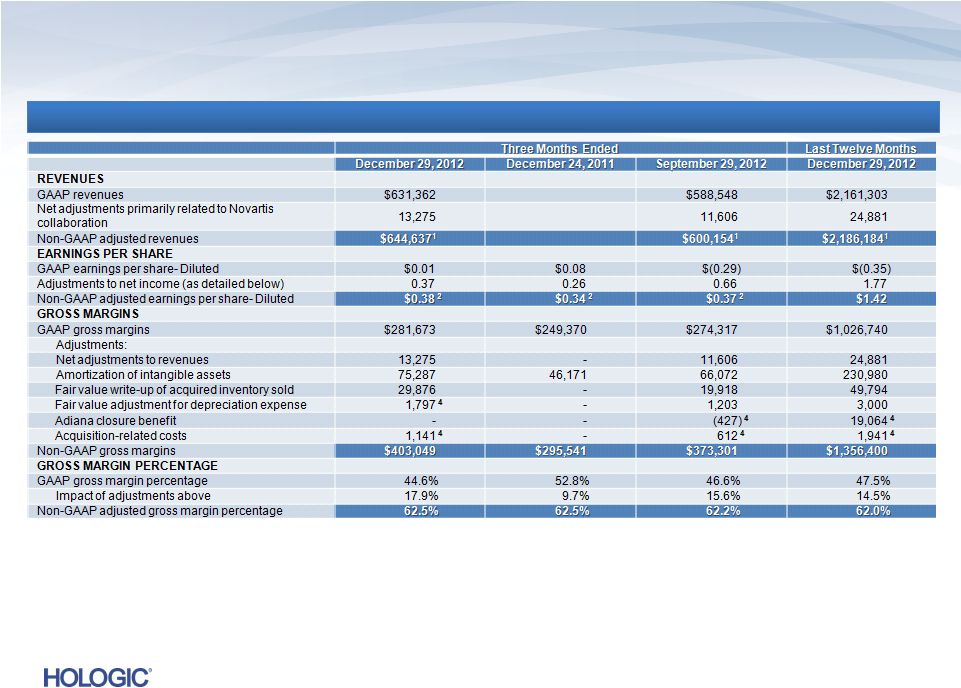
2013 Financial Results Consolidated non-GAAP adjusted revenues were
$644.6 million, a year-over-year increase of $171.9 million, or
36.4%, and at the high-end of our guidance range of $640 to
$645
million.
The
Company's
GAAP
revenues
for
the
same
period
were
$631.4
million
1
Non-GAAP adjusted EPS was $0.38, a year-over-year increase of $0.04,
or 11.8%, and exceeded our guidance of $0.37. The Company's GAAP EPS for
the same period was $0.01
1
Year-over-year growth in each of our three primary business segments
On track to achieve over $40 million in first-year cost synergies
related to the Gen-Probe acquisition
Cash and equivalents totaled $721 million, up $154 million from the end of fiscal
2012 reflecting
another
quarter
of
focused
working
capital
management
and
solid
operational
results, both of which contributed to strong free cash flow generation
¹
See the definition of non-GAAP financial measures and the reconciliation of
GAAP to non-GAAP in the Appendix. 10
—
Reinstatement of federal research tax credit added $0.01 to non-GAAP adjusted
EPS |
 Key
Performance Metrics Q1 FY 2013
Revenues
GAAP revenues of $631.4 million and non-GAAP
revenues of $644.6 million
Net Income
GAAP net income of $3.1 million and
non-GAAP net income of $101.8 million
Adjusted EBITDA
$227.5 million
Quarter Ended December 29, 2012 (unaudited)
1
On a constant currency basis, total revenues would have increased to
$631.7M*, or 33.6% (non-GAAP revenues would have increased to $645.0M*, or 36.4%) compared to
Q1’12. The constant currency revenue amount for Q1’13 is a non-GAAP
number that reflects what revenues in that quarter would have been had the Company applied the foreign
currency exchange rates it used for determining its revenues in Q1’12.
See the definition of non-GAAP financial measures and the reconciliation of
GAAP to non-GAAP in the Appendix. Q1 FY 2013 Overview
11
•
Non-GAAP
revenues
up
$171.9
million,
or
36.4%,
vs.
Q1’12
1
•
Non-GAAP revenues up $44.5 million, or 7.4%, vs. Q4’12
•
Non-GAAP net income up $11.7 million, or 13.0%, vs. Q1’12
•
Non-GAAP net income up $3.4 million, or 3.5%, vs. Q4’12
•
Up $65.2 million, or 40.2%, vs. Q1’12
•
Up $17.5 million, or 8.3%, vs. Q4’12 |
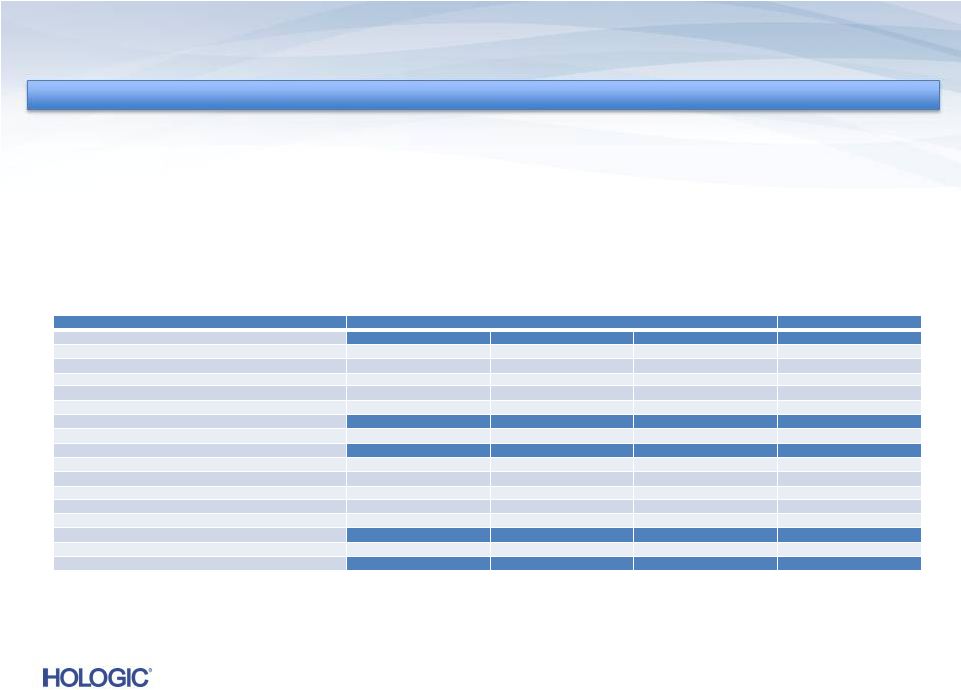
 Fiscal 2013 Guidance
Non-GAAP
*
$s in millions
(except EPS)
FY 2013
FY 2013
(Guidance)*
(Guidance)*
Q2 2013
Q2 2013
(Guidance) *
(Guidance) *
Revenues
Revenues
$2,610 –
$2,610 –
$2,640
$2,640
$635 –
$635 –
$640
$640
Gross Margins
Gross Margins
63.0%
63.0%
62.5% –
62.5% –
63.0%
63.0%
Operating Expenses
Operating Expenses
$785 –
$785 –
$810
$810
$205 –
$205 –
$210
$210
Interest Expense
Interest Expense
$220
$220
$56
$56
Diluted EPS
Diluted EPS
$1.58 –
$1.58 –
$1.60
$1.60
$0.33 -
$0.33 -
$0.34
$0.34
Quarter Ending March 30, 2013 and Year Ending September 28, 2013
12
Note: Estimate diluted shares outstanding of approximately 271 million and 272 million for Q2’13
and FY 2013, respectively. Estimate a 32% annual effective tax rate.
* See the definition of non-GAAP financial measures and discussion of future non-GAAP
adjustments in the Appendix. |
 Balance Sheet & Debt Paydown Road Map
Focus on de-leveraging
—
Total
debt
obligations
of
$5.0
billion,
including
$3.5
billion
borrowed
for
acquisition
of Gen-Probe
—
Goal to reduce total debt to EBITDA from approximately 5.1x to 2.5x during the
three-year period post-acquisition (down to 4.5x at the end of
Q1’13) Expect to generate $600 million in free cash flow in
FY’13 Debt paydown roadmap
—
Initial focus on $405 million tranche of our convertible notes putable in December
2013
—
$65 million in scheduled payments for Term Loan A and Term Loan B in
FY’13 —
Build cash through FY’13 and FY’14, then focus on paying down remaining
Gen- Probe-related debt
13 |
 Amendment Overview
Hologic is seeking to reprice its Revolver and Term Loan A
In addition, the amendment would make certain other changes in the Credit
Agreement, including: 14
—
Allow the Company to purchase or repurchase its Convertible Notes during the
eighteen months prior to their respective put dates and at any such time
such Convertible Notes are otherwise callable, subject to no event of
default and pro forma covenant compliance —
Modify the Asset Sale covenant general basket to remove the transaction and annual
caps on asset sales
—
Allow unsecured debt to be assumed as part of a Permitted Acquisition, subject to
no event of default and pro forma covenant compliance
|
 |
 In
thousands, except earnings per share In thousands, except earnings per
share Continued on next page
Reconciliation of GAAP to Non-GAAP (unaudited)
16 |
 In
thousands, except earnings per share In thousands, except earnings per
share Three Months Ended
Three Months Ended
Last Twelve Months
Last Twelve Months
December 29, 2012
December 29, 2012
December 24, 2011
December 24, 2011
September 29, 2012
September 29, 2012
December 29, 2012
December 29, 2012
OPERATING EXPENSES
GAAP operating expenses
$218,444
$182,611
$318,020
$916,553
Adjustments:
Amortization of intangible assets
(28,526)
(14,842)
(24,832)
(85,720)
Contingent consideration
(39,526)
(15,563)
(40,399)
(143,460)
Acquisition-related costs
(4,380)
4
(913)
4
(37,901)
4
(47,772)
4
Restructuring costs
(3,933)
91
(16,697)
(21,060)
Goodwill impairment
-
-
(5,826)
(5,826)
Gain on sale of intellectual property, net
53,884
-
-
66,308
In-process research and development
-
-
(4,500)
(4,500)
Fair value adjustment for depreciation expense
(892)
4
-
(1,300)
4
(2,192)
4
Other gains (charges)
3,200
-
(2)
2,269
Non-GAAP adjusted net operating expenses
$198,271
$198,271
$151,384
$151,384
$186,563
$186,563
$674,600
$674,600
INTEREST EXPENSE, NET
GAAP interest expense
$72,081
$29,509
$56,673
$182,859
Adjustment for non-cash interest expense relating to
convertible notes
(15,644)
(18,953)
(16,514)
(65,223)
Other interest expense
-
(171)
-
(357)
Non-GAAP interest expense, net
$56,437
$56,437
$10,385
$10,385
$40,159
$40,159
$117,279
$117,279
PRE-TAX (LOSS) INCOME
GAAP pre-tax (loss) income
$(7,353)
$39,904
$(97,964)
$(108,918)
Adjustments to pre-tax (loss) income as detailed above
157,193
96,522
246,955
637,193
Other gains
(167)
-
-
(167)
Non-GAAP pre-tax income
$149,673
$149,673
$136,426
$136,426
$148,991
$148,991
$570,455
$570,455
NET INCOME (LOSS)
GAAP net income (loss)
$3,118
$20,812
$(77,767)
$(91,328)
Adjustments to pre-tax (loss) income as detailed above
157,026
96,522
246,955
679,373
Income tax effect of reconciling items
(58,366) ³
(27,293) ³
(70,854) ³
(208,551)
Non-GAAP adjusted net income
$101,778
$101,778
$90,041
$90,041
$98,334
$98,334
$379,494
$379,494
EBITDA
Non-GAAP adjusted net income
$101,778
$90,041
$98,334
$379,494
Interest expense, net, not adjusted above
56,177
9,723
39,766
115,341
Provision for income taxes
47,895
46,385
50,657
190,961
Depreciation expense, not adjusted above
21,653
16,110
21,241
74,891
Adjusted EBITDA
$227,503
$227,503
$162,259
$162,259
$209,998
$209,998
$760,687
$760,687
Reconciliation of GAAP to Non-GAAP (unaudited)
Continued on next page
17 |
 Reconciliation
of
GAAP
to
Non-GAAP
(unaudited)
Footnotes:
1
To primarily reflect a fair value adjustment recorded in purchase accounting
relating to contingent revenue earned and received under the Novartis
collaboration post acquisition, which was eliminated under purchase accounting.
2
Non-GAAP adjusted earnings per share was calculated based on: 269,379; 264,958;
and 268,106 weighted average diluted shares outstanding for the three months
ended December 29, 2012, December 24, 2011, and September 29, 2012,
respectively. 3
To reflect an annual effective tax rate of 32.0%, 34.0% and 34.0% on a non-GAAP
basis for the three months ended December 29, 2012, December 24, 2011, and
September 29, 2012, respectively. 4
The breakdown of this expense by P&L line item is as follows:
18
In thousands, except tax rates
In thousands, except tax rates
Three Months Ended
Three Months Ended
Last Twelve Months
Last Twelve Months
December 29, 2012
December 29, 2012
December 24, 2011
December 24, 2011
September 29, 2012
September 29, 2012
December 29, 2012
December 29, 2012
Acquisition-related costs
R&D
$1,253
-
$805
$2,291
S&M
770
-
691
1,495
G&A
2,357
$913
36,405
43,986
Total OpEx
$4,380
$913
$37,901
$47,772
COGS
1,141
-
612
1,941
Total Adjustment
$5,521
$913
$38,513
$49,713
Fair value adjustment for depreciation expense
R&D
$439
-
$293
$732
S&M
66
-
44
110
G&A
387
-
963
1,350
Total OpEx
$892
-
$1,300
$2,192
COGS
1,797
-
1,203
3,000
Total Adjustment
$2,689
-
$2,503
$5,192 |
 Use
of Non-GAAP Financial Measures 19
Hologic has presented the following non-GAAP financial measures in this presentation: adjusted
revenues; adjusted gross margins; adjusted operating expenses; adjusted operating income;
adjusted interest expense; adjusted pre-tax income; adjusted net income; adjusted EPS; and
adjusted EBITDA. Hologic defines adjusted EBITDA as its non-GAAP adjusted net income plus interest
expense, net, income taxes, and depreciation and amortization expense included in its
non-GAAP adjusted net income. Hologic defines its non-GAAP adjusted revenues to
primarily include contingent revenue earned under the Novartis collaboration post-acquisition
which was eliminated under purchase accounting. Hologic defines its non-GAAP adjusted gross
margins, adjusted operating expenses, adjusted operating income, adjusted interest expense,
adjusted pre-tax income and adjusted EPS to exclude, as applicable: (i) the amortization of
intangible assets; (ii) acquisition-related charges and effects, such as charges for
contingent consideration (comprised of (a) adjustments for changes in the fair value of the contingent consideration
liabilities initially recorded as part of the purchase price of an acquisition as required by GAAP,
and (b) contingent consideration that is tied to continuing employment of the former
shareholders and employees which is recorded as compensation expense), transaction costs, integration
costs including retention, and credits and/or charges associated with the write-up of acquired
inventory and fixed assets to fair value, and the effect of a reduction in revenue related to
contingent revenue under the Novartis collaboration, described above; (iii) non-cash interest expense
related to amortization of the debt discount for convertible debt securities; (iv) divestiture and
restructuring charges; (v) non-cash loss on exchange of convertible notes; (vi) litigation
settlement charges (benefits); (vii) other-than-temporary impairment losses on investments; and (viii) other one-
time, nonrecurring, unusual or infrequent charges, expenses or gains that may not be indicative of
Hologic’s core business results; and to include income taxes related to such adjustments.
Hologic believes the use of non-GAAP adjusted net revenues is useful to investors as it eliminates
certain effects of purchase accounting on its recognition of revenue. Hologic believes the use
of non-GAAP adjusted net income is useful to investors by eliminating certain of the more
significant effects of its acquisitions and related activities, non-cash charges resulting from
the application of GAAP to convertible debt instruments with cash settlement features, charges
related to debt extinguishment losses, investment impairments, litigation settlements, and divestiture and
restructuring initiatives. These non-GAAP measures also reflect how Hologic manages its businesses
internally. In addition to the adjustments set forth in the calculation of Hologic’s
non-GAAP adjusted net income and adjusted EPS, its non-GAAP adjusted EBITDA eliminates the effects of
financing, income taxes and the accounting effects of capital spending. As with the items eliminated
in its calculation of non-GAAP adjusted net income, these items may vary for different
companies for reasons unrelated to the overall operating performance of a company’s business. When
analyzing Hologic’s operating performance, investors should not consider these non-GAAP
financial measures as a substitute for net income (loss) prepared in accordance with
GAAP. |
 Financial Guidance
20
The Company’s guidance includes its current operations, including revenues
from its approved/cleared products and its recently acquired businesses.
Hologic may not generate expected revenues and may incur expenses or
charges, realize income or gains, or execute acquisitions or dispositions
in fiscal 2013 that could cause actual results to vary from the guidance
provided in this presentation. In addition, the Company is continuing to monitor the
effects
of
the
U.S.,
European
and
general
worldwide
economic
and
regulatory
conditions
and
related
uncertainties, including the implementation of healthcare cost containment
measures and healthcare reform legislation, as well as foreign currency
fluctuations, which, along with other uncertainties facing the
Company’s business including those referenced elsewhere herein and its filings with the
Securities and Exchange Commission, could adversely affect anticipated results.
Future Non-GAAP Adjustments:
Future GAAP EPS may be affected by changes in ongoing assumptions and judgments
relating to the
Company’s
acquired
businesses,
and
may
also
be
affected
by
nonrecurring,
unusual
or
unanticipated charges, expenses or gains, all of which are excluded in the
calculation of non-GAAP adjusted EPS as described in this presentation.
It is therefore not practicable to reconcile non-GAAP adjusted EPS
guidance to the most comparable GAAP measure. |