Attached files
| file | filename |
|---|---|
| 8-K - TRUIST FINANCIAL CORP | kingfsc8k.htm |
| EX-99.1 - TRUIST FINANCIAL CORP | exhibit991.htm |
Exhibit 99.2

Non - GAAP Information This presentation contains financial information and performance measures determined by methods other than in accordance with accounting principles generally accepted in the United States of America (“GAAP”) . BB&T’s management uses these “non - GAAP” measures in their analysis of the corporation’s performance and the efficiency of its operations . Management believes that these non - GAAP measures provide a greater understanding of ongoing operations and enhance comparability of results with prior periods as well as demonstrating the effects of significant gains and charges in the current period . The company believes that a meaningful analysis of its financial performance requires an understanding of the factors underlying that performance . BB&T’s management believes that investors may use these non - GAAP financial measures to analyze financial performance without the impact of unusual items that may obscure trends in the company’s underlying performance . These disclosures should not be viewed as a substitute for financial measures determined in accordance with GAAP, nor are they necessarily comparable to non - GAAP performance measures that may be presented by other companies . In this presentation, these measures are generally marked as “non - GAAP” and are accompanied with disclosure regarding why BB&T’s management believes such measures are useful to investors . Below is a listing of the types of non - GAAP measures used in this presentation : □ Tangible common equity and Tier 1 common equity ratios are non - GAAP measures. BB&T uses the Tier 1 common equity definition used in the SCAP assessment to calculate these ratios. The Basel III Tier I common equity ratio is also a non - GAAP measure and reflects management’s best estim ate of the proposed regulatory requirements, which are subject to change. BB&T’s management uses these measures to assess the quality of capital and believ es that investors may find them useful in their analysis of the corporation. □ Asset quality ratios have been adjusted to remove the impact of acquired loans and foreclosed property covered by FDIC loss s har ing agreements as management believes their inclusion results in distortion of those ratios and may not be comparable to other periods presented or to other portfo lio s that were not impacted by purchase accounting. □ Fee income and efficiency ratios are non - GAAP in that they exclude securities gains (losses), foreclosed property expense, amort ization of intangible assets, merger - related and restructuring charges, the impact of FDIC loss share accounting and other selected items. □ Return on average tangible common shareholders’ equity is a non - GAAP measure that calculates the return on average common shareh olders’ equity without the impact of intangible assets and their related amortization. A reconciliation of these non - GAAP measures to the most directly comparable GAAP measure is included on the Investor Relations s ection of BB&T’s website and as an appendix to this presentation. Forward - Looking Information This presentation contains forward - looking statements with respect to the financial condition, results of operations and businesses of BB&T . Statements that are not historical or current facts or statements about beliefs and expectations are forward - looking statements . Words such as “anticipates,” “believes,” “estimates,” “expects,” “forecasts,” “intends,” “plans,” “projects,” “may,” “will,” “should,” and other similar expressions are intended to identify these forward - looking statements . Forward - looking statements involve certain risks and uncertainties and are based on the beliefs and assumptions of the management of BB&T, and the information available to management at the time that this presentation was prepared . Factors that may cause actual results to differ materially from those contemplated by such forward - looking statements include, among others, the following : ( 1 ) general economic or business conditions, either nationally or regionally, may be less favorable than expected, resulting in, among other things, a deterioration in credit quality and / or a reduced demand for credit or other services ; ( 2 ) disruptions to the credit and financial markets, either nationally or globally, including the impact of a downgrade of U . S . government obligations by one of the credit rating agencies and the adverse effects of the ongoing sovereign debt crisis in Europe ; ( 3 ) changes in the interest rate environment may reduce net interest margins and / or the volumes and values of loans made or held as well as the value of other financial assets held ; ( 4 ) competitive pressures among depository and other financial institutions may increase significantly ; ( 5 ) legislative, regulatory, or accounting changes, including changes resulting from the adoption and implementation of the Dodd - Frank Wall Street Reform and Consumer Protection Act of 2010 , and changes in accounting standards, may adversely affect the businesses in which BB&T is engaged ; ( 6 ) local, state or federal taxing authorities may take tax positions that are adverse to BB&T ; ( 7 ) reduction in BB&T’s credit ratings ; ( 8 ) adverse changes may occur in the securities markets ; ( 9 ) competitors of BB&T may have greater financial resources and develop products that enable them to compete more successfully than BB&T and may be subject to different regulatory standards than BB&T ; ( 10 ) costs or difficulties related to the integration of the businesses of BB&T and its merger partners may be greater than expected ; ( 11 ) unpredictable natural or other disasters could have an adverse effect on BB&T in that such events could materially disrupt BB&T’s operations or the ability or willingness of BB&T’s customers to access the financial services BB&T offers ; ( 12 ) expected cost savings associated with completed mergers and acquisitions may not be fully realized or realized within the expected time frames ; ( 13 ) deposit attrition, customer loss and/or revenue loss following completed mergers and acquisitions, may be greater than expected ; and ( 14 ) BB&T faces system failures and cyber - security risks that could adversely affect BB&T’s business and financial performance . These and other risk factors are more fully described in BB&T’s Annual Report on Form 10 - K for the year ended December 31 , 2011 under the section entitled Item 1 A . “Risk Factors” and from time to time, in other filings with the Securities and Exchange Commission . You are cautioned not to place undue reliance on these forward - looking statements, which speak only as of the date of this presentation . Actual results may differ materially from those expressed in or implied by any forward - looking statements . Except to the extent required by applicable law or regulation, BB&T undertakes no obligation to revise or update publicly any forward - looking statements for any reason . 2

BB&T is… » A values - driven highly profitable growth organization. While we have had a very successful merger history, our primary focus is on organic growth; nonetheless, we are well positioned for strategic opportunities. » Our fundamental strategy is to deliver the best value proposition in our markets. Recognizing value is a function of quality to price, our focus is on delivering high quality client service resulting in a perfect client experience. » Our over - arching purpose is to achieve our vision and mission, consistent with our values, with the ultimate goal of maximizing shareholder returns. 3
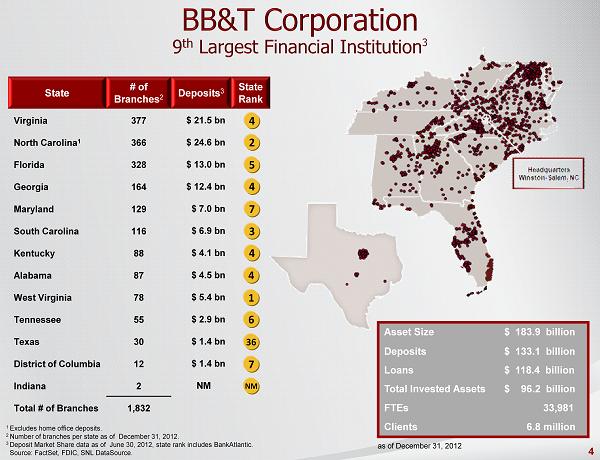
1 Excludes home office deposits. 2 Number of branches per state as of December 31, 2012. 3 Deposit Market Share data as of June 30, 2012, state rank includes BankAtlantic. Source: FactSet , FDIC, SNL DataSource . State # of Branches 2 Deposits 3 State Rank Virginia 377 $ 21.5 bn North Carolina 1 366 $ 24.6 bn Florida 328 $ 13.0 bn Georgia 164 $ 12.4 bn Maryland 129 $ 7.0 bn South Carolina 116 $ 6.9 bn Kentucky 88 $ 4.1 bn Alabama 87 $ 4.5 bn West Virginia 78 $ 5.4 bn Tennessee 55 $ 2.9 bn Texas 30 $ 1.4 bn District of Columbia 12 $ 1.4 bn Indiana 2 NM Total # of Branches 1,832 36 7 NM 4 2 5 4 3 4 4 1 6 7 Asset Size $ 183.9 billion Deposits $ 133.1 billion Loans $ 118.4 billion Total Invested Assets $ 96.2 billion FTEs 33,981 Clients 6.8 million as of December 31, 2012 4
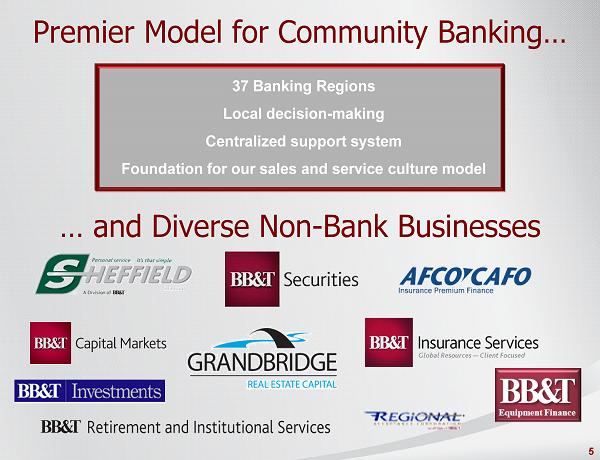
37 Banking Regions Local decision - making Centralized support system Foundation for our sales and service culture model Premier Model for Community Banking… … and Diverse Non - Bank Businesses 5

Value Proposition Drives Revenue Growth Revenue Growth through the Cycle 2 2012 vs . 2007 31.8% 7.4% 5.0% 10.0% 15.0% 20.0% 25.0% 30.0% 35.0% 40.0% BB&T Peer Median 1 Based on segment revenues, excluding other, treasury and corporate for 4Q12 . 2 Adjusted for large acquisitions (BB&T/ Colonial/ BankAltantic / Crump, US Bancorp/FBOP/Downey/PFF/Mellon 1st Business Bank/First Community Bank/MB Financial/Park National, PNC/ NatCity /Sterling/Yardville/RBC, Huntington/Sky Financial/Fidelity, Fifth Third/First Charter/R&G/ Vantiv , M&T/Wilmington Trust/Provident/Partner's Trust, KeyCorp/U.S.B . Holding, Comerica/Sterling, Regions/Morgan Keegan, SunTrust/GB&T, Zions/Vineyard) and select one - time items. Peers include: CMA, FITB, HBAN, KEY, MTB, PNC, RF, STI, USB and ZION Source: Deutsche Bank Community Banking 47% Residential Mortgage Banking 12% Dealer Financial Services 6% Specialized Lending 8% Financial Services 13% Insurance Services 14% Revenue Mix 1 6

Loan Growth Outlook $105.8 $107.5 $109.2 $112.7 $113.6 $100 $105 $110 $115 4Q11 1Q12 2Q12 3Q12 4Q12 Average Loans Held for Investment ($ in billions) » Loan growth outlook for first quarter has slowed » Commercial growth affected by: □ Lower mortgage warehouse lending » Covered portfolio paying faster than previously expected » Other lending subsidiaries have normal 1Q seasonality » Consumer pipelines are firming □ Auto demand improving □ Direct retail applications stronger » Linked quarter average loans projected to be down slightly » Growth in average loans in 2Q13 expected to improve to 2% - 4% linked quarter as seasonal headwinds decline 7
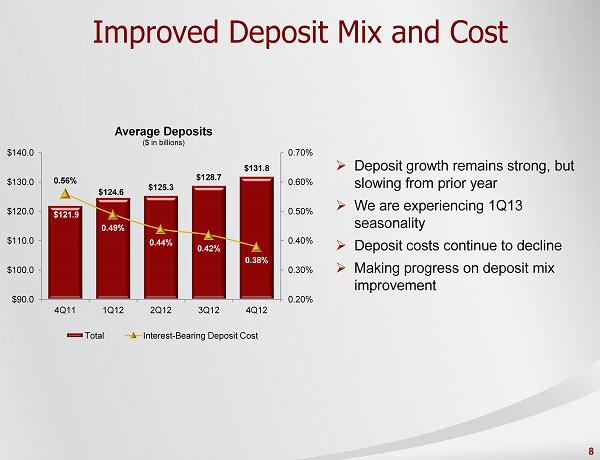
Improved Deposit Mix and Cost » Deposit growth remains strong, but slowing from prior year » We are experiencing 1Q13 seasonality » Deposit costs continue to decline » Making progress on deposit mix improvement $121.9 $124.6 $125.3 $128.7 $131.8 0.56% 0.49% 0.44% 0.42% 0.38% 0.20% 0.30% 0.40% 0.50% 0.60% 0.70% $90.0 $100.0 $110.0 $120.0 $130.0 $140.0 4Q11 1Q12 2Q12 3Q12 4Q12 Average Deposits ($ in billions) Total Interest - Bearing Deposit Cost 8

Commercially Focused Texas Expansion 9 Market 2012 Branches 2013 De Novo Branches Total Branches Dallas/FW 23 11 34 Houston 1 11 12 Austin 5 4 9 San Antonio 1 4 5 Totals 30 30 60 Capital Investment $36 million Associate Investment (Year 1) 150+ FTEs IRR 28+% Projected Loans (Year 5) $2.1 billion Projected Deposits (Year 5) $620 million » Capitalize on 2012 success in Texas □ Our brand has been well received □ Total loans up 114% vs. 2011 □ Net revenue increased by 48% vs. 2011 » Recruit seasoned talent from the market; hire vs. acquire » Take advantage of lower cost facilities; no ground up construction » Focus on small business, small commercial and middle market segments » Accretive to net income in second year » Strategy exportable to other markets
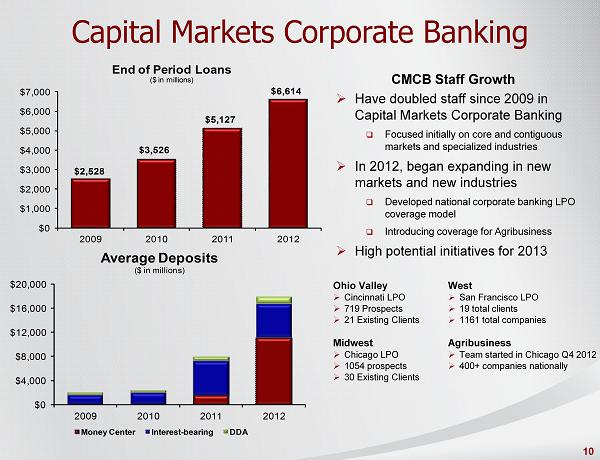
Capital Markets Corporate Banking 10 » Have doubled staff since 2009 in Capital Markets Corporate Banking □ Focused initially on core and contiguous markets and specialized industries » In 2012, began expanding in new markets and new industries □ Developed national corporate banking LPO coverage model □ Introducing coverage for Agribusiness » High potential initiatives for 2013 CMCB Staff Growth Ohio Valley » Cincinnati LPO » 719 Prospects » 21 Existing Clients Midwest » Chicago LPO » 1054 prospects » 30 Existing Clients West » San Francisco LPO » 19 total clients » 1161 total companies Agribusiness » Team started in Chicago Q4 2012 » 400+ companies nationally $2,528 $3,526 $5,127 $6,614 $0 $1,000 $2,000 $3,000 $4,000 $5,000 $6,000 $7,000 2009 2010 2011 2012 End of Period Loans ($ in millions) $0 $4,000 $8,000 $12,000 $16,000 $20,000 2009 2010 2011 2012 Average Deposits ($ in millions) Money Center Interest - bearing DDA

Wealth Businesses – New Market Emphasis 2013 Revenue Emphasis » Wealth relationships are material drivers for loans, deposits, insurance and investments » Florida and Texas have 7 of the top 10 metro areas in the BB&T footprint for small/medium commercial revenue (corresponds to important wealth markets) » Targeting $1 billion in new loans in 2013 generated from BB&T wealth businesses through enhanced lending platform » Build out the Wealth Solutions Center to provide client and advisor solutions » Deliver Wealth services to BankAtlantic clients 11 2012 Accomplishments 2012 vs. 2011 Revenue 10.4% Deposits 14.2% Loans 22.5% Assets 12.5%

Insurance Opportunities $914 $1,034 $1,042 $1,047 $1,371 $0 $200 $400 $600 $800 $1,000 $1,200 $1,400 $1,600 2008 2009 2010 2011 2012 Insurance Revenues ($ in millions) » 5 year compound annual growth rate in revenues 10.1% » Crump acquisition increased revenue approximately 30% » Industry leading client retention - 92% » Firming market conditions providing opportunities to win new accounts » Positioned to succeed in more stable market with improved pricing » Executing on synergies with Crump and cross - sell to other businesses » Expanding Crump Life institutional platform sales capabilities » Strategic emphasis on Employee Benefits business with upcoming changes in health care 12

Superior Net Interest Margin 1 Excludes $67 million charge related to leveraged lease settlement. 2 Peers include CMA, FITB, HBAN, KEY, MTB, PNC, RF, STI, USB, and ZION. Source: SNL and Company Reports. 3.52% 3.63% 1 3.66% 4.03% 4.06% 3.91% 3.47% 3.31% 3.40% 3.51% 3.51% 3.45% 3.15% 3.40% 3.65% 3.90% 4.15% 2007 2008 2009 2010 2011 2012 BB&T Peers 2 13 » Margin expected to be in the mid 3.70s % range in 1Q13 driven by: □ Lower rates on new earning assets □ Runoff of covered assets Offset by: □ Lower funding cost □ Favorable funding mix changes » Expect later quarters in 2013 to decline at a more modest pace » Core margin outlook remains fairly stable
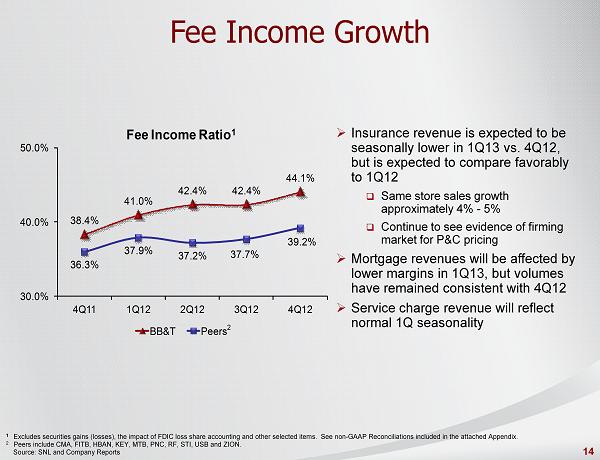
Fee Income Growth 38.4% 41.0% 42.4% 42.4% 44.1% 36.3% 37.9% 37.2% 37.7% 39.2% 30.0% 40.0% 50.0% 4Q11 1Q12 2Q12 3Q12 4Q12 Fee Income Ratio 1 BB&T Peers 2 1 Excludes securities gains (losses), the impact of FDIC loss share accounting and other selected items. See non - GAAP Reconciliat ions included in the attached Appendix. 2 Peers include CMA, FITB, HBAN, KEY, MTB, PNC, RF, STI, USB and ZION. Source: SNL and Company Reports » Insurance revenue is expected to be seasonally lower in 1Q13 vs. 4Q12, but is expected to compare favorably to 1Q12 □ Same store sales growth approximately 4% - 5% □ Continue to see evidence of firming market for P&C pricing » Mortgage revenues will be affected by lower margins in 1Q13, but volumes have remained consistent with 4Q12 » Service charge revenue will reflect normal 1Q seasonality 14
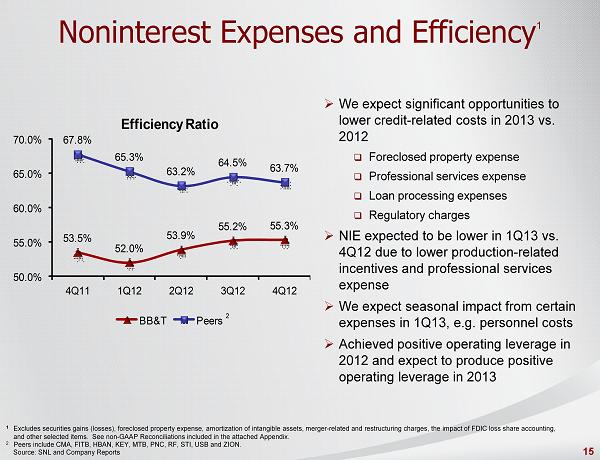
Noninterest Expenses and Efficiency 1 1 Excludes securities gains (losses), foreclosed property expense, amortization of intangible assets, merger - related and restructu ring charges, the impact of FDIC loss share accounting, and other selected items. See non - GAAP Reconciliations included in the attached Appendix. 2 Peers include CMA, FITB, HBAN, KEY, MTB, PNC, RF, STI, USB and ZION. Source: SNL and Company Reports 53.5% 52.0% 53.9% 55.2% 55.3% 67.8% 65.3% 63.2% 64.5% 63.7% 50.0% 55.0% 60.0% 65.0% 70.0% 4Q11 1Q12 2Q12 3Q12 4Q12 Efficiency Ratio BB&T Peers 2 » We expect significant opportunities to lower credit - related costs in 2013 vs. 2012 □ Foreclosed property expense □ Professional services expense □ Loan processing expenses □ Regulatory charges » NIE expected to be lower in 1Q13 vs. 4Q12 due to lower production - related incentives and professional services expense » We expect seasonal impact from certain expenses in 1Q13, e.g. personnel costs » Achieved positive operating leverage in 2012 and expect to produce positive operating leverage in 2013 15

Capital Strength 1 1 Risk - weighted assets are determined based on regulatory capital requirements. Under the regulatory framework for determining risk - weighted as sets each asset class is assigned a risk - weighting of 0%, 20%, 50% or 100% based on the underlying risk of the specific asset class. In addition, off balance sheet exposures are firs t c onverted to a balance sheet equivalent amount and subsequently assigned to one of the four risk - weightings. Tier 1 common equity ratio is a non - GAAP measure. BB&T uses the Tier 1 common equity definitio n used in the SCAP assessment to calculate these ratios. BB&T's management uses these measures to assess the quality of capital and believes that investors may find them useful in their ana lys is of the Corporation. These capital measures are not necessarily comparable to similar capital measures that may be presented by other companies. 2 The Basel III Tier I common equity ratio is also a non - GAAP measure and reflects management’s best estimate of the proposed regu latory requirements, which are subject to change. » Revised Tier 1 common ratios due to changes in risk weighted assets □ Did not affect tangible or GAAP capital □ Only minor impact to Basel III » BB&T currently estimates Tier 1 common under Basel III 2 to be: □ 7.9% under the U.S. proposed rules (NPR) □ Basel III estimate does not include any mitigating actions which will result in lower risk weighted assets and higher capital ratios » CCAR plan submitted; capital deployment priorities are: □ Organic growth □ Dividends □ Strategic opportunities / share buybacks 16 Tier 1 Common 4Q11 4Q12 Basel I 9.4 % 9.3 % Operating Minimum 8.0 % 8.0 %
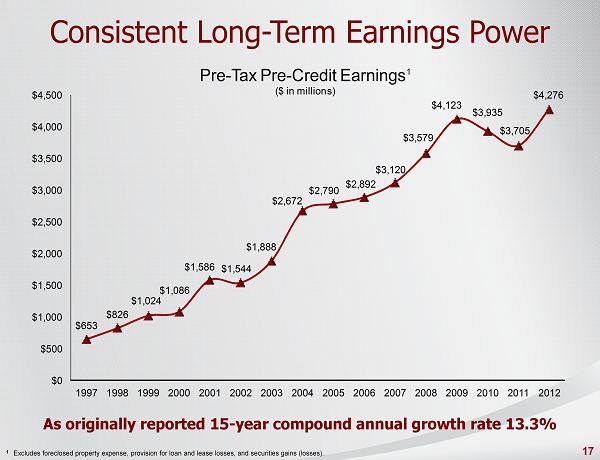
Consistent Long - Term Earnings Power $653 $826 $1,024 $1,086 $1,586 $1,544 $1,888 $2,672 $2,790 $2,892 $3,120 $3,579 $4,123 $3,935 $3,705 $4,276 $0 $500 $1,000 $1,500 $2,000 $2,500 $3,000 $3,500 $4,000 $4,500 1997 1998 1999 2000 2001 2002 2003 2004 2005 2006 2007 2008 2009 2010 2011 2012 Pre - Tax Pre - Credit Earnings 1 ($ in millions) As originally reported 15 - year compound annual growth rate 13.3% 1 Excludes foreclosed property expense, provision for loan and lease losses, and securities gains (losses). 17

Industry Leading Client Satisfaction * From Maritz Research 2012 Retail Client Satisfaction and Loyalty Survey, represent percentage of “top box” scores, indicat ing a 9 or 10 rating on a 10 - point scale. Peers include Bank of America, PNC/RBC , Regions, SunTrust and Wells Fargo **Greenwich Associates 2012 U.S. Middle Market Banking Study and U.S. Small Business Banking Study. *** Branch Banking and Trust received the highest numerical score among mortgage servicers in the proprietary J.D. Power and Ass ociates 2012 Primary Mortgage Servicer Study SM. Study based on responses from 5,923 consumers measuring 25 companies and measures the satisfaction of consumers with their current mortgage servicer. Proprie tary study results are based on experiences and perceptions of consumers surveyed in April - May 2012. Your experiences may vary. Visit jdpower.com Winner of 22 Excellence Awards from Greenwich Associates; 19 National Awards and 3 Regional Awards** Received 83 awards since 2009, more than any other bank “Highest in Customer Satisfaction among Mortgage Servicing Companies, Three Years in a Row”*** 59% 20% 35% 50% 65% Peer 5 Peer 4 Peer 3 Peer 2 Peer 1 BB&T Overall Bank Satisfaction* 60% 20% 35% 50% 65% Peer 5 Peer 4 Peer 3 Peer 2 Peer 1 BB&T Likelihood to Recommend* 61% 20% 35% 50% 65% Peer 5 Peer 4 Peer 3 Peer 2 Peer 1 BB&T Likelihood of Future Use* 18

19

20

21

Non - GAAP Capital Measures (Dollars in millions, except per share data) As of / Quarter Ended Dec 31 2012 Dec 31 2011 Selected Capital Information Risk - based capital Tier 1 $ 14,373 $ 14,913 Total 18,204 18,862 Risk - weighted assets 1 131,096 124,507 Average quarterly tangible assets 175,015 165,349 Risk - based capital ratios Tier 1 11.0% 12.0 % Total 13.9 15.1 Leverage capital ratio 8.2 9.0 Equity as a percentage of total assets 11.5 10.0 Book value per common share $ 27.21 $ 24.98 Selected non - GAAP Capital Information 2 Tangible common equity as a percentage of tangible assets 6.9 % 6.9 % Tier 1 common equity as a percentage of risk - weighted assets 9.3 9.4 Tangible book value per common share $ 17.52 $ 16.73 1 Risk - weighted assets are determined based on regulatory capital requirements. Under the regulatory framework for determining ri sk - weighted assets each asset class is assigned a risk - weighting of 0%, 20%, 50% or 100% based on the underlying risk of the specific asset class. In addition, off - balance sheet exposures are first converted to a balance sheet equivalent amount and subsequently assigned to one of the four risk - weightings. 2 Tangible common equity and Tier 1 common equity ratios are non - GAAP measures. BB&T uses the Tier 1 common equity definition use d in the SCAP assessment to calculate these ratios. BB&T's management uses these measures to assess the quality of capital and believes that investors may find them useful in their analysis of the Cor por ation. These capital measures are not necessarily comparable to similar capital measures that may be presented by other companies. 22

Non - GAAP Capital Measures (Dollars in millions, except per share data) As of / Quarter Ended Dec 31 2012 Dec 31 2011 Calculations of Tier 1 common equity and tangible assets and related measures: Tier 1 equity $ 14,373 $ 14,913 Less: Qualifying restricted core capital elements 2,116 3,250 Tier 1 common equity $ 12,257 $ 11,663 Total assets $ 183,872 $ 174,579 Less: Intangible assets, net of deferred taxes 7,273 6,406 Plus: Regulatory adjustments, net of deferred taxes 212 421 Tangible assets $ 176,811 $ 168,594 Total risk - weighted assets 1 $ 131,096 $ 124,507 Tangible common equity as a percentage of tangible assets 6.9 % 6.9 % Tier 1 common equity as a percentage of risk - weighted assets 9.3 9.4 Tier 1 common equity $ 12,257 $ 11,663 Outstanding shares at end of period (in thousands) 699,728 697,143 Tangible book value per common share $ 17.52 $ 16.73 1 Risk - weighted assets are determined based on regulatory capital requirements. Under the regulatory framework for determining ri sk - weighted assets each asset class is assigned a risk - weighting of 0%, 20%, 50% or 100% based on the underlying risk of the specific asset class. In addition, off - balance sheet exposures are first converted to a balance sheet equivalent amount and subsequently assigned to one of the four risk - weightings. 23
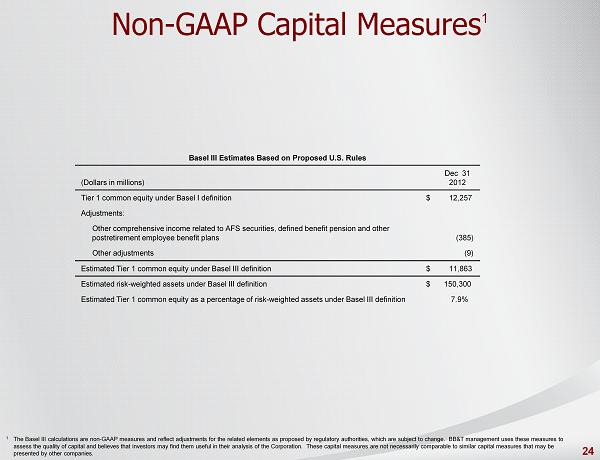
Non - GAAP Capital Measures 1 1 The Basel III calculations are non - GAAP measures and reflect adjustments for the related elements as proposed by regulatory auth orities, which are subject to change. BB&T management uses these measures to assess the quality of capital and believes that investors may find them useful in their analysis of the Corporation. These c api tal measures are not necessarily comparable to similar capital measures that may be presented by other companies. Basel III Estimates Based on Proposed U.S. Rules (Dollars in millions) Dec 31 2012 Tier 1 common equity under Basel I definition $ 12,257 Adjustments: Other comprehensive income related to AFS securities, defined benefit pension and other postretirement employee benefit plans (385) Other adjustments (9) Estimated Tier 1 common equity under Basel III definition $ 11,863 Estimated risk - weighted assets under Basel III definition $ 150,300 Estimated Tier 1 common equity as a percentage of risk - weighted assets under Basel III definition 7.9% 24

Non - GAAP Reconciliations Applicable ratios are annualized. 1 Excludes mortgage loans guaranteed by GNMA that BB&T does not have the obligation to repurchase. 2 Excludes mortgage loans guaranteed by the government. As of / Quarter Ended Dec 31 2012 Sept 30 2012 June 30 2012 March 31 2012 Dec 31 2011 Asset Quality Ratios (including amounts related to covered loans and covered foreclosed property) Loans 30 - 89 days past due and still accruing as a percentage of total loans and leases 1,2 1.02 % 1.02 % 0.97 % 1.02 % 1.22 % Loans 90 days or more past due and still accruing as a percentage of total loans and leases 1,2 0.52 0.53 0.67 0.75 0.84 Nonperforming loans and leases as a percentage of total loans and leases 1.17 1.31 1.45 1.67 1.68 Nonperforming assets as a percentage of: Total assets 0.97 1.10 1.24 1.50 1.62 Loans and leases plus foreclosed property 1.51 1.70 1.93 2.35 2.52 Net charge - offs as a percentage of average loans and leases 1.02 1.05 1.21 1.28 1.44 Allowance for loan and lease losses as a percentage of loans and leases held for investment 1.76 1.80 1.91 2.02 2.10 Ratio of allowance for loan and lease losses to: Net charge - offs 1.69 X 1.69 X 1.57 X 1.54 X 1.45 X Nonperforming loans and leases held for investment 1.46 1.33 1.29 1.18 1.21 25

Non - GAAP Reconciliations Applicable ratios are annualized. 1 Excludes mortgage loans guaranteed by GNMA that BB&T does not have the obligation to repurchase. 2 Excludes mortgage loans guaranteed by the government. 3 These asset quality ratios have been adjusted to remove the impact of covered loans and covered foreclosed property. Appropr ia te adjustments to the numerator and denominator have been reflected in the calculation of these ratios. Management believes the inclusion of covered loans in certain asset quality ratios that include nonperformi ng assets, past due loans or net charge - offs in the numerator or denominator results in distortion of these ratios and they may not be comparable to other periods presented or to other portfolios that were not imp act ed by purchase accounting. As of / Quarter Ended Dec 31 2012 Sept 30 2012 June 30 2012 March 31 2012 Dec 31 2011 Asset Quality Ratios (excluding amounts related to covered loans and covered foreclosed property) 3 Loans 30 - 89 days past due and still accruing as a percentage of total loans and leases 1,2 0.93 % 0.90 % 0.83 % 0.82 % 1.06 % Loans 90 days or more past due and still accruing as a percentage of total loans and leases 1,2 0.15 0.13 0.13 0.15 0.19 Nonperforming loans and leases as a percentage of total loans and leases 1.20 1.35 1.50 1.74 1.76 Nonperforming assets as a percentage of: Total assets 0.85 0.97 1.09 1.33 1.45 Loans and leases plus foreclosed property 1.33 1.51 1.72 2.12 2.29 Net charge - offs as a percentage of average loans and leases 1.04 1.08 1.22 1.28 1.46 Allowance for loan and lease losses as a percentage of loans and leases held for investment 1.70 1.73 1.86 1.97 2.05 Ratio of allowance for loan and lease losses to: Net charge - offs 1.60 X 1.59 X 1.52 X 1.51 X 1.40 X Nonperforming loans and leases held for investment 1.37 1.24 1.21 1.11 1.13 26

Non - GAAP Reconciliations Quarter Ended Efficiency and Fee Income Ratios 1 Dec 31 2012 Sept 30 2012 June 30 2012 March 31 2012 Dec 31 2011 Efficiency ratio – GAAP 58.8 % 61.6 % 57.9 % 59.0 % 67.1 % Effect of securities gains (losses), net - - - (0.2) 2.4 Effect of merger - related and restructuring charges, net (0.5) (1.7) (0.1) (0.5) (0.7) Effect of losses/write - downs on NPL disposition loans - - - - (0.2) Effect of mortgage repurchase expense adjustments - (1.1) - - - Effect of FDIC loss share accounting (0.1) - 0.2 0.1 0.9 Effect of affordable housing investments write - down - - - (1.0) - Effect of foreclosed property expense (1.9) (2.2) (2.9) (3.9) (14.5) Effect of leveraged lease sale/write - downs - - - (0.6) - Effect of Visa indemnification - - - - (0.5) Effect of amortization of intangibles (1.0) (1.4) (1.2) (0.9) (1.0) Efficiency ratio – reported 55.3 55.2 53.9 52.0 53.5 Fee income ratio – GAAP 40.3 % 38.8 % 39.2 % 37.1 % 38.2 % Effect of securities gains (losses), net - - - 0.2 (2.7) Effect of losses/write - downs on NPL disposition loans - - - - 0.3 Effect of affordable housing investments write - down - - - 1.1 - Effect of FDIC loss share accounting 3.8 3.6 3.2 2.6 2.6 Fee income ratio – reported 44.1 42.4 42.4 41.0 38.4 1 BB&T’s management uses these measures in their analysis of the Corporation’s performance. BB&T’s management believes these m eas ures provide a greater understanding of ongoing operations and enhance comparability of results with prior periods, as well as demonstrating the effects of significant gains an d charges. 27

Non - GAAP Reconciliations 1 BB&T’s management believes investors use this measure to evaluate the return on average common shareholders’ equity without t he impact of intangible assets and their related amortization. (Dollars in millions) Quarter Ended Dec 31 Sept 30 June 30 March 31 Dec 31 Return on Average Tangible Common Shareholders' Equity 1 2012 2012 2012 2012 2011 Net income available to common shareholders $ 506 $ 469 $ 510 $ 431 $ 391 Plus: Amortization of intangibles, net of tax 17 19 18 14 15 Tangible net income available to common shareholders $ 523 $ 488 $ 528 $ 445 $ 406 Average common shareholders' equity $ 19,160 $ 18,757 $ 18,302 $ 17,772 $ 17,693 Less: Average intangible assets 7,463 7,341 7,031 6,510 6,485 Average tangible common shareholders' equity $ 11,697 $ 11,416 $ 11,271 $ 11,262 $ 11,208 Return on average tangible common shareholders' equity 17.80 % 17.01 % 18.85 % 15.88 % 14.36 % 28

Non - GAAP Reconciliations Quarter Ended Reported net interest margin vs. core net interest margin 1 Dec 31 2012 Sept 30 2012 June 30 2012 March 31 2012 Dec 31 2011 Reported net interest margin - GAAP 3.84 % 3.94 % 3.95 % 3.93 % 4.02 % Adjustments to net interest income for Colonial assets: Effect of covered securities (0.09) (0.09) (0.09) (0.06) (0.08) Effect of covered loans (0.36) (0.37) (0.45) (0.51) (0.55) Adjustments to interest expense: Effect of interest expense on Colonial assets 0.03 0.03 0.04 0.05 0.05 Core net interest margin 3.42 % 3.51 % 3.45 % 3.41 % 3.44 % 1 BB&T’s management uses these measures in their analysis of the Corporation’s performance. BB&T’s management believes these m eas ures provide a greater understanding of ongoing operations and enhance comparability of results with prior periods, as well as demonstrating the effects of significant gains an d charges. 29

30