Attached files
| file | filename |
|---|---|
| 8-K - FORM 8-K - ACI WORLDWIDE, INC. | d498144d8k.htm |

| ACI Worldwide Investor Conferences March 2013 1 ACI's software underpins electronic payments throughout retail and wholesale banking, and commerce all the time. Exhibit 99.1 |

| Private Securities Litigation Reform Act of 1995 Safe Harbor for Forward-Looking Statements This presentation contains forward-looking statements based on current expectations that involve a number of risks and uncertainties. The forward-looking statements are made pursuant to safe harbor provisions of the Private Securities Litigation Reform Act of 1995. A discussion of these forward-looking statements and risk factors that may affect them is set forth at the end of this presentation. The Company assumes no obligation to update any forward-looking statement in this presentation, except as required by law. 2 |

| Business Overview |

| 4 ACI Worldwide: A Global Payments Company Regional Offices Distributors/Sales Agents AMERICAS 1,950+ customers EMEA 500+ customers ASIA/PACIFIC 150+ customers ~ 2,600 customers in over 80 countries rely on ACI solutions 3,500employees Revenue guidance 2013 = $775M EBITDA guidance 2013 = $235M 60 month backlog as of 2012 = $2.4B Customers: ~ 180 processors globally Customers: ~ 290 retailers globally Note: Dollars are in millions. Total Revenue and EBITDA represent mid-point of guidance |

| 5 ACI is a Leading Provider of Enterprise Payments and Transaction Banking Solutions Retail Payments48% Online Banking22% Community Banking9% Merchant Retailer Payments6% Tools 5% Wholesale Payments5% Fraud Management5% Retail payments enginesCard and account managementAuthentication, authorization, acquiring, clearing and settlementSingle message formatMobile paymentsSold to FIs and processors of all sizes globally Retail Payments U.S. and int'l corporate online banking and cash managementU.S. and Int'l branch systemsTrade financeMobile bankingIn-house or hosted solutionSold to Large FIs Online Banking U.S. business and consumer online bankingU.S. branch systemMobile bankingHosted solutionsSold to community FIs and credit unions Community Banking U.S. and int'l merchant retail payments enginesIn-store integrationPCI complianceLoyalty / stored valueServes Retailers of all sizes Merchant Retail Payments AnalyticsPayments InfrastructureTesting tools Tools Wholesale payments enginesTransaction bankingTrade financeServes FIs globally Wholesale Payments Payments transaction fraudEnterprise financial crimesCase management Fraud Management ACI Product Family as % of Revenue Rich set of Product CapabilitiesStrong focus on Product Development (R&D ~20% of revenue) |
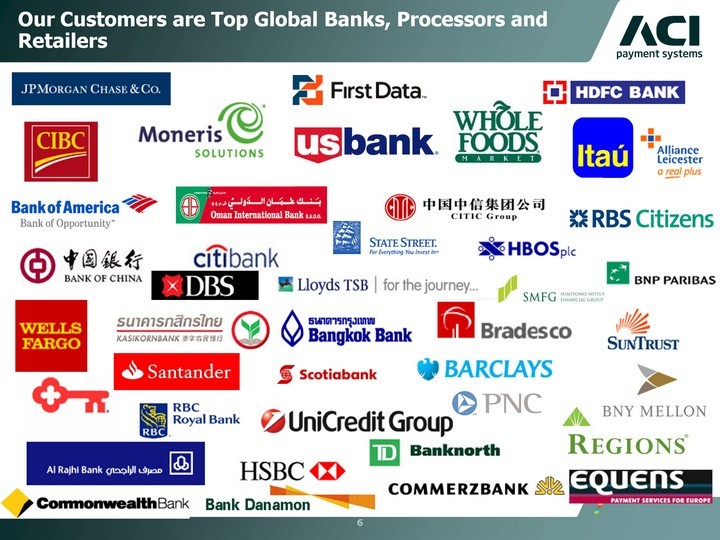
| 6 Our Customers are Top Global Banks, Processors and Retailers |

| 7 Large & Growing Worldwide Payment Opportunity Source: IDC Financial Insights 2011, ACI Internal Analysis 8,949 9,864 10,881 11,914 12,989 14,184 5.8% 10.6% 10.5% 10.2% 7.7% 7.2% 796 5,625 556 604 381 987 844 6,259 619 644 429 1,068 898 6,965 688 691 483 1,155 957 7,695 760 744 510 1,247 1,005 8,456 834 796 562 1,335 1,057 9,307 916 854 619 1,430 Retail Banking Payments Merchant Retailer Payments 5YR CAGR (2011-16)= 9.6% Wholesale Banking Payments 2011 ESTIMATED SHARE SERVICEABLE SOFTWARE INDUSTRY SPEND IN 2016 = $14.2B Tools and Infrastructure Online Banking and Cash Management Fraud Management ($ in millions) BPO (e.g.. processors) IT SERVICES SOFTWARE FundTechBottomlineNICE (Actimize)BAE (Norkom & Detica)Clear2PayDovetailFIS 16% 38% 46% OTHER(Homegrown & Regional) IBM ACI - 2011 Estimated Share of 8% FAIR ISAAC (FICO) INTUIT (Digital Insight) SAS Note: ACI market share pro forma for S1 acquisition Source: IDC Financial Insights, June 2011; Company reports and ACI analysis |

| 8 Customer Trends Continued Shift to Electronic Payments Customer Focus on Improved Efficiency and Risk Management Replacement of Legacy Systems Regulatory Requirements Financial Industry Consolidation Global retail and wholesale transaction volumes are expected to grow at a 9% CAGR through 2020 E-payments vendors are increasingly investing in robust, scalable architecture with enhanced straight through processing capabilities to reduce errors and prevent fraud Many large financial institutions process electronic payments on legacy software and systems developed by internal IT departmentsFinancial institutions will upgrade or replace their existing systems with the robust, scalable solutions third-party vendors provide as industry IT investment recovers Dodd-Frank bill, Basel II and SEPARequirements to upgrade existing systems to manage enterprise risk and reduce cross-border payments costs Large financial institutions desire to simplify their vendor relationshipsVendors with a complete set of solutions across the enterprise are poised to capitalize on their existing relationships for cross-selling opportunities |

| ACI + ORCC Compelling Strategic Rationale Online ResourcesTender offer price of $3.85 cash per share (NASDAQ: ORCC)Implied EV / 2012E Adj. EBITDA: 8.0x 1Implied EV / 2012E Adj. EBITDA (inc. Synergies): 5.0x 2Adds full-service Bill Payment platform for Online Banking and BillersSignificant base of biller connections can be leveraged for efficienciesCross sales potential~90% recurring revenueExpected to be accretive to non-GAAP earnings in 2013 9 2012E Adj. EBITDA represents mean of Wall Street research estimatesAssumes $19.5 million in anticipated cost synergies |

| Financial Overview |

| 11 Sales and Revenue Model 60- Month Backlog Sales Bookings New Account / Product Sales - revenue generally split evenly among license, maintenance and serviceTerm Extension - 50% license, 50% maintenanceLegacy ACI contracts are 5-year fixed termLegacy S1 contracts are generally perpetual license fees and 3-year fixed term for hosting services95% of our contracts are Transaction Based (TBP)Beginning contracted backlog represents approximately 80% of forward revenue guidance Higher margin recurring revenues (maintenance, license and hosting fees) comprise majority of 60- month backlogLower margin implementation services more significant in first 12 months Renewal rates across all products >96% * S1 added $685 to 60-Month Backlog in 2012 |

| 12 Diversified Revenue Base by Geography & Type Note: Dollars are in millions. Revenue presented on a GAAP basis Diversified global company with customers spanning ~ 100 countriesApproximately 75-80% of business denominated in U.S. dollars in spite of geographic scopeEMEA is comprised of ~30% UK-derived revenue, 20% Middle East/Africa and 50% Europe (inclusive of 32 countries) Higher margin recurring revenues (maintenance, license and hosting fees) comprise nearly 80% of revenueLower margin implementation services represent approximately 20% of revenue 2012 Revenue by Region 2012 Revenue by Type |

| Operating Income and Adjusted EBITDA 2008-2013 2011 and 2012 Operating Income and Adjusted EBITDA exclude one-time expenses related to the acquisition of S1 Corporation and exclude the impact of the $22.5 million deferred revenue haircut. 13 Adjusted Operating Income Adjusted EBITDA ($ in Millions) *2013 represents guidance midpoint |

| 14 2013 Guidance ($ in Millions) Sales, net of term extension, growth in the high single digits to low double digitsRevenue growth in mid to high single digitsRevenue and margin phasing by quarter consistent with 2012Operating Income margin of 20%Adjusted EBITDA margin of 30%Depreciation and amortization expected to approximate $64 millionNon-cash compensation expense expected to approximate $15.8 millionDiluted Share Count to approximate 40 million (excluding future share buy-back activity) |

| Questions? |

| Non-GAAP Financial Measures To supplement our financial results presented on a GAAP basis, we use the non-GAAP measure indicated in the tables, which exclude certain business combination accounting entries and expenses related to the acquisition of S1, as well as other significant non-cash expenses such as depreciation, amortization and share-based compensation, that we believe are helpful in understanding our past financial performance and our future results. The presentation of these non-GAAP financial measures should be considered in addition to our GAAP results and are not intended to be considered in isolation or as a substitute for the financial information prepared and presented in accordance with GAAP. Management generally compensates for limitations in the use of non-GAAP financial measures by relying on comparable GAAP financial measures and providing investors with a reconciliation of non-GAAP financial measures only in addition to and in conjunction with results presented in accordance with GAAP. We believe that these non-GAAP financial measures reflect an additional way of viewing aspects of our operations that, when viewed with our GAAP results, provide a more complete understanding of factors and trends affecting our business. Certain non- GAAP measures include: Non-GAAP revenue: revenue plus deferred revenue that would have been recognized in the normal course of business by S1 if not for GAAP purchase accounting requirements. Non-GAAP revenue should be considered in addition to, rather than as a substitute for, revenue.Non-GAAP operating income: operating income (loss) plus deferred revenue that would have been recognized in the normal course of business by S1 if not for GAAP purchase accounting requirements and one-time expense related to the acquisition of S1. Non-GAAP operating income should be considered in addition to, rather than as a substitute for, operating income.Adjusted EBITDA: net income (loss) plus income tax expense, net interest income (expense), net other income (expense), depreciation, amortization and non-cash compensation, as well as deferred revenue that would have been recognized in the normal course of business by S1 if not for GAAP purchase accounting requirements and one-time expense related to the acquisition of S1. Adjusted EBITDA should be considered in addition to, rather than as a substitute for, operating income. 16 |
| Non-GAAP Financial Measures ACI also includes backlog estimates, which include all software license fees, maintenance fees and services specified in executed contracts, as well as revenues from assumed contract renewals to the extent that we believe recognition of the related revenue will occur within the corresponding backlog period. We have historically included assumed renewals in backlog estimates based upon automatic renewal provisions in the executed contract and our historic experience with customer renewal rates.Backlog is considered a non-GAAP financial measure as defined by SEC Regulation G. Our 60-month backlog estimate represents expected revenues from existing customers using the following key assumptions:Maintenance fees are assumed to exist for the duration of the license term for those contracts in which the committed maintenance term is less than the committed license term.License and facilities management arrangements are assumed to renew at the end of their committed term at a rate consistent with our historical experiences.Non-recurring license arrangements are assumed to renew as recurring revenue streams.Foreign currency exchange rates are assumed to remain constant over the 60-month backlog period for those contracts stated in currencies other than the U.S. dollar.Our pricing policies and practices are assumed to remain constant over the 60-month backlog period 17 |

| Non-GAAP Financial Measures .Estimates of future financial results are inherently unreliable. Our backlog estimates require substantial judgment and are based on a number of assumptions as described above. These assumptions may turn out to be inaccurate or wrong, including for reasons outside of management's control. For example, our customers may attempt to renegotiate or terminate their contracts for a number of reasons, including mergers, changes in their financial condition, or general changes in economic conditions in the customer's industry or geographic location, or we may experience delays in the development or delivery of products or services specified in customer contracts which may cause the actual renewal rates and amounts to differ from historical experiences. Changes in foreign currency exchange rates may also impact the amount of revenue actually recognized in future periods. Accordingly, there can be no assurance that contracts included in backlog estimates will actually generate the specified revenues or that the actual revenues will be generated within the corresponding 60-month period. Backlog should be considered in addition to, rather than as a substitute for, reported revenue and deferred revenue. 18 |

| Forward-Looking Statements This presentation contains forward-looking statements based on current expectations that involve a number of risks and uncertainties. Generally, forward-looking statements do not relate strictly to historical or current facts and may include words or phrases such as "believes," " will," "expects," "anticipates," "intends," and words and phrases of similar impact. The forward-looking statements are made pursuant to safe harbor provisions of the Private Securities Litigation Reform Act of 1995. Forward-looking statements in this presentation include, but are not limited to, statements regarding:expectations regarding the amount of serviceable software industry spend for certain future years; expectations that global retail and wholesale transaction volumes will grow at a 9% CAGR through 2020 and that other customer trends will benefit our business;expectations that Online Resources Corporation's base of biller connections can be leveraged for efficiencies and that the acquisition of the company will be accretive to our non-GAAP earnings in 2013; and expectations regarding 2013 financial guidance related to revenue, operating income and adjusted EBITDA. 19 |

| Forward-Looking Statements All of the foregoing forward-looking statements are expressly qualified by the risk factors discussed in our filings with the Securities and Exchange Commission. Such factors include but are not limited to, increased competition, the performance of our strategic product, BASE24-eps, demand for our products, restrictions and other financial covenants in our credit facility, consolidations and failures in the financial services industry, customer reluctance to switch to a new vendor, the accuracy of management's backlog estimates, the maturity of certain products, our strategy to migrate customers to our next generation products, ratable or deferred recognition of certain revenue associated with customer migrations and the maturity of certain of our products, failure to obtain renewals of customer contracts or to obtain such renewals on favorable terms, delay or cancellation of customer projects or inaccurate project completion estimates, volatility and disruption of the capital and credit markets and adverse changes in the global economy, our existing levels of debt, impairment of our goodwill or intangible assets, litigation, future acquisitions, strategic partnerships and investments, risks related to the expected benefits to be achieved in the proposed transaction with Online Resources, the complexity of our products and services and the risk that they may contain hidden defects or be subjected to security breaches or viruses, compliance of our products with applicable legislation, governmental regulations and industry standards, our compliance with privacy regulations, the protection of our intellectual property in intellectual property litigation, the cyclical nature of our revenue and earnings and the accuracy of forecasts due to the concentration of revenue generating activity during the final weeks of each quarter, business interruptions or failure of our information technology and communication systems, our offshore software development activities, risks from operating internationally, including fluctuations in currency exchange rates, exposure to unknown tax liabilities, and volatility in our stock price. For a detailed discussion of these risk factors, parties that are relying on the forward-looking statements should review our filings with the Securities and Exchange Commission, including our most recently filed Annual Report on Form 10-K, Registration Statement on Form S-4, and subsequent reports on Forms 10-Q and 8-K. 20 |

| ACI's software underpins electronic payments throughout retail and wholesale banking, and commerce all the time, without fail. www.aciworldwide.com |