Attached files
| file | filename |
|---|---|
| EX-99.1 - EXHIBIT 99.1 - STONERIDGE INC | v336955_ex99-1.htm |
| 8-K - FORM 8-K - STONERIDGE INC | v336955_8k.htm |

1 Stoneridge, Inc . Fourth Quarter 2012 Earnings Release Presentation March 1, 2013 Exhibit 99.2

Statements in this presentation that are not historical facts (including, but not limited to, 2013 net sales guidance) are forward - looking statements, which involve risks and uncertainties that could cause actual events or results to differ materially from those expressed or implied by the statements. Important factors that may cause actual results to differ materially from those in the forward - looking statements include, among other factors, the loss or bankruptcy of a major customer; the costs and timing of facility closures, business realignment or similar actions; a significant change in medium - and heavy - duty truck, automotive or agricultural and off - highway vehicle production; our ability to achieve cost reductions that offset or exceed customer - mandated selling price reductions; a significant change in general economic conditions in any of the various countries in which Stoneridge operates; labor disruptions at Stoneridge’s facilities or at any of Stoneridge’s significant customers or suppliers; the ability of suppliers to supply Stoneridge with parts and components at competitive prices on a timely basis; the amount of Stoneridge’s indebtedness and the restrictive covenants contained in the agreements governing its indebtedness, including its asset - based credit facility and senior secured notes; customer acceptance of new products; capital availability or costs, including changes in interest rates or market perceptions; the failure to achieve successful integration of any acquired company or business; the occurrence or non - occurrence of circumstances beyond Stoneridge’s control; and the items described in “Risk Factors” and other uncertainties or risks discussed in Stoneridge’s periodic and current reports filed with the Securities and Exchange Commission. Important factors that could cause the performance of the commercial vehicle and automotive industry to differ materially from those in the forward - looking statements include factors such as (1) continued economic instability or poor economic conditions in the United States and global markets, (2) changes in economic conditions, housing prices, foreign currency exchange rates, commodity prices, including shortages of and increases or volatility in the price of oil, (3) changes in laws and regulations, (4) the state of the credit markets, (5) political stability, (6) international conflicts and (7) the occurrence of force majeure events. Forward Looking Statements

Forward Looking Statements ( con’t ) These factors should not be construed as exhaustive and should be considered with the other cautionary statements in Stoneridge’s filings with the Securities and Exchange Commission. Forward - looking statements are not guarantees of future performance; Stoneridge’s actual results of operations, financial condition and liquidity, and the development of the industry in which Stoneridge operates may differ materially from those described in or suggested by the forward - looking statements contained in this presentation. In addition, even if Stoneridge’s results of operations, financial condition and liquidity, and the development of the industry in which Stoneridge operates are consistent with the forward - looking statements contained in this presentation, those results or developments may not be indicative of results or developments in subsequent periods. This presentation contains time - sensitive information that reflects management’s best analysis only as of the date of this presentation. Any forward - looking statements in this presentation speak only as of the date of this presentation, and Stoneridge undertakes no obligation to update such statements. Comparisons of results for current and any prior periods are not intended to express any future trends or indications of future performance, unless expressed as such, and should only be viewed as historical data. Stoneridge does not undertake any obligation to publicly update or revise any forward - looking statement as a result of new information, future events or otherwise, except as otherwise required by law.

Sales, Gross Profit, & Op Income – 4Q11 vs 4Q12 4Q11 4Q12 SRI Variance millions SRI Core PST Ops PST PPA SRI $ % Sales 186.0 178.3 44.5 0.0 222.7 36.7 19.7% COGS 153.7 143.1 24.8 0.3 168.1 14.4 9.4% Gross Profit 32.3 35.2 19.7 (0.3) 54.6 22.3 69.0% GP % to Sales 17.4% 19.7% 44.3% 24.5% SGA 39.9 29.5 15.2 1.3 46.0 6.1 15.2% SGA % to Sales 21.4% 16.6% 34.1% 20.6% Op Income (7.6) 5.6 4.6 (1.6) 8.6 16.2 214.0% OI % to Sales -4.1% 3.2% 10.3% 3.9% 44.5 25.0 19.4 16.4 3.0 178.3 143.1 35.2 29.5 5.6 0% 20% 40% 60% 80% 100% Sales COGS Gross Profit SGA Op Income PST Core

13,126 15,414 2011 2012 Thousands North American Light Vehicle Production Source: IHS January 2013 3,381 3,124 3,182 3,439 3,964 3,987 3,668 3,795 (7.6)% 1.9% 8.1% 15.3% 0.6% (8.0)% 3.5% Q1 2011 Q2 2011 Q3 2011 Q4 2011 Q1 2012 Q2 2012 Q3 2012 Q4 2012 Thousands Auto Qtr vs Qtr % ∆ ↑ 17.4% Guidance derived from customers EDI demand and adjusted for known production estimate changes

166,998 185,026 2011 2012 N.A. Medium Duty Truck Production Source: LMC January 2013 (previous JD Power) 40,135 44,760 41,834 40,269 48,200 49,903 42,422 44,501 11.5% (6.5)% (3.7)% 19.7% 3.5% (15.0)% 4.9% Q1 2011 Q2 2011 Q3 2011 Q4 2011 Q1 2012 Q2 2012 Q3 2012 Q4 2012 NA N.A. Qtr vs Qtr % ∆ ↑ 10.8% Guidance derived from customers EDI demand and adjusted for known production estimate changes
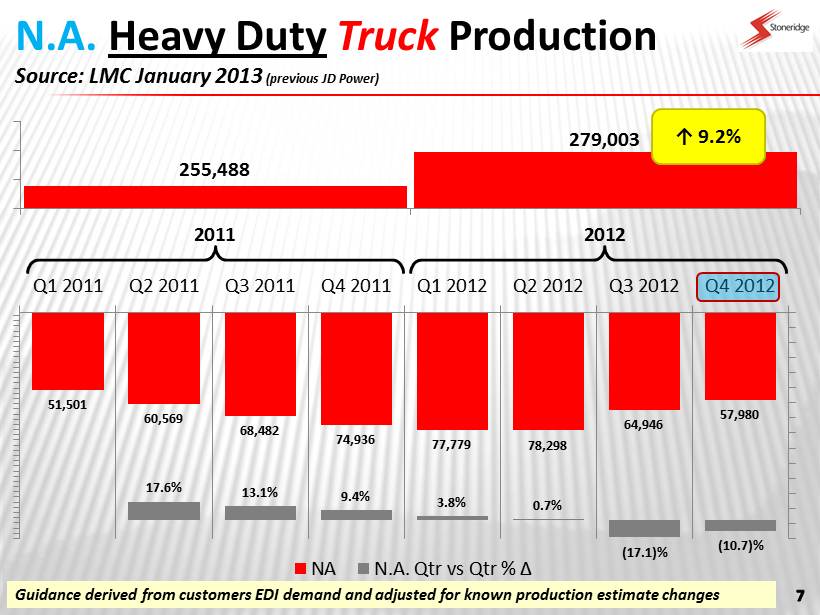
255,488 279,003 2011 2012 N.A. Heavy Duty Truck Production Source: LMC January 2013 (previous JD Power) 51,501 60,569 68,482 74,936 77,779 78,298 64,946 57,980 17.6% 13.1% 9.4% 3.8% 0.7% (17.1)% (10.7)% Q1 2011 Q2 2011 Q3 2011 Q4 2011 Q1 2012 Q2 2012 Q3 2012 Q4 2012 NA N.A. Qtr vs Qtr % ∆ ↑ 9.2% Guidance derived from customers EDI demand and adjusted for known production estimate changes

334,357 301,550 2011 2012 W Europe Heavy Duty Truck Production Source: LMC January 2013 (previous JD Power) 83,415 82,813 76,569 91,560 76,822 76,999 70,796 76,933 (0.7)% (7.5)% 19.6% (16.1)% 0.2% (8.1)% 8.7% Q1 2011 Q2 2011 Q3 2011 Q4 2011 Q1 2012 Q2 2012 Q3 2012 Q4 2012 Europe Europe Qtr vs Qtr % ∆ ↓ (9.8)% Guidance derived from customers EDI demand and adjusted for known production estimate changes

Sales by Segment – 4Q12 vs 4Q11 4Q11 CD ELECT PST SRI CD ELECT PST SRI PassCar/Lt Truck 49.7 0.5 - 50.2 46.5 3.7 - 50.2 Med/HD Truck 6.1 80.5 - 86.6 6.3 90.9 - 97.2 Ag 3.7 32.5 - 36.2 3.9 30.7 - 34.7 Other 4.4 0.7 46.6 51.7 5.0 (0.9) - 4.0 Total 63.8 114.2 46.6 224.6 61.7 124.3 - 186.0 4Q12 Variance % 4Q12 vs 4Q11 CD ELECT PST SRI CD ELECT PST SRI PassCar/Lt Truck 3.1 (3.2) 0.0 (0.0) 6.7 % (86.1)% 0.0 % (0.1)% Med/HD Truck (0.2) (10.4) 0.0 (10.6) (3.7)% (11.4)% 0.0 % (10.9)% Ag (0.2) 1.7 0.0 1.5 (5.3)% 5.6 % 0.0 % 4.4 % Other (0.6) 1.7 46.6 47.6 (12.0)% 177.9 % 100.0 % 1183.2 % Total 2.1 (10.2) 46.6 38.5 3.4 % (8.2)% 0.0 % 20.7 % 4Q12 vs 4Q11 Variance $

Financial / Market Volatility Issues & Cost Initiatives Management Response • Generated annualized benefits in 4Q12 of $6.0 million. • Estimated Incremental 2013 Year over Year Benefits of $5.2 million. North America & Europe Cost Initiatives Implemented in 2 nd & 3 rd Qtr Wiring Operations Improvement Improved Pricing & Direct Material Initiatives • Cost Initiatives Implemented in April & May • Market Recovered from 2 nd Qtr Trough • Expect Incremental 2013 Year over Year benefit of $6.0 million • Improved Sales Mix Led to Gross Margin Improvements Brazil • PST / Wiring Operations $28.1 mm Inventory Reductions • $65.7 million Total Debt Reduction $38.0 ABL Line & $29.7 for PST Debt Reductions Rapidly Changing Business Environment Weakness in European CV Market Exposure to Large North American CV OEM Weakening Brazilian Economy – GNP Growth fell to 1.0% to 1.2% Volatile Exchange Rates • Brazilian Real – Weakened from R$1.76 in 1 st Qtr to R$2.05 • Indian Rupee, Mexican Peso, Euro / Swedish Krona
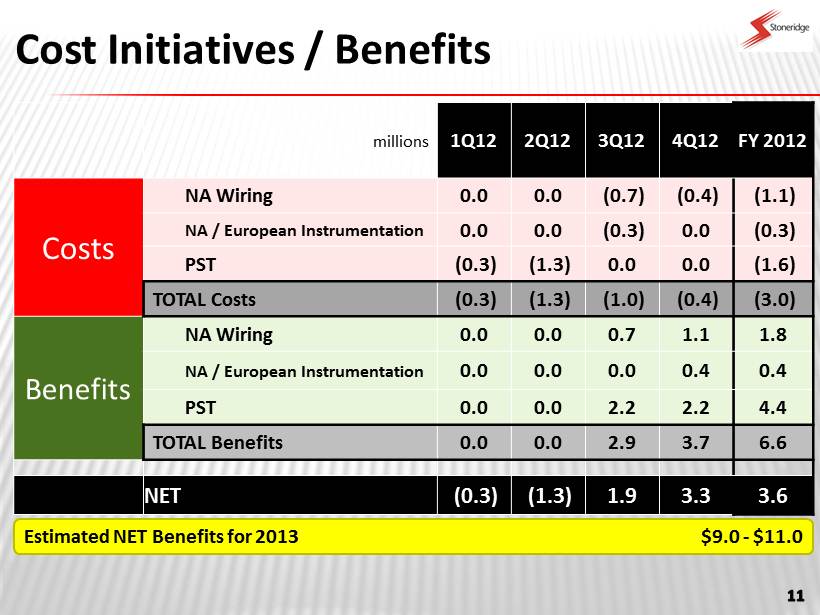
Cost Initiatives / Benefits millions 1Q12 2Q12 3Q12 4Q12 FY 2012 Costs NA Wiring 0.0 0.0 (0.7) (0.4) (1.1) NA / European Instrumentation 0.0 0.0 (0.3) 0.0 (0.3) PST (0.3) (1.3) 0.0 0.0 (1.6) TOTAL Costs (0.3) (1.3) (1.0) (0.4) (3.0) Benefits NA Wiring 0.0 0.0 0.7 1.1 1.8 NA / European Instrumentation 0.0 0.0 0.0 0.4 0.4 PST 0.0 0.0 2.2 2.2 4.4 TOTAL Benefits 0.0 0.0 2.9 3.7 6.6 NET (0.3) (1.3) 1.9 3.3 3.6 Estimated NET Benefits for 2013 $9.0 - $11. 0
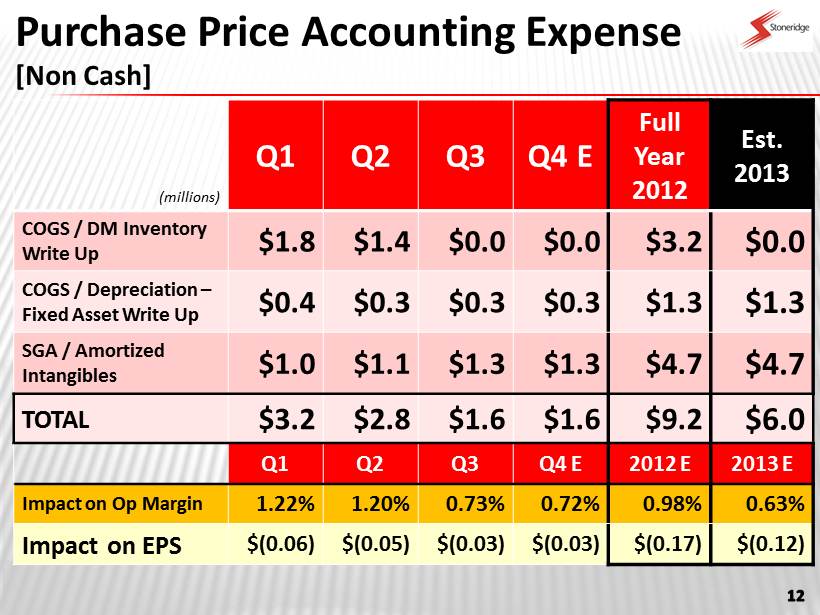
Purchase Price Accounting Expense [Non Cash] (millions) Q1 Q2 Q3 Q4 E Full Year 2012 Est. 2013 COGS / DM Inventory Write Up $1.8 $1.4 $0.0 $0.0 $3.2 $0.0 COGS / Depreciation – Fixed Asset Write Up $0.4 $0.3 $0.3 $0.3 $1.3 $1.3 SGA / Amortized Intangibles $1.0 $1.1 $1.3 $1.3 $4.7 $4.7 TOTAL $3.2 $2.8 $1.6 $1.6 $9.2 $6.0 Q1 Q2 Q3 Q4 E 2012 E 2013 E Impact on Op Margin 1.22% 1.20% 0.73% 0.72% 0.98% 0.63% Impact on EPS $(0.06) $(0.05) $(0.03) $(0.03) $(0.17) $(0.12)
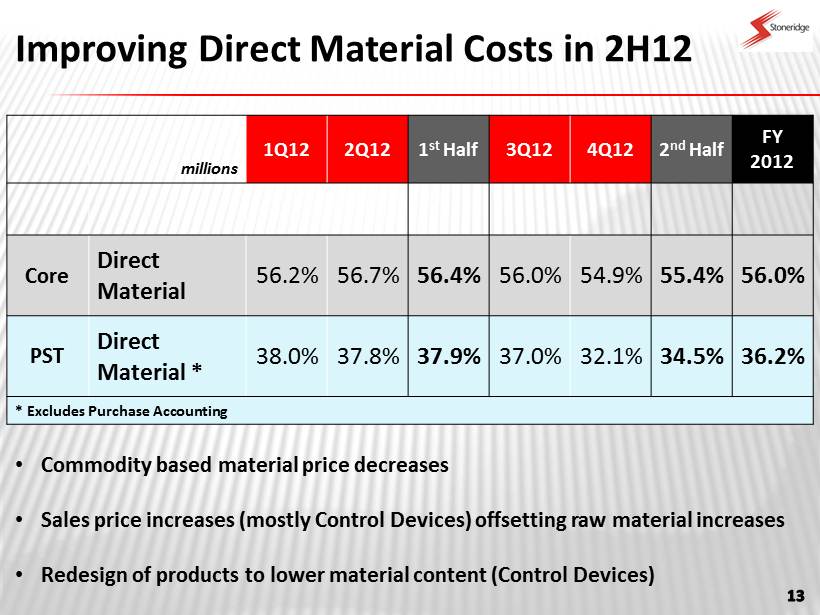
Improving Direct Material Costs in 2H12 millions 1Q12 2Q12 1 st Half 3Q12 4Q12 2 nd Half FY 2012 Core Direct Material 56.2% 56.7% 56.4% 56.0% 54.9% 55.4% 56.0% PST Direct Material * 38.0% 37.8% 37.9% 37.0% 32.1% 34.5% 36.2% * Excludes Purchase Accounting • Commodity based material price decreases • Sales price increases (mostly Control Devices) offsetting raw material increases • Redesign of products to lower material content (Control Devices)
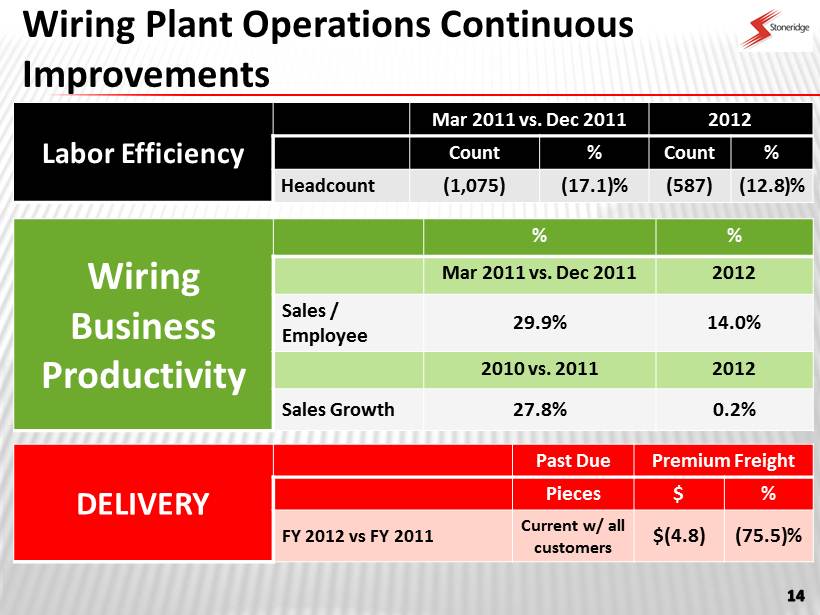
Wiring Plant Operations Continuous Improvements DELIVERY Past Due Premium Freight Pieces $ % FY 2012 vs FY 2011 Current w/ all customers $(4.8) (75.5)% Labor Efficiency Mar 2011 vs. Dec 2011 2012 Count % Count % Headcount (1,075) (17.1)% (587) (12.8)% Wiring Business Productivity % % Mar 2011 vs. Dec 2011 2012 Sales / Employee 29.9% 14.0% 2010 vs. 2011 2012 Sales Growth 27.8% 0.2%
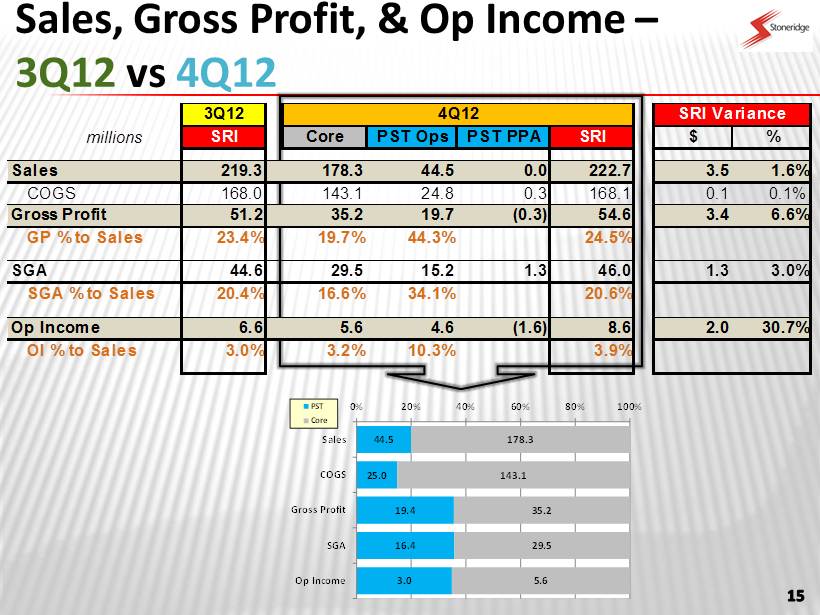
Sales, Gross Profit, & Op Income – 3Q12 vs 4Q12 3Q12 4Q12 SRI Variance millions SRI Core PST Ops PST PPA SRI $ % Sales 219.3 178.3 44.5 0.0 222.7 3.5 1.6% COGS 168.0 143.1 24.8 0.3 168.1 0.1 0.1% Gross Profit 51.2 35.2 19.7 (0.3) 54.6 3.4 6.6% GP % to Sales 23.4% 19.7% 44.3% 24.5% SGA 44.6 29.5 15.2 1.3 46.0 1.3 3.0% SGA % to Sales 20.4% 16.6% 34.1% 20.6% Op Income 6.6 5.6 4.6 (1.6) 8.6 2.0 30.7% OI % to Sales 3.0% 3.2% 10.3% 3.9% 44.5 25.0 19.4 16.4 3.0 178.3 143.1 35.2 29.5 5.6 0% 20% 40% 60% 80% 100% Sales COGS Gross Profit SGA Op Income PST Core

Sales by Segment – 4Q12 vs 3Q12 3Q12 CD ELECT PST SRI CD ELECT PST SRI PassCar/Lt Truck 49.7 0.5 - 50.2 48.5 0.9 - 49.5 Med/HD Truck 6.1 80.5 - 86.6 8.5 78.7 - 87.2 Ag 3.7 32.5 - 36.2 3.8 30.9 - 34.8 Other 4.4 0.7 46.6 51.7 3.9 0.1 43.8 47.8 Total 63.8 114.2 46.6 224.6 64.8 110.7 43.8 219.3 4Q12 Variance $ Variance % 4Q12 vs 3Q12 CD ELECT PST SRI CD ELECT PST SRI PassCar/Lt Truck 1.1 (0.4) 0.0 0.7 2.3 % (46.4)% 0.0 % 1.4 % Med/HD Truck (2.5) 1.8 0.0 (0.7) (28.9)% 2.3 % 0.0 % (0.8)% Ag (0.1) 1.5 0.0 1.4 (3.1)% 5.0 % 0.0 % 4.1 % Other 0.5 0.6 2.8 3.9 12.5 % 428.9 % 6.4 % 8.1 % Total (1.0) 3.5 2.8 5.3 (1.5)% 3.1 % 6.4 % 2.4 % 4Q12 vs 3Q12

3Q12 vs 4Q12 EPS Bridge PST Impacts SRI Core TOTAL Volume 0.01 0.03 0.04 Mix / Direct Material 0.03 (0.03) 0.00 FX 0.00 0.00 0.00 SGA Drop / Cost Reduction 0.00 0.05 0.05 PST Cost Reduct / Purchase Acctg (0.01) 0.00 (0.01) TOTAL 0.05 0.05 0.10 0.10 (0.01) 0.05 0.00 0.00 0.04 0.02 4Q12 Actual EPS PST Cost Reduct / Purchase Acctg SGA Drop / Cost Reduction FX Mix / Direct Material Volume 3Q12 Actual EPS

Cash Flow 18 Stoneridge, Inc. ACTUAL ACTUAL ACTUAL ACTUAL ACTUAL ACTUAL values in [millions] 2011 1Q12 2Q12 3Q12 4Q12 2012 Beginning Cash 72.0 78.7 42.9 39.2 35.6 78.7 Consolidated Net Income 45.5 5.7 (5.3) 0.6 2.7 3.7 Depreciation / Amortization 20.0 9.0 9.1 9.0 8.3 35.3 WC (45.4) (6.8) 8.6 5.6 25.8 33.2 Other (19.1) (2.1) (2.9) 9.5 (1.2) 3.3 Cash Flow from Operations 0.9 5.9 9.5 24.7 35.5 75.5 Capital Expenditures (26.3) (6.8) (7.6) (5.9) (6.1) (26.4) Free Cash Flow (25.4) (1.0) 1.9 18.8 29.4 49.2 Ending Cash 78.7 42.9 39.2 35.6 44.6 44.6 Long Term Debt - Proceeds / Repayment 38.9 (16.2) (4.2) (23.3) (20.5) (64.2)

Debt / Net Debt (millions USD) 4Q11 1Q12 2Q12 3Q12 2012 Total Debt $267.1 $253.2 $244.9 $222.3 $201.4 Net Debt $188.4 $210.2 $205.8 $186.7 $156.8 Total Debt / EBITDA 3.5 x 1 2.9 x 3.3 x ABL Balance $38.0 $31.0 $25.0 $11.0 $0.0 Brazil Debt $54.1 $47.2 $43.8 $34.2 $24.4 EBITDA = Operating Income + Depreciation + Amortization + Purchase Accounting Direct Material 1 Proforma for PST Debt and EBITDA

2013 Guidance Sales [millions] Operating Margin EPS Gross Margin Core $765 - $785 21.5% - 23.0% 4.5% – 5.5% PST (2013 Rate 2.05) $174 – $184 44.0% - 47.0% 4.5% - 5.5% * SRI $939 - $974 25.5% - 27.0% 4.5% - 5.5% * $0.75 - $0.95 8.4% - 9.2% EBITDA ** * Includes Purchase Accounting Expenses of $6.0 million Reconciliation of Operating Margin to Adjusted EBITDA Margin: Operating Margin Depreciation Amortization EBITDA ** Margin 4.5% - 5.5% 3.3% - 3.1% 0.60% 8.4% - 9.2% Long Term Objectives Annual Sales Growth 6% - 8% Gross Margin 25% - 27% Operating Income 8% - 9% ROIC > 15%
