Attached files
| file | filename |
|---|---|
| 8-K - FORM 8-K - EQUITY ONE, INC. | d498118d8k.htm |
 Investor Presentation
March 2013
Exhibit 99.1 |
 1
Forward Looking Statements
Certain matters discussed by Equity One in this presentation constitute forward-looking
statements within the meaning of the federal securities laws. Although Equity
One believes that the expectations reflected in such forward-looking
statements
are
based
upon
reasonable
assumptions,
it
can
give
no
assurance
that
these
expectations will be achieved. Factors that could cause actual results to differ materially
from current expectations include volatility of the capital markets; changes in
macro-economic and local economic conditions and the demand for retail space in
the states and communities in which Equity One owns properties; the continuing financial success
of Equity One’s current and prospective tenants and their decisions regarding store
locations, especially certain key current tenants; the risks that Equity One may not
be able to proceed with or obtain necessary approvals for development or
redevelopment projects or that it may take more time to complete such projects or incur costs
greater than anticipated; the availability of properties for acquisition; changes in
borrowing rates; the ability to sell non-core
assets
at
favorable
pricing;
the
extent
to
which
continuing
supply
constraints
occur
in
geographic
markets
where Equity One owns properties; the success of its efforts to lease up vacant space and
renew expiring leases at favorable
terms;
the
effects
of
natural
and
other
disasters;
the
ability
of
Equity
One
to
successfully
integrate
the
operations
and
systems
of
acquired
companies
and
properties;
the
loss
of
key
personnel;
the
ability
to
meet
its
substantial
debt
obligations
and
remain
compliant
with
financial
covenants;
continuing
to
meet
the
qualifications
as
a
REIT;
changes
in
Equity
One’s
credit
ratings;
and
other
risks,
which
are
described
in
Equity
One’s
filings
with
the
Securities and Exchange Commission.
This presentation also contains non-GAAP financial measures, including Funds from
Operations, or FFO. Reconciliations of these non-GAAP financial measures to the
most directly comparable GAAP measures can be found
in
Equity
One’s
quarterly
supplemental
information
package
and
in
filings
made
with
the
SEC
which
are
available on its website at www.equityone.net. This presentation also contains case
studies which include computations of estimated yield and value creation from
investment activities, and such estimates include assumptions of capital investments
and current and prospective property valuations and therefore the actual increase in
value that may be realized upon a future sale of such property may be materially different than the
estimates made. |
 Mission Statement
2
Improving retail real estate in urban communities |
 Corporate Snapshot
3
Equity One owns, manages, acquires, develops and redevelops quality retail properties
located in supply constrained communities primarily in major coastal markets of the
United States As
of
year
end
2012,
we
owned
143
operating
properties
in
13
states
(1)
As a result of our capital recycling program we have significantly improved our geographic
diversification and portfolio demographics
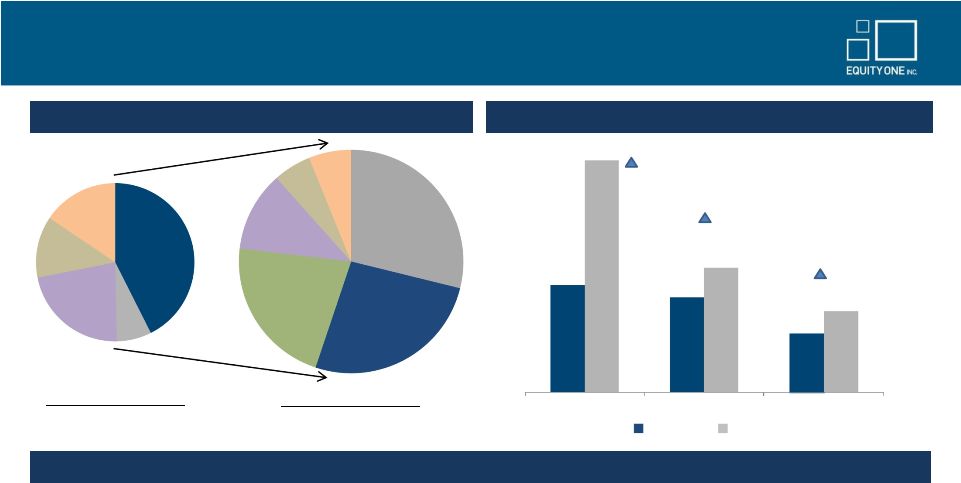
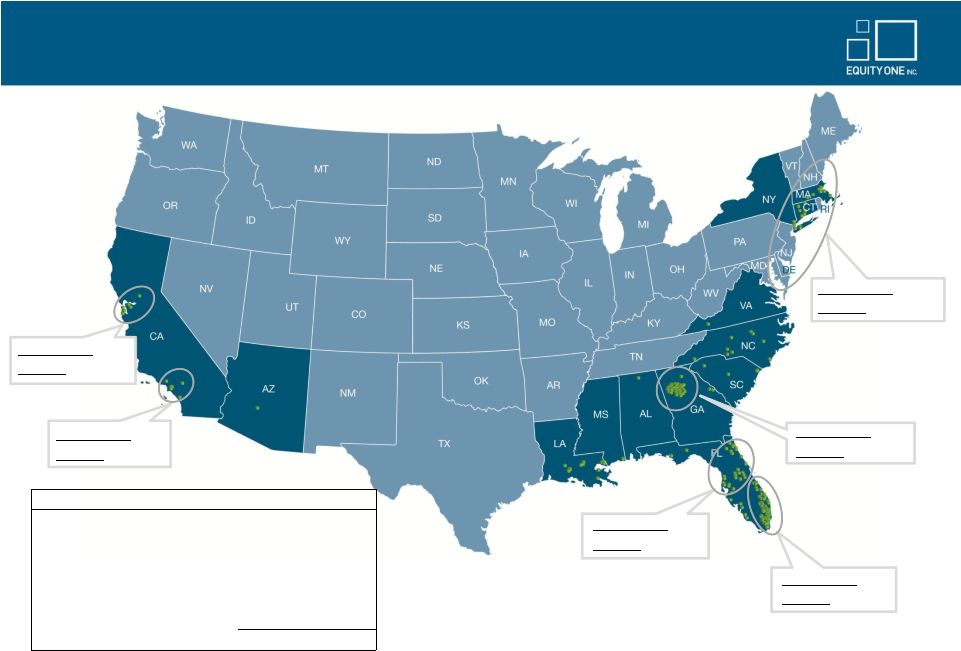
Our largest geographic markets as measured by approximate fair market values are Northeast
(29%), South Florida
(26%)
and
California
(22%)
(2)
–
Non-core
markets
in
the
Southeast
and
Florida
now
represent
only
11%
of
our
portfolio
Our
properties
have
average
population
density
within
3
miles
of
178k
and
average
household
income
within
3
miles of $96k
(3)
Our
total
equity
capitalization
and
total
enterprise
value
as
of
12/31/2012
were
$2.7
billion
and
$4.3
billion,
respectively
We
have
investment
grade
credit
ratings
of
Baa2
(stable)
from
Moody’s
and
BBB-
(stable)
from
S&P
(1)
Includes acquisitions and dispositions under contract as of 12/31/2012.
Excludes land and non-core assets not associated with retail centers. Additionally, we have joint
venture interests in twenty retail properties and two office buildings totaling
approximately 3.3 million sf. (2)
Based on total estimated fair value as of 12/31/2012. Includes acquisitions
and dispositions under contract as of 12/31/2012. Excludes land. Does not include
unconsolidated JV properties.
(3)
Demographic data based on weighted estimated fair market value of assets. Includes
acquisitions and dispositions under contract as of 12/31/2012. Source: Sites USA.
•
•
•
•
•
•
•
Our portfolio generates grocer sales in excess of $550 per square foot
• |
 Investment Considerations
4
Proven management team that has successfully executed a stated transformation strategy to
become a national operator in attractive major metropolitan markets
Focused investment strategy within geographically diversified major coastal markets
Prudent
capital
recycling
which
significantly
improved
portfolio
quality
while
maintaining
financial
discipline
High quality, productive grocery anchored shopping centers located in markets with
attractive demographics Intensive focus on asset management and value creation
Attractive pipeline of redevelopment opportunities
Many anchor leases with below market rents and short term expirations
Diversified base of strong anchor tenants with only Publix accounting for more than 6% of
AMR Percentage rent comprises less than 1.5% of total revenue
Strong balance sheet with modest leverage, ample liquidity and well-laddered debt
maturities Financial capacity and proven ability to execute on additional opportunistic acquisitions
and redevelopments We are a premier operator of quality retail properties
and are positioned for continued growth •
•
•
•
•
•
•
•
•
•
• |
 Northeast
29%
South Florida
26%
California
22%
Central/
North Florida
12%
Atlanta
5%
Other
6%
South Florida
43%
Northeast
7%
Central/
North Florida
22%
Atlanta
12%
Other
16%
82,368
$72,878
178,387
$95,986
$406
$558
117%
32%
37%
Dec 2008
Dec 2012
3-mile population
3
mile avg. HH income
Grocery sales per sq.ft.
Asset Composition by Region
(1)(2)
Portfolio Quality Metrics in 2012 vs. 2008
(3)
Significant Investment Activity has Transformed the Portfolio
Dec 2008 Portfolio
$2,365 Million
Dec 2012 Portfolio
$3,618 Million
Approximately
$2
billion
of
acquisitions
completed
since
2009
in
our
target
markets:
–
Approximately $1.1
billion of assets in West Coast markets –
Approximately $700
million of premium quality assets in Northeast portfolio –
Substantially completed ground up development of The Gallery at Westbury Plaza in Nassau
County, NY Sold approximately $900 million of non-strategic/non-core assets since 2009, the
most prominent being: –
$473 million sale of 36 non-strategic retail assets to Blackstone
–
$191 million asset dispositions related to non-retail CapCo assets
Equity One Transformation
5
•
•
(1)
Data includes non-core assets within each identified region. (2)
Data includes acquisitions and dispositions under contract as of 12/31/2012. Excludes land and
non-core assets not associated with retail centers. Based on IFRS fair market values
as of 12/31/2012. (3)
Demographic data based on weighted estimated fair market value of assets. Includes acquisitions
and dispositions under contract as of 12/31/2012. Source: Sites USA. |
 Assets
Primarily Located in Major Coastal Markets 6
Region
$ FMV
(1)
% FMV
Northeast
$1,043
29%
South Florida
$952
26%
West Coast
$812
22%
North Florida
$255
7%
Southeast (Atlanta)
$172
5%
Non-Core (Southeast, Florida)
$384
11%
Total
$3,618
100%
(1)
Data
includes
acquisitions
and
dispositions
under
contract
as
of
12/31/2012.
Excludes
land
and
non-core
assets
not
associated
with
retail
centers.
IFRS
fair
market
values are as of 12/31/2012.
Estimated
FMV:
$602
% of FMV: 17%
Estimated
FMV:
$185
% of FMV: 5%
Estimated
FMV:
$1,043
% of FMV: 29%
Estimated
FMV:
$172
% of FMV: 5%
Estimated
FMV:
$952
% of FMV: 26%
Estimated
FMV:
$255
% of FMV: 7%
($ In Millions) |
 2013
Strategic Goals 7
Meet or exceed fundamental operating goals
SS NOI growth + 2% to 3%
SS Occupancy + 50 to 100 bps
Recurring FFO per fully diluted share $1.18 to $1.22
Continue to upgrade portfolio quality and demographic profile through strategic
transactions Core acquisition activity of $100 to $200 million
Non-core asset dispositions of $300 million
JV acquisition activity of $100 to $200 million
Continue to strengthen development and redevelopment pipeline
Complete lease up of The Gallery at Westbury Plaza
Significantly advance construction at the Broadway Plaza site in
the Bronx, NY
Establish additional redevelopment and densification plans at Serramonte Center in Daly
City, CA –
Substantially complete Dick’s Sporting Goods (83k sf) at a cost of $18 million
–
Develop expansion plans to add entertainment wing (movie theatres, restaurants)
Close on the Westwood Complex in Bethesda and work on redevelopment plans
Maintain
low
leverage
(~40%
total
debt
to
gross
real
estate)
and
ample
liquidity
Continue to strengthen credit metrics and maintain large unencumbered asset base
Upgrade information technology systems –
implement IT strategic plan that is aligned with our
operational strategy
Operating
Fundamentals
Portfolio
Quality
Value
Creation
Balance Sheet
Management
Operations
•
•
•
•
•
•
•
•
•
• |
 Our
Path to Sustained NOI Growth 8
Increase occupancy with an emphasis on small shop space
Contractual rent steps
Below
market
leases
–
recent
acquisitions
provide
opportunity
to
capture
market
rents
in
coming
years
Increase
in
percentage
rent
–
higher
quality
assets
in
more
productive
markets
provide
greater
upside
Expense control and implementation of cost control initiatives within property
operations Continue to reduce concentration of assets in secondary and non-core markets
Expand tenant relations and marketing efforts with national and regional retailers
•
•
•
•
•
•
• |
 Enhancing Portfolio Value by Improving Portfolio Quality
9
We
plan
to
further
build
and
diversify
our
portfolio
into
supply
constrained
urban
markets
Recent
acquisitions
in
California
and
New
York
highlight our focused
approach
on
properties
which
meet
the
following
key
criteria
aimed
at
enhancing
the
quality
and
performance
of
our
overall
portfolio:
–
Strong
demographics
–
average
3-mile
populations
of
nearly
200,000
as
compared
to
Equity
One’s
historical
portfolio
average
of
approximately
80,000
–
Strong
barriers
to
entry
due
to
scarcity
of
land
and
strict
zoning
restrictions
–
Highly
productive
anchor
sales
volumes
–
Below
market
anchor
rents
–
Redevelopment
and
densification
opportunities
These
acquisitions
have
enabled
us
to
diversify
our
portfolio
into
higher
quality
centers
in
major
MSAs
which
will
ultimately
result
in
greater
stability
and
higher
internal
growth
•
•
• |
 Case
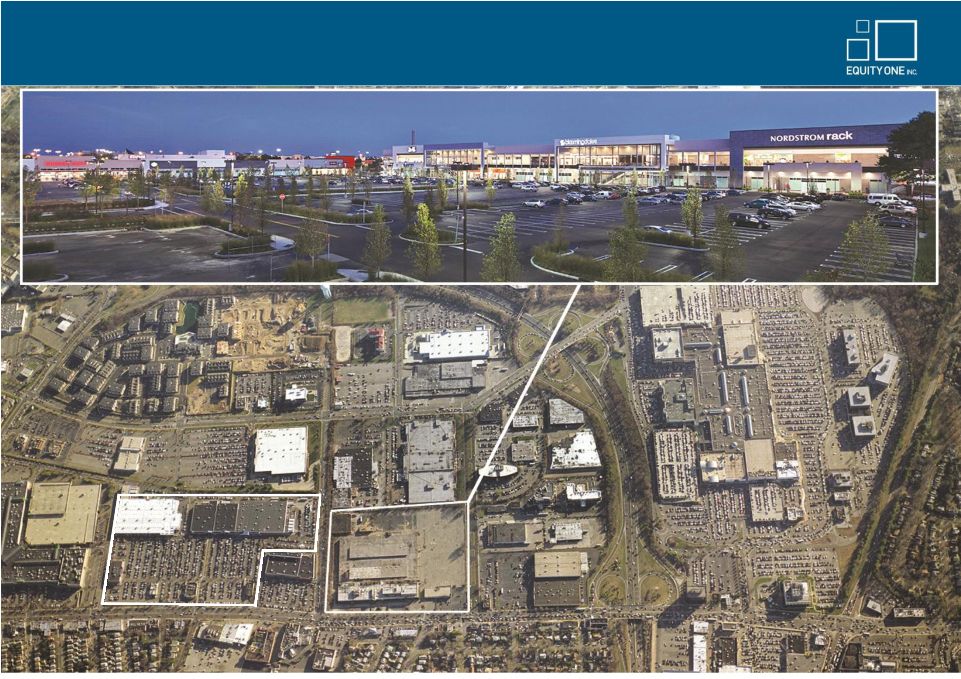
Study 1: Westbury Plaza & The Gallery at Westbury Plaza 10
In
October
2009,
acquired
Westbury
Plaza,
a
400k
sf
power
center
in
Nassau
County,
New
York
–
Marked Equity One’s entry into the New York metropolitan market
–
Major tenants include: Walmart, Costco, Sports Authority and Marshalls
–
Tenants
generate
annual
sales
we
believe
to
be
in
excess
of
$500
million
–
Purchase price of $104 million, generating a going-in yield of 8% with future
upside In November 2009, acquired 22 acre land parcel adjacent to Westbury Plaza
–
Obtained entitlements within 12 months to build The Gallery at Westbury Plaza, a 313k sf
regional shopping center
–
Developed unique design with two story, big-box retail and underground parking
–
Major tenants include: Trader Joe’s, The Container Store, Saks Off Fifth,
Bloomingdale’s Outlet, Nordstrom Rack, Gap Outlet, Banana Republic Outlet, Old
Navy, Ulta and Shake Shack –
Expecting 11% yield on $129 million in net costs
•
•
Investment Thesis: $233 million total capital investment, generating ~10%
blended stabilized yield, implying ~$175 million in value creation at a 5.5%
capitalization rate. |
 Case
Study 1: Westbury Plaza & The Gallery at Westbury Plaza 11
|
 Case
Study 2: Capital & Counties 12
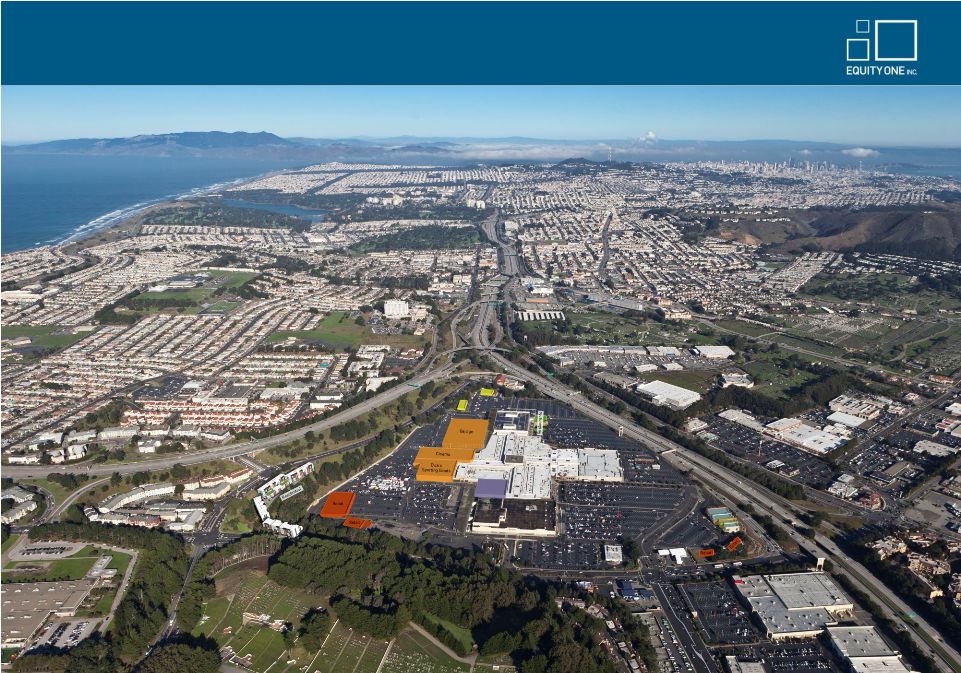
In May 2010, announced the acquisition of Capital & Counties, a $600 million California
portfolio of predominantly retail shopping centers
–
Largest asset is Serramonte Center, an 883k sf regional mall in Daly City, CA
–
Other retail assets include: Plaza Escuela in Walnut Creek, CA, Willows Shopping Center in
Concord, CA and The Marketplace in Davis, CA
–
Structured off-market stock transaction with seller becoming a 13% owner of Equity
One Marked Equity One’s entry into California
–
Provided critical mass for management platform and acted as catalyst for future
acquisitions including Potrero, Culver City and Long Beach
–
Positioned Equity One as one of the largest owners of open-air shopping centers in
California Transaction was accretive day one, but more importantly offered substantial value creation
opportunities –
Sold ~$200 million of non-core assets within 12 months, at pricing well in excess of
allocated values –
Increased retail occupancy from 83% at acquisition to 98% as of year end 2012
–
Redevelopment opportunities include Serramonte Center and Willows Shopping Center
•
•
•
Investment Thesis: ~$400 million net capital invested yielding ~8%, implying ~$180
million in value creation at a 5.5% capitalization rate. |
 Case
Study 2: Capital & Counties (Serramonte) 13
Expansion |
 Case
Study 3: Southern Connecticut 14
•
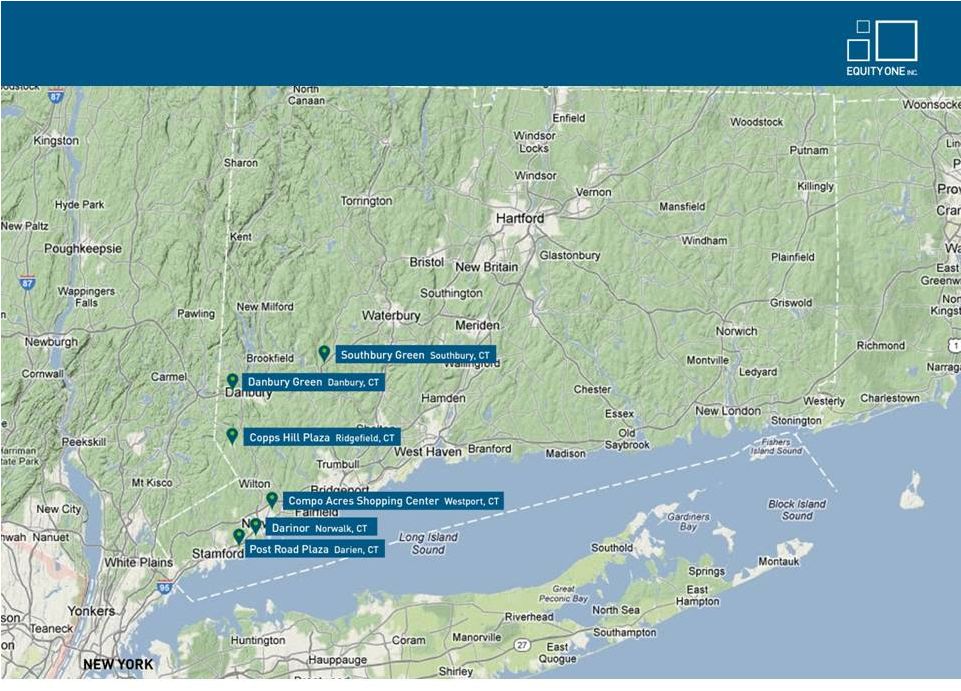
Since 2010, Equity One has acquired six properties in Southern Connecticut for $205
million •
Each center offers a value creation play
(1)
Ridgefield: Kohl’s pays $2.40 psf in rent, lease runs out of term in
2021 (2)
Danbury: 4,000 sf expansion opportunity, including Starbucks
drive-thru (3)
Southbury: 2,700 sf additional outparcel
(4)
Norwalk: 1,600 sf additional outparcel
(5)
Darien: Trader
Joe’s
expansion;
increased
bank
lease
from
$38
psf
to
$88
psf
(6)
Westport: Expanded Trader Joe’s, below market bank lease expiring in
2014 •
Centers are located in some of the most affluent markets in the New York
Metropolitan region, with an average HH income of $155k within 3 miles
Investment Thesis: $205 million initial investment at ~6% yield. Expect
to earn yield in excess of 7% beginning in 2015.
|
 Case
Study 3: Southern Connecticut 15 |
 Future
Case Study - New York City
16
•
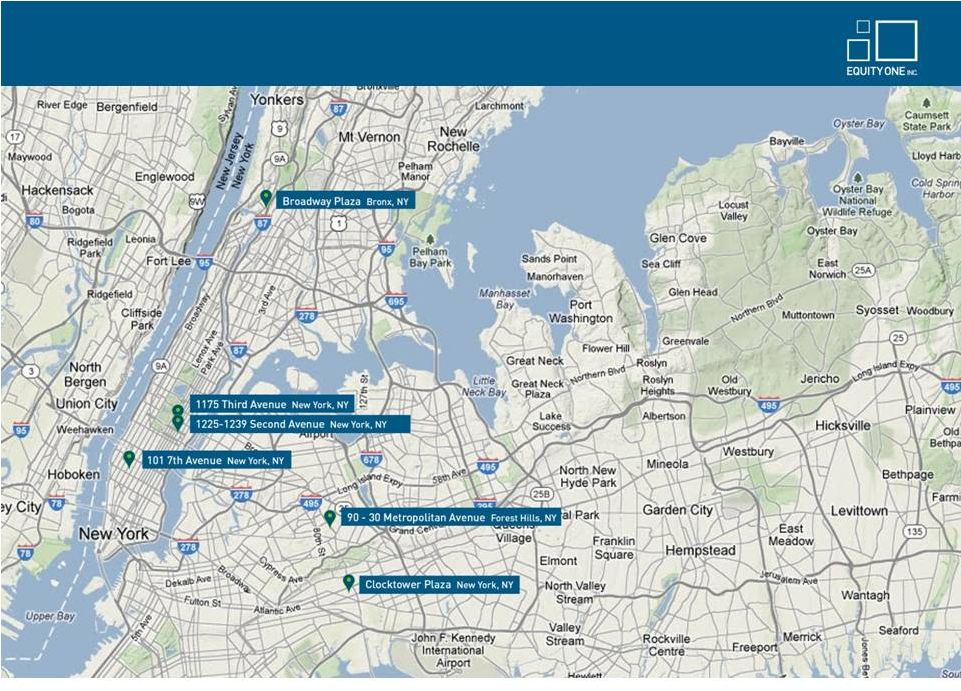
Equity
One
has
acquired
six
assets
for
$243
million
in
New
York
City,
including
the
planned
development
of
Broadway
Plaza
(1)
1175
Third
Avenue
(E
68
Street
&
3
Avenue)
–
In
2010,
purchased
25k
sf
retail
condominium
for
$21
million
–
Food
Emporium
pays
$40
psf;
market
rent
is
4x
greater
(2)
101
7
Avenue
(W
16
Street
&
7
Avenue)
–
In
2011,
purchased
57k
sf
retail
space
for
$55
million
–
Loehmann’s
lease
expires
in
2016
with
no
options
remaining
–
Contract
rent
is
$25
psf;
market
rent
is
4x
greater
(3)
90-30
Metropolitan
Avenue
–
In
2011,
acquired
60k
sf
Trader
Joe’s
anchored
center
for
$28.8
million
(4)
Broadway
Plaza
–
In
2012,
purchased
two
adjacent
land
parcels
totaling
2+
acres
for
$9.5
million
–
$55
million
planned
investment
in
ground-up
development
of
131k
sq
ft,
two-story,
multi-tenant
retail
center
–
Site
is
within
a
major
retail
corridor
served
by
subway,
buses
and
automobiles,
with
direct
access
off
the
Major
Deegan
Expressway
–
Strong
tenant
interest
from
box
retailers
(discounters,
fashion,
sporting
goods
and
gyms)
(5)
Clocktower
Plaza
–
In
2012,
purchased
79k
sq
ft
Pathmark
anchored
center
for
$56
million
–
Located
on
Atlantic
Avenue,
a
main
thoroughfare
in
Queens
–
Potential
to
expand
center
and
acquire
adjacent
properties
(6)
1225-1239
Second
Avenue
–
In
2012,
acquired
entire
retail
block
between
64th
and
65th
Streets
on
2nd
Avenue
for
$27.5
million
–
Anchored
by
CVS
and
7-
Eleven
Future
Investment
Thesis:
Within
3
years
we
expect
to
earn
a
7%
+
unleveraged
yield.
th
th
rd
th
th |
 Future Case Study -
New York City
17 |
 Future
Case Study - Bethesda, Maryland
18
•
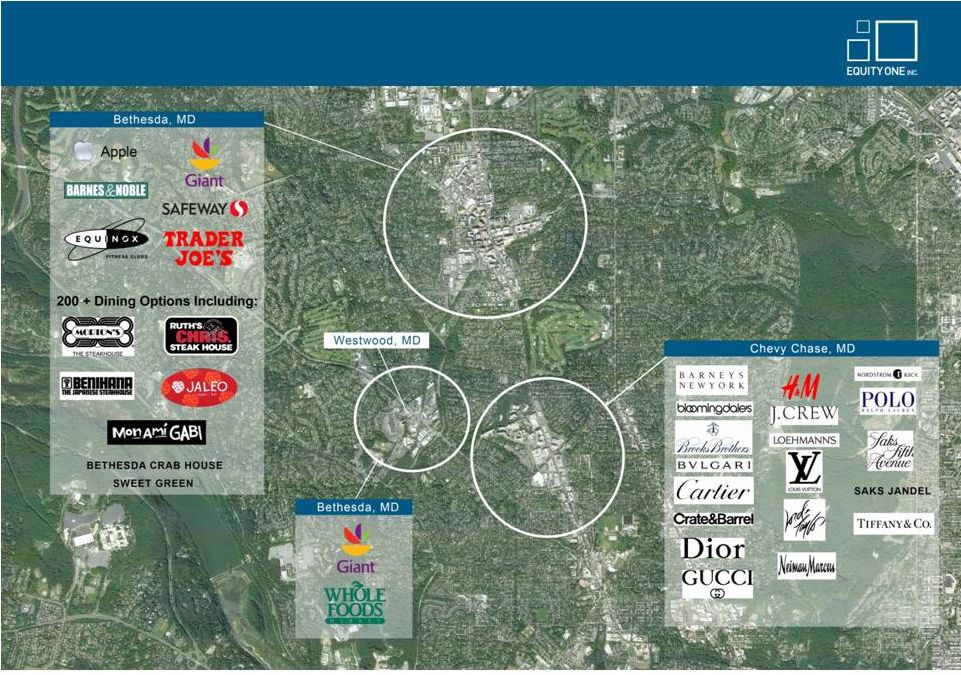
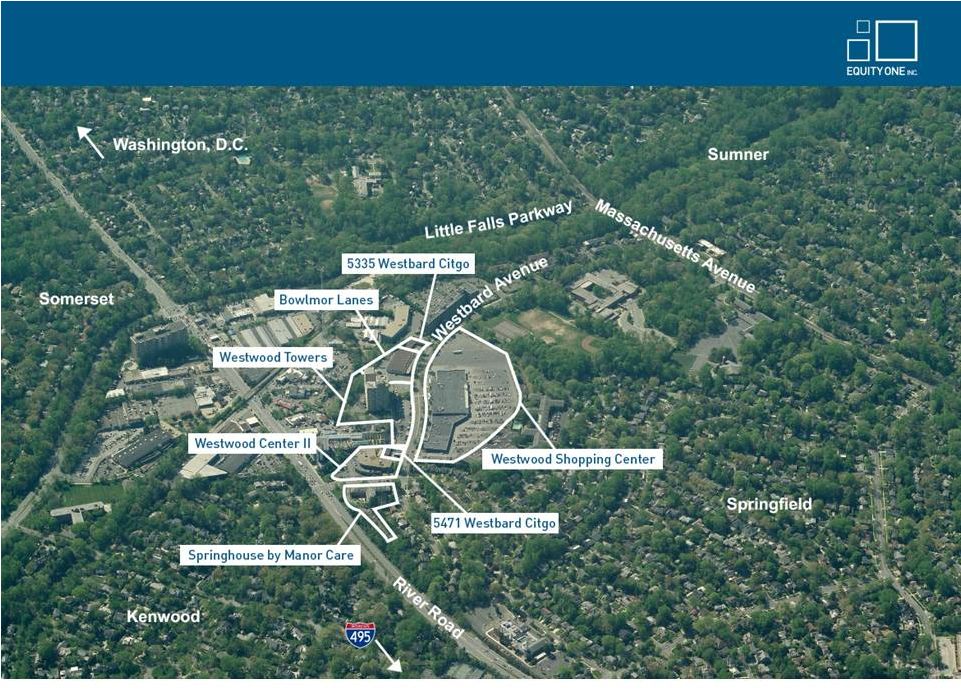
In 2012, announced agreement to acquire Westwood Complex, a 22 acre property in
Bethesda, MD for $140 million
–
215k sf of retail space in the highly affluent and supply constrained market
outside Washington, D.C. –
Superior demographics with 140k population within 3 miles and average household
income of $200k –
Structured as $95 million funded mortgage loan, with outright purchase of property
anticipated in early 2014
•
Significant opportunities for value creation through below market rents,
redevelopment and expansion –
Asset has only had one owner and will benefit from capital investment and
intensive asset management
–
Anchored
by
high
volume
Giant
Food
since
1959,
with
below
market
lease
expiring
2019
–
Main center has parking ratio of 10 spaces per 1,000 sf, more than double typical
shopping centers |
 Future Case Study -
Bethesda, Maryland
19 |
 Future Case Study -
Bethesda, Maryland
20 |
 Disciplined Growth While Improving Leverage Metrics
21
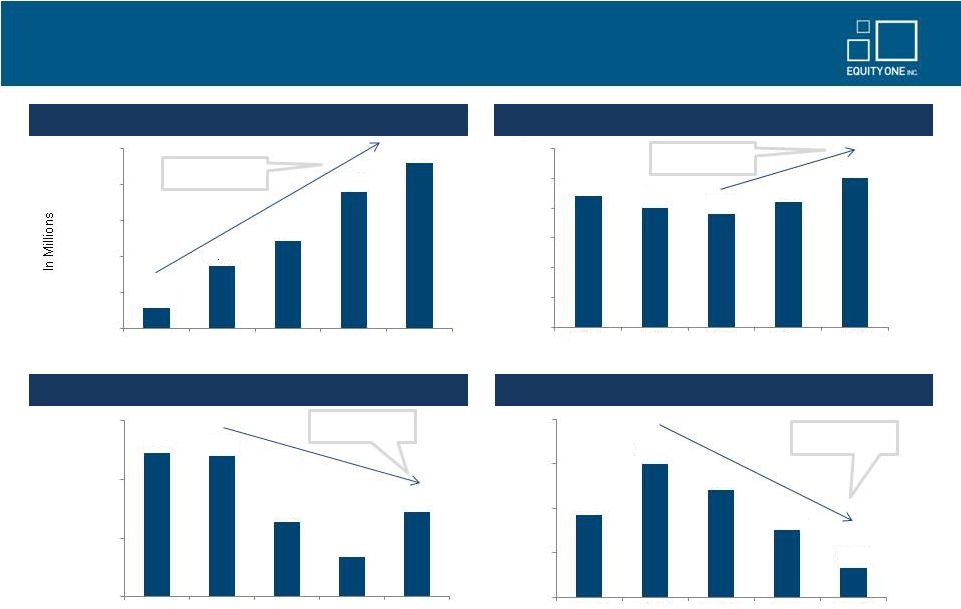
Gross Assets
(1)
Fixed Charge Coverage
(2)
Total Debt to Gross Real Estate
(3)
Secured Debt to Gross Real Estate
(3)
0.6x improvement
Reflects Westwood
at 100% leverage
(4)
72% increase in
Gross Assets
930 bps reduction
$4,000
$3,600
$3,200
$2,800
$2,000
$2,400
Dec-08
Dec-09
Dec-10
Dec-11
Dec-12
$2,232
$2,692
$2,970
$3,518
$3,839
3.0x
2.5x
2.0x
1.5x
1.0x
0.5x
0.0x
2.2x
2.0x
1.9x
2.1x
2.5x
2008
2009
2010
2011
2012
52.0%
48.0%
44.0%
40.0%
49.8%
49.6%
45.1%
42.7%
45.8%
Dec-08
Dec-09
Dec-10
Dec-11
Dec-12
26.0%
22.0%
18.0%
14.0%
10.0%
Dec-08
Dec-09
Dec-10
Dec-11
Dec-12
17.4%
22.0%
19.6%
16.1%
12.7%
(1)
Gross Assets represents Total Assets plus Accumulated Depreciation. (2)
Represents Adjusted EBITDA to Fixed Charges. Adjusted EBITDA excludes gains/losses on property sales,
debt extinguishment, impairments, and other non-recurring items. (3)
Gross Real Estate represents Total Real Estate Assets plus Accumulated Depreciation. (4)
Ratio at December 31, 2012 includes Westwood Complex $95 million note in both Total Debt and Gross
Real Estate. |
 Balance Sheet Discipline –
Modest Leverage With Strong
Coverage Metrics
22
•
(1)
Based on Net Debt as of 12/31/2012 and Adjusted EBITDA (excluding gains/losses on
property sales, debt extinguishment, impairments, and other non-recurring items)
calculated by annualizing 4Q2012 Adjusted EBITDA as reported in the 12/31/2012
Supplement. (2)
Source: Eastdil Secured, based on Company filings and SNL financial. Credit
ratings from S&P and Moody's as of 12/31/2012. Q4
2012
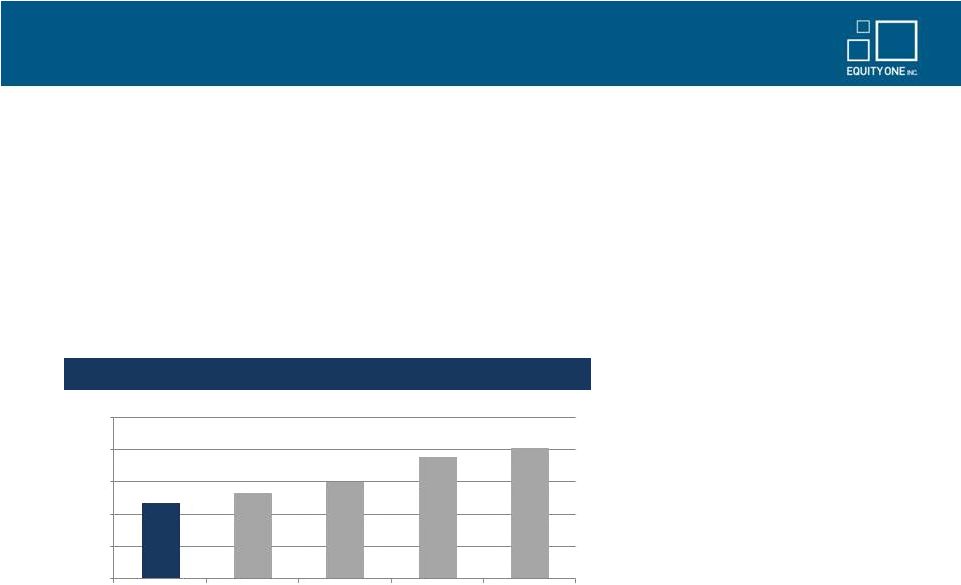
Leverage
(Total
Debt
+
Preferred
/
Gross
Assets)
(2)
55.0%
50.0%
45.0%
40.0%
35.0%
30.0%
EQY (BBB-/Baa2)
FRT (BBB+/Baa1)
KIM (BBB+/Baa1)
REG (BBB/Baa3)
WRI (BBB/Baa2)
Key leverage ratios as of December 31, 2012
–
Net Debt to Total Market Cap: 36.4%
–
Net Debt to Gross Real Estate: 45.0%
–
Net
Debt
to
Adjusted
EBITDA
(1)
: 7.0x
–
Adjusted EBITDA to interest expense: 2.8x
–
Adjusted EBITDA to fixed charges: 2.5x
–
Weighted average term to maturity for total debt: 5.7 years
|
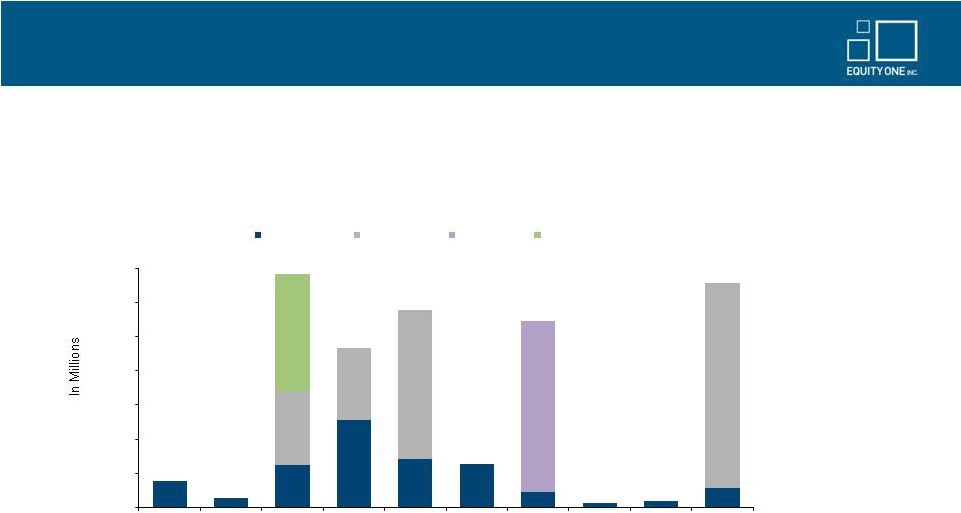 Current Liquidity Position
23
•
Cash
and
cash
equivalents
amounted
to
$28
million
as
of
December
31,
2012
•
Revolving
credit
facility
has
$575
million
capacity
and
matures
September
30,
2015
with
a
one
year
extension
option
•
We
maintain
a
manageable
debt
maturity
schedule
Note: Cash includes restricted cash and cash held in escrow. Debt maturity schedule
as of 12/31/2012. Includes scheduled principal amortization. Credit facilities are
shown as due on the initial maturity dates, although certain extension options may
be available. •
Strong lending relationships with both traditional banks and life insurance
companies •
Demonstrated access to the public markets
$350
$300
$250
$200
$150
$100
$50
$0
$38
$342
$233
$289
$273
$63
$6
$9
$328
Secured Debt
Senior Notes
Term Loan
Credit Facility
2013
2014
2015
2016
2017
2018
2019
2020
2021
Thereafter
$14 |
 Appendix
24
•
Portfolio Metrics |
 # of
centers
4Q12 Fair
Value
($M)
GLA
4Q12
Occ.
All
Anchor
Shop
Pop.
Avg HH
Income
Median
HH
Income
Grocer
Sales
Balance
Interest
Rate
Years to
Maturity
Core Markets
Northeast
Connecticut
7
$257.0
866,937
98.7%
$18.52
$13.33
$31.47
37,557
$140,431
$115,845
$891
$82.5
5.6%
5.5
Maryland
1
$140.0
466,919
98.3%
$13.84
N/A
N/A
139,570
$200,005
$183,860
$847
$0.0
-
-
Massachusetts
7
$142.6
600,879
99.1%
$18.80
$18.96
$17.48
189,085
$84,865
$71,977
$309
$7.1
8.1%
11.6
New York
7
$503.9
951,212
90.2%
$31.66
$29.85
$55.19
468,422
$105,490
$87,716
$1,321
$23.7
6.5%
4.3
Northeast Total
22
$1,043.5
2,885,947
95.9%
$21.72
$21.53
$32.82
280,013
$123,958
$105,392
$636
$113.2
6.0%
5.6
Southeast
North and Central Florida
7
$180.8
1,212,342
86.3%
$14.87
$11.27
$21.21
49,353
$91,206
$69,751
$460
$16.1
5.8%
3.4
Atlanta (Core)
5
$171.6
611,645
95.9%
$19.11
$15.24
$26.46
98,945
$116,795
$92,074
$574
$31.7
7.1%
2.5
Broward/Miami- Dade/Palm Beach Counties
40
$952.2
4,826,864
92.4%
$15.10
$10.44
$23.65
129,732
$76,785
$63,307
$605
$100.2
6.3%
6.8
Florida Treasure/Northeast Coast
6
$74.1
504,568
90.7%
$11.86
$8.35
$20.09
39,416
$70,778
$50,683
$646
$11.9
6.0%
5.5
Southeast Total
58
$1,378.7
7,155,419
91.5%
$15.20
$10.85
$23.35
110,505
$83,333
$67,054
$603
$159.8
6.4%
5.5
West Coast
Arizona
1
$26.0
210,396
64.4%
$16.44
$11.12
$29.55
35,703
$74,853
$76,522
$0
$0.0
-
-
Los Angeles
4
$184.5
489,239
98.5%
$22.00
$14.37
$37.75
263,113
$93,115
$69,598
$527
$74.8
5.5%
6.0
San Francisco
6
$601.6
1,595,070
97.4%
$27.22
$19.91
$40.05
218,636
$95,635
$81,084
$826
$71.4
6.0%
3.4
West Coast Total
11
$812.1
2,294,705
94.6%
$25.23
$17.86
$38.98
222,884
$94,397
$78,328
$661
$146.2
5.7%
4.7
Total
91
$3,234.3
12,336,071
93.1%
$18.54
$14.84
$27.61
193,411
$99,218
$82,254
$618
$419.2
6.1%
5.3
Non-core Markets
Atlanta
5
$25.8
358,082
83.0%
$9.78
$6.95
$13.84
68,907
$72,188
$62,556
$0
$0.0
-
-
Tampa/St. Petersburg/Venice/Cape Coral/Naples
7
$63.9
738,076
83.8%
$10.70
$7.43
$16.95
42,040
$85,138
$59,014
$354
$0.0
-
-
Louisiana
12
$98.0
1,321,277
95.4%
$8.64
$6.87
$13.21
58,343
$76,993
$59,983
$239
$0.0
-
-
Jacksonville/North Florida
8
$56.4
663,726
90.5%
$9.40
$6.95
$15.67
39,689
$58,979
$48,622
$489
$0.0
-
-
Orlando/Central Florida
5
$41.9
486,007
82.9%
$11.21
$6.06
$19.76
91,982
$56,932
$48,543
$313
$0.0
-
-
North Carolina
8
$50.7
835,286
79.1%
$8.00
$6.46
$12.35
27,931
$62,024
$49,434
$291
$6.5
6.3%
0.5
Central/ South Georgia
4
$29.5
624,662
78.7%
$8.16
$6.09
$12.39
61,564
$48,452
$36,884
$443
$0.0
-
-
AL/MS/VA
3
$17.7
258,535
97.9%
$7.32
$5.64
$13.48
21,471
$71,305
$54,645
$393
$0.0
-
-
Total
52
$383.9
5,285,651
86.7%
$9.07
$6.66
$14.61
51,800
$68,759
$53,664
$373
$6.5
6.3%
0.5
Grand Total
143
$3,618.1
17,621,722
91.2%
$15.84
$12.43
$23.79
178,387
$95,986
$79,221
$558
$425.8
6.1%
5.2
In-Place Debt (12/31/12)
Base Rent ($/sf)
25
Portfolio Metrics
(1)
Fair value of Westwood Center in Bethesda, MD is based on expected purchase price
when property is ultimately acquired. (2)
New York occupancy rate would be 98% excluding The Gallery at Westbury Plaza which
is currently 75% leased. (3)
Excludes land and non-core assets not associated with retail centers. Includes
acquisitions and dispositions under contract as of 12/31/2012. (1)
(3)
(2) |
