Attached files
| file | filename |
|---|---|
| 8-K - CURRENT REPORT ON FORM 8-K - DELTA AIR LINES, INC. | delta_8k.htm |
| EX-99.2 - PRESS RELEASE - DELTA AIR LINES, INC. | delta_8k-ex9902.htm |
Exhibit 99.1
Delta: Building on Our Success J.P. Morgan Aviation, Transportation and Defense Conference March 4, 2013

This presentation contains various projections and other forward - looking statements which represent Delta’s estimates or expectations regarding future events. All forward - looking statements involve a number of assumptions, risks and uncertainties, many of which are beyond Delta’s control, that could cause the actual results to differ materially from the projected results. Factors which could cause such differences include, without limitation, business, economic, competitive, industry, regulatory, market and financial uncertainties and contingencies, as well as the “Risk Factors” discussed in Delta’s SEC filings. Caution should be taken not to place undue reliance on Delta’s forward - looking statements, which represent Delta’s views only as of the date of this presentation, and which Delta has no current intention to update. In this presentation, we will discuss certain non - GAAP financial measures. You can find the reconciliations of those measures to comparable GAAP measures on our website at delta.com. Safe Harbor 2

Building on Our Success • Building on 2012’s financial momentum to grow earnings and expand margins in 2013 • On track to achieve Delta’s best March quarter since 2000 • Investments in network, operations, product and people driving revenue growth and corporate share gains • Structural cost initiatives will preserve Delta’s cost advantage and pave the way for margin expansion • Focus on generating free cash flow and deploying it wisely • Balancing capital spending, debt reduction, and shareholder returns Strong Financial Momentum Positioning Delta for the Future Sound Deployment of Free Cash Flow 3

The Leader In An Improving Industry Pre - Tax Margin 4.3% 4.0% 1.6% 4.0% 4.2% (0.5%) 2012 Pre - Tax Income ($M) Note: All results exclude special items . 2012 Highlights: • Generated $1.6B net income, an increase of 30% from 2011 • Grew unit revenues 7% and unit revenue improvement outpaced the industry for the second year in a row • Top - tier operational performance and a 40% drop in DOT customer complaints • Reduced adjusted net debt by over $1 billion • Produced an 11% return on invested capital $1,568 $679 $599 $537 $209 ($130) 4

Momentum Continues In March Quarter March quarter 2013 Operating margin 2.5 – 3.5% Fuel price, including taxes and settled hedges $3.23 - $3.28 March quarter 2013 vs. March quarter 2012 Passenger unit revenue Up 4.5 – 5.5% Consolidated ex - fuel unit cost Up 6 – 7% System capacity Down 2 – 3% Forecasting Delta’s best March quarter since 2000 5 Note: Fuel price excludes mark - to - market adjustments; consolidated ex - fuel unit cost excludes special items and profit sharing
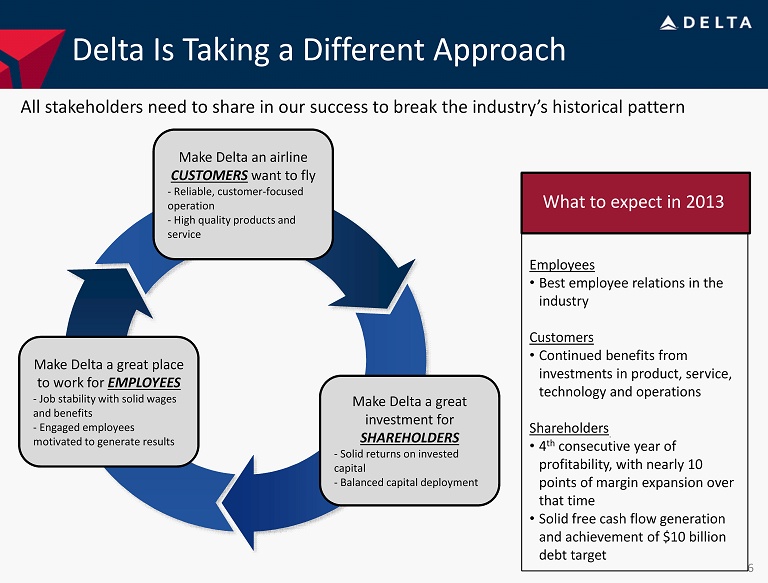
Delta Is Taking a Different Approach All stakeholders need to share in our success to break the industry’s historical pattern 6 Employees • Best employee relations in the industry Customers • Continued benefits from investments in product, service, technology and operations Shareholders • 4 th consecutive year of profitability, with nearly 10 points of margin expansion over that time • Solid free cash flow generation and achievement of $10 billion debt target What to expect in 2013 Make Delta a great place to work for EMPLOYEES - Job stability with solid wages and benefits - Engaged employees motivated to generate results Make Delta an airline CUSTOMERS want to fly - Reliable, customer - focused operation - High quality products and service Make Delta a great investment for SHAREHOLDERS - Solid returns on invested capital - Balanced capital deployment

Focus on Free Cash Flow 2.6 3.8 4.1 4.8 4.1 2.9 1.8 1.3 1.2 0.9 2.1 2.6 1.2 1.3 1.3 2.0 2.2 $(2.0) $(1.0) $- $1.0 $2.0 $3.0 $4.0 $5.0 $6.0 1997 1998 1999 2000 2001 2002 2003 2004 2005 2006 2007 2008 2009 2010 2011 2012 2013 Est* $ Billions Capex Operating Cash Flow Historical Capital Spending and Operating Cash Flow Note: Includes pre - merger NWA 2012 includes $330M of refinery capex ; 2013 estimate includes $360M Virgin Atlantic equity investment 7

Investing in the Business …and Operational Reliability 8 Investing in Network, Product and Facilities….. • Onboard: – Launch of Economy Comfort – Flat bed seats on 85% of international aircraft by end of 2013 – Wi - Fi on all two - class aircraft – Personal on - demand entertainment • Facilities: – State of the art international terminal in Atlanta – Opening JFK Terminal 4 in May 2013 – Upgraded Sky Clubs • Expanded network reach through targeted international equity investments in GOL, Aeromexico and Virgin Atlantic • Enhancements to delta.com and mobile applications Investments in network, operations, product and people targeted at making Delta the airline of choice for passengers 76.4% 81.6% 85.9% 2Q/3Q 10 2Q/3Q 11 2Q/3Q 12 98.0% 98.6% 99.5% 2010 2011 2012 On - Time Arrival Rate Completion Factor

14.5 % 13% 13% 11% 6% 8% 4.5 % 4% 0.5% 5.5 % 2.5% 4% 5.5% 5% 9% 5% 7% 8% 4% 5% 2% 1% - 1% 2% - 1% 1% 2.5% Jan-12 Feb Mar Apr May Jun Jul Aug Sep Oct Nov Dec Jan-13 Feb Delta A4A Excl DAL Generating a Revenue Premium To The Industry Delta has a network, product and operation that customers are willing to pay a premium for Passenger Unit Revenue vs. Prior Year 9 Industry - leading revenue growth for 22 consecutive months

Making Solid Inroads With Corporate Customers Corporate revenues increased by 8% in February, despite 5% decrease in capacity A diverse base of corporate customers…. …and strong gains in corporate revenue Leading customer satisfaction with business travelers… …producing strong gains in corporate revenue 8% 13% - 12% 18% 5% 7% - 9% 12% 4% 10% 7% 4% Total Other Defense Banking Business Services Energy Transportation Automotive Health Care Technology Manufacturing Financial Services Last 4 Weeks YOY Corporate Revenue Change 10

Innovative Joint Loyalty Program With Starwood “Crossover Rewards” creates an opportunity to reward both companies’ best customers and establishes a strong value proposition for attracting new high value customers Industry - Leading Partnership Brings Together Two Great Brands – Starwood was recently awarded top honors in both the Luxury and Upper Upscale hotel categories by Business Travel News Medallion Members Will Earn More Rewards When They Stay at Starwood Hotels and Resorts – All Medallion members earn one mile per dollar spent on eligible room rates in addition to Starpoints they already earn – Diamond and Platinum members will also enjoy elite benefits at Starwood properties Opportunity to attract high - yielding customers – Significant number of elite members in each program who have little activity on the other partner, representing opportunity for both Delta and Starwood Crossover Rewards with SPG and Delta 11

Winning in New York Improving Delta’s position in the largest aviation market in the United States 2009 2010 2011 2012 +7.3 pts New York Corporate Share • Network and product improvements already generating substantial improvements in New York performance − 2012 New York profit margin up 3 points from prior year − 7.3 point improvement in New York corporate share vs. prior year − LGA expansion contributing to 3 point margin improvement at JFK • Major initiatives in 2013 to further improve New York performance − JFK T4 opening in May – new terminal provides industry - leading customer experience and better operational efficiency • Phase 2 will expand T4 by 11 gates by 2015 − Virgin Atlantic acquisition triples New York - London service • Codeshare , frequent flyer and lounge reciprocity expected to begin in 2H13 • Joint venture expected to be implemented by winter 2013/14 12

Expanding Network Through Investment In Virgin Atlantic Acquiring 49% of Virgin Atlantic provides unique opportunity to increase Heathrow presence • Joint venture with Virgin Atlantic is the answer for acquiring the scale needed to compete effectively in Heathrow − Combined network has 23 daily round trips from LHR and ~25% of US - LHR seat share − Nine daily flights from New York area airports to Heathrow, equal to 36% of seat share • Expect to receive anti - trust immunity in 3Q13, with joint venture implemented by the end of the year • Will create $3 billion revenue joint venture for flying between North America and U.K. • London - Heathrow is the largest international destination for corporate travel – nearly three times larger than the next destination, Paris - Charles De Gaulle − JFK - LHR is the largest US – International market and Delta’s corporate revenue momentum allows it to maximize this opportunity 13 JFK - LHR Seat Share, 1Q13 American 23% British Airways 39% Delta 14% Virgin Atlantic 22% Other 2% Top 10 markets – US - Europe Annual passengers New York – London 2.7 million Los Angeles – London 1.4 million New York - Paris 1.2 million Chicago – London 1.2 million Newark - London 1.2 million Boston – London 1.0 million Washington D.C. – London 1.0 million Miami – London 0.9 million San Francisco – London 0.9 million New York - Frankfurt 0.7 million
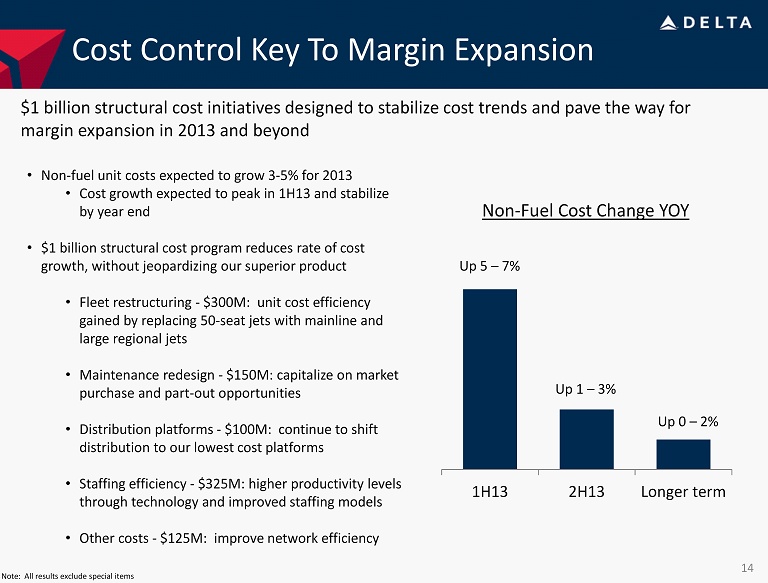
1H13 2H13 Longer term Cost Control Key To Margin Expansion $1 billion structural cost initiatives designed to stabilize cost trends and pave the way for margin expansion in 2013 and beyond • Non - fuel unit costs expected to grow 3 - 5% for 2013 • Cost growth expected to peak in 1H13 and stabilize by year end • $1 billion structural cost program reduces rate of cost growth, without jeopardizing our superior product • Fleet restructuring - $300M: unit cost efficiency gained by replacing 50 - seat jets with mainline and large regional jets • Maintenance redesign - $150M: capitalize on market purchase and part - out opportunities • Distribution platforms - $100M: continue to shift distribution to our lowest cost platforms • Staffing efficiency - $325M: higher productivity levels through technology and improved staffing models • Other costs - $125M: improve network efficiency 14 Note: All results exclude special items Non - Fuel Cost Change YOY Up 5 – 7% Up 1 – 3% Up 0 – 2%

Domestic Fleet Restructuring Upgauging domestic fleet to improve revenue generation and more efficiently produce capacity Domestic Fleet Count • Reducing 50 - seat fleet by more than 200 aircraft by 2015 • Two - class RJs have both higher RASM and lower CASM compared to 50 - seat jets • Average gauge increases by 20% • Similar capacity levels can be produced with fewer departures, improving unit cost efficiency • Maintenance savings begin in advance of aircraft retirements • Delivery of 12 737 - 900ER, 16 717, and 12 CRJ - 900 in 2H13 allows for retirement of 80 mainline and regional aircraft • Fleet retirements will save $200M in maintenance expense in 2013 • Deploying capital wisely with a mix of new and used aircraft 594 675 219 295 474 125 2009 2015 1,287 Mainline 50 - seat RJ Two - class RJ 15 1,095 Average gauge 102 122

Unique approach to Delta’s number one input cost • Trainer expected to generate break - even results in its first full quarter of operation • Investigating opportunities for new crude supplies that allow Delta, not the refiners, to benefit from input cost savings − First shipment of Bakken crude received in February − Potential to receive regular Bakken supply to the plant by mid - 2013 • Next phase of max - jet modifications, combined with process changes to improve yield efficiency, should bring jet production to 40,000 bpd by the end of 2013, or ~25% of Delta’s domestic consumption Managing Fuel Expense to Reduce Risk 16 Trainer Refinery • Well positioned for 2013 at current price levels and beginning to build foundation for 2014 • Current hedge position expected to generate $40M benefit in the March quarter and ~$75M benefit in 2013 • 30% hedged up to $125 Brent for the first half of the year Fuel Hedging
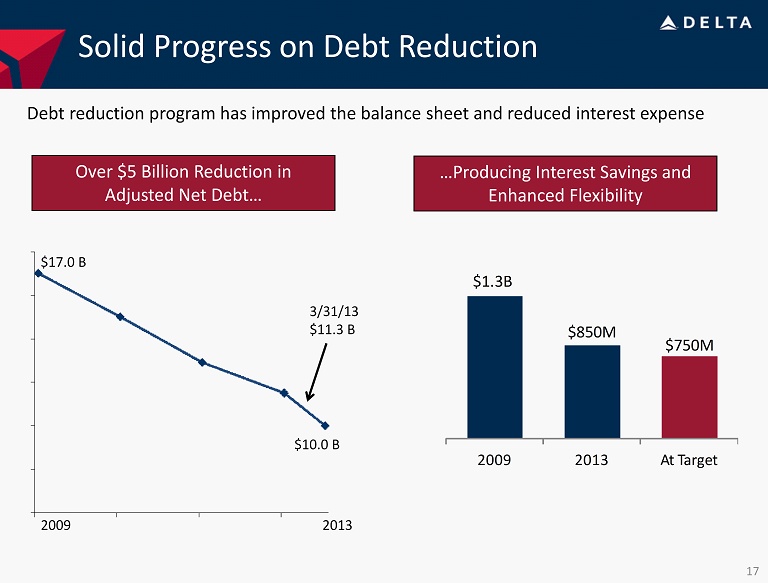
Solid Progress on Debt Reduction …Producing Interest Savings and Enhanced Flexibility $ 17.0 B 3/31/13 $ 11.3 B $ 10.0 B Debt reduction program has improved the balance sheet and reduced interest expense 2009 2013 Over $5 Billion Reduction in Adjusted Net Debt… $1.3B $850M $750M 2009 2013 At Target 17

Building on Our Success • Building on 2012’s financial momentum to grow earnings and expand margins in 2013 • On track to achieve Delta’s best March quarter since 2000 • Investments in network, operations, product and people driving revenue growth and corporate share gains • Structural cost initiatives will preserve Delta’s cost advantage and pave the way for margin expansion • Focus on generating free cash flow and deploying it wisely • Balancing capital spending, debt reduction, and shareholder returns Strong Financial Momentum Positioning Delta for the Future Sound Deployment of Free Cash Flow 18

| Non-GAAP Financial Measures | ||||||||||
| Delta sometimes uses information that is derived from our Consolidated Financial Statements, but that is not presented in accordance with accounting principles generally accepted in the U.S. (“GAAP”). Certain of this information is considered “non-GAAP financial measures” under the U.S. Securities and Exchange Commission rules. The non-GAAP financial measures may be considered in addition to results prepared in accordance with GAAP, but should not be considered a substitute for or superior to GAAP results. | ||||||||||
| Delta is unable to reconcile certain 2013 projections to GAAP, including projected operating margin, non-fuel cost per available seat mile and projected fuel price, as the nature or amount of special items cannot be estimated at this time. | ||||||||||
| Delta excludes special items because management believes the exclusion of these items is helpful to investors to evaluate the company’s recurring operational performance. | ||||||||||
| Delta adjusts for mark-to-market (MTM) adjustments for fuel hedges recorded in periods other than the settlement period in order to evaluate the company's financial results in the period shown. | ||||||||||
| Delta uses adjusted total debt, including aircraft rent, in addition to long-term adjusted debt and capital leases, to present estimated financial obligations. Delta reduces adjusted total debt by cash, cash equivalents and short-term investments, resulting in adjusted net debt, to present the amount of additional assets needed to satisfy the debt. | ||||||||||
| Delta presents net cash provided by operating activities because management believes adjusting for certain items is helpful to investors to evaluate the company’s operating activities. | ||||||||||
| Delta presents combined capital spending because management believes adjusting for certain items is helpful to investors to evaluate the company’s investing activities. | ||||||||||
Income
| Full Year | Full Year | |||||||||||
| (in millions) | 2012 | 2011 | % Change | |||||||||
| Pre-tax income | $ | 1,025 | $ | 769 | ||||||||
| Items excluded: | ||||||||||||
| MTM adjustments | (27 | ) | 26 | |||||||||
| Restructuring and other items | 452 | 242 | ||||||||||
| Loss on extinguishment of debt | 118 | 68 | ||||||||||
| Pre-tax income excluding special items | $ | 1,568 | $ | 1,105 | ||||||||
| Income tax (provision) benefit | (16 | ) | 85 | |||||||||
| Net income excluding special items | $ | 1,552 | $ | 1,190 | 30% | |||||||
Pre-Tax Margin
| Full Year | ||||
| 2012 | ||||
| Pre-tax margin | 2.8% | |||
| Items excluded: | ||||
| Restructuring and other items | 1.2% | |||
| Loss on extinguishment of debt | 0.3% | |||
| Pre-tax margin excluding special items | 4.3% | |||
Adjusted Net Debt
| December 31, | ||||||||||||||||||||||||
| (in billions) | 2012 | 2011 | 2009 | |||||||||||||||||||||
| Debt and capital lease obligations | $ | 12.7 | $ | 13.8 | $ | 17.2 | ||||||||||||||||||
| Plus: unamortized discount, net from purchase accounting and fresh start reporting | 0.5 | 0.6 | 1.1 | |||||||||||||||||||||
| Adjusted debt and capital lease obligations | $ | 13.2 | $ | 14.4 | $ | 18.3 | ||||||||||||||||||
| Plus: 7x last twelve months' aircraft rent | 1.9 | 2.1 | 3.4 | |||||||||||||||||||||
| Adjusted total debt | 15.1 | 16.5 | 21.7 | |||||||||||||||||||||
| Less: cash, cash equivalents and short-term investments | (3.4 | ) | (3.6 | ) | (4.7 | ) | ||||||||||||||||||
| Adjusted net debt | $ | 11.7 | $ | 12.9 | $ | 17.0 | ||||||||||||||||||
| Change year-over-year | $ | (1.2 | ) | |||||||||||||||||||||
Operating Cash Flow
| Full Year | Full Year | |||||||
| (in billions) | 2012 | 2008 | ||||||
| Delta operating cash flow | $ | 2.5 | $ | (1.7 | ) | |||
| SkyMiles used pursuant to advance purchase under AMEX agreement | 0.3 | – | ||||||
| Northwest operating cash flow | – | 0.2 | ||||||
| Net cash provided by operations, adjusted | $ | 2.8 | $ | (1.5 | ) | |||
Capital Spending
| (in billions) | Full Year 2013 Projection | Full
Year 2012 | Full
Year 2008 | |||||||||
| Delta capital expenditures (GAAP) | $ | 1.8 | $ | 2.0 | $ | 1.5 | ||||||
| Northwest capital expenditures | – | – | 1.1 | |||||||||
| Virgin Atlantic equity investment | 0.4 | – | – | |||||||||
| Total combined capital spending | $ | 2.2 | $ | 2.0 | $ | 2.6 | ||||||