Attached files
| file | filename |
|---|---|
| EX-99.1 - PRESS RELEASE, DATED FEBRUARY 27, 2013 (FURNISHED PURSUANT TO ITEM 2.02) - PALL CORP | exhibit991q2fy13.htm |
| 8-K - CURRENT REPORT - PALL CORP | pallcorp_8kxq2fy2013.htm |

Better Lives. Better Planet.SM This presentation is the Confidential work product of Pall Corporation and no portion of this presentation may be copied, published, performed, or redistributed without the express written authority of a Pall corporate officer © 2012 Pall Corporation © 2013 Pall Corporation Q2 FY 2013 Financial Results February 28, 2013 Exhibit 99.2

2 The matters discussed in this presentation contain “forward-looking statements” as defined in the Private Securities Litigation Reform Act of 1995. Results for the second quarter of fiscal year 2013 are preliminary until the Company's Form 10-Q is filed with the Securities and Exchange Commission on or before March 12, 2013. Forward-looking statements are those that address activities, events or developments that the Company or management intends, expects, projects, believes or anticipates will or may occur in the future. All statements regarding future performance, earnings projections, earnings guidance, management’s expectations about its future cash needs, dilution from the disposition or future allocation of capital and effective tax rate, and other future events or developments are forward- looking statements. Forward-looking statements are those that use terms such as “may,” “will,” “expect,” “believe,” “intend,” “should,” “could,” “anticipate,” “estimate,” “forecast,” “project,” “plan,” “predict,” “potential,” and similar expressions. Forward-looking statements contained in this and other written and oral reports are based on management’s assumptions and assessments in light of past experience and trends, current conditions, expected future developments and other relevant factors. The Company’s forward-looking statements are subject to risks and uncertainties and are not guarantees of future performance, and actual results, developments and business decisions may differ materially from those envisaged by the Company’s forward-looking statements. Such risks and uncertainties include, but are not limited to, those discussed in Part I–Item 1A.–Risk Factors in the 2012 Form 10-K, and other reports the Company files with the Securities and Exchange Commission, including: the impact of legislative, regulatory and political developments globally; the impact of the uncertain global economic environment; the extent to which adverse economic conditions may affect the Company’s sales volume and results; demand for the Company’s products and business relationships with key customers and suppliers, which may be impacted by their cash flow and payment practices; delays or cancellations in shipments; the Company’s ability to develop and commercialize new technologies or obtain regulatory approval or market acceptance of new technologies; the Company’s ability to enforce patents and protect proprietary products and manufacturing techniques; increase in costs of manufacturing and operating costs; the Company’s ability to achieve and sustain the savings anticipated from its structural cost improvement initiatives; volatility in foreign currency exchange rates, interest rates and energy costs and other macroeconomic challenges currently affecting the Company; the Company’s ability to meet its regulatory obligations; costs and outcome of pending or future claims or litigation; the Company’s ability to comply with environmental, health and safety laws and regulations; changes in product mix, market mix and product pricing, particularly relating to the expansion of the systems business; the effect of a serious disruption in the Company’s information systems; fluctuations in the Company’s effective tax rate; the Company’s ability to successfully complete or integrate any acquisitions; competition, including the impact of pricing and other actions by the Company’s competitors; the effect of litigation and regulatory inquiries associated with the restatement of the Company’s prior period financial statements; the Company’s ability to attract and retain management talent or the loss of members of its senior management team; the effect of the restrictive covenants in the Company’s debt facilities; and the effect of product defects and recalls. Factors or events that could cause the Company’s actual results to differ may emerge from time to time, and it is not possible for the Company to predict all of them. The Company makes these statements as of the date of this disclosure and undertakes no obligation to update them, whether as a result of new information, future developments or otherwise. Management uses certain non-GAAP measurements to assess the Company’s current and future financial performance. The non-GAAP measurements do not replace the presentation of the Company’s GAAP financial results. These measurements provide supplemental information to assist management in analyzing the Company’s financial position and results of operations. The Company has chosen to provide this information to facilitate meaningful comparisons of past, present and future operating results and as a means to emphasize the results of ongoing operations. Reconciliations of the non-GAAP financial measures used throughout this presentation to the most directly comparable GAAP measures appear at the end of this presentation in the Appendix and are also available on Pall’s website at www.pall.com/investor Forward-Looking Statements

3 Conference Call Replay Info Toll-Free: 855.859.2056 International: 404.537.3406 Conference ID: 97942344 Internet: www.pall.com/investor

4 Q2 Overview Life Sciences markets continue to perform well Industrial end markets are still sluggish Emerging Asia underperforming Cost saving initiatives and productivity improvements progressing FY 2013 View Generally Unchanged All remarks in this presentation are on a “Continuing Operations” basis, which excludes the results of the Blood product line divestiture, unless indicated otherwise. A reconciliation of Non-GAAP Financial Measures in this presentation to their GAAP Counterparts is provided in the Appendix.

5 $640 $662 $- $200 $400 $600 $800 Revenue % Growth Excluding FX FY 2012 FY 2013 Q2 Financial Summary Dollars in millions, except EPS data 17.0% 17.0% 10.0% 15.0% 20.0% Operating Profit Margin FY 2012 FY 2013 Q2 FY2012 0.67$ EBIT 0.02 Translational FX (0.01) Tax Rate & Sharecount 0.05 Q2 FY2013 0.73$ Pro forma EPS Bridge $0.67 $0.73 $0.30 $0.60 $0.90 Pro forma EPS % Growth FY 2012 FY 2013 +9.0% +3.9%

6 Life Sciences Consumables $300 +11.7% Industrial Consumables $272 -5.9% Industrial Systems $61 +21.0% Life Sciences Systems $29 Flat 41% 45% 9% 5% Q2 Sales by Segment Dollars in millions Percentages outside pie charts and in box represent sales change excluding FX Percentages inside pie charts represent percent of total sales Life Sciences: $329 (+10.6%) Industrial: 333 (-1.9%) Total Sales: $662 (+3.9%)

7 Q2 Life Sciences Consumables BioPharmaceuticals +11% − Strength in biotech and impact of ForteBio® Food and Beverage +5% – Geographic expansion Medical +21% – Increased Pall-Aquasafe™ sales – Increased sales to OEMs Systems Timing: Food & Beverage up; BioPharmaceuticals down Consumables Reflects strength in BioPharmaceuticals and Medical Systems Strength in BioPharmaceuticals partly offset by Food & Beverage Dollars in millions Sales Q2 FY 2013 YoY Change YoY Change Excluding FX Consumable $ 300 11.1% 11.7% Systems 29 0.0% -0.2% Total Life Sciences $ 329 10.0% 10.6% Orders Q2 FY 2013 YoY Change YoY Change Excluding FX Consumables $ 323 12.9% 13.7% Systems 28 18.0% 17.2% Total Life Sciences $ 351 13.3% 14.0%

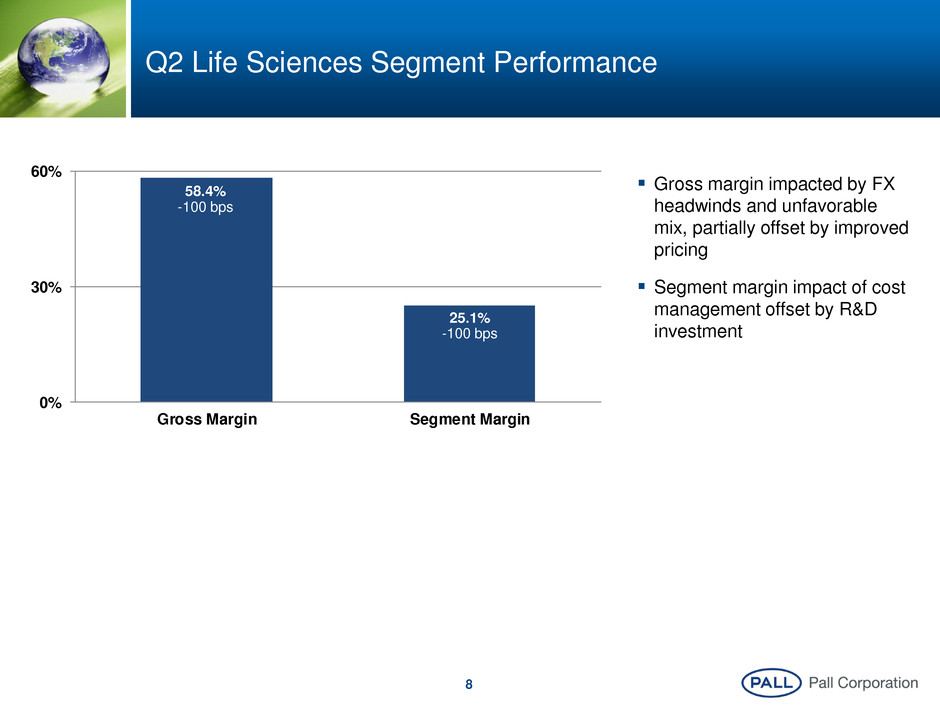
8 0% 30% 60% Gross Margin Segment Margin 58.4% -100 bps 25.1% -100 bps Q2 Life Sciences Segment Performance Gross margin impacted by FX headwinds and unfavorable mix, partially offset by improved pricing Segment margin impact of cost management offset by R&D investment

9 Q2 Industrial Consumables Process Technologies -12% − Weakness across end markets Aerospace +14% − Commercial aviation strength Microelectronics -6% − Continued end market weakness Systems Strength in Process Technologies and Aerospace Consumables Continued softness Commercial Aerospace +7.5% Systems Capital constraints affect timing Dollars in millions Sales Q2 FY 2013 YoY Change YoY Change Excluding FX Consumable $ 272 -6.4% -5.9% Systems 61 22.0% 21.0% Total Industrial $ 333 -2.2% -1.9% Orders Q2 FY 2013 YoY Change YoY Change Excluding FX Consumable $ 260 -9.8% -9.2% Systems 67 -10.7% -11.2% Total Industrial $ 327 -10.0% -9.6%

10 0% 30% 60% Gross Margin Segment Margin 45.0% -210 bps 14.4% +30 bps Q2 Industrial Segment Performance Gross margin impacted by unfavorable mix and absorption Segment margin improvement based upon cost management

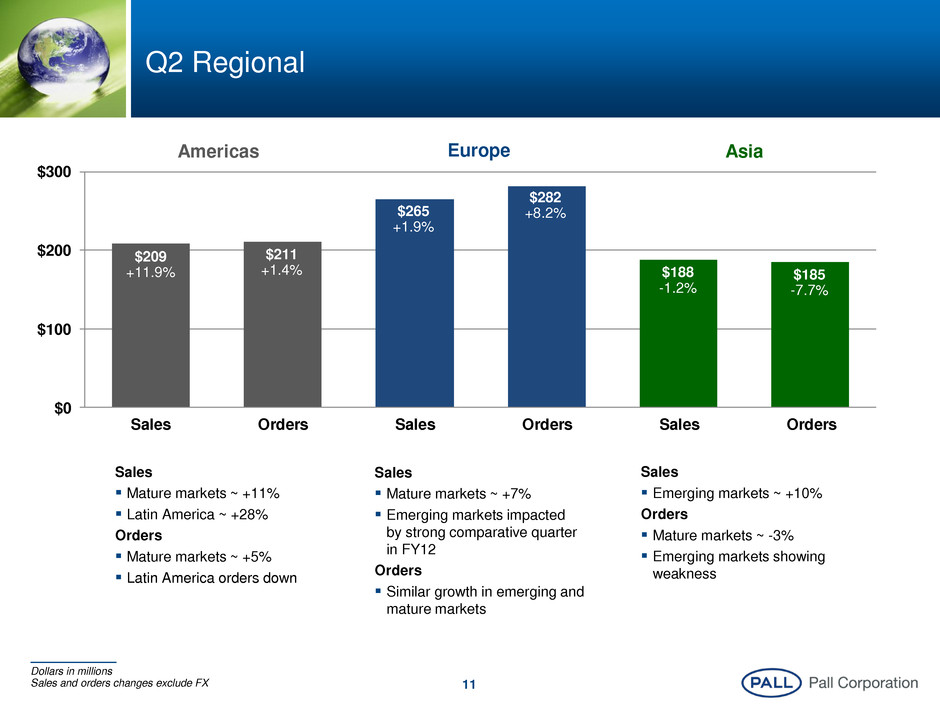
11 $0 $100 $200 $300 Sales Orders Sales Orders Sales Orders $209 +11.9% $211 +1.4% $265 +1.9% $188 -1.2% Americas Europe Asia $282 +8.2% $185 -7.7% Q2 Regional Dollars in millions Sales and orders changes exclude FX Sales Mature markets ~ +11% Latin America ~ +28% Orders Mature markets ~ +5% Latin America orders down Sales Mature markets ~ +7% Emerging markets impacted by strong comparative quarter in FY12 Orders Similar growth in emerging and mature markets Sales Emerging markets ~ +10% Orders Mature markets ~ -3% Emerging markets showing weakness

12 Q2 Cash Flow and Working Capital YTD FY13 YTD FY12 Operating Cash Flow 89$ 204$ CapEx (42) (94) Free Cash Flow 47$ 110$ Other Significant Sources/(Uses) of Cash: Pr ceeds from sale of assets 542$ 20$ Acquisition of businesses - (26) Dividends (53) (40) Borrowing/Repayment under Financing Facilities 30 (75) Stock Buybacks (250) - Dollars in millions Cash, net of debt, $160mm as of January 31, 2013 FY 2013 Sale of Blood Product Line Reduced by one-time tax-related payments

13 Conclusion Closing Remarks Q&A

Better Lives. Better Planet.SM This presentation is the Confidential work product of Pall Corporation and no portion of this presentation may be copied, published, performed, or redistributed without the express written authority of a Pall corporate officer © 2012 Pall Corporation © 2013 Pall Corporation Appendix

15 Appendix: Q2 Earnings and FY 2013 Estimates from Continuing Operations Reconciliation of Non-GAAP Financial Measures Diluted EPS from continuing operations as reported 0.70$ 0.63$ 3.12$ Discrete Items: ROTC after pro forma tax effect 0.03 0.04 0.06 Tax Adjustments - - (0.09) Interest Adjustments after pro forma tax effect - - (0.04) Total discrete items 0.03 0.04 (0.07) Pro forma diluted EPS 0.73$ 0.67$ 3.05$ FY 2013 (Estimates at Midpoint) Q2 FY13 Q2 FY12

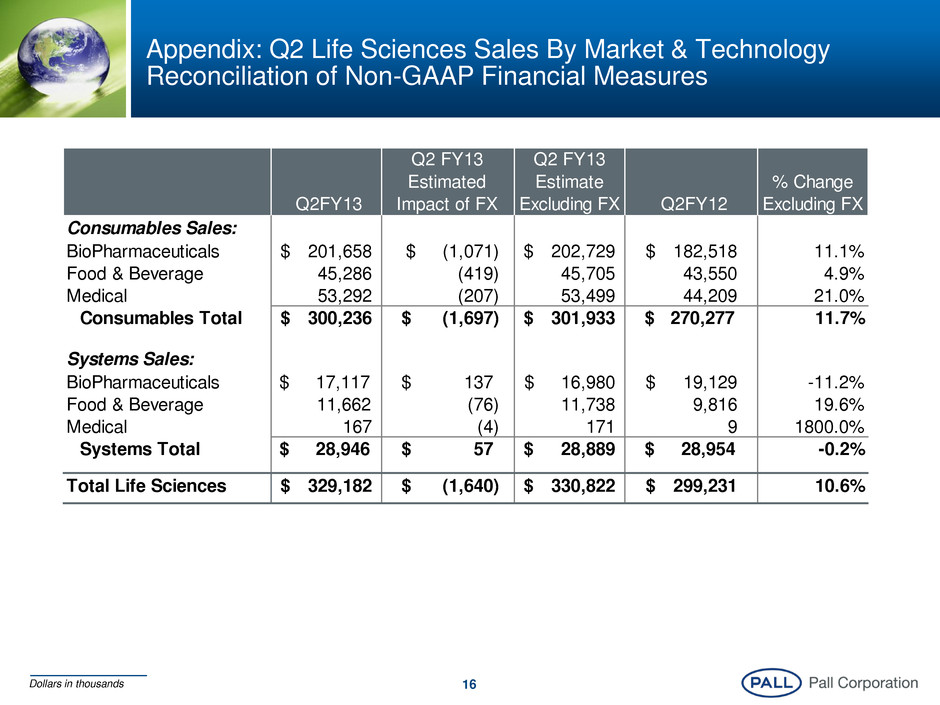
16 Appendix: Q2 Life Sciences Sales By Market & Technology Reconciliation of Non-GAAP Financial Measures Q2FY13 Q2 FY13 Estimated Impact of FX Q2 FY13 Estimate Excluding FX Q2FY12 % Change Excluding FX Consumables Sales: BioPharmaceuticals 201,658$ (1,071)$ 202,729$ 182,518$ 11.1% Food & Beverage 45,286 (419) 45,705 43,550 4.9% Medical 53,292 (207) 53,499 44,209 21.0% Consumables Total 300,236$ (1,697)$ 301,933$ $ 270,277 11.7% Systems Sales: BioPharmaceuticals $ 17,117 137$ 16,980$ 19,129$ -11.2% Food & Beverage 11,662 (76) 11,738 9,816 19.6% Medical 167 (4) 171 9 1800.0% Systems Total $ 28,946 57$ 28,889$ $ 28,954 -0.2% Total Life Sciences 329,182$ (1,640)$ 330,822$ 299,231$ 10.6% Dollars in thousands

17 Appendix: Q2 Industrial Sales By Market & Technology Reconciliation of Non-GAAP Financial Measures Q2 FY13 Q2 FY13 Estimated Impact of FX Q2 FY13 Estimate Excluding FX Q2 FY12 % Change Excluding FX Consumables Sales: Process Technologies 143,146$ (899)$ 144,045$ 164,010$ -12.2% Aerospace 60,578 147 60,431 53,182 13.6% Microelectronics 68,264 (808) 69,072 73,372 -5.9% Consumables Total 271,988$ $ (1,560) 273,548$ $ 290,564 -5.9% Systems Sales: Process Technologies 57,289$ 376$ 56,913$ 47,645$ 19.5% A rospace 3,709 98 3,611 1,776 103.3% Microelectronics 287 1 286 831 -65.6% Systems Total 61,285$ 475$ 60,810$ $ 50,252 21.0% Total Industrial 333,273$ (1,085)$ 334,358$ 340,816$ -1.9%3 5 Dollars in thousands

18 Appendix: Q2 Sales by Segment and Region Reconciliation of Non-GAAP Financial Measures Q2 FY13 Q2 FY13 Estimated Impact of FX Q2 FY13 Estimate Excluding FX Q2 FY12 % Change Excluding FX Life Sciences Sales: Americas 104,018$ (789)$ 104,807$ 84,014$ 24.8% Europe 159,360 603 158,757 152,027 4.4% Asia 65,804 (1,454) 67,258 63,190 6.4% Life Sciences Total 329,182$ (1,640)$ 330,822$ 299,231$ 10.6% Industrial Sales: Americas 105,636$ (732)$ 106,368$ 104,726$ 1.6% Europe 105,502 928 104,574 106,374 -1.7% Asia 122,135 (1,281) 123,416 129,716 -4.9% Industrial Total 333,273$ (1,085)$ 334,358$ 340,816$ -1.9% Americas 209,654$ (1,521)$ 211,175$ 188,740$ 11.9% Europe 264,862 1,531 263,331 258,401 1.9% Asia 187,939 (2,735) 190,674 192,906 -1.2% Total Pall 662,455$ (2,725)$ 665,180$ 640,047$ 3.9% Dollars in thousands

19 Appendix: Q2 Orders by Technology Reconciliation of Non-GAAP Financial Measures Dollars in thousands Q2 FY13 Q2 FY13 Estimated Impact of FX Q2 FY13 Estimate Excluding FX Q2 FY12 % Change Excluding FX Life Sciences Orders: Consumables 322,731$ (2,110)$ 324,841$ 285,748$ 13.7% Systems 28,603 175 28,428 24,247 17.2% Life Sciences Total 351,334$ (1,935)$ 353,269$ 309,995$ 14.0% Industrial Orders: Consumables 260,496$ (1,704)$ 262,200$ 288,799$ -9.2% Systems 66,424 398 66,026 74,358 -11.2% Industrial Total 326,920$ (1,306)$ 328,226$ 363,157$ -9.6% Total Pall 678,254$ (3,241)$ 681,495$ 673,152$ 1.2%

20 Appendix: Q2 Operating Profit Reconciliation of Non-GAAP Financial Measures Operating Profit Q2 FY13 Q2 FY12 Life Sciences segment profit 82,477$ 78,088$ Industrial segment profit 48,104 48,129 Total segment profit 130,581$ 126,217$ General corporate expenses (18,026) (17,678) Operating profit 112,555$ 108,539$ % of Sales 17.0% 17.0% ROTC 4,399 5,156 Interest expense, net 6,017 5,386 Earnings before income taxes 102,139$ 97,997$ Dollars in thousands

Better Lives. Better Planet.SM This presentation is the Confidential work product of Pall Corporation and no portion of this presentation may be copied, published, performed, or redistributed without the express written authority of a Pall corporate officer © 2012 Pall Corporation © 2013 Pall Corporation www.pall.com/green
