Attached files
| file | filename |
|---|---|
| 8-K - CURRENT REPORT OF MATERIAL EVENTS OR CORPORATE CHANGES - NuStar GP Holdings, LLC | a13-6504_18k.htm |
Exhibit 99.1
|
|
2012 NuStar Bank Meeting November 7, 2012 2013 UBS MLP One-on-One Conference January 15th & 16th 2013 Morgan Stanley Midstream MLP and Diversified Natural Gas Corporate Access Event March 5, 2013 |
|
|
2 Statements contained in this presentation that state management’s expectations or predictions of the future are forward-looking statements as defined by federal securities law. While these forward-looking statements, and any assumptions upon which they are based, are made in good faith and reflect our current judgment regarding the direction of our business, actual results will almost always vary, sometimes materially, from any estimates, predictions, projections, assumptions or other future performance suggested in this presentation. These forward-looking statements can generally be identified by the words "anticipates," "believes," "expects," "plans," "intends," "estimates," "forecasts," "budgets," "projects," "could," "should," "may" and similar expressions. These statements reflect our current views with regard to future events and are subject to various risks, uncertainties and assumptions. We undertake no duty to update any forward-looking statement to conform the statement to actual results or changes in the company’s expectations. For more information concerning factors that could cause actual results to differ from those expressed or forecasted, see NuStar Energy L.P.’s and NuStar GP Holdings, LLC’s respective annual reports on Form 10-K and quarterly reports on Form 10-Q, filed with the Securities and Exchange Commission and available on NuStar’s websites at www.nustarenergy.com and www.nustargpholdings.com. We use non-generally accepted accounting principles (“non-GAAP”) financial measures in this presentation, and our reconciliations of non-GAAP financial measures to our GAAP financial statements are located in the appendix to this presentation. These non-GAAP measures should not be considered an alternative to GAAP financial measures. Forward Looking Statements |
|
|
NuStar Overview 3 |

|
|
4 Two Publicly Traded Companies NuStar Energy L.P. (NYSE: NS) is a publicly traded partnership with a market capitalization of approximately $4.0 billion and an enterprise value of approximately $6.3 billion NuStar GP Holdings, LLC (NYSE: NSH) holds the 2% general partner interest, incentive distribution rights and 13.0% of the common units in NuStar Energy L.P. NSH has a market capitalization of around $1.3 billion 81.3% Membership Interest 85.0% L.P. Interest Public Unitholders 34.6 million NSH Units Public Unitholders 67.6 million NS Units 18.7% Membership Interest 2.0% G.P. Interest 13.0% L.P. Interest Incentive Distribution Rights William E. Greehey 7.9 million NSH Units NYSE: NSH NYSE: NS NS NSH IPO Date 4/16/2001 7/19/2006 Unit Price (02/27/13) $50.82 $30.05 Annualized Distribution/Unit $4.38 $2.18 Yield (02/27/13) 8.62% 7.25% Market Capitalization $3,959 million $1,280 million Enterprise Value $6,286 million $1,297 million Credit Ratings – Moody’s Ba1/Stable n/a S&P BB+/Stable n/a Fitch BB/Stable n/a |
|
|
5 Large and Diverse Geographic Footprint with Assets in Key Locations Asset Stats: Operations in the U.S., Canada, Mexico, the Netherlands, including St. Eustatius in the Caribbean, the United Kingdom and Turkey. Own 87 terminal and storage facilities Approximately 96 million barrels of storage capacity 8,634 miles of crude oil and refined product pipelines 50% interest in a joint venture that owns a terminal and an asphalt refinery with throughput capacity of 74 MBPD |

|
|
6 Diversified Operations from Three Business Segments Percentage of Full Year 2012 Segment Operating Income Storage: 53% Refined Product Terminals Crude Oil Storage Pipeline: 43% Refined Product Pipelines* Crude Oil Pipelines Fuels Marketing: 4% Product Supply, Crude Oil Trading, Bunkering and Fuel Oil Marketing Approximately 96% of NuStar Energy’s 2012 segment operating income, after excluding asphalt operations and the San Antonio refinery, came from fee-based Storage and Pipeline segments Storage and Pipeline segments should account for around 90% of 2013 segment operating income * Includes primarily distillates, gasoline, propane, jet fuel, ammonia and other light products. Does not include natural gas. 53% 43% 4% |
|
|
7 Distributions for both NS and NSH have grown every year since IPO’s NS Distribution ($ per Unit) ~5.6% CAGR * Annualized Distribution NSH Distribution ($ per Unit) ~8.7% CAGR 2001 2002 2003 2004 2005 2006 2007 2008 2009 2010 2011 2012 $2.40 $2.75 $2.95 $3.20 $3.37 $3.60 $3.84 $4.09 $4.25 $4.28 $4.36 $4.38 2006 2007 2008 2009 2010 2011 2012 $1.28 $1.38 $1.58 $1.73 $1.87 $1.98 $2.11 |
|
|
8 Strategic Redirection and Change in Focus as NuStar Moves into 2013 Strategic redirection involved minimizing exposure to margin- based operations Sold 50% of our Asphalt business on September 28, 2012 Sold San Antonio refinery on January 1, 2013 Currently focused on growing fee-based side of business Closed on Eagle Ford Shale crude oil pipeline acquisition in December 2012 Internal growth projects in Eagle Ford Shale Continued development of our strategically located storage terminals |
|
|
9 Fuels Marketing Segment |

|
|
10 Fuels Marketing Segment Volatility Should be Reduced due to Less Refining Exposure Effective September 28, 2012, as a result of selling 50% of the Asphalt business, we deconsolidated those results from NuStar’s financial statements Transaction provided NuStar with around $400 million in cash proceeds to pay down outstanding debt After January 1, 2013 sale of the San Antonio refinery this segment is entirely composed of the remaining Fuels Marketing operations Fuels Marketing operations are expected to generate $40 to $60 million of EBITDA in 2013 and 2014 1 1 – Please see slide 34 for a reconciliation of Fuels Marketing Segment EBITDA to its most directly comparable GAAP measure, Operating Income |
|
|
11 Storage Segment |

|
|
NuStar Overview 12 Expect EBITDA to Continue to Grow in Storage Segment Storage Segment EBITDA ($ in Millions)1 Storage Contract Renewals (% as 01/31/2013) Outlook 2013 segment EBITDA expected to be $10 to $30 million higher than 2012 Segment should benefit from a full year of EBITDA relating to rail car offloading facility project completed in April 2012 at our St. James, LA terminal facility Benefits from storage expansions completed in early 2013 at St. Eustatius and St. James, LA terminal facility projected to be partially offset by reduced profit sharing proceeds from one of our terminal facilities 1 – Please see slide 30 for a reconciliation of Storage Segment EBITDA to its most directly comparable GAAP measure, Operating Income 1 – Please see slide 32 for a reconciliation of Storage Segment EBITDA to its most directly comparable GAAP measure, Operating Income 1 2006 2007 2008 2009 2010 2011 2012 $162 $177 $208 $242 $256 $281 $288 < 1 Year 1 to 3 Years 3 to 5 Years > 5 Years 40% 27% 22% 11% |
|
|
NuStar Overview 13 Recently Completed Construction of New Distillate Tanks at our St. Eustatius Terminal Constructed one million barrels of new storage for distillate service Customer is a large national oil company Construction cost around $60 million Expected to generate average annual EBITDA of around $10 million Continue to evaluate an additional expansion project at St. Eustatius Possible two to four million barrel expansion Majority of spending would occur in 2014 and 2015 1 – Please see slide 32 for a reconciliation of EBITDA to its most directly comparable GAAP measure, Operating Income 1 |
|
|
NuStar Overview 14 Storage Expansion Continues at our St. James, Louisiana Terminal Currently have 9 million barrels of storage capacity at St. James In the middle of a 1.4 million barrel expansion project 700,000 barrels completed in January 2013 Additional 700,000 barrels projected to be completed in 1st quarter of 2014 Project costs estimated at about $45 million EBITDA projected to be approximately $8 million per year In discussions with major oil companies about additional expansion opportunities 1 – Please see slide 32 for a reconciliation of EBITDA to its most directly comparable GAAP measure, Operating Income 1 |
|
|
NuStar Overview 15 Potential 2nd St. James Unit Train Project Possible commitments from third parties would support the construction of 2nd unit train unloading facility at our St. James Terminal that is similar to our current rail facility Estimated project costs around $45 million Estimated in-service 4th quarter 2013 Annual EBITDA estimated in the $15 to $20 million range St. James Unit Train 1 – Please see slide 32 for a reconciliation of EBITDA to its most directly comparable GAAP measure, Operating Income 1 |
|
|
16 Pipeline Segment |

|
|
NuStar Overview 17 Growth in Eagle Ford Shale Region Expected to Lead to Future Growth in Pipeline Segment EBITDA Pipeline Segment EBITDA ($ in Millions)1 Pipeline Receipts by Commodity Other* 13% Crude Oil 40% Gasoline 29% Distillate 18% *Other includes ammonia, jet fuel, propane, naphtha and light end refined products Outlook 2013 segment EBITDA expected to be $70 to $90 million higher than 2012 Eagle Ford pipeline expansion projects completed in last half of 2012 and late 2013 plus benefits from the December 2012 TexStar acquisition should contribute to the higher earnings 1 – Please see slide 33 for a reconciliation of Pipeline Segment EBITDA to its most directly comparable GAAP measure, Operating Income 1 2006 2007 2008 2009 2010 2011 2012 $170 $176 $186 $190 $199 $197 $211 |
|
|
18 NuStar Has Now Completed Four Internal Growth Projects in the Eagle Ford Shale Region NuStar was the first to transport Eagle Ford Shale region crude oil via pipeline Projects completed include three pipeline reversals/connections and the Valero pipeline construction project Total capital spent to date around $150 million Expected to generate EBITDA of around $30 million per year 1 – Please see slide 33 for a reconciliation of EBITDA to its most directly comparable GAAP measure, Operating Income 1 |

|
|
NuStar Overview 19 Four Projects Completed in the Eagle Ford Shale Region to Date primarily move Crude to Corpus Christi Pettus South Pipeline Reactivation Project for Koch Pipeline TexStar Midstream Pipeline New 12” Pipeline Constructed for Valero Existing NuStar Pipeline Reversals NuStar’s Oakville Terminal THREE RIVERS REFINERY OAKVILLE PETTUS NORTH BEACH Valero West Plant CORPUS CHRISTI 8” 16” 12” 10” Koch Mayo Sta. 16” 8” |
|
|
20 In Mid-November Signed an Agreement with ConocoPhillips to Further Expand Capacity in Eagle Ford Shale Region NuStar will construct a 100,000 barrel terminal facility, truck offloading facilities and a pipeline connection to NuStar’s existing 12” Pettus line 12” Pettus line will connect to NuStar’s Three Rivers to Corpus 16” line giving ConocoPhillips the ability to move Eagle Ford production to Corpus Christi Capacity of 12” Pettus line 100 MBPD Agreement provides ConocoPhillips with 30 to 60 MBPD of shipping capacity Projected completion in the 4th quarter of 2013 10-year take or pay agreement supports this project Dock expansion at Corpus Christi North Beach Terminal will give ConocoPhillips and other customers more options to move Eagle Ford crude Projected completion in the 1st quarter of 2014 Total NuStar spending should be $100 to $120 million Should generate about $15 million of annual EBITDA Small benefit in 2013 but majority in 2014 and thereafter 1 – Please see slide 33 for a reconciliation of EBITDA to its most directly comparable GAAP measure, Operating Income 1 |
|
|
NuStar Overview 21 NuStar Pipeline Systems to be Utilized by ConocoPhillips New NuStar Pipeline NuStar Three Rivers to Corpus Pipeline NuStar’s Oakville Terminal New NuStar Terminal Underutilized Existing NuStar Pipeline PAWNEE PETTUS 12” line OAKVILLE 16” line NuStar Pipeline NORTH BEACH |
|
|
NuStar Overview 22 December 2012 Crude Oil Pipeline Acquisition from TexStar allows NuStar to become one of the Largest Players in the Eagle Ford Shale Region Further integrates NuStar with producers and marketers of Eagle Ford Shale region crude oil Provides NuStar with access to dedicated production acreage Provides Eagle Ford Shale region crude oil producers the ability to move production to Corpus Christi Crude oil producers also have access to NuStar’s Corpus Christi storage and dock space that can be utilized for shipments to other markets |
|
|
NuStar Overview 23 New Eagle Ford Shale Region Crude Oil System after TexStar Transaction |
|
|
NuStar Overview 24 TexStar NGL Asset Acquisition Update TexStar delivered a letter to NuStar on February 18, 2013 that purports to terminate the rights of the parties to proceed to a closing on NuStar’s acquisition of the natural gas liquids pipeline and fractionation assets On February 21, 2013 NuStar notified TexStar that we do not believe TexStar has the legal right to terminate the asset purchase agreement NuStar is currently evaluating its legal options If NuStar does not complete this acquisition we do not expect a material adverse impact on our results of operations |
|
|
25 Financial Overview |

|
|
26 Capital Structure as of December 31, 2012 (Dollars in Millions) $1.2 billion Credit Facility $440 NuStar Logistics Notes (4.75%) 259 NuStar Logistics Notes (4.80%) 477 NuStar Logistics Notes (6.05%) 231 NuStar Logistics Notes (7.90%) 353 NuStar Pipeline Notes (5.875%) 251 GO Zone Bonds 365 Other Debt 35 Total Debt $2,411 Total Partners’ Equity 2,585 Total Capitalization $4,996 Issued $402.5 million in Junior Subordinated Notes in January 2013 primarily to repay funds borrowed under Credit Facility to finance TexStar crude oil pipeline acquisition Debt values are adjusted for unamortized discounts and fair value adjustments as of December 31, 2012 |
|
|
27 Debt Maturity Profile Debt Maturities as of December 31, 2012 ($ in Millions) Debt structure approximately 66% fixed rate – 34% variable rate $0 $250 $500 $750 $1,000 2013 2017 2018 2020 2022 2038-2041 $480 $350 $450 $250 $34 Misc. Note UK Term Loan GO Zone Financing Sr. Unsecured Notes Revolver $365 $1 $440 $515 |
|
|
NuStar Overview 28 Internal Growth Project Spending Continues to Increase (Dollars in Millions) 2013 internal growth spending could be as low as around $440 million without closing on the TexStar NGL asset acquisition and as high as approximately $600 million if the closing occurs $0 $100 $200 $300 $400 2009 2010 2011 2012 $164 $219 $294 $374 2009 - 2012 Internal Growth Project Spending |
|
|
29 We Expect to Attain a 1.0x Coverage Ratio in the 4th quarter of 2013 In the fourth quarter of 2013 and for the full year of 2014 we expect our coverage ratios to exceed 1.0x Assumes no equity issuances in 2013 & 2014 These coverage ratio levels should be attained even if the TexStar NGL Asset transaction does not close |
|
|
30 NuStar Highlights High quality, large and diverse asset footprint supporting energy infrastructure both in the U.S. and internationally Contracted fee-based storage and transportation assets provide stable cash flows, delivering approximately 96% of 2012 segment operating income Diverse and high quality customer base composed of large integrated oil companies, national oil companies and refiners Strong balance sheet, credit metrics and commitment to obtaining investment grade credit ratings Experienced and proven management team with substantial equity ownership and industry experience Recognized nationally for safety and environmental record as well as one of Fortune’s Best Places to Work |
|
|
Appendix 31 |

|
|
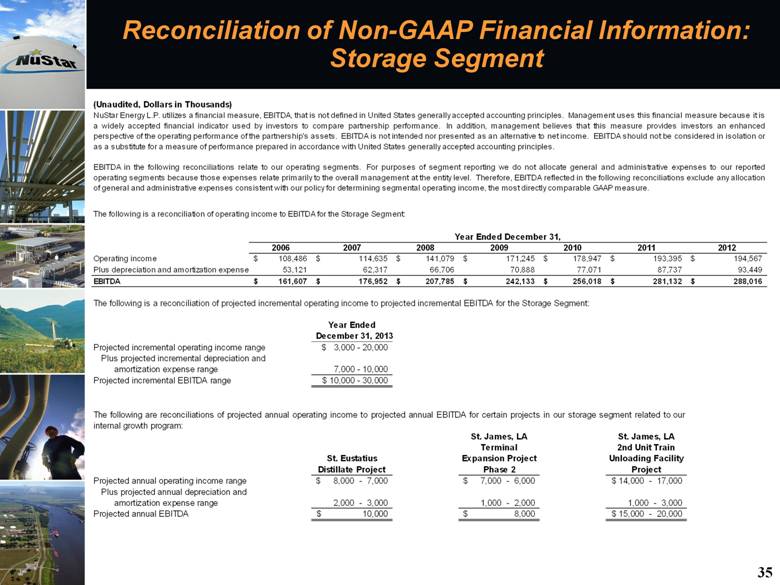
NuStar Overview 35 Reconciliation of Non-GAAP Financial Information: Storage Segment 35 (Unaudited, Dollars in Thousands) The following is a reconciliation of operating income to EBITDA for the Storage Segment: 2006 2007 2008 2009 2010 2011 2012 Operating income 108,486 $ 114,635 $ 141,079 $ 171,245 $ 178,947 $ 193,395 $ 194,567 $ Plus depreciation and amortization expense 53,121 62,317 66,706 70,888 77,071 87,737 93,449 EBITDA 161,607 $ 176,952 $ 207,785 $ 242,133 $ 256,018 $ 281,132 $ 288,016 $ Year Ended December 31, 2013 Projected incremental operating income range $ 3,000 - 20,000 Plus projected incremental depreciation and amortization expense range 7,000 - 10,000 Projected incremental EBITDA range $ 10,000 - 30,000 St. Eustatius Distillate Project St. James, LA Terminal Expansion Project Phase 2 St. James, LA 2nd Unit Train Unloading Facility Project Projected annual operating income range $ 8,000 - 7,000 $ 7,000 - 6,000 $ 14,000 - 17,000 Plus projected annual depreciation and amortization expense range 2,000 - 3,000 1,000 - 2,000 1,000 - 3,000 Projected annual EBITDA 10,000 $ 8,000 $ $ 15,000 - 20,000 The following are reconciliations of projected annual operating income to projected annual EBITDA for certain projects in our storage segment related to our internal growth program: The following is a reconciliation of projected incremental operating income to projected incremental EBITDA for the Storage Segment: Year Ended December 31, NuStar Energy L.P. utilizes a financial measure, EBITDA, that is not defined in United States generally accepted accounting principles. Management uses this financial measure because it is a widely accepted financial indicator used by investors to compare partnership performance. In addition, management believes that this measure provides investors an enhanced perspective of the operating performance of the partnership's assets. EBITDA is not intended nor presented as an alternative to net income. EBITDA should not be considered in isolation or as a substitute for a measure of performance prepared in accordance with United States generally accepted accounting principles. EBITDA in the following reconciliations relate to our operating segments. For purposes of segment reporting we do not allocate general and administrative expenses to our reported operating segments because those expenses relate primarily to the overall management at the entity level. Therefore, EBITDA reflected in the following reconciliations exclude any allocation of general and administrative expenses consistent with our policy for determining segmental operating income, the most directly comparable GAAP measure. The following is a reconciliation of operating income to EBITDA for the Storage Segment: |
|
|
NuStar Overview 36 Reconciliation of Non-GAAP Financial Information: Pipeline Segment 36 (Unaudited, Dollars in Thousands) The following is a reconciliation of operating income to EBITDA for the Pipeline Segment: 2006 2007 2008 2009 2010 2011 2012 Operating income 122,714 $ 126,508 $ 135,086 $ 139,869 $ 148,571 $ 146,403 $ 158,590 $ Plus depreciation and amortization expense 47,145 49,946 50,749 50,528 50,617 51,165 52,878 EBITDA 169,859 $ 176,454 $ 185,835 $ 190,397 $ 199,188 $ 197,568 $ 211,468 $ Year Ended December 31, 2013 Projected incremental operating income range $ 55,000 - 65,000 Plus projected incremental depreciation and amortization expense range 15,000 - 25,000 Projected incremental EBITDA range $ 70,000 - 90,000 Completed Eagle Ford Expansion Projects ConocoPhillips Eagle Ford Project Projected annual operating income range $ 26,000 - 25,000 $ 12,000 - 10,000 Plus projected annual depreciation and amortization expense range 4,000 - 5,000 3,000 - 5,000 Projected annual EBITDA 30,000 $ 15,000 $ The following are reconciliations of projected annual operating income to projected annual EBITDA for certain projects in our Pipeline Segment related to our internal growth program: The following is a reconciliation of projected incremental operating income to projected incremental EBITDA for the Pipeline Segment: NuStar Energy L.P. utilizes a financial measure, EBITDA, that is not defined in United States generally accepted accounting principles. Management uses this financial measure because it is a widely accepted financial indicator used by investors to compare partnership performance. In addition, management believes that this measure provides investors an enhanced perspective of the operating performance of the partnership's assets. EBITDA is not intended nor presented as an alternative to net income. EBITDA should not be considered in isolation or as a substitute for a measure of performance prepared in accordance with United States generally accepted accounting principles. EBITDA in the following reconciliations relate to our operating segments. For purposes of segment reporting we do not allocate general and administrative expenses to our reported operating segments because those expenses relate primarily to the overall management at the entity level. Therefore, EBITDA reflected in the following reconciliations exclude any allocation of general and administrative expenses consistent with our policy for determining segmental operating income, the most directly comparable GAAP measure. Year Ended December 31, |
|
|
Reconciliation of Non-GAAP Financial Information: Fuels Marketing Segment 37 (Unaudited, Dollars in Thousands) The following is a reconciliation of projected operating income to projected EBITDA for the Fuels Marketing Segment: Years Ended December 31, 2013 and 2014 Projected operating income range $ 40,000 - 59,500 Plus projected depreciation and amortization expense range 0 - 500 Projected annual EBITDA range $ 40,000 - 60,000 NuStar Energy L.P. utilizes a financial measure, EBITDA, that is not defined in United States generally accepted accounting principles. Management uses this financial measure because it is a widely accepted financial indicator used by investors to compare partnership performance. In addition, management believes that this measure provides investors an enhanced perspective of the operating performance of the partnership's assets. EBITDA is not intended nor presented as an alternative to net income. EBITDA should not be considered in isolation or as a substitute for a measure of performance prepared in accordance with United States generally accepted accounting principles. EBITDA in the following reconciliations relate to our operating segments. For purposes of segment reporting we do not allocate general and administrative expenses to our reported operating segments because those expenses relate primarily to the overall management at the entity level. Therefore, EBITDA reflected in the following reconciliations exclude any allocation of general and administrative expenses consistent with our policy for determining segmental operating income, the most directly comparable GAAP measure. |