Attached files
| file | filename |
|---|---|
| 8-K - EXELIS INC. 8-K - Exelis Inc. | a50581528.htm |
| EX-99.1 - EXHIBIT 99.1 - Exelis Inc. | a50581528ex99_1.htm |
Exhibit 99.2
Fourth Quarter / Full-Year
2012 David Melcher President and Chief Executive Officer Peter Milligan
Senior Vice President and Chief Financial Officer March 1, 2013
Safe Harbor Statement 2
Safe Harbor Statement under the Private Securities Litigation Reform Act
of 1995 (the “Act”): Some of the information included herein includes
forward-looking statements intended to qualify for the safe harbor from
liability established by the Private Securities Litigation Reform Act of
1995 (the “Act”). Whenever used, words such as “anticipate,” “estimate,”
“expect,” “project,” “intend,” “plan,” “believe,” “target,” “may,”
“could,” “outlook” and other terms of similar meaning are intended to
identify such forward-looking statements. Forward-looking statements are
uncertain and to some extent unpredictable, and involve known and
unknown risks, uncertainties and other important factors that could
cause actual results to differ materially from those expressed in, or
implied from, such forward-looking statements. The Company undertakes no
obligation to update any forward-looking statements, whether as a result
of new information, future events or otherwise, except as required by
law. In addition, forward-looking statements are subject to certain
risks and uncertainties that could cause actual results to differ
materially from the Company’s historical experience and our present
expectations or projections. These risks and uncertainties include, but
are not limited to: The forward-looking statements in this release are
made as of the date hereof and the company undertakes no obligation to
update any forward-looking statements, whether as a result of new
information, future events or otherwise. In addition, forward-looking
statements are subject to certain risks and uncertainties that could
cause actual results to differ materially from the company’s historical
experience and our present expectations or projections. These risks and
uncertainties include, but are not limited to, those described in the
Exelis Inc. Form 10-K for the fiscal year ended December 31, 2012, and
those described from time to time in our future reports filed with the
Securities and Exchange Commission. Our dependence on the defense
industry and the business risks peculiar to that industry, including
changing priorities or reductions in the U.S. Government or
international defense budgets; Government regulations and compliance
therewith, including changes to the Department of Defense procurement
process; Our international operations, including sales to foreign
customers; Competition, industry capacity and production rates;
Misconduct of our employees, subcontractors, agents and
businesspartners; The level of returns on postretirement benefit plan
assets and potential employee benefit plan contributions and other
employment and pension matters; Changes in interest rates and other
factors that affect earnings and cash flows; The mix of our contracts
and programs, our performance, and our ability to control costs;
Governmental investigations; Our level of indebtedness and our ability
to make payments on or service our indebtedness; Subcontractor
performance; Economic and capital markets conditions; The availability
and pricing of raw materials and components; Ability to retain and
recruit qualified personnel; Protection of intellectual property rights;
Changes in technology; Contingencies related to actual or alleged
environmental contamination, claims and concerns; Security breaches and
other disruptions to our information technology and operations; and
Unanticipated changes in our tax provisions or exposure to additional
income tax liabilities.
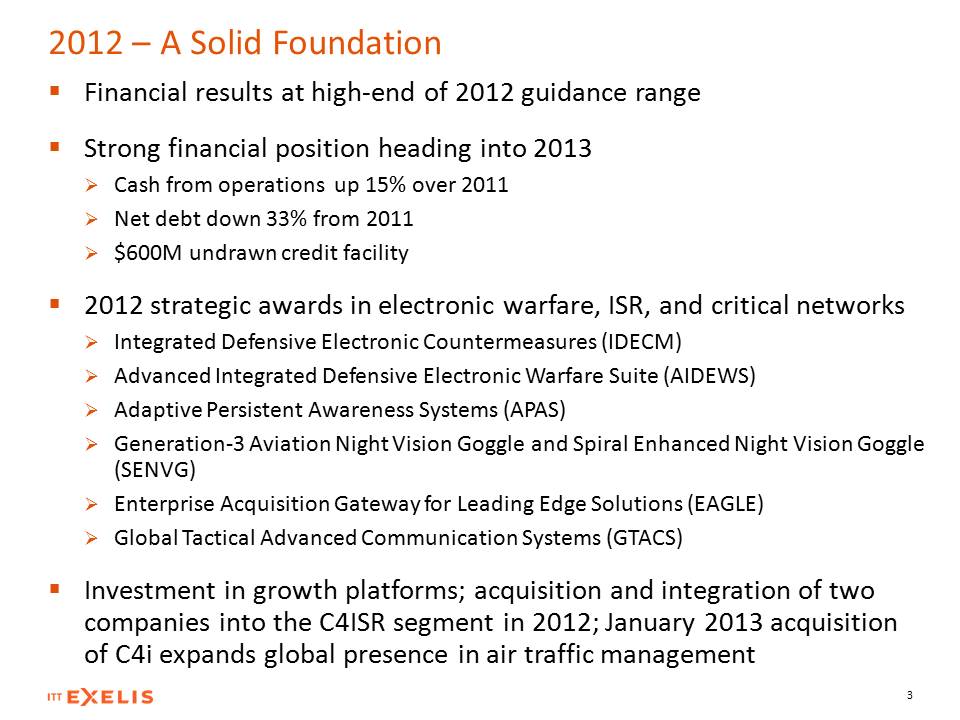
2012 – A Solid Foundation
Financial results at high-end of 2012 guidance range Strong financial
position heading into 2013 Cash from operations up 15% over 2011 Net
debt down 33% from 2011 $600M undrawn credit facility 2012 strategic
awards in electronic warfare, ISR, and critical networks Integrated
Defensive Electronic Countermeasures (IDECM) Advanced Integrated
Defensive Electronic Warfare Suite (AIDEWS) Adaptive Persistent
Awareness Systems (APAS) Generation-3 Aviation Night Vision Goggle and
Spiral Enhanced Night Vision Goggle (SENVG) Enterprise Acquisition
Gateway for Leading Edge Solutions (EAGLE) Global Tactical Advanced
Communication Systems (GTACS) Investment in growth platforms;
acquisition and integration of twocompanies into the C4ISR segment in
2012; January 2013 acquisitionof C4i expands global presence in air
traffic management 3
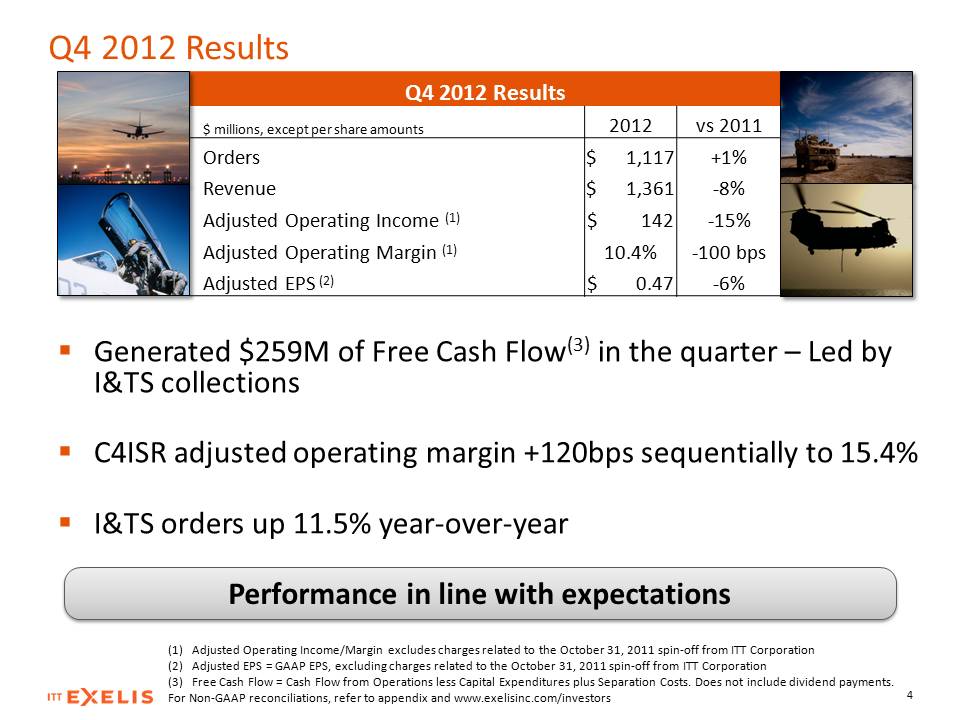
Q4 2012 Results Q4 2012
Results $ millions, except per share amounts 2012 vs 2011 Orders $ 1,117
+1% Revenue $ 1,361 -8% Adjusted Operating Income (1) $ 142 -15%
Adjusted Operating Margin (1) 10.4% -100 bps Adjusted EPS (2) $ 0.47 -6%
(1) Adjusted Operating Income/Margin excludes charges related to the
October 31, 2011 spin-off from ITT Corporation (2) Adjusted EPS = GAAP
EPS, excluding charges related to the October 31, 2011 spin-off from ITT
Corporation (3) Free Cash Flow = Cash Flow from Operations less Capital
Expenditures plus Separation Costs. Does not include dividend payments.
For Non-GAAP reconciliations, refer to appendix and
www.exelisinc.com/investors 4 Generated $259M of Free Cash Flow(3) in
the quarter – Led by I&TS collections C4ISR adjusted operating margin
+120bps sequentially to 15.4% I&TS orders up 11.5% year-over-year
Performance in line with expectations
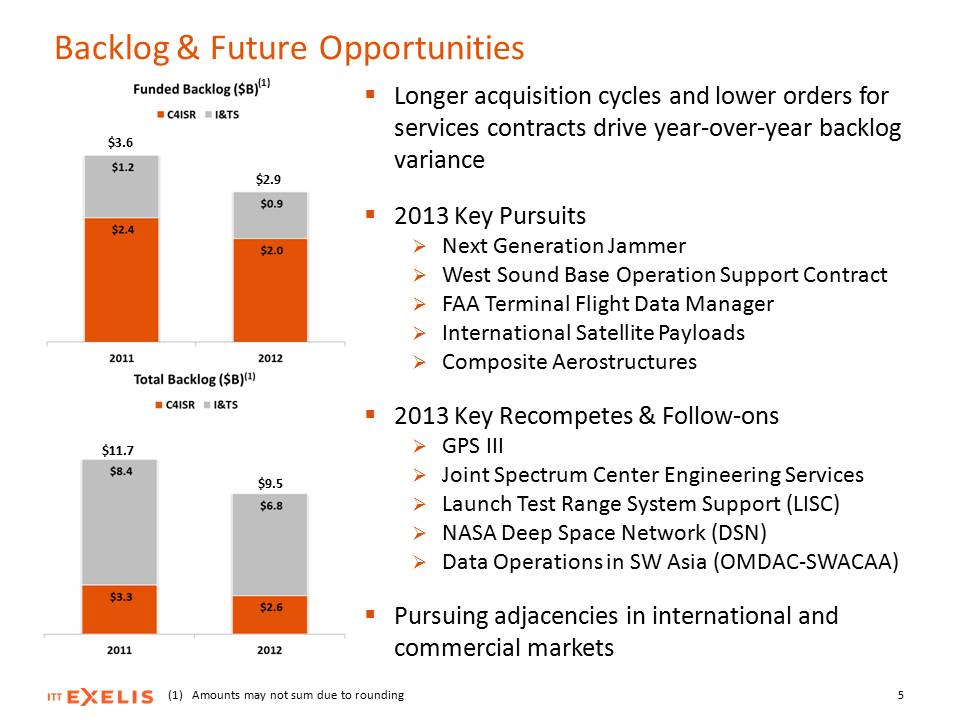
Backlog& Future
Opportunities 5 $3.6 $2.9 $11.7 $9.5 Longer acquisition cycles and lower
orders for services contracts drive year-over-year backlog variance 2013
Key Pursuits Next Generation Jammer West Sound Base Operation Support
Contract FAA Terminal Flight Data Manager International Satellite
Payloads Composite Aerostructures 2013 Key Recompetes & Follow-ons GPS
III Joint Spectrum Center Engineering Services Launch Test Range System
Support (LISC) NASA Deep Space Network (DSN) Data Operations in SW Asia
(OMDAC-SWACAA) Pursuing adjacencies in international and commercial
markets (1) Amounts may not sum due to rounding
(1)
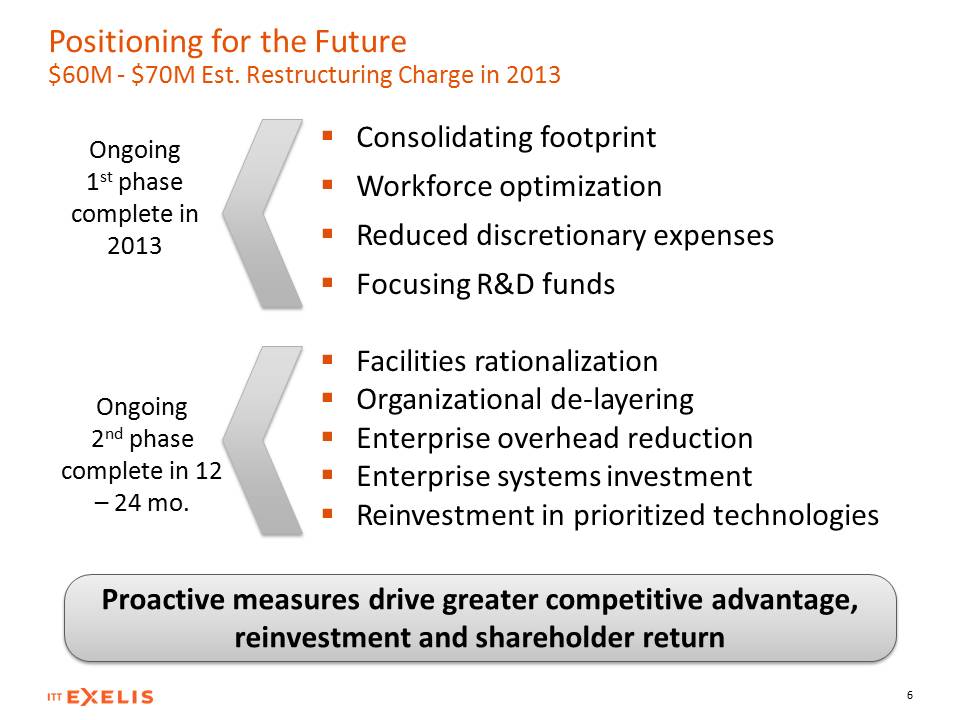
Positioning for the
Future $60M - $70M Est. Restructuring Charge in 2013 6 Consolidating
footprint Workforce optimization Reduced discretionary expenses Focusing
R&D funds Proactive measures drive greater competitive advantage,
reinvestment and shareholder return Ongoing 2nd phase complete in 12 –
24 mo. Facilities rationalization Organizational de-layering Enterprise
overhead reduction Enterprise systems investment Reinvestment in
prioritized technologies Ongoing 1st phase complete in 2013
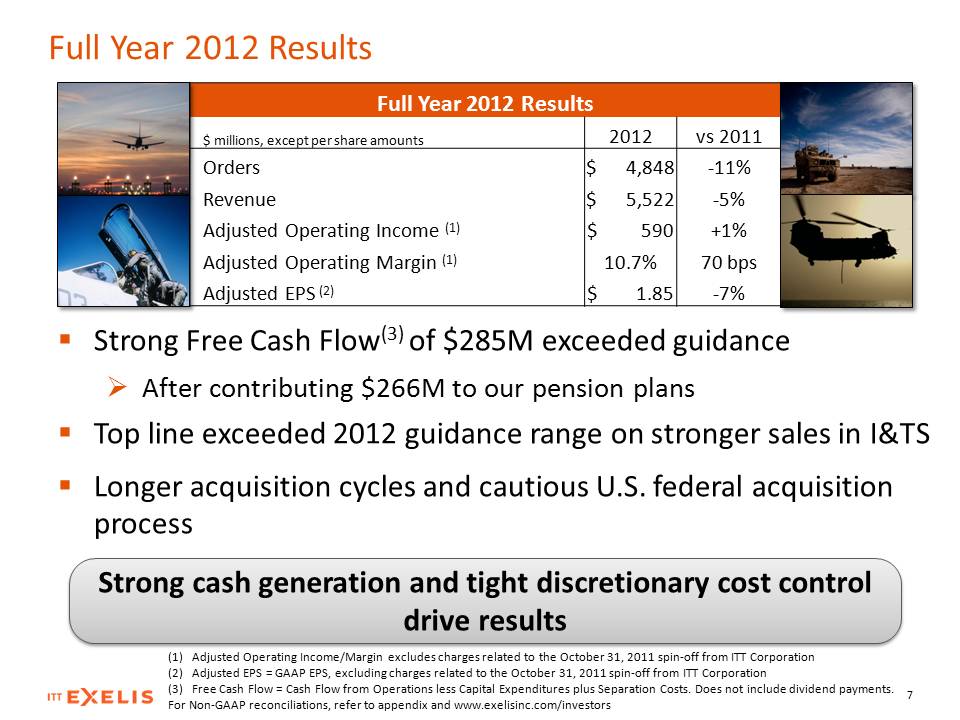
Full Year 2012 ResultsStrong Free Cash Flow(3) of $285M exceeded guidance ¾ After contributing $266M to our pension plans Top line exceeded 2012 guidance range on stronger sales in I&TS Longer acquisition cycles and cautious U.S. federal acquisition process
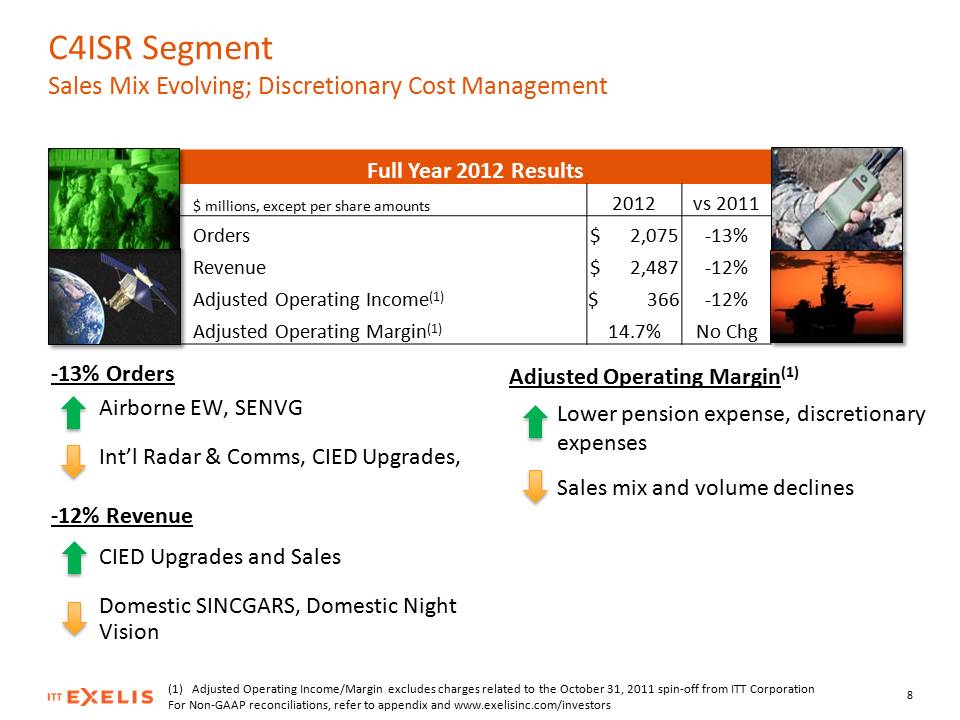
C4ISR Segment Sales Mix Evolving; Discretionary Cost Management
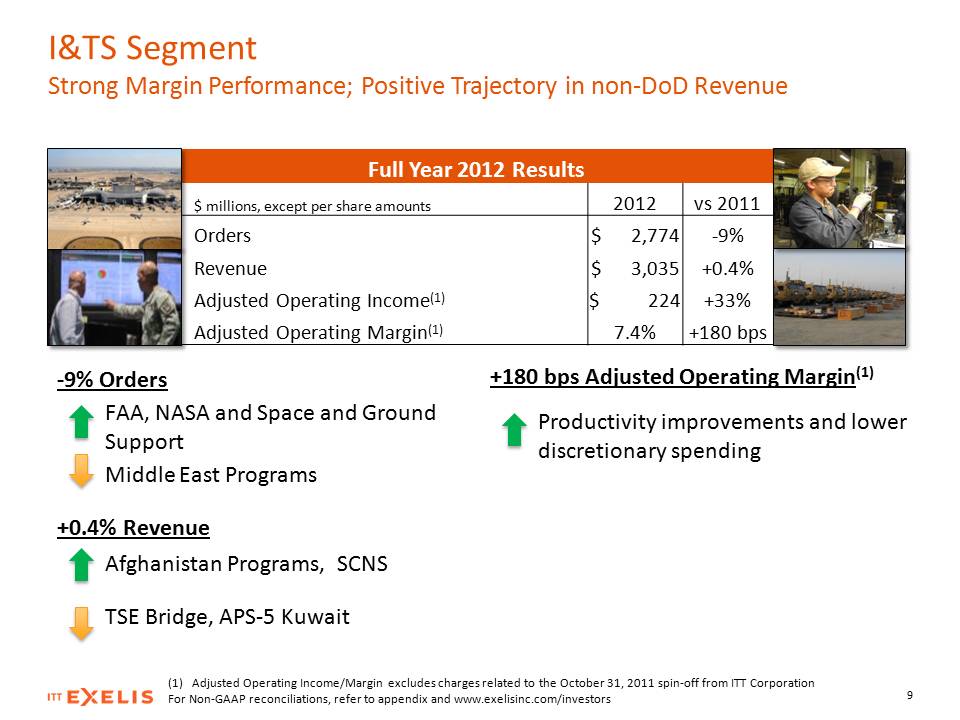
I&TS Segment Strong Margin Performance; Positive Trajectory in non-DoD Revenue Full Year 2012 Results $ millions, except per share amounts 2012 vs 2011 Orders $ 2,774 -9% Revenue $ 3,035 +0.4% Adjusted Operating Income(1) $ 224 +33% Adjusted Operating Margin(1) 7.4% +180 bps -9% Orders FAA, NASA and Space and Ground Support Middle East Programs +180 bps Adjusted Operating Margin(1) Productivity improvements and lower discretionary spending +0.4% Revenue Afghanistan Programs, SCNS TSE Bridge, APS-5 Kuwait (1) Adjusted Operating Income/Margin excludes charges related to the October 31, 2011 spin-off from ITT Corporation For Non-GAAP reconciliations, refer to appendix and www.exelisinc.com/investors
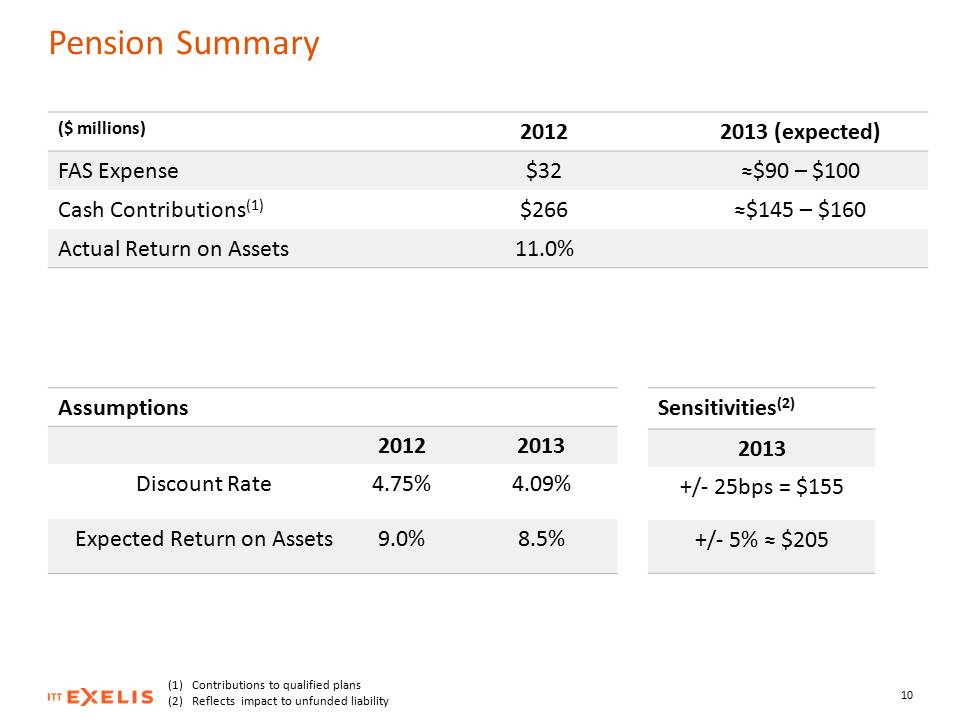
Pension Summary ($ millions) 2012 2013 (expected) +/- 25bps = $155(1) Contributions to qualified plans (2) Reflects impact to unfunded liability Assumptions Sensitivities(2
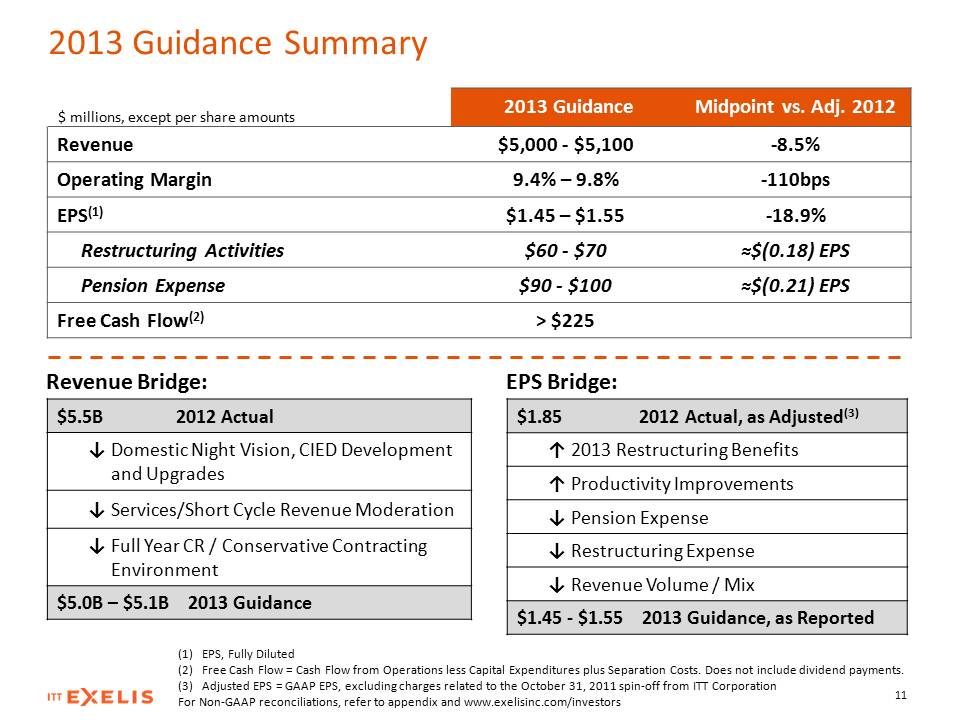
2013 Guidance Summary $ millions, except per share amounts Revenue 2013 Guidance $5,000 -$5,100 Midpoint vs. Adj. 2012 -8.5% Operating Margin 9.4% – 9.8% -110bps EPS(1) $1.45 – $1.55 -18.9% Restructuring Activities $60 - $70 у$(0.18) EPS Pension Expense $90 - $100 у$(0.21) EPS Free Cash Flow(2) > $225 Revenue Bridge: $5.5 B 2012 Actual љ Domestic Night Vision, CIED Development and Upgrades љ Services/Short Cycle Revenue Moderation љ Full Year CR / Conservative Contracting Environment $5.0B – $5.1B 2013 Guidance EPS Bridge: $1.85 2012 Actual, as Adjusted(3) ј 2013 Restructuring Benefits ј Productivity Improvements љ Pension Expense љ Restructuring Expense љ Revenue Volume / Mix $1.45 - $1.55 2013 Guidance, as Reported EPS, Fully Diluted Free Cash Flow = Cash Flow from Operations less Capital Expenditures plus Separation Costs. Does not include dividend payments. Adjusted EPS = GAAP EPS, excluding charges related to the October 31, 2011 spin-off from ITT Corporation For Non-GAAP reconciliations, refer to appendix and www.exelisinc.com/investors

Appendix
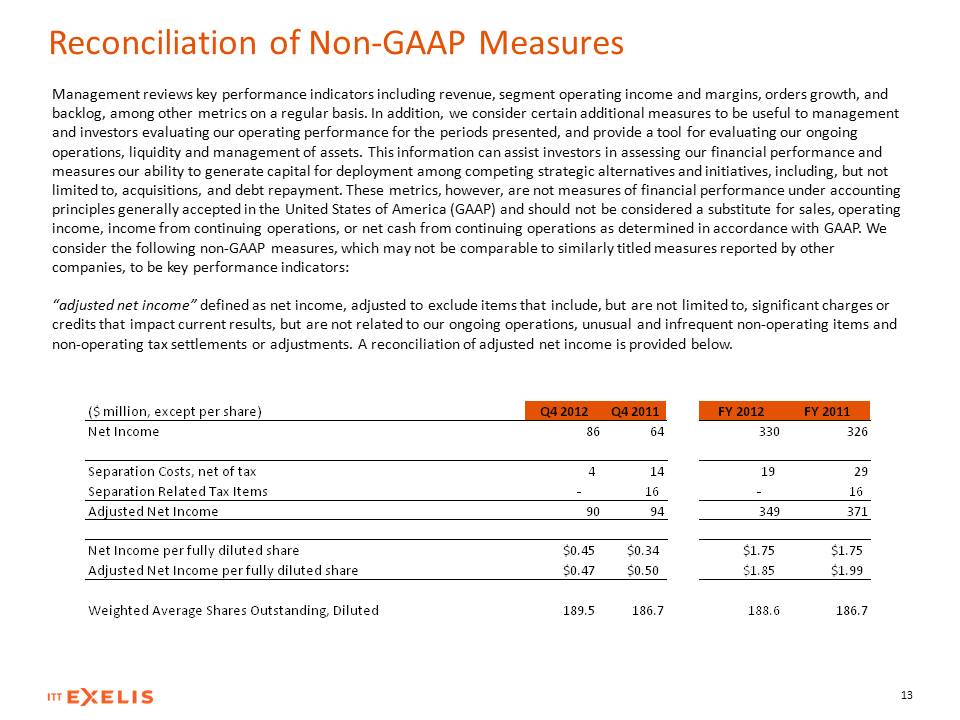
Reconciliation of Non-GAAP Measures Management reviews key performance indicators including revenue, segment operating income and margins, orders growth, and backlog, among other metrics on a regular basis. In addition, we consider certain additional measures to be useful to management and investors evaluating our operating performance for the periods presented, and provide a tool for evaluating our ongoing operations, liquidity and management of assets. This information can assist investors in assessing our financial performance and measures our ability to generate capital for deployment among competing strategic alternatives and initiatives, including, but not limited to, acquisitions, and debt repayment. These metrics, however, are not measures of financial performance under accounting principles generally accepted in the United States of America (GAAP) and should not be considered a substitute for sales, operating income, income from continuing operations, or net cash from continuing operations as determined in accordance with GAAP. We consider the following non-GAAP measures, which may not be comparable to similarly titled measures reported by other companies, to be key performance indicators: “adjusted net income” defined as net income, adjusted to exclude items that include, but are not limited to, significant charges or credits that impact current results, but are not related to our ongoing operations, unusual and infrequent non-operating items and non-operating tax settlements or adjustments. A reconciliation of adjusted net income is provided below. ($ million, except per share) Q4 2012 Q4 2011 FY 2012 FY 2011 Net Income 86 64 330 326 Separation Costs, net of tax 4 14 19 29 Separation Related Tax Items - 16 - 16 Adjusted Net Income 90 94 349 371 Net Income per fully diluted share $0.45 $0.34 $1.75 $1.75 Adjusted Net Income per fully diluted share $0.47 $0.50 $1.85 $1.99 Weighted Average Shares Outstanding, Diluted 189.5 186.7 188.6 186.7
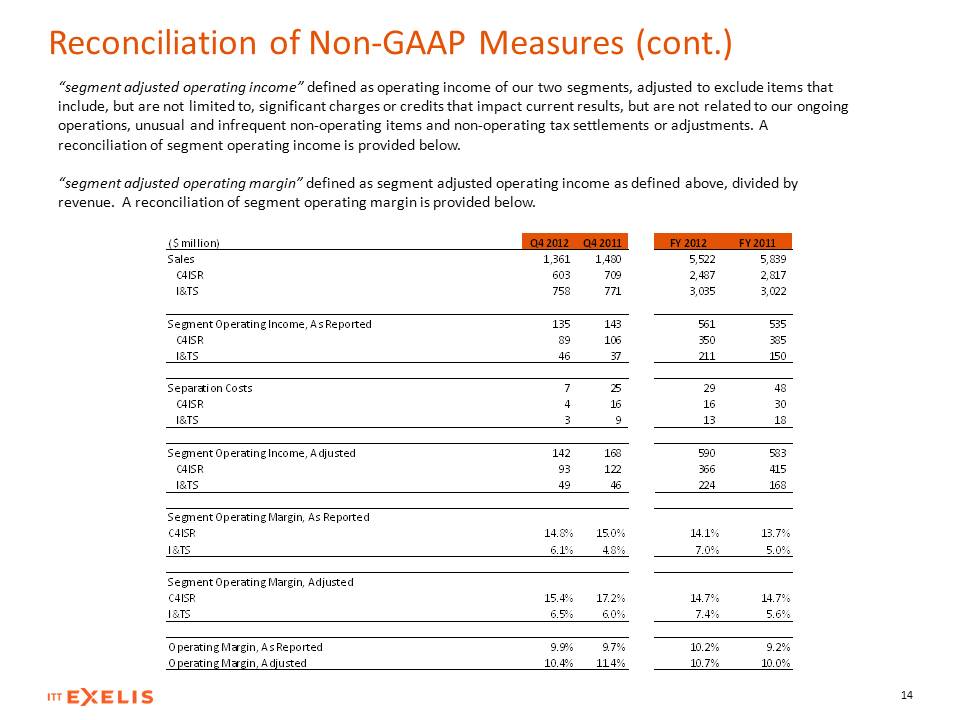
Reconciliation of Non-GAAP Measures (cont.) “segment adjusted operating income” defined as operating income of our two segments, adjusted to exclude items that include, but are not limited to, significant charges or credits that impact current results, but are not related to our ongoing operations, unusual and infrequent non-operating items and non-operating tax settlements or adjustments. A reconciliation of segment operating income is provided below. “segment adjusted operating margin” defined as segment adjusted operating income as defined above, divided by revenue. A reconciliation of segment operating margin is provided below. ($ million) Q4 2012 Q4 2011 FY 2012 FY 2011 Sales 1,361 1,480 5,522 5,839 C4ISR 603 709 2,487 2,817 I &TS 758 771 3,035 3,022 Segment Operating Income, As Reported 135 143 561 535 C4ISR 89 106 350 385 I &TS 46 37 211 150 25 29 48 Separation Costs 7 C4ISR 4 16 16 30 I &TS 3 9 13 18 168 590 583 Segment Operating Income, Adjusted 142 C4ISR 93 122 366 415 I &TS 49 46 224 168
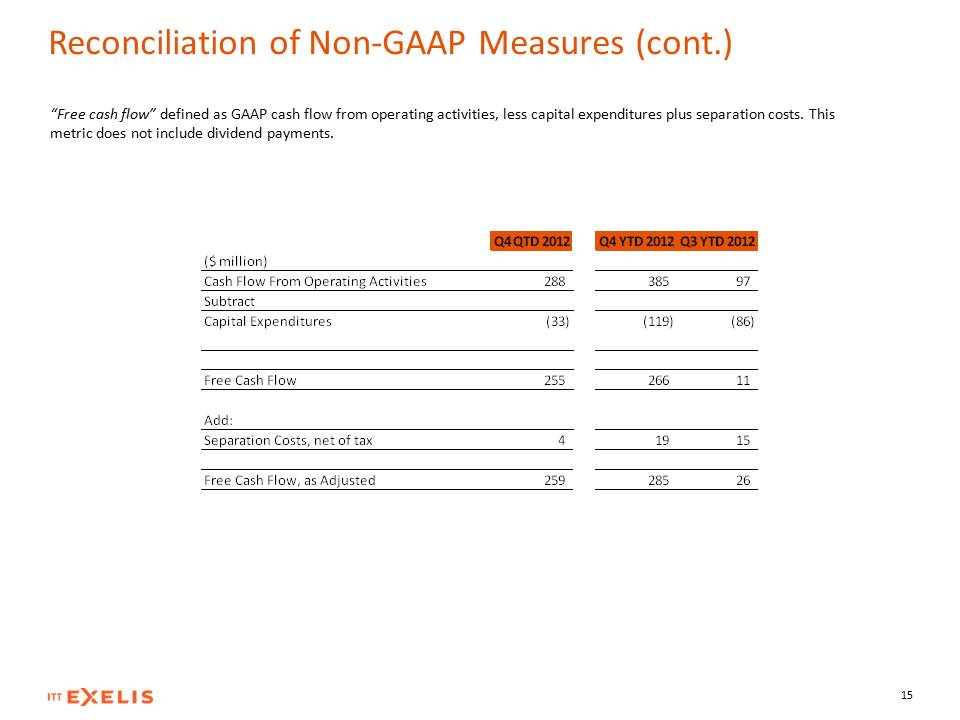
“Free cash flow” defined as GAAP cash flow from operating activities, less capital expenditures plus separation costs. This metric does not include dividend payments. Q4 QTD 2012 Q4 YTD 2012 Q3 YTD 2012 ($ million) Cash Flow From Operating Activities 288 385 97 Subtract Capital Expenditures (33) (119) (86) Free Cash Flow 255 266 11 Add: Separation Costs, net of tax 4 19 15 Free Cash Flow, as Adjusted 259 285 26
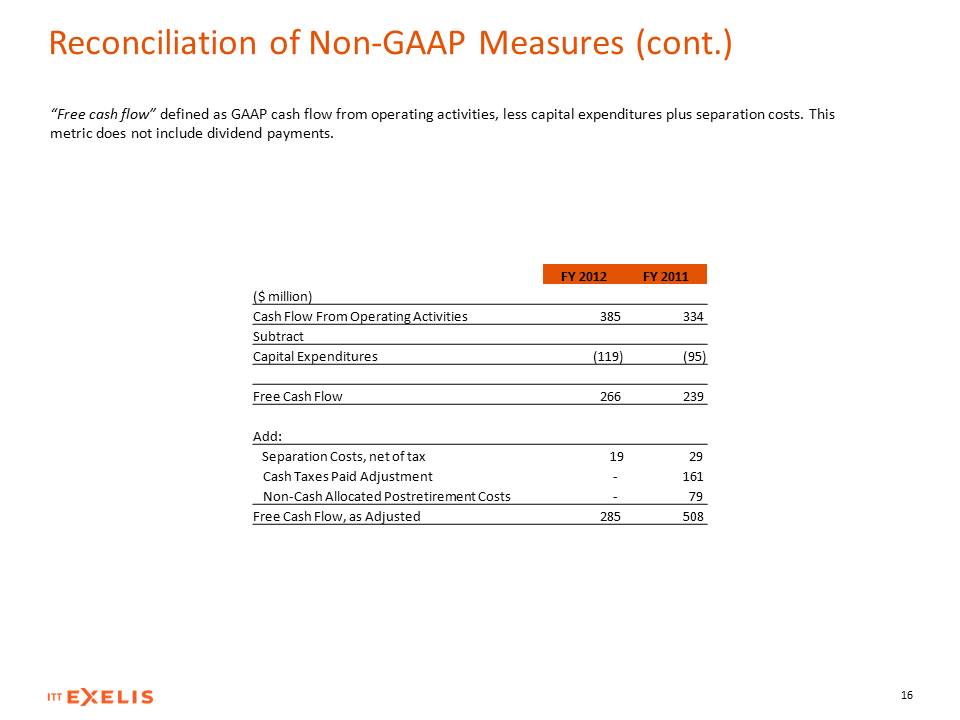
“Free cash flow” defined as GAAP cash flow from operating activities, less capital expenditures plus separation costs. This metric does not include dividend payments. FY 2012 FY 2011 ($ million) Cash Flow From Operating Activities 385 334 Subtract Capital Expenditures (119) (95) Free Cash Flow 266 239 Add: Separation Costs, net of tax Cash Taxes Paid Adjustment Non-Cash Allocated Postretirement Costs 19 - - 29 161 79 Free Cash Flow, as Adjusted 285 508