Attached files
| file | filename |
|---|---|
| 8-K - FORM 8-K - DiamondRock Hospitality Co | d495453d8k.htm |
Exhibit 99.1

| Investor Presentation March 2013 |
| table of contents Investment Highlights............................................. 4 Strategy and Portfolio Repositioning............................ 6 Internal Growth Opportunities................................... 15 Capital Structure.................................................... 25 Game Plan: Next Five Years....................................... 27 2 |

| 3 INVESTMENT Highlights |
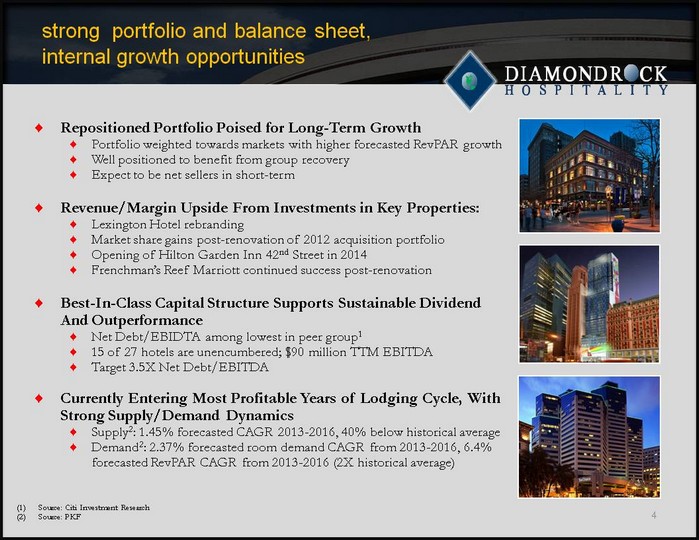
| strong portfolio and balance sheet, internal growth opportunities Repositioned Portfolio Poised for Long-Term Growth Portfolio weighted towards markets with higher forecasted RevPAR growth Well positioned to benefit from group recovery Expect to be net sellers in short-term Revenue/Margin Upside From Investments in Key Properties: Lexington Hotel rebranding Market share gains post-renovation of 2012 acquisition portfolio Opening of Hilton Garden Inn 42nd Street in 2014 Frenchman's Reef Marriott continued success post-renovation Best-In-Class Capital Structure Supports Sustainable Dividend And Outperformance Net Debt/EBIDTA among lowest in peer group1 15 of 27 hotels are unencumbered; $90 million TTM EBITDA Target 3.5X Net Debt/EBITDA Currently Entering Most Profitable Years of Lodging Cycle, With Strong Supply/Demand Dynamics Supply2: 1.45% forecasted CAGR 2013-2016, 40% below historical average Demand2: 2.37% forecasted room demand CAGR from 2013-2016, 6.4% forecasted RevPAR CAGR from 2013-2016 (2X historical average) 4 Source: Citi Investment Research Source: PKF |

| 5 Strategy & Portfolio Repositioning |
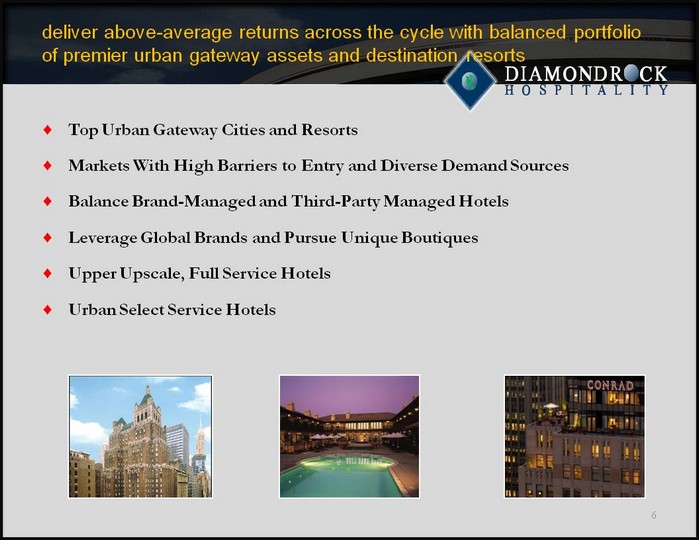
| deliver above-average returns across the cycle with balanced portfolio of premier urban gateway assets and destination resorts Top Urban Gateway Cities and Resorts Markets With High Barriers to Entry and Diverse Demand Sources Balance Brand-Managed and Third-Party Managed Hotels Leverage Global Brands and Pursue Unique Boutiques Upper Upscale, Full Service Hotels Urban Select Service Hotels 6 |
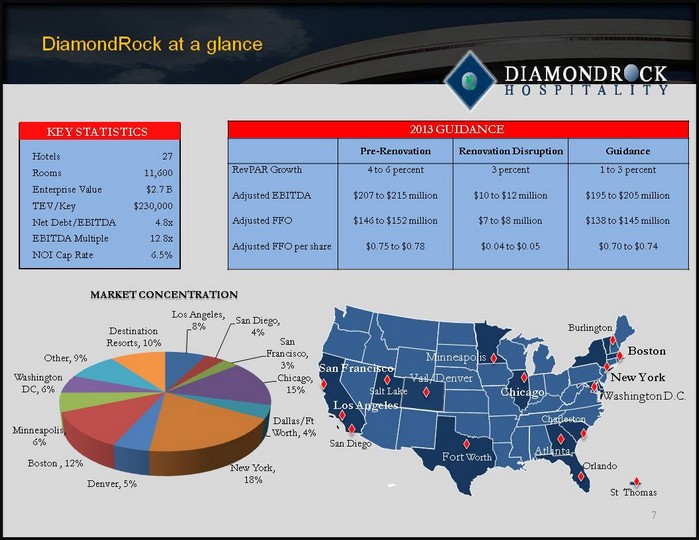
| (CHART) (CHART) DiamondRock at a glance 7 Hotels 27 Rooms 11,600 Enterprise Value $2.7 B TEV/Key $230,000 Net Debt/EBITDA 4.8x EBITDA Multiple 12.8x NOI Cap Rate 6.5% KEY STATISTICS 2013 GUIDANCE 2013 GUIDANCE 2013 GUIDANCE 2013 GUIDANCE Pre-Renovation Renovation Disruption Guidance RevPAR Growth 4 to 6 percent 3 percent 1 to 3 percent Adjusted EBITDA $207 to $215 million $10 to $12 million $195 to $205 million Adjusted FFO $146 to $152 million $7 to $8 million $138 to $145 million Adjusted FFO per share $0.75 to $0.78 $0.04 to $0.05 $0.70 to $0.74 MARKET CONCENTRATION |

| Premier portfolio with urban concentration 8 Hotel Rex San Francisco Hilton Minneapolis Chicago Marriott Conrad Chicago Boston Westin Hilton Boston Hilton Burlington Courtyard Midtown NYC Lexington Hotel NYC Hilton Garden Inn 42nd Street NYC Courtyard 5th Ave NYC Hilton Garden Inn Chelsea NYC Westin Washington DC Salt Lake City Marriott Westin San Diego Courtyard Denver JW Marriott Denver Worthington Renaissance Sonoma Renaissance Resort Frenchman's Reef Marriott Resort Charleston Renaissance Vail Marriott Resort Los Angeles Airport Marriott Oak Brook Hills Chicago Marriott Orlando Airport Marriott Alpharetta Marriott Atlanta Bethesda Marriott Suites Urban Resort Airport/Other Torrance Marriott |
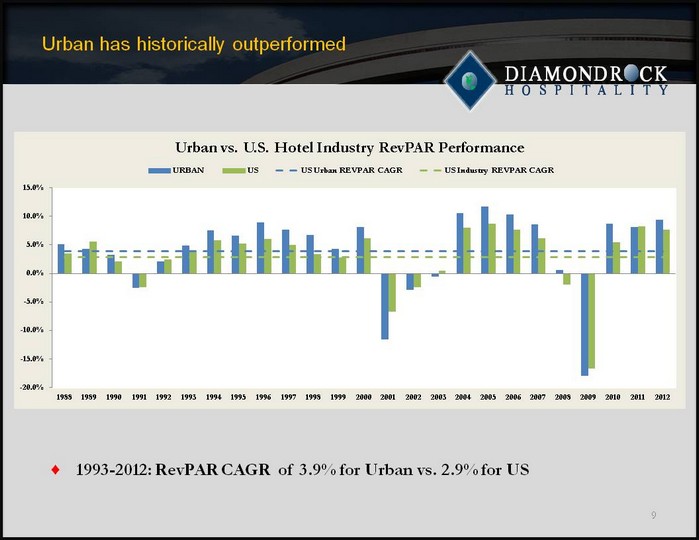
| Urban has historically outperformed 9 1993-2012: RevPAR CAGR of 3.9% for Urban vs. 2.9% for US (CHART) |
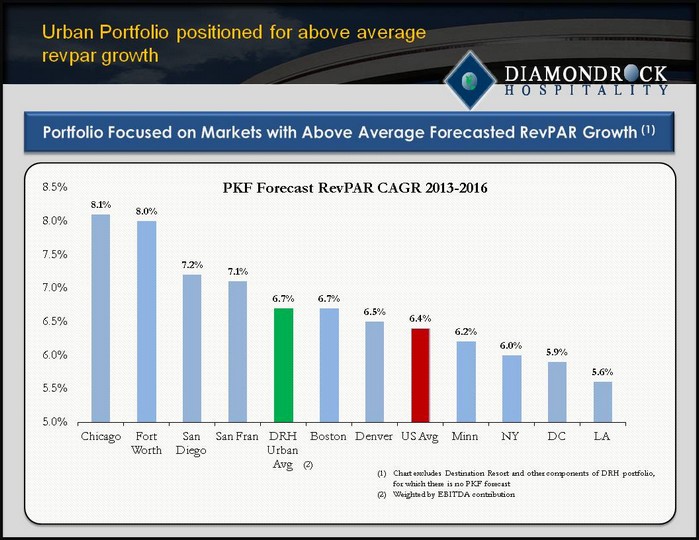
| Urban Portfolio positioned for above average revpar growth 10 Portfolio Focused on Markets with Above Average Forecasted RevPAR Growth (1) (CHART) PKF Forecast RevPAR CAGR 2013-2016 Chart excludes Destination Resort and other components of DRH portfolio, for which there is no PKF forecast Weighted by EBITDA contribution (2) |
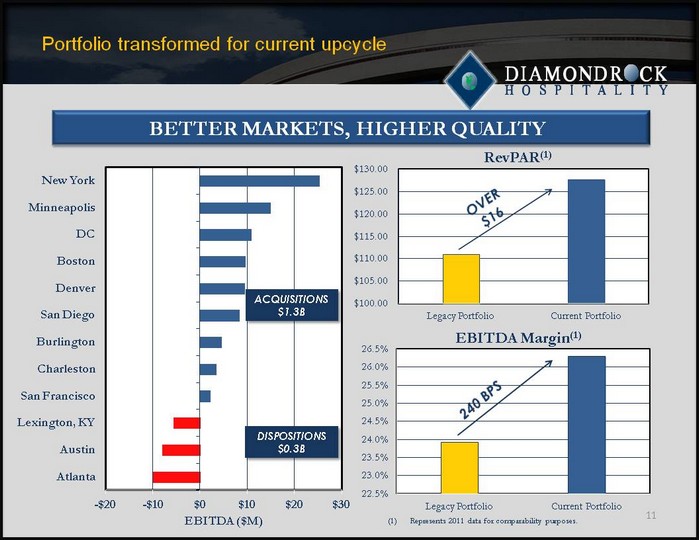
| Portfolio transformed for current upcycle 11 (CHART) (CHART) Represents 2011 data for comparability purposes. (CHART) OVER $16 240 BPS BETTER MARKETS, HIGHER QUALITY ACQUISITIONS $1.3B DISPOSITIONS $0.3B |
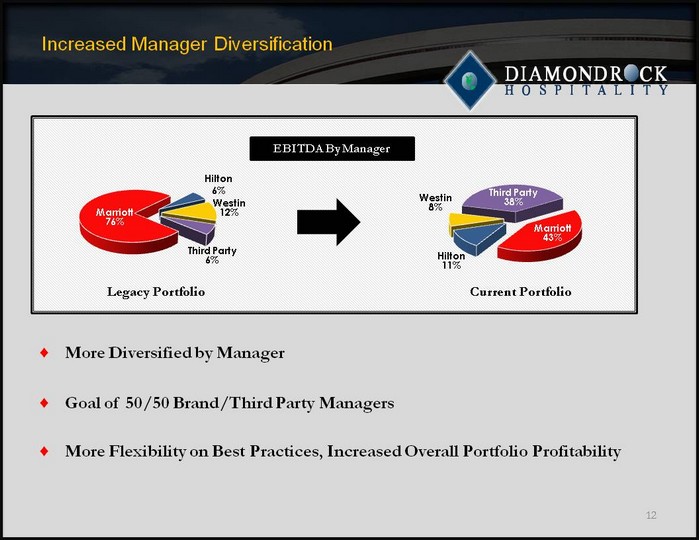
| Increased Manager Diversification 12 More Diversified by Manager Goal of 50/50 Brand/Third Party Managers More Flexibility on Best Practices, Increased Overall Portfolio Profitability Legacy Portfolio Current Portfolio |
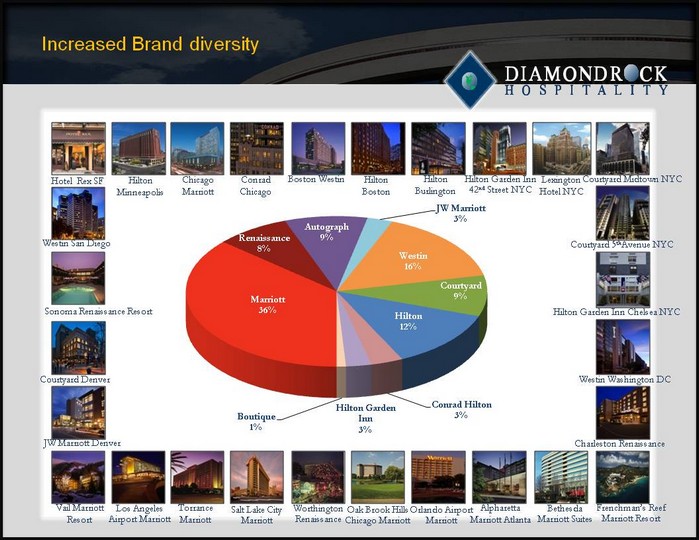
| Increased Brand diversity 13 KEY STATS AT 11/6/12 JW Marriott Denver Westin San Diego Worthington Renaissance Hilton Boston Lexington Hotel NYC Hilton Garden Inn Chelsea NYC Hilton Burlington Sonoma Renaissance Resort Chicago Marriott Boston Westin Courtyard Midtown NYC Courtyard 5thAvenue NYC Frenchman's Reef Marriott Resort Los Angeles Airport Marriott Torrance Marriott Salt Lake City Marriott Oak Brook Hills Chicago Marriott Bethesda Marriott Suites Charleston Renaissance Alpharetta Marriott Atlanta Orlando Airport Marriott Hilton Garden Inn 42nd Street NYC Hotel Rex SF Courtyard Denver Westin Washington DC Vail Marriott Resort Conrad Chicago Hilton Minneapolis (CHART) |
| 14 Internal GROWTH opportunities |
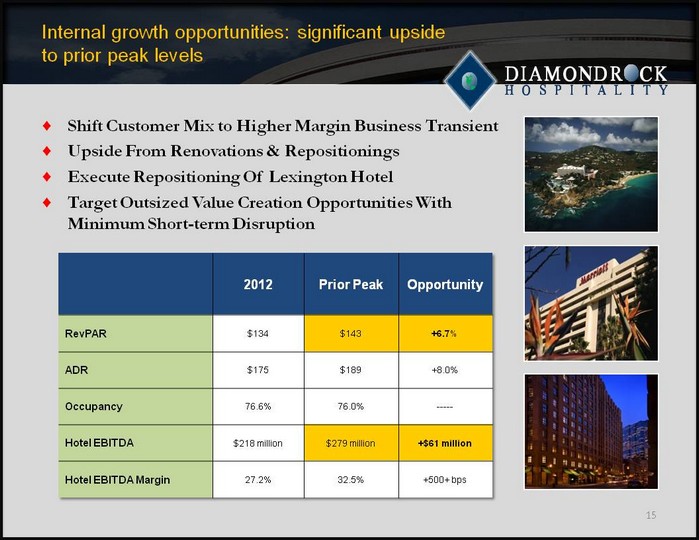
| Internal growth opportunities: significant upside to prior peak levels 15 2012 Prior Peak Opportunity RevPAR $134 $143 +6.7% ADR $175 $189 +8.0% Occupancy 76.6% 76.0% ----- Hotel EBITDA $218 million $279 million +$61 million Hotel EBITDA Margin 27.2% 32.5% +500+ bps Shift Customer Mix to Higher Margin Business Transient Upside From Renovations & Repositionings Execute Repositioning Of Lexington Hotel Target Outsized Value Creation Opportunities With Minimum Short-term Disruption |
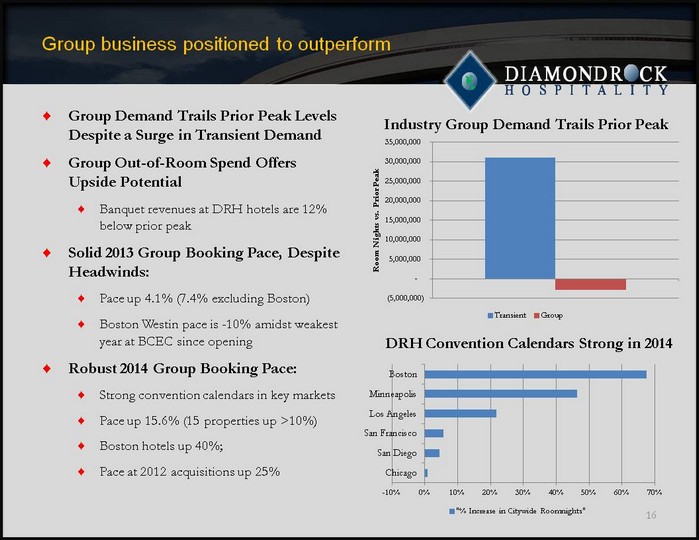
| Group business positioned to outperform 16 (CHART) Industry Group Demand Trails Prior Peak DRH Convention Calendars Strong in 2014 (CHART) Group Demand Trails Prior Peak Levels Despite a Surge in Transient Demand Group Out-of-Room Spend Offers Upside Potential Banquet revenues at DRH hotels are 12% below prior peak Solid 2013 Group Booking Pace, Despite Headwinds: Pace up 4.1% (7.4% excluding Boston) Boston Westin pace is -10% amidst weakest year at BCEC since opening Robust 2014 Group Booking Pace: Strong convention calendars in key markets Pace up 15.6% (15 properties up >10%) Boston hotels up 40%; Pace at 2012 acquisitions up 25% |
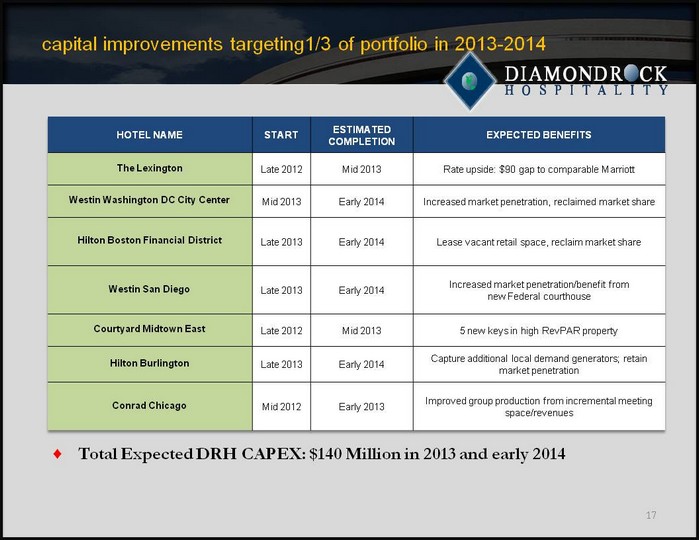
| capital improvements targeting1/3 of portfolio in 2013-2014 17 HOTEL NAME START ESTIMATED COMPLETION EXPECTED BENEFITS The Lexington Late 2012 Mid 2013 Rate upside: $90 gap to comparable Marriott Westin Washington DC City Center Mid 2013 Early 2014 Increased market penetration, reclaimed market share Hilton Boston Financial District Late 2013 Early 2014 Lease vacant retail space, reclaim market share Westin San Diego Late 2013 Early 2014 Increased market penetration/benefit from new Federal courthouse Courtyard Midtown East Late 2012 Mid 2013 5 new keys in high RevPAR property Hilton Burlington Late 2013 Early 2014 Capture additional local demand generators; retain market penetration Conrad Chicago Mid 2012 Early 2013 Improved group production from incremental meeting space/revenues Total Expected DRH CAPEX: $140 Million in 2013 and early 2014 |
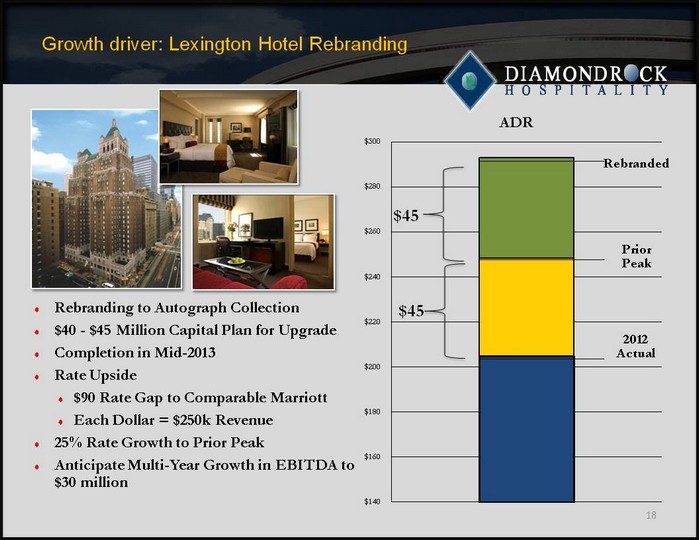
| Growth driver: Lexington Hotel Rebranding Rebranding to Autograph Collection $40 - $45 Million Capital Plan for Upgrade Completion in Mid-2013 Rate Upside $90 Rate Gap to Comparable Marriott Each Dollar = $250k Revenue 25% Rate Growth to Prior Peak Anticipate Multi-Year Growth in EBITDA to $30 million 18 $4 5 $4 5 |
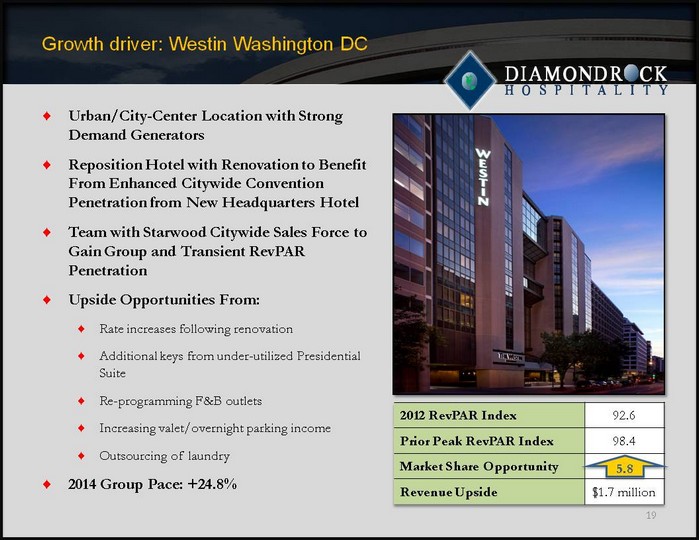
| Growth driver: Westin Washington DC Urban/City-Center Location with Strong Demand Generators Reposition Hotel with Renovation to Benefit From Enhanced Citywide Convention Penetration from New Headquarters Hotel Team with Starwood Citywide Sales Force to Gain Group and Transient RevPAR Penetration Upside Opportunities From: Rate increases following renovation Additional keys from under-utilized Presidential Suite Re-programming F&B outlets Increasing valet/overnight parking income Outsourcing of laundry 2014 Group Pace: +24.8% 19 2012 RevPAR Index 92.6 Prior Peak RevPAR Index 98.4 Market Share Opportunity Revenue Upside $1.7 million 5.8 |
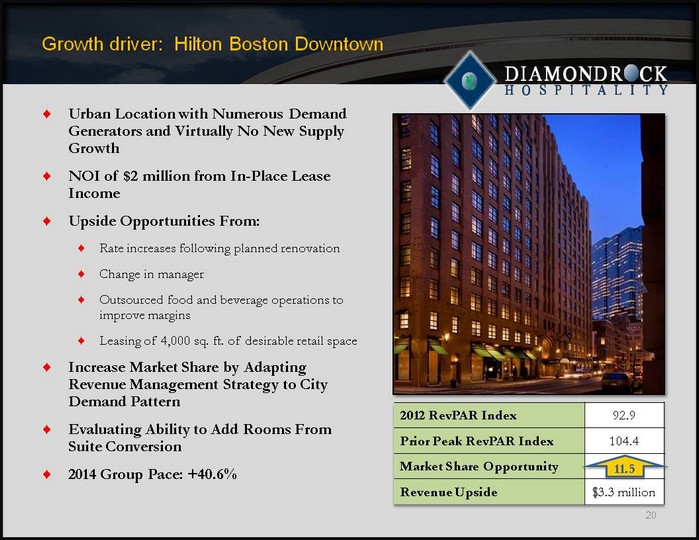
| Growth driver: Hilton Boston Downtown Urban Location with Numerous Demand Generators and Virtually No New Supply Growth NOI of $2 million from In-Place Lease Income Upside Opportunities From: Rate increases following planned renovation Change in manager Outsourced food and beverage operations to improve margins Leasing of 4,000 sq. ft. of desirable retail space Increase Market Share by Adapting Revenue Management Strategy to City Demand Pattern Evaluating Ability to Add Rooms From Suite Conversion 2014 Group Pace: +40.6% 20 2012 RevPAR Index 92.9 Prior Peak RevPAR Index 104.4 Market Share Opportunity Revenue Upside $3.3 million 11. 5 |

| Growth driver: Westin San Diego Urban Location with Multiple Demand Generators for Legal, Convention Center and Gaslamp District Leisure Business Team with Starwood Citywide Sales Force to Enhance Group and Transient RevPAR Penetration Increased Demand from New Federal Courthouse for High-Rated Law Firm Business Upside Opportunities From: Higher RevPAR following renovation Potential outsourcing of F&B outlet Activate lobby area 2014 Group Pace: +21.7% 21 2012 RevPAR Index 106.7 Prior Peak RevPAR Index 112.8 Market Share Opportunity Revenue Upside $1.6 million 6.1 |
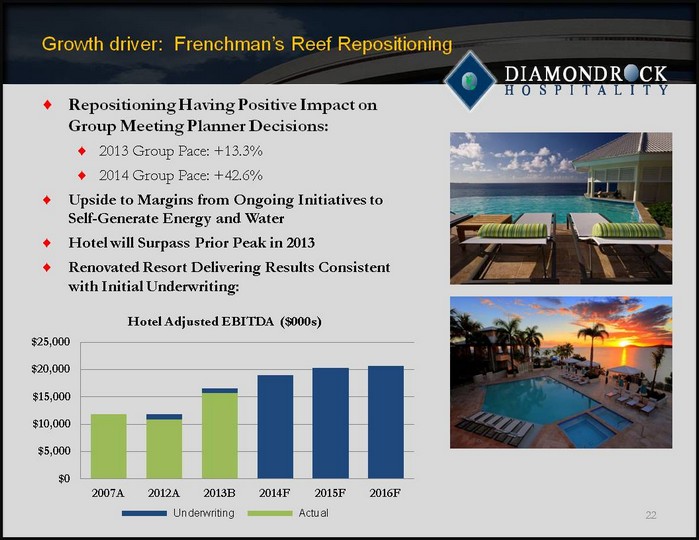
| Growth driver: Frenchman's Reef Repositioning Repositioning Having Positive Impact on Group Meeting Planner Decisions: 2013 Group Pace: +13.3% 2014 Group Pace: +42.6% Upside to Margins from Ongoing Initiatives to Self-Generate Energy and Water Hotel will Surpass Prior Peak in 2013 Renovated Resort Delivering Results Consistent with Initial Underwriting: 22 (CHART) Actual |

| Growth driver: hilton garden inn times square 23 Irreplaceable Location (42nd St & Broadway) Below Market Cost ($450,000 Per Key) 282 Keys - Expected 2014 Delivery Immediately Accretive (9% Initial EBITDA Yield) Contemporary Design (275 SF Average Size) Bryant Park Times Square 42nd Street Broadway |
| 24 capital structure |
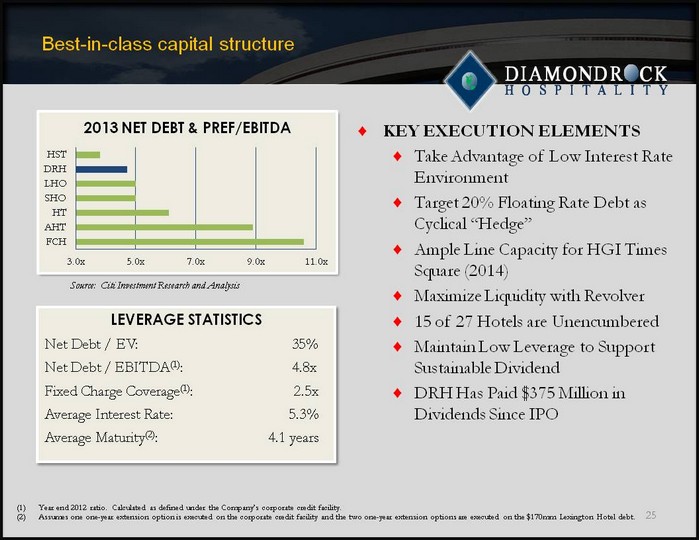
| Best-in-class capital structure KEY EXECUTION ELEMENTS Take Advantage of Low Interest Rate Environment Target 20% Floating Rate Debt as Cyclical "Hedge" Ample Line Capacity for HGI Times Square (2014) Maximize Liquidity with Revolver 15 of 27 Hotels are Unencumbered Maintain Low Leverage to Support Sustainable Dividend DRH Has Paid $375 Million in Dividends Since IPO 25 Source: Citi Investment Research and Analysis (CHART) LEVERAGE STATISTICS Net Debt / EV: 35% Net Debt / EBITDA(1): 4.8x Fixed Charge Coverage(1): 2.5x Average Interest Rate: 5.3% Average Maturity(2): 4.1 years Year end 2012 ratio. Calculated as defined under the Company's corporate credit facility. Assumes one one-year extension option is executed on the corporate credit facility and the two one-year extension options are executed on the $170mm Lexington Hotel debt. |

| 26 Game plan: next five years |
| THE NEXT FIVE YEARS Profitability: Have Best-in-Class Margin Controls With the Most Respected Asset Management Function Balance Sheet: Achieve Leverage Target of 3.5x Net Debt-to-EBITDA, Continue to Stagger Maturities, and Minimize Corporate Debt Portfolio Exposure: Continue to Increase Exposure to CBD Locations in Long-Term, Top-Performing MSAs Acquisitions: Complete acquisition of Hilton Garden Inn Times Square in 2014 and selectively evaluate other compelling transactions Manager Diversification: Balance brand-managed and 3rd-party managers (1:1 ratio by EBITDA) Dispositions: Complete Sale of Select Non-Core Hotels, Including Oak Brook Hills Marriott 27 |
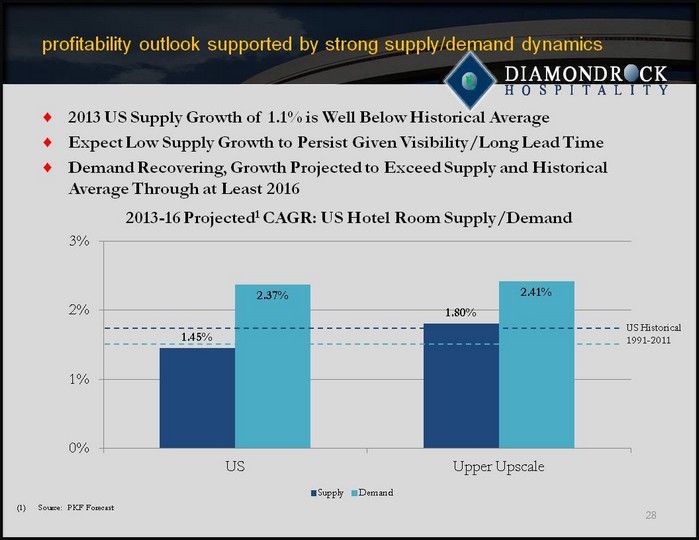
| profitability outlook supported by strong supply/demand dynamics 2013 US Supply Growth of 1.1% is Well Below Historical Average Expect Low Supply Growth to Persist Given Visibility/Long Lead Time Demand Recovering, Growth Projected to Exceed Supply and Historical Average Through at Least 2016 28 (CHART) US Historical 1991-2011 Source: PKF Forecast |
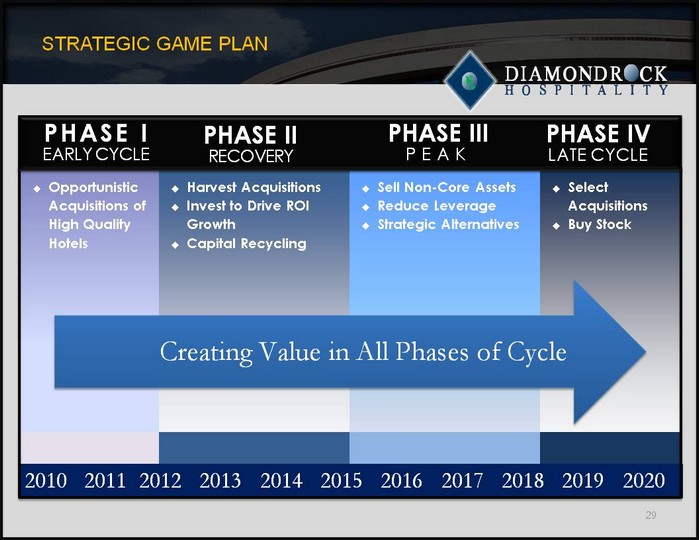
| STRATEGIC GAME PLAN 29 Opportunistic Acquisitions of High Quality Hotels Harvest Acquisitions Invest to Drive ROI Growth Capital Recycling Sell Non-Core Assets Reduce Leverage Strategic Alternatives Select Acquisitions Buy Stock 2010 2011 2012 2013 2014 2015 2016 2017 2018 2019 2020 PHASE I EARLY CYCLE PHASE II RECOVERY PHASE III PEAK PHASE IV LATE CYCLE Creating Value in All Phases of Cycle |
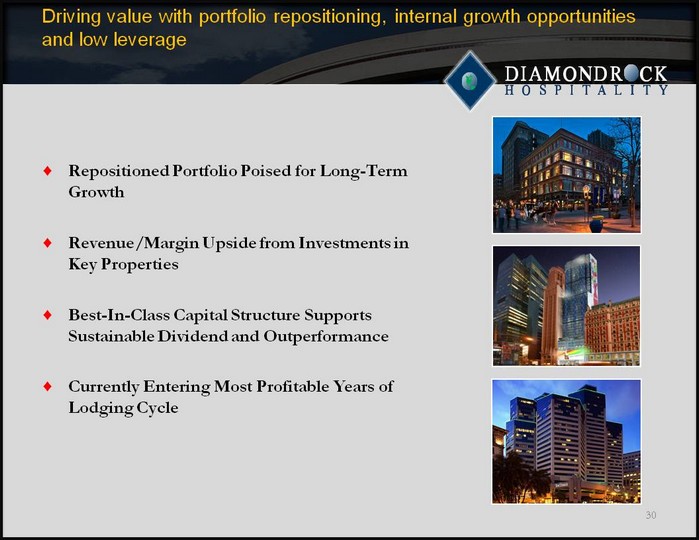
| Driving value with portfolio repositioning, internal growth opportunities and low leverage Repositioned Portfolio Poised for Long- Term Growth Revenue/Margin Upside from Investments in Key Properties Best-In-Class Capital Structure Supports Sustainable Dividend and Outperformance Currently Entering Most Profitable Years of Lodging Cycle 30 |
| Safe Harbor Certain statements made during this presentation are forward-looking and are subject to risks and uncertainties. Many of these risks and uncertainties are discussed in the prospectus supplement and in the Company's filings with the Securities and Exchange Commission, all of which you should carefully review. The forward-looking statements made are based on our beliefs, assumptions and expectations of future performance, taking into account all information currently available to us. Actual results could differ materially from the forward-looking statements made during this presentation. When we use the words "believe," "expect," "anticipate," "plan," "will," "intend" or other similar expressions, we are identifying forward-looking statements. The forward-looking statements made during this presentation are subject to the safe harbor of the Private Securities Litigation Reform Act of 1995. 31 |