Attached files
| file | filename |
|---|---|
| 8-K - CURRENT REPORT - Wendy's Co | d493897d8k.htm |
 Fourth
Quarter 2012 Earnings Conference Call
February 28, 2013
Exhibit 99.1
©
2013 Oldemark LLC |
 ©
2013 Oldemark LLC
JOHN BARKER
Chief Communications Officer
2 |
 Today’s Agenda
Opening Comments
Emil Brolick
Financial Update
Steve Hare
CEO Overview
Emil Brolick
Q&A
3 |
 This
presentation, and certain information that management may discuss in connection with this presentation,
contains certain statements that are not historical facts, including information
concerning possible or assumed
future
results
of
our
operations.
Those
statements
constitute
“forward-looking
statements”
within
the meaning of the Private Securities Litigation Reform Act of 1995 (The “Reform
Act”). For all forward-looking statements, we claim the protection of the
safe harbor for forward-looking statements contained in the Reform Act.
Many
important
factors
could
affect
our
future
results
and
could
cause
those
results
to
differ
materially
from
those expressed in or implied by our forward-looking statements. Such factors, all of
which are difficult or impossible to predict accurately, and many of which are
beyond our control, include but are not limited to those
identified
under
the
caption
“Forward-Looking
Statements”
in
our
news
release
issued
on
February
28,
2013
and
in
the
“Special
Note
Regarding
Forward-Looking
Statements
and
Projections”
and
“Risk
Factors”
sections of our most recent Form 10-K / Form 10-Qs.
In addition, this presentation and certain information management may discuss in
connection with this presentation reference non-GAAP financial measures, such
as adjusted earnings before interest, taxes, depreciation and amortization, or
adjusted EBITDA, and adjusted earnings per share. Adjusted EBITDA and adjusted
earnings per share exclude certain expenses, net of certain benefits. Reconciliations of non-GAAP
financial measures to the most directly comparable GAAP financial measures are provided
in the Appendix to this presentation, and are included in our news release issued
on February 28, 2013 and posted on www.aboutwendys.com.
Forward-Looking Statements and Non-GAAP
Financial Measures
4 |
 EMIL
BROLICK President & CEO
5
©
2013 Oldemark LLC |
 FY
Adjusted EBITDA* $333.3 mil
vs.
$331.1 mil
Q4 Adjusted EBITDA*
$
95.9
mil
vs.
$ 80.9 mil
FY Adjusted EPS*
$0.17
vs.
$0.15
FY SSS
1.6%
vs.
2.0%
Q4 SSS
(0.2)%
vs.
5.1%
2012 and Fourth-Quarter Highlights
6
2012
2011
*See reconciliation of Adjusted EBITDA from continuing operations and Adjusted
EPS in the appendix. Doubled Quarterly Dividend Rate in Q4 2012: $0.04 per
share |
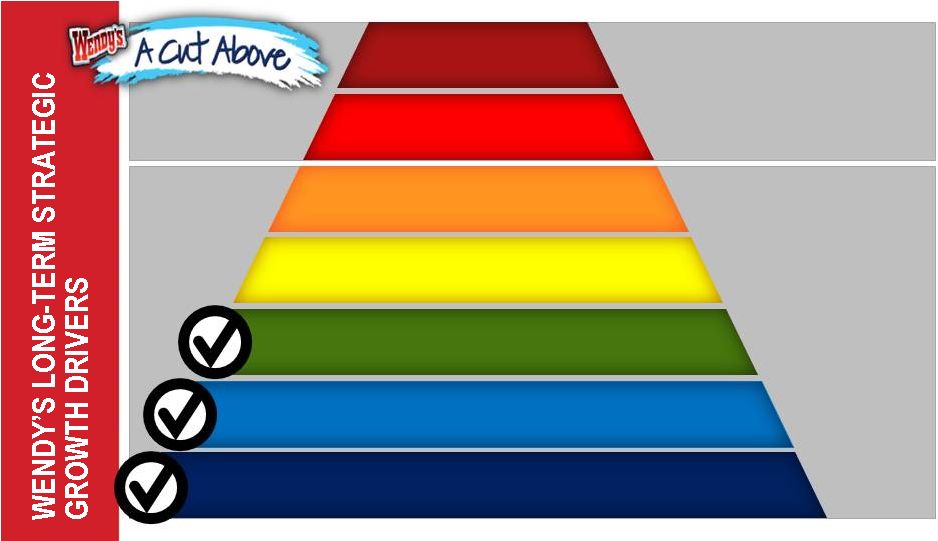 7
Core Organic
Growth
Strategies
Shareholder
Value-Enhancing
Initiatives
Image / Experience Activation
Restaurant Ownership
Optimization
Financial Management
Global Growth
Global Growth
Restaurant Utilization
& Daypart Expansion
New Restaurant Development
North America Same-Store Sales Growth |
 PRICE
New QSR Quality at QSR Price
PRODUCT
Play a different game …
Superior
perceived quality, competitive price
PEOPLE
5-Star Performers
PERFORMANCE
Keeping the brand promise
PROMOTION
Strategically driven, tactically brilliant
PLACE
The complete brand experience
8
Enabling Profitable Growth
THE RECIPE TO WIN |
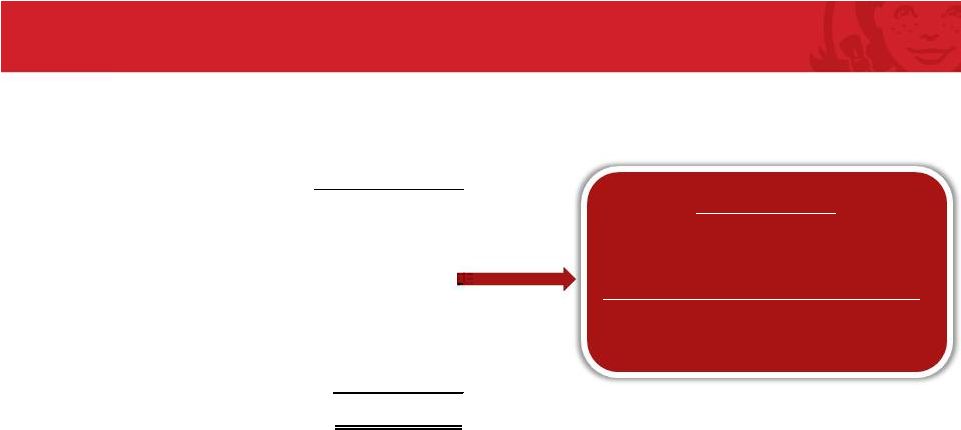
 Product /
Price Segmentation Core and LTO Innovation
Value Menu
High
Low
9 |
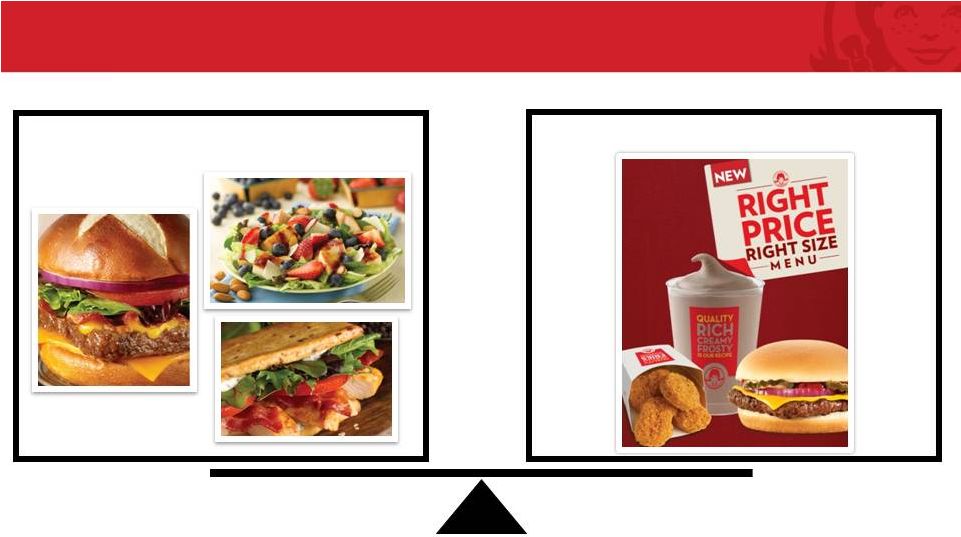
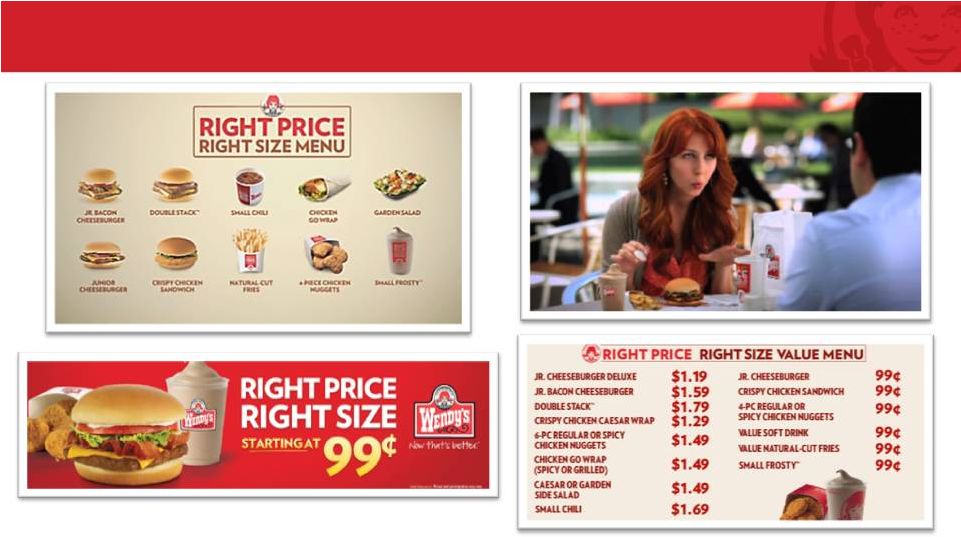 10
Right Price, Right Size |
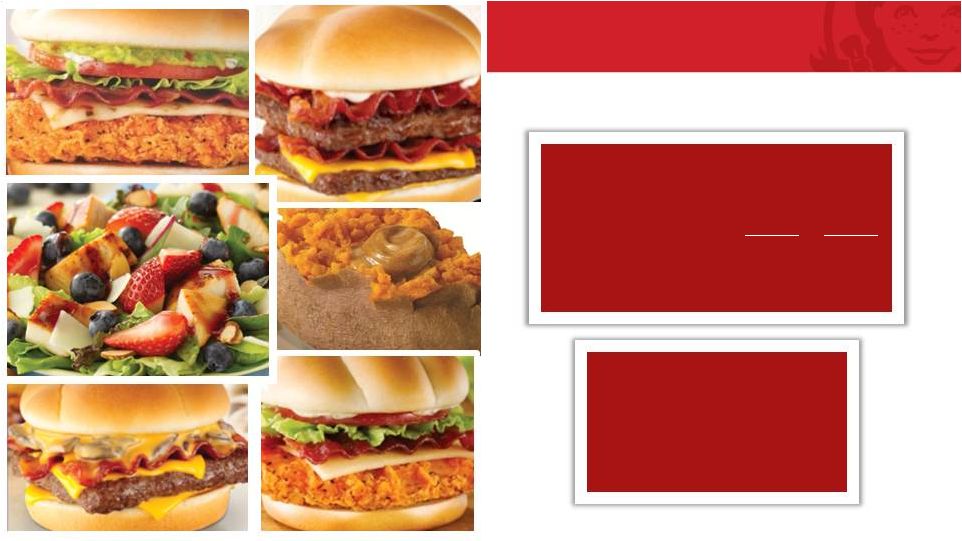
 Innovation: Premium Limited-Time Offerings
11
New QSR
Quality at a QSR
Price |
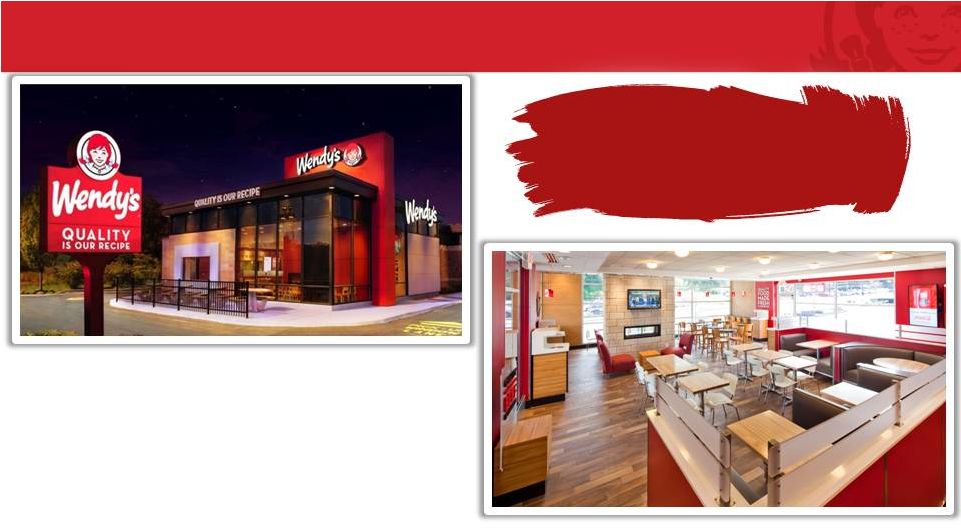 Image
Activation Update 12
2011: 10 company prototypes
2012: 48 company Tier I reimages
Reimages averaging
+25% sales growth |
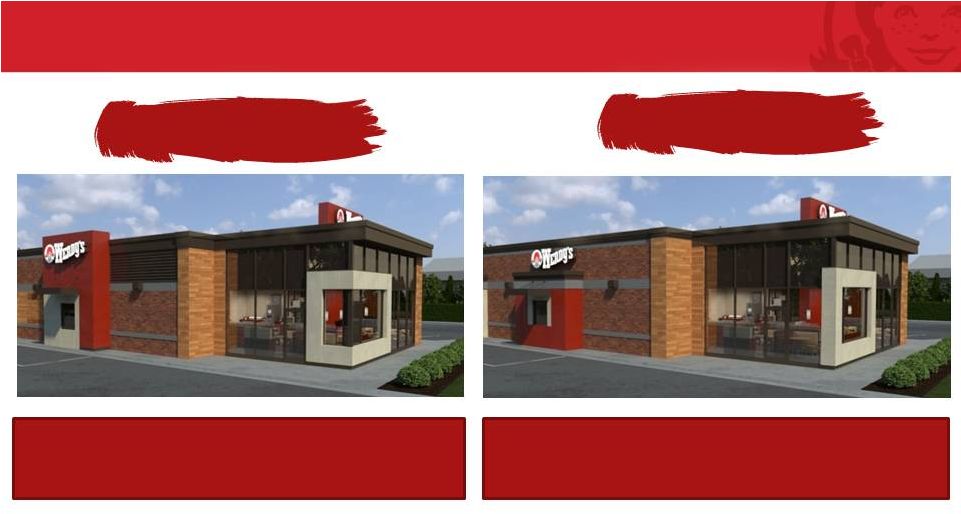 2013
Company Image Activation 13
Estimates based on Company’s current outlook.
32 Tier II Remodels in 2013
20 Tier III Remodels in 2013
Tier II
Tier III |
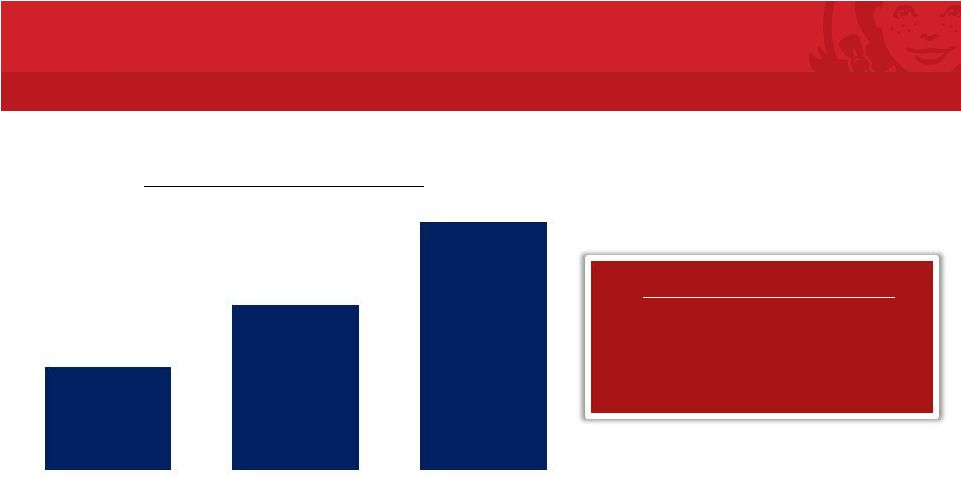
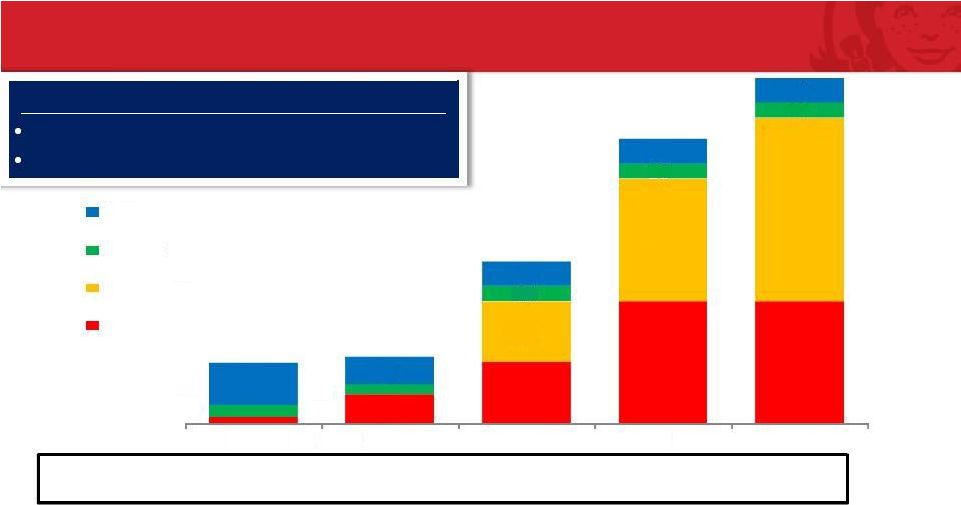 Image
Activation Multi-Year Growth Plan Image Activation Multi-Year Growth
Plan 14
Cumulative
IA Restaurants
10
76
301
766
1,331
Image Activation Progress by Year-End 2015:
Note: New Company restaurants were Image Activation building design beginning
in 2012; 2 of 45 new Franchise restaurants were Image Activation in
2012. Estimates based on Company’s current outlook.
10
48
100
200
200
100
200
300
20
16
25
69
45
40
40
40
2011
2012
2013
2014
Fr. New
Co. New
Fr. Reimage
Co. Reimage
25
25
50% of Company restaurants
1 out of 5 of the Wendy’s System restaurants
2015 |
 STEVE
HARE Chief Financial Officer
15
©
2013 Oldemark LLC |
 Q4 2012
Financial Summary 16
Q4 2012
Q4 2011
Better/
(Worse)
Sales
554.0
$
538.5
$
15.5
$
Franchise revenues
75.9
76.5
(0.6)
Total revenues
629.9
$
615.0
$
14.9
$
growth rate
2.4%
Adjusted EBITDA from continuing operations*
95.9
$
80.9
$
15.0
$
Adjusted EPS*
0.09
$
0.04
$
0.05
$
(Unaudited)
($ in millions except per share amounts)
*See reconciliation of Adjusted EBITDA from continuing operations and Adjusted
EPS in the appendix. *See reconciliation of Adjusted EBITDA from
continuing operations and Adjusted EPS in the appendix. |
 FY 2012
Highlights 17
2012 North America
Same-Store Sales
1-Year
2-Year
2012 Company
Restaurant Margin
2012 14.0%
2011 14.0%
Franchise
1.6%
3.5%
3.6%
Company-Operated
1.6% |
 FY 2012
Financial Summary 18
18
2012
2011
Better/
(Worse)
Sales
2,198.3
$
2,126.6
$
71.7
$
Franchise revenues
306.9
304.8
2.1
Total revenues
2,505.2
$
2,431.4
$
73.8
$
growth rate
3.0%
Adjusted EBITDA from continuing operations*
333.3
$
331.1
$
2.2
$
Adjusted EPS*
0.17
$
0.15
$
0.02
$
($ in millions except per share amounts)
*See reconciliation of Adjusted EBITDA from continuing operations and Adjusted
EPS in the appendix. |
  Income from
Continuing Operations and Special Items 20
(Unaudited)
($ in Thousands, Except per Share Amounts)
Per share
Per share
Per share
Per share
Adjusted income and adjusted earnings per share from continuing operations
33,629
$
0.09
$
16,425
$
0.04
$
65,316
$
0.17
$
62,080
$
0.15
$
(Less) plus:
Loss on early extinguishment of debt
-
-
-
-
(46,547)
(0.12)
-
-
Facilities relocation costs and other transactions
(8,311)
(0.02)
(9,288)
(0.02)
(25,349)
(0.07)
(28,514)
(0.07)
Gain on sale of investment, net
-
-
-
-
17,978
0.05
-
-
Impairment of long-lived assets
(8,216)
(0.02)
(2,847)
(0.01)
(13,017)
(0.04)
(7,936)
(0.02)
Benefits of prior years' tax matters
5,439
0.01
-
-
7,620
0.02
-
-
Dividend from Arby's
2,868
0.01
-
-
2,868
0.01
-
-
Costs associated with closed restaurants in other operating expense, net
-
-
-
-
(911)
(0.00)
-
-
Arby's indirect corporate overhead in general and administrative (G&A)
-
-
-
-
-
-
(9,140)
(0.02)
SSG purchasing cooperative expenses in G&A
-
-
-
-
-
-
1,422
0.00
Total adjustments
(8,220)
(0.02)
(12,135)
(0.03)
(57,358)
(0.15)
(44,168)
(0.11)
Income from continuing operations
25,409
0.07
4,290
0.01
7,958
0.02
17,912
0.04
Net income (loss) from discontinued operations
979
0.00
(306)
(0.00)
1,509
0.00
(8,037)
(0.02)
Net income
26,388
0.07
3,984
0.01
9,467
0.02
9,875
0.02
Net income attributable to noncontrolling interests
-
-
-
-
(2,384)
(0.00)
-
-
Net income and earnings per share attributable to The Wendy's Company
26,388
$
0.07
$
3,984
$
0.01
$
7,083
$
0.02
$
9,875
$
0.02
$
2012
2011
2012
2011
Three Months
Twelve Months
*See reconciliation of Adjusted EPS in the appendix.
19 |
  FY 2012
Cash Flow Highlights 20
2012 IA Cap Ex
Image Activation -
New $27
Image Activation -
Reimages 45
Total Image
Activation $72 ($
in millions) Cash flow from operations
190.4
$
Capital expenditures
197.6
Beginning cash balance
475.2
$
Change in cash
(21.8)
Ending cash balance
453.4
$
2012 |
 Selected
Balance Sheet Highlights 21
($ in millions)
Cash
453
$
Senior Debt
1,425
$
Capital Leases and Other Debt
33
Total Debt
1,458
$
2012 Adjusted EBITDA*
333
$
Total Debt / 2012 Adjusted EBITDA*
4.4x
Net Debt / 2012 Adjusted EBITDA*
3.0x
Dec. 30, 2012
*See reconciliation of Adjusted EBITDA from continuing operations in the
appendix. 21
*See reconciliation of Adjusted EBITDA from continuing operations in the
appendix. |
 •
SSS +2% to 3%
•
Traffic and check growth from core business: new products, marketing, operations
•
Image Activation benefit, offset by fewer breakfast restaurants
•
Commodities +90 to 120 bps
•
Increases in beef and chicken, partially offset by cost-savings initiatives
•
Renewable
Fuel
Standard
diverting
more
than
40%
of
U.S.
corn
crop
to
gasoline
production
•
Company-Operated Restaurant Margin 14.2% to 14.5% (+20 to 50 bps from
14.0% in 2012)
•
Sales leverage, Image Activation impact, discontinuation of breakfast at certain
restaurants and cost savings initiatives
•
Adj. EBITDA $350 to $360 million, +5% to 8% vs. $333.3 million in 2012
•
Adj. EPS $0.18 to $0.20, +6% to 18% vs. $0.17 in 2012
2013 Outlook
22
Estimates based on Company’s current outlook.
|
 •
2013: Higher Adjusted EBITDA growth in Q1, lower growth in
Q4 Factors Affecting 2013 Outlook vs. 2012
23
•
Unusually soft results in Q1 2012, but expect Q1 2013 Adjusted
EBITDA more in line with historical trends
•
Expect $10 million of Image Activation incentives will increase Q4
2013 G&A expense
Q1
Q2
Q3
Q4
2012
SSS
0.8%
3.2%
2.7%
-0.2%
1.6%
Adj. EBITDA*
$63.9
$89.1
$84.5
$95.9
$333.3
2012 SSS and Adjusted EBITDA*
*See reconciliation of Q4 2012 and 2012 Adjusted EBITDA from continuing
operations and Adjusted EPS in the appendix. *See reconciliation of Q4
2012 and 2012 Adjusted EBITDA from continuing operations in the appendix. |
 2013
Image Activation Outlook 24
Q1
Q2
Q3
Q4
2013
Co.
6
35
37
22
100
Fran.
100
Total
200
Image Activation Quarterly Reopenings
Company Image Activation Plan
Estimates based on Company’s current outlook
Estimates based on Company’s current outlook.
Scrape &
Rebuilds
Tier I
Reimages
Tier II
Reimages
Tier III
Reimages
28
20
32
20 |
 2013 New
Restaurant Development 25
Expect 120 to 130 New System Restaurants in 2013
Company
Franchise
Global Note: New restaurant
numbers represent the midpoint of the expected range; Estimates based on Company’s current outlook.
2013 New Restaurants
25
40
60
2013 Expected Closures
N.A. Company: 20 to 30
N.A. Franchise: 90 to 100
Global: 15 to 20 |
 2013
Capital Expenditures 26
Restaurant Equipment & Maintenance
$40
Product Dev./Equipment Upgrades/Other
20
Technology/POS
40
Base Cap Ex
100
New Restaurants
50
Reimages
95
Image Activation Cap Ex
145
Total Projected Cap Ex
$245
2012
Cap Ex
$198 mil
Estimates based on Company’s current outlook
Estimates based on Company’s current outlook. |
 Strong
Free Cash Flow & Balance Sheet 27
Accelerating Investment in
Image Activation:
Expect $440 to $500 million
2013 to 2015
Return Capital to Shareholders
Estimates based on Company’s current outlook.
$100 million share
repurchase program
authorized through
12/29/13
100% increase in
quarterly dividend
rate effective
Q4 2012
Core Growth Priority |
 2013 and
Long-Term Earnings Outlook 28
Adjusted EBITDA:
$350 to $360 million
Adjusted EPS:
$0.18 to $0.20
Average annual
Adjusted EBITDA
and Adjusted EPS
growth rates in
high-single-digit to
low-double-digit
range
2013
Long-Term
Estimates based on Company’s current outlook
28
Estimates based on Company’s current outlook. |
 EMIL
BROLICK President & CEO
29
©
2013 Oldemark LLC |
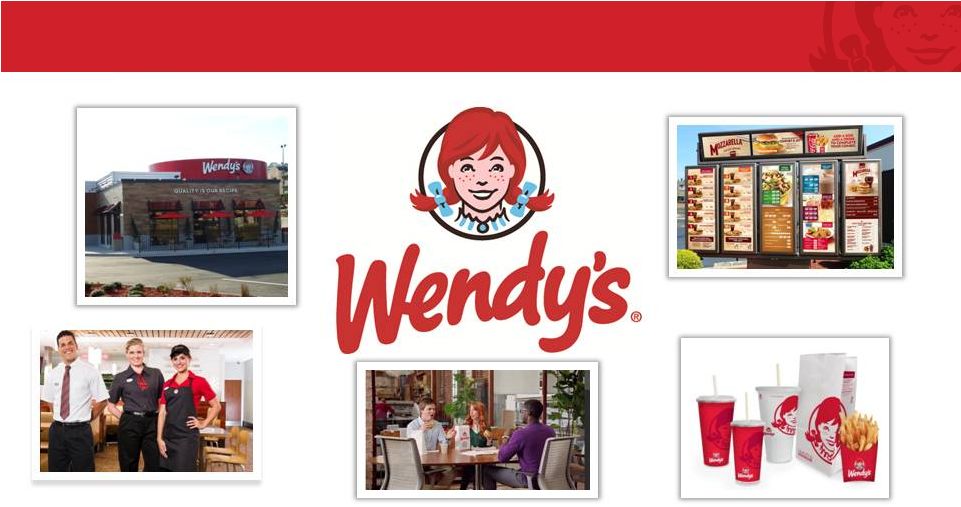 A Total
Brand Transformation 30 |
 JOHN
BARKER Chief Communications Officer
31
©
2013 Oldemark LLC |
 2013
Events March 13:
Bank of America Merrill Lynch Consumer Conference
March 14:
UBS Global Consumer Conference
April 3-5:
Morgan Stanley Retail Conference
May 8:
Q1 2013 Earnings Release
May 23:
Annual Shareholder Meeting
Investor Relations Calendar
32 |
 Q&A
33 |
 Appendix
34 |
 Reconciliation of Adjusted EBITDA from Continuing Operations
to Net Income Attributable to The Wendy’s Company
36
35
(Unaudited)
($ in Thousands)
2012
2011
2012
2011
Adjusted EBITDA from continuing operations
95,883
$
80,870
$
333,328
$
331,055
$
(Less) plus:
Depreciation and amortization
(36,840)
(32,020)
(146,976)
(122,992)
Impairment of long-lived assets
(13,316)
(4,621)
(21,097)
(12,883)
Costs associated with closed restaurants in other operating
expense, net
-
-
(1,477)
-
Facilities relocation costs and other transactions
(13,470)
(14,949)
(41,031)
(45,711)
Arby's indirect corporate overhead in general and
administrative (G&A)
-
-
-
(14,623)
SSG purchasing cooperative expense reversal in G&A
-
-
-
2,275
Operating profit
32,257
29,280
122,747
137,121
Interest expense
(20,801)
(28,195)
(98,604)
(114,110)
Loss on early extinguishment of debt
-
-
(75,076)
-
Investment income, net
6,786
296
36,243
484
Other, net
551
239
1,565
945
Income (loss) from continuing operations before
income taxes and noncontrolling interests
18,793
1,620
(13,125)
24,440
Benefit from (provision for) income taxes
6,616
2,670
21,083
(6,528)
Income from continuing operations
25,409
4,290
7,958
17,912
Discontinued operations:
Income (loss) from discontinued operations, net of income taxes
1,167
(356)
1,951
762
(Loss) income on disposal of discontinued operations, net of income taxes
(188)
50
(442)
(8,799)
Net income (loss) from discontinued operations
979
(306)
1,509
(8,037)
Net income
26,388
3,984
9,467
9,875
Net income attributable to noncontrolling interests
-
-
(2,384)
-
Net income attributable to The Wendy's Company
26,388
$
3,984
$
7,083
$
9,875
$
Three Months
Twelve Months |
 Reconciliation of Adjusted Income and Adjusted Earnings Per Share
from Continuing Operations to Net Income and Earnings Per Share
Attributable to The Wendy’s Company
36
(Unaudited)
($ in Thousands, Except per Share Amounts)
Per share
Per share
Per share
Per share
Adjusted income and adjusted earnings per share from continuing operations
33,629
$
0.09
$
16,425
$
0.04
$
65,316
$
0.17
$
62,080
$
0.15
$
(Less) plus:
Loss on early extinguishment of debt
-
-
-
-
(46,547)
(0.12)
-
-
Facilities relocation costs and other transactions
(8,311)
(0.02)
(9,288)
(0.02)
(25,349)
(0.07)
(28,514)
(0.07)
Gain on sale of investment, net
-
-
-
-
17,978
0.05
-
-
Impairment of long-lived assets
(8,216)
(0.02)
(2,847)
(0.01)
(13,017)
(0.04)
(7,936)
(0.02)
Benefits of prior years' tax matters
5,439
0.01
-
-
7,620
0.02
-
-
Dividend from Arby's
2,868
0.01
-
-
2,868
0.01
-
-
Costs associated with closed restaurants in other operating expense, net
-
-
-
-
(911)
(0.00)
-
-
Arby's
indirect
corporate
overhead
in
general
and
administrative
(G&A)
-
-
-
-
-
-
(9,140)
(0.02)
SSG purchasing cooperative expenses in G&A
-
-
-
-
-
-
1,422
0.00
Total adjustments
(8,220)
(0.02)
(12,135)
(0.03)
(57,358)
(0.15)
(44,168)
(0.11)
Income from continuing operations
25,409
0.07
4,290
0.01
7,958
0.02
17,912
0.04
Net income (loss) from discontinued operations
979
0.00
(306)
(0.00)
1,509
0.00
(8,037)
(0.02)
Net income
26,388
0.07
3,984
0.01
9,467
0.02
9,875
0.02
Net income attributable to noncontrolling interests
-
-
-
-
(2,384)
(0.00)
-
-
Net income and earnings per share attributable to The Wendy's Company
26,388
$
0.07
$
3,984
$
0.01
$
7,083
$
0.02
$
9,875
$
0.02
$
2012
2011
2012
2011
Reconciliation of Adjusted Income and Adjusted Earnings Per Share from Continuing
Operations to Net Income and Earnings Per Share Attributable to The Wendy's
Company (In Thousands Except Per Share Amounts)
(Unaudited)
Three Months
Twelve Months |