Attached files
| file | filename |
|---|---|
| EX-32.(B) - EX-32(B) - Hercules Capital, Inc. | d483390dex32b.htm |
| EX-23.1 - EX-23.1 - Hercules Capital, Inc. | d483390dex231.htm |
| EX-31.(A) - EX-31(A) - Hercules Capital, Inc. | d483390dex31a.htm |
| EX-32.(A) - EX-32(A) - Hercules Capital, Inc. | d483390dex32a.htm |
| EX-31.(B) - EX-31(B) - Hercules Capital, Inc. | d483390dex31b.htm |
| EX-21.1 - EX-21.1 - Hercules Capital, Inc. | d483390dex211.htm |
Table of Contents
UNITED STATES
SECURITIES AND EXCHANGE COMMISSION
Washington, D.C. 20549
FORM 10-K
(Mark One)
| x | ANNUAL REPORT PURSUANT TO SECTION 13 OR 15 (d) OF THE SECURITIES EXCHANGE ACT OF 1934 |
For the fiscal year ended December 31, 2012
OR
| ¨ | TRANSITION REPORT PURSUANT TO SECTION 13 OR 15 (d) OF THE SECURITIES EXCHANGE ACT OF 1934 |
For the transition period from to
Commission File No. 814-00702
Hercules Technology Growth Capital, Inc.
(Exact name of Registrant as specified in its charter)
| Maryland | 74-3113410 | |
| (State or other jurisdiction of incorporation or organization) |
(I.R.S. Employer Identification Number) |
400 Hamilton Avenue, Suite 310
Palo Alto, California 94301
(Address of principal executive offices)
(650) 289-3060
(Registrant’s telephone number, including area code)
Securities registered pursuant to Section 12 (b) of the Act:
| Title of each class |
Name of each exchange on which registered | |
| Common Shares, par value $0.001 per share | New York Stock Exchange |
Securities registered pursuant to Section 12(g) of the Act: None
Indicate by check mark if the registrant is a well-known seasoned issuer, as defined in Rule 405 of the Securities Act. Yes ¨ No x
Indicate by check mark if the registrant is not required to file reports pursuant to Section 13 or 15(d) of the Act. Yes ¨ No x
Indicate by check mark whether the Registrant (1) has filed all reports required to be filed by Section 13 or 15(d) of the Securities Exchange Act of 1934 during the preceding 12 months (or for such shorter period that the Registrant was required to file such reports), and (2) has been subject to such filing requirements for the past 90 days: YES x NO ¨
Indicate by check mark whether the registrant has submitted electronically and posted on its corporate Web site, if any, every Interactive Data File required to be submitted and posted pursuant to Rule 405 of Regulation S- during the preceding 12 months (or for such shorter period that the registrant was required to submit and post such files). Yes ¨ No ¨
Indicate by check mark if disclosure of delinquent filers pursuant to Item 405 of Regulation S-T is not contained herein, and will not be contained, to the best of registrant’s knowledge, in definitive proxy or information statements incorporated by reference in Part III of this Form 10-K or any amendment to this Form 10-K. ¨
Indicate by check mark whether the registrant is a large accelerated filer, an accelerated filer, or a non-accelerated filer. See definition of “accelerated filer, large accelerated filer” and “smaller reporting company” in Rule 12b-2 of the Exchange Act. (Check one):
Large accelerated filer ¨ Accelerated filer x Non-accelerated filer ¨ Smaller reporting company ¨
Indicate by check mark whether the registrant is a shell company (as defined in Rule 12b-2 of the Act). Yes ¨ No x
The aggregate market value of the voting and non-voting common stock held by non-affiliates of the registrant as of the last business day of the registrant’s most recently completed second fiscal quarter was approximately $430.5 million based upon a closing price of $10.84 reported for such date on the New York Stock Exchange. Common shares held by each executive officer and director and by each person who owns 5% or more of the outstanding common shares have been excluded in that such persons may be deemed to be affiliates. This determination of affiliate status is not intended and shall not be deemed to be an admission that, such persons are affiliates of the Registrant.
On February 25, 2013, there were 52,913,216 shares outstanding of the Registrant’s common stock, $0.001 par value.
DOCUMENTS INCORPORATED BY REFERENCE
Documents incorporated by reference: Portions of the registrant’s Proxy Statement for its 2013 Annual Meeting of Shareholders to be filed within 120 days after the close of the registrant’s year end are incorporated by reference into Part III of this Annual Report on Form 10-K.
Table of Contents
HERCULES TECHNOLOGY GROWTH CAPITAL, INC.
FORM 10-K
ANNUAL REPORT
| Page | ||||||
| Part I. | ||||||
| Item 1. |
1 | |||||
| Item 1A. |
26 | |||||
| Item 1B. |
58 | |||||
| Item 2. |
58 | |||||
| Item 3. |
58 | |||||
| Item 4. |
58 | |||||
| Part II. | ||||||
| Item 5. |
59 | |||||
| Item 6. |
63 | |||||
| Item 7. |
Management’s Discussion and Analysis of Financial Condition and Results of Operations |
64 | ||||
| Item 7A. |
97 | |||||
| Item 8. |
100 | |||||
| Item 9. |
Changes in and Disagreements with Accountants on Accounting and Financial Disclosure |
180 | ||||
| Item 9A. |
180 | |||||
| Item 9B. |
181 | |||||
| Part III. | ||||||
| Item 10. |
182 | |||||
| Item 11. |
182 | |||||
| Item 12. |
Security Ownership of Certain Beneficial Owners and Management and Related Stockholder Matters |
182 | ||||
| Item 13. |
Certain Relationships and Related Transactions and Director Independence |
182 | ||||
| Item 14. |
182 | |||||
| Part IV. | ||||||
| Item 15. |
183 | |||||
| 190 | ||||||
Hercules Technology Growth Capital, Inc., our logo and other trademarks of Hercules Technology Growth Capital, Inc. are the property of Hercules Technology Growth Capital, Inc. All other trademarks or trade names referred to in this Annual Report on Form 10-K are the property of their respective owners.
Table of Contents
In this Annual Report on Form 10-K, or Annual Report, the “Company,” “HTGC,” “we,” “us” and “our” refer to Hercules Technology Growth Capital, Inc. and its wholly owned subsidiaries and its affiliated securitization trusts unless the context otherwise requires.
| Item 1. | Business |
GENERAL
We are a specialty finance company focused on providing senior secured loans to venture capital-backed companies in technology-related markets, including technology, biotechnology, life science, and clean-technology industries at all stages of development. We source our investments through our principal office located in Silicon Valley, as well as through additional offices in Boston, MA, Boulder, CO and McLean, VA.
Our goal is to be the leading structured debt financing provider of choice for venture capital-backed companies in technology-related markets, requiring sophisticated and customized financing solutions. Our strategy is to evaluate and invest in a broad range of technology-related markets including technology, biotechnology, life science and clean technology industries and to offer a full suite of growth capital products up and down the capital structure. We invest primarily in structured debt with warrants and, to a lesser extent, in senior debt and equity investments. We use the term “structured debt with warrants” to refer to any debt investment, such as a senior or subordinated secured loan, that is coupled with an equity component, including warrants, options or rights to purchase common or preferred stock. Our structured debt with warrants investments will typically be secured by some or all of the assets of the portfolio company.
Our investment objective is to maximize our portfolio total return by generating current income from our debt investments and capital appreciation from our equity-related investments. Our primary business objectives are to increase our net income, net operating income and net asset value by investing in structured debt with warrants and equity of venture capital-backed companies in technology-related markets with attractive current yields and the potential for equity appreciation and realized gains. Our structured debt investments typically include warrants or other equity interests, giving us the potential to realize equity-like returns on a portion of our investments. Our equity ownership in our portfolio companies may represent a controlling interest. In some cases, we receive the right to make additional equity investments in our portfolio companies, including the right to convert some portion of our debt into equity, in connection with future equity financing rounds. Capital that we provide directly to venture capital-backed companies in technology-related markets is generally used for growth and general working capital purposes as well as in select cases for acquisitions or recapitalizations.
We also make investments in qualifying small businesses through two wholly-owned, small business investment company (“SBIC”) subsidiaries, Hercules Technology II, L.P. (“HT II”) and Hercules Technology III, L.P. (“HT III”). HT II and HT III hold approximately $154.4 million and $250.8 million in assets, respectively, and accounted for approximately 10.5% and 17.0% of our total assets prior to consolidation at December 31, 2012. We have issued $225.0 million in SBA-guaranteed debentures in our SBIC subsidiaries, which is the maximum amount allowed for a group of SBICs under common control. See “—Regulation—Small Business Administration Regulations” for additional information regarding our SBIC subsidiaries.
Our portfolio is comprised of, and we anticipate that our portfolio will continue to be comprised of, investments primarily in technology-related companies at various stages of their development. Consistent with regulatory requirements, we invest primarily in United States based companies and to a lesser extent in foreign companies.
1
Table of Contents
We focus our investments in companies active in the technology industry sub-sectors characterized by products or services that require advanced technologies, including, but not limited to, computer software and hardware, networking systems, semiconductors, semiconductor capital equipment, information technology infrastructure or services, Internet consumer and business services, telecommunications, telecommunications equipment, renewable or alternative energy, media and life science. Within the life science sub-sector, we generally focus on medical devices, bio-pharmaceutical, drug discovery, drug delivery, health care services and information systems companies. Within the clean technology sub-sector, we focus on sustainable and renewable energy technologies and energy efficiency and monitoring technologies. We refer to all of these companies as “technology-related” companies and intend, under normal circumstances, to invest at least 80% of the value of our assets in such businesses.
CORPORATE HISTORY AND OFFICES
We are a Maryland Corporation formed in December 2003 that began investment operations in September 2004. We are an internally managed, non-diversified closed-end investment company that has elected to be regulated as a business development company under the Investment Company Act of 1940, as amended, or the 1940 Act. As a business development company, we are required to comply with certain regulatory requirements. For instance, we generally have to invest at least 70% of our total assets in “qualifying assets,” including securities of private U.S. companies, cash, cash equivalents, U.S. government securities and high-quality debt investments that mature in one year or less. A business development company also must meet a coverage ratio of total net assets to total senior securities, which include all of our borrowings (including accrued interest payable) except for debentures issued by the Small Business Administration, or the SBA, and any preferred stock we may issue in the future, of at least 200% subsequent to each borrowing or issuance of senior securities. See “Item 1. Business—Regulation as a Business Development Company”.
From incorporation through December 31, 2005, we were taxed as a corporation under Subchapter C of the Internal Revenue Code, or the Code. As of January 1, 2006, we have elected to be treated for federal income tax purposes as a regulated investment company, or a RIC, under Subchapter M of the Code. Pursuant to this election, we generally will not have to pay corporate-level taxes on any income that we distribute to our stockholders. However, such an election and qualification to be treated as a RIC requires that we comply with certain requirements contained in Subchapter M of the Code. For example, a RIC must meet certain requirements, including source-of income, asset diversification and income distribution requirements. The income source requirement mandates that we receive 90% or more of our income from qualified earnings, typically referred to as “good income.”
Our principal executive offices are located at 400 Hamilton Avenue, Suite 310, Palo Alto, California 94301, and our telephone number is (650) 289-3060. We also have offices in Boston, MA, Boulder, CO and McLean, VA. We maintain a website on the Internet at www.htgc.com. Information contained on our website is not incorporated by reference into this Annual Report, and you should not consider that information to be part of this Annual Report.
We file annual, quarterly and current periodic reports, proxy statements and other information with the SEC under the Securities Exchange Act of 1934, which we refer to as the Exchange Act. This information is available at the SEC’s public reference room at 100 F Street, N.E., Washington, D.C. 20549. You may obtain information about the operation of the SEC’s public reference room by calling the SEC at (202) 551-8090. In addition, the SEC maintains an Internet website, at www.sec.gov, that contains reports, proxy and information statements, and other information regarding issuers, including us, who file documents electronically with the SEC.
OUR MARKET OPPORTUNITY
We believe that technology-related companies compete in one of the largest and most rapidly growing sectors of the U.S. economy and that continued growth is supported by ongoing innovation and performance
2
Table of Contents
improvements in technology products as well as the adoption of technology across virtually all industries in response to competitive pressures. We believe that an attractive market opportunity exists for a specialty finance company focused primarily on investments in structured debt with warrants in technology-related companies for the following reasons:
| • | Technology-related companies have generally been underserved by traditional lending sources; |
| • | Unfulfilled demand exists for structured debt financing to technology-related companies as the number of lenders has declined due to the recent financial market turmoil; and |
| • | Structured debt with warrants products are less dilutive and complement equity financing from venture capital and private equity funds. |
Technology-Related Companies are Underserved by Traditional Lenders. We believe many viable technology-related companies backed by financial sponsors have been unable to obtain sufficient growth financing from traditional lenders, including financial services companies such as commercial banks and finance companies because traditional lenders have continued to consolidate and have adopted a more risk-averse approach to lending. More importantly, we believe traditional lenders are typically unable to underwrite the risk associated with these companies effectively.
The unique cash flow characteristics of many technology-related companies include significant research and development expenditures and high projected revenue growth thus often making such companies difficult to evaluate from a credit perspective. In addition, the balance sheets of these companies often include a disproportionately large amount of intellectual property assets, which can be difficult to value. Finally, the speed of innovation in technology and rapid shifts in consumer demand and market share add to the difficulty in evaluating technology-related companies.
Due to the difficulties described above, we believe traditional lenders are generally refraining from entering the structured mezzanine marketplace, instead preferring the risk-reward profile of asset based lending. Traditional lenders generally do not have flexible product offerings that meet the needs of technology-related companies. The financing products offered by traditional lenders typically impose on borrowers many restrictive covenants and conditions, including limiting cash outflows and requiring a significant depository relationship to facilitate rapid liquidation.
Unfulfilled Demand for Structured Debt Financing to Technology-Related Companies. Private debt capital in the form of structured debt financing from specialty finance companies continues to be an important source of funding for technology-related companies. We believe that the level of demand for structured debt financing is a function of the level of annual venture equity investment activity.
We believe that demand for structured debt financing is currently underserved, in part because of the credit market collapse in 2008 and the resulting exit of debt capital providers to technology-related companies. The venture capital market for the technology-related companies in which we invest has been active and is continuing to show signs of increased investment activity. Therefore, to the extent we have capital available, we believe this is an opportune time to be active in the structured lending market for technology-related companies.
Structured Debt with Warrants Products Complement Equity Financing From Venture Capital and Private Equity Funds. We believe that technology-related companies and their financial sponsors will continue to view structured debt securities as an attractive source of capital because it augments the capital provided by venture capital and private equity funds. We believe that our structured debt with warrants product provides access to growth capital that otherwise may only be available through incremental investments by existing equity investors. As such, we provide portfolio companies and their financial sponsors with an opportunity to diversify their capital sources. Generally, we believe technology-related companies at all stages of development target a portion of their capital to be debt in an attempt to achieve a higher valuation through internal growth. In addition,
3
Table of Contents
because financial sponsor-backed companies have reached a more mature stage prior to reaching a liquidity event, we believe our investments could provide the debt capital needed to grow or recapitalize during the extended period prior to liquidity events.
OUR BUSINESS STRATEGY
Our strategy to achieve our investment objective includes the following key elements:
Leverage the Experience and Industry Relationships of Our Management Team and Investment Professionals. We have assembled a team of experienced investment professionals with extensive experience as venture capitalists, commercial lenders, and originators of structured debt and equity investments in technology-related companies. Our investment professionals have, on average, more than 15 years of experience as equity investors in, and/or lenders to, technology-related companies. In addition, our team members have originated structured debt, debt with warrants and equity investments in over 220 technology-related companies, representing $3.4 billion in commitments from inception to December 31, 2012, and have developed a network of industry contacts with investors and other participants within the venture capital and private equity communities. In addition, members of our management team also have operational, research and development and finance experience with technology-related companies. We have established contacts with leading venture capital and private equity fund sponsors, public and private companies, research institutions and other industry participants, which should enable us to identify and attract well-positioned prospective portfolio companies.
We concentrate our investing activities generally in industries in which our investment professionals have investment experience. We believe that our focus on financing technology-related companies will enable us to leverage our expertise in structuring prospective investments, to assess the value of both tangible and intangible assets, to evaluate the business prospects and operating characteristics of technology-related companies and to identify and originate potentially attractive investments with these types of companies.
Mitigate Risk of Principal Loss and Build a Portfolio of Equity-Related Securities. We expect that our investments have the potential to produce attractive risk-adjusted returns through current income, in the form of interest and fee income, as well as capital appreciation from equity-related securities. We believe that we can mitigate the risk of loss on our debt investments through the combination of loan principal amortization, cash interest payments, relatively short maturities, security interests in the assets of our portfolio companies, and on select investment covenants requiring prospective portfolio companies to have certain amounts of available cash at the time of our investment and the continued support from a venture capital or private equity firm at the time we make our investment.
Historically our structured debt investments to technology-related companies typically include warrants or other equity interests, giving us the potential to realize equity-like returns on a portion of our investment. In addition, in some cases, we receive the right to make additional equity investments in our portfolio companies, including the right to convert some portion of our debt into equity, in connection with future equity financing rounds. We believe these equity interests will create the potential for meaningful long-term capital gains in connection with the future liquidity events of these technology-related companies.
Provide Customized Financing Complementary to Financial Sponsors’ Capital. We offer a broad range of investment structures and possess expertise and experience to effectively structure and price investments in technology-related companies. Unlike many of our competitors that only invest in companies that fit a specific set of investment parameters, we have the flexibility to structure our investments to suit the particular needs of our portfolio companies. We offer customized financing solutions ranging from senior debt to equity capital, with a focus on structured debt with warrants.
We use our relationships in the financial sponsor community to originate investment opportunities. Because venture capital and private equity funds typically invest solely in the equity securities of their portfolio
4
Table of Contents
companies, we believe that our debt investments will be viewed as an attractive and complimentary source of capital, both by the portfolio company and by the portfolio company’s financial sponsor. In addition, we believe that many venture capital and private equity fund sponsors encourage their portfolio companies to use debt financing for a portion of their capital needs as a means of potentially enhancing equity returns, minimizing equity dilution and increasing valuations prior to a subsequent equity financing round or a liquidity event.
Invest at Various Stages of Development. We provide growth capital to technology-related companies at all stages of development, including select publicly listed companies and select lower middle market companies and established-stage companies. We believe that this provides us with a broader range of potential investment opportunities than those available to many of our competitors, who generally focus their investments on a particular stage in a company’s development. Because of the flexible structure of our investments and the extensive experience of our investment professionals, we believe we are well positioned to take advantage of these investment opportunities at all stages of prospective portfolio companies’ development.
Benefit from Our Efficient Organizational Structure. We believe that the perpetual nature of our corporate structure enables us to be a long-term partner for our portfolio companies in contrast to traditional mezzanine and investment funds, which typically have a limited life. In addition, because of our access to the equity markets, we believe that we may benefit from a lower cost of capital than that available to private investment funds. We are not subject to requirements to return invested capital to investors nor do we have a finite investment horizon. Capital providers that are subject to such limitations are often required to seek a liquidity event more quickly than they otherwise might, which can result in a lower overall return on an investment.
Deal Sourcing Through Our Proprietary Database. We have developed a proprietary and comprehensive structured query language-based (SQL) database system to track various aspects of our investment process including sourcing, originations, transaction monitoring and post-investment performance. As of December 31, 2012, our proprietary SQL-based database system included over 30,900 technology-related companies and approximately 8,100 venture capital, private equity sponsors/investors, as well as various other industry contacts. This proprietary SQL system allows us to maintain, cultivate and grow our industry relationships while providing us with comprehensive details on companies in the technology-related industries and their financial sponsors.
OUR INVESTMENTS AND OPERATIONS
We principally invest in debt securities and, to a lesser extent, equity securities, with a particular emphasis on structured debt with warrants.
We generally seek to invest in companies that have been operating for at least six to 12 months prior to the date of our investment. We anticipate that such entities may, at the time of investment, be generating revenues or will have a business plan that anticipates generation of revenues within 24 to 48 months. Further, we anticipate that on the date of our investment we will generally obtain a lien on available assets, which may or may not include intellectual property, and these companies will have sufficient cash on their balance sheet to operate as well as potentially amortize their debt for at least three to nine months following our investment. We generally require that a prospective portfolio company, in addition to having sufficient capital to support leverage, demonstrate an operating plan capable of generating cash flows or raising the additional capital necessary to cover its operating expenses and service its debt, for an additional six to 12 months subject to market conditions.
We expect that our investments will generally range from $1.0 million to $40.0 million. We typically structure our debt securities to provide for amortization of principal over the life of the loan, but may include an interest-only period of three to 12 months for emerging growth and expansion-stage companies and longer for established-stage companies. Our loans will be collateralized by a security interest in the borrower’s assets, although we may not have the first claim on these assets and the assets may not include intellectual property. Our debt investments carry fixed or variable contractual interest rates which generally ranged from Prime to
5
Table of Contents
approximately 14.0% as of December 31, 2012. As of December 31, 2012, 98.5% of our loans were at floating rates or floating rates with a floor and 1.5% of the loans were at fixed rates. In addition to the cash yields received on our loans, in some instances, certain loans may also include any of the following: end of term payments, exit fees, balloon payment fees, commitment fees, success fees, payment-in-kind (“PIK”) provisions or prepayment fees, which we may be required to include in income prior to receipt. We also generate revenue in the form of commitment, facility fees and amendment fees.
In addition, the majority of our investments in the structured debt of venture capital-backed companies generally have equity enhancement features, typically in the form of warrants or other equity-related securities designed to provide us with an opportunity for potential capital appreciation. The warrants typically will be immediately exercisable upon issuance and generally will remain exercisable for the lesser of five to seven years or one to three years after completion of an initial public offering. The exercise prices for the warrants varies from nominal exercise prices to exercise prices that are at or above the current fair market value of the equity for which we receive warrants. We may structure warrants to provide minority rights provisions or on a very select basis put rights upon the occurrence of certain events. We generally target a total annualized return (including interest, fees and value of warrants) of 12% to 25% for our debt investments.
Typically, our structured debt and equity investments take one of the following forms:
| • | Structured Debt with Warrants. We seek to invest a majority of our assets in structured debt with warrants of prospective portfolio companies. Traditional “mezzanine” debt is a layer of high-coupon financing between debt and equity that most commonly takes the form of subordinated debt coupled with warrants, combining the cash flow and risk characteristics of both senior debt and equity. However, our investments in structured debt with warrants may be the only debt capital on the balance sheet of our portfolio companies, and in many cases we have a first priority security interest in all of our portfolio company’s assets, or in certain investments we may have a negative pledge on intellectual property. Our structured debt with warrants typically have maturities of between two and seven years, with full amortization after an interest only period for emerging-growth or expansion-stage companies and longer deferred amortization for select established-stage companies. Our structured debt with warrants generally carry a contractual interest rate between Prime and approximately 14.0% and may include an additional end-of-term payment or PIK. In most cases we collateralize our investments by obtaining security interests in our portfolio companies’ assets, which may include their intellectual property. In other cases we may prohibit a company from pledging or otherwise encumbering their intellectual property. We may structure our structured debt with warrants with restrictive affirmative and negative covenants, default penalties, prepayment penalties, lien protection, equity calls, change-in-control provisions or board observation rights. |
| • | Senior Debt. We seek to invest a limited portion of our assets in senior debt. Senior debt may be collateralized by accounts receivable and/or inventory financing of prospective portfolio companies. Senior debt has a senior position with respect to a borrower’s scheduled interest and principal payments and holds a first priority security interest in the assets pledged as collateral. Senior debt also may impose covenants on a borrower with regard to cash flows and changes in capital structure, among other items. We generally collateralize our investments by obtaining security interests in our portfolio companies’ assets, which may include their intellectual property. In other cases we may obtain a negative pledge covering a company’s intellectual property. Our senior loans, in certain instances, may be tied to the financing of specific assets. In connection with a senior debt investment, we may also provide the borrower with a working capital line-of-credit that will carry an interest rate ranging from Prime or LIBOR plus a spread with a floor, generally maturing in one to three years, and will be secured by accounts receivable and/or inventory. |
| • | Equipment Loans. We intend to invest a limited portion of our assets in equipment-based loans to early-stage prospective portfolio companies. Equipment-based loans are secured by a first priority security interest in only the specific assets financed. These loans are generally for amounts up to |
6
Table of Contents
| $3.0 million but may be up to $15.0 million for certain clean technology venture investments, carry a contractual interest rate between Prime and Prime plus 9.0%, and have an average term between three and four years. Equipment loans may also include end of term payments. |
| • | Equity-Related Securities. The equity-related securities we hold consist primarily of warrants or other equity interests generally obtained in connection with our structured debt investments. In addition to the warrants received as a part of a structured debt financing, we typically receive the right to make equity investments in a portfolio company in connection with that company’s next round of equity financing. We may also on certain debt investments have the right to convert a portion of the debt investment into equity. These rights will provide us with the opportunity to further enhance our returns over time through opportunistic equity investments in our portfolio companies. These equity-related investments are typically in the form of preferred or common equity and may be structured with a dividend yield, providing us with a current return, and with customary anti-dilution protection and preemptive rights. In the future, we may achieve liquidity through a merger or acquisition of a portfolio company, a public offering of a portfolio company’s stock or by exercising our right, if any, to require a portfolio company to buy back the equity-related securities we hold. We may also make stand alone direct equity investments into portfolio companies in which we may not have any debt investment in the company. As of December 31, 2012, we held equity interests in 128 portfolio companies. |
A comparison of the typical features of our various investment alternatives is set forth in the chart below.
| Structured debt with warrants |
Senior Debt | Equipment Loans | Equity related Securities | |||||
| Typical Structure |
Term debt with warrants
|
Term or revolving debt | Term debt with warrants | Preferred stock or common stock | ||||
| Investment Horizon |
Long term, ranging from 2 to 7 years, with an average of 3 years
|
Usually under 3 years | Ranging from 3 to 4 years | Ranging from 3 to 7 years | ||||
|
Ranking/Security |
Senior secured, either first out or last out, or second lien
|
Senior/First lien | Secured only by underlying equipment | None/unsecured | ||||
| Covenants |
Less restrictive; Mostly financial
|
Generally borrowing base and financial
|
None | None | ||||
| Risk Tolerance |
Medium/High
|
Low | High | High | ||||
| Coupon/Dividend |
Cash pay—fixed and floating rate; Payment-in-kind in limited cases
|
Cash pay—floating or fixed rate | Cash pay-floating or fixed rate and may include Payment-in-kind | Generally none | ||||
|
Customization or Flexibility
|
More flexible | Little to none | Little to none | Flexible | ||||
| Equity Dilution
|
Low to medium | None to low | Low | High |
7
Table of Contents
Investment Criteria
We have identified several criteria, among others, that we believe are important in achieving our investment objective with respect to prospective portfolio companies. These criteria, while not inclusive, provide general guidelines for our investment decisions.
Portfolio Composition. While we generally focus our investments in venture capital-backed companies in technology-related markets, we seek to diversify across various financial sponsors as well as across various stages of companies’ development and various technology industry sub-sectors and geographies. As of December 31, 2012, approximately 65.8% of the fair value of our portfolio was composed of investments in five industries: 20.8% was composed of investments in the drug discovery and development industry, 15.0% was composed of investments in the internet consumer and business services industry, 14.0% was composed of investments in the clean technology industry, 8.2% was composed of investments in the drug delivery industry and 7.8% was composed of investments in the software industry.
Continuing Support from One or More Financial Sponsors. We generally invest in companies in which one or more established financial sponsors have previously invested and continue to make a contribution to the management of the business. We believe that having established financial sponsors with meaningful commitments to the business is a key characteristic of a prospective portfolio company. In addition, we look for representatives of one or more financial sponsors to maintain seats on the Board of Directors of a prospective portfolio company as an indication of such commitment.
Company Stage of Development. While we invest in companies at various stages of development, we generally require that prospective portfolio companies be beyond the seed stage of development and generally have received or anticipate having commitments for their first institutional round of equity financing for early stage companies. We expect a prospective portfolio company to demonstrate progress in its product development or demonstrate a path towards revenue generation or increase its revenues and operating cash flow over time. The anticipated growth rate of a prospective portfolio company is a key factor in determining the value that we ascribe to any warrants or other equity securities that we may acquire in connection with an investment in debt securities.
Operating Plan. We generally require that a prospective portfolio company, in addition to having potential access to capital to support leverage, demonstrate an operating plan capable of generating cash flows or the ability to potentially raise the additional capital necessary to cover its operating expenses and service its debt for a specific period. Specifically, we require that a prospective portfolio company demonstrate at the time of our proposed investment that it has cash on its balance sheet, or is in the process of completing a financing so that it will have cash on its balance sheet, sufficient to support its operations for a minimum of six to 12 months.
Security Interest. In many instances we seek a first priority security interest in all of the portfolio companies’ tangible and intangible assets as collateral for our debt investment, subject in some cases to permitted exceptions. In other cases we may obtain a negative pledge prohibiting a company from pledging or otherwise encumbering their intellectual property. Although we do not intend to operate as an asset-based lender, the estimated liquidation value of the assets, if any, collateralizing the debt securities that we hold is an important factor in our credit analysis and subject to assumptions that may change over the life of the investment especially when attempting to estimate the value of intellectual property. We generally evaluate both tangible assets, such as accounts receivable, inventory and equipment, and intangible assets, such as intellectual property, customer lists, networks and databases.
Covenants. Our investments may include one or more of the following covenants: cross-default, or material adverse change provisions, require the portfolio company to provide periodic financial reports and operating metrics and will typically limit the portfolio company’s ability to incur additional debt, sell assets, dividend recapture, engage in transactions with affiliates and consummate an extraordinary transaction, such as a merger or recapitalization without our consent. In addition, we may require other performance or financial based covenants, as we deem appropriate.
8
Table of Contents
Exit Strategy. Prior to making a debt investment that is accompanied by an equity-related security in a prospective portfolio company, we analyze the potential for that company to increase the liquidity of its equity through a future event that would enable us to realize appreciation in the value of our equity interest. Liquidity events may include an initial public offering, a private sale of our equity interest to a third party, a merger or an acquisition of the company or a purchase of our equity position by the company or one of its stockholders.
Investment Process
We have organized our management team around the four key elements of our investment process:
| • | Origination; |
| • | Underwriting; |
| • | Documentation; and |
| • | Loan and Compliance Administration. |
Our investment process is summarized in the following chart:
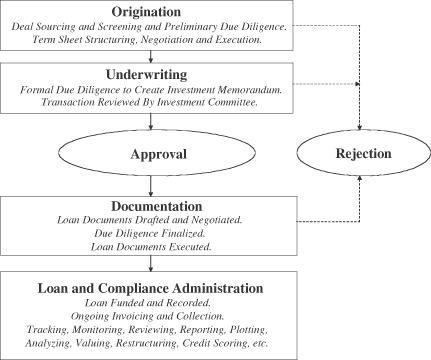
Origination
The origination process for our investments includes sourcing, screening, preliminary due diligence and deal structuring and negotiation, all leading to an executed non-binding term sheet. As of December 31, 2012, our investment origination team, which consists of approximately 31 investment professionals, is headed by our Senior Managing Directors of Technology, Clean Technology, and Life Science, and our Chief Executive Officer. The origination team is responsible for sourcing potential investment opportunities and members of the investment origination team use their extensive relationships with various leading financial sponsors, management contacts within technology-related companies, trade sources, technology conferences and various publications to source prospective portfolio companies. Our investment origination team is divided into middle market, technology, clean technology, and life science sub-teams to better source potential portfolio companies.
9
Table of Contents
In addition, we have developed a proprietary and comprehensive SQL-based database system to track various aspects of our investment process including sourcing, originations, transaction monitoring and post-investment performance. As of December 31, 2012, our proprietary SQL-based database system included over 30,900 technology-related companies and approximately 8,100 venture capital private equity sponsors/investors, as well as various other industry contacts. This proprietary SQL system allows our origination team to maintain, cultivate and grow our industry relationships while providing our origination team with comprehensive details on companies in the technology-related industries and their financial sponsors.
If a prospective portfolio company generally meets certain underwriting criteria, we perform preliminary due diligence, which may include high level company and technology assessments, evaluation of its financial sponsors’ support, market analysis, competitive analysis, identify key management, risk analysis and transaction size, pricing, return analysis and structure analysis. If the preliminary due diligence is satisfactory, and the origination team recommends moving forward, we then structure, negotiate and execute a non-binding term sheet with the potential portfolio company. Upon execution of a term sheet, the investment opportunity moves to the underwriting process to complete formal due diligence review and approval.
Underwriting
The underwriting review includes formal due diligence and approval of the proposed investment in the portfolio company.
Due Diligence. Our due diligence on a prospective investment is typically completed by two or more investment professionals whom we define as the underwriting team. The underwriting team for a proposed investment consists of the deal sponsor who typically possesses general industry knowledge and is responsible for originating and managing the transaction, other investment professional(s) who perform due diligence, credit and corporate financial analyses and, as needed, our legal professionals. To ensure consistent underwriting, we generally use our standardized due diligence methodologies, which include due diligence on financial performance and credit risk as well as an analysis of the operations and the legal and applicable regulatory framework of a prospective portfolio company. The members of the underwriting team work together to conduct due diligence and understand the relationships among the prospective portfolio company’s business plan, operations and financial performance.
As part of our evaluation of a proposed investment, the underwriting team prepares an investment memorandum for presentation to the investment committee. In preparing the investment memorandum, the underwriting team typically interviews select key management of the company and select financial sponsors and assembles information necessary to the investment decision. If and when appropriate, the investment professionals may also contact industry experts and customers, vendors or, in some cases, competitors of the company.
Approval Process. The sponsoring managing director or principal presents the investment memorandum to our investment committee for consideration. The approval of a majority of our investment committee and an affirmative vote by our Chief Executive Officer is required before we proceed with any investment. The members of our investment committee are our Chief Executive Officer, our Chief Financial Officer, our Chief Credit Officer and the Senior Managing Directors of Technology, Clean Technology and Life Science. The investment committee generally meets weekly and more frequently on an as-needed basis. The Senior Managing Directors abstain from voting with respect to investments they originate.
Documentation
Our documentation group, currently headed by our Associate General Counsel, administers the front-end documentation process for our investments. This group is responsible for documenting the term sheet approved by the investment committee to memorialize the transaction with a prospective portfolio company. This group negotiates loan documentation and, subject to the approval of the Associate General Counsel, final documents are
10
Table of Contents
prepared for execution by all parties. The documentation group generally uses the services of external law firms to complete the necessary documentation.
Loan and Compliance Administration
Our loan and compliance administration group, headed by our Chief Financial Officer and Chief Credit Officer, administers loans and tracks covenant compliance, if applicable, of our investments and oversees periodic reviews of our critical functions to ensure adherence with our internal policies and procedures. After funding of a loan in accordance with the investment committee’s approval, the loan is recorded in our loan administration software and our SQL-based database system. The loan and compliance administration group is also responsible for ensuring timely interest and principal payments and collateral management as well as advising the investment committee on the financial performance and trends of each portfolio company, including any covenant violations that occur, to aid us in assessing the appropriate course of action for each portfolio company and evaluating overall portfolio quality. In addition, the loan and compliance administration group advises the investment committee and the Valuation Committee of our Board of Directors, accordingly, regarding the credit and investment grading for each portfolio company as well as changes in the value of collateral that may occur.
The loan and compliance administration group monitors our portfolio companies in order to determine whether the companies are meeting our financing criteria and their respective business plans and also monitors the financial trends of each portfolio company from its monthly or quarterly financial statements to assess the appropriate course of action for each company and to evaluate overall portfolio quality. In addition, our management team closely monitors the status and performance of each individual company through our SQL-based database system and periodic contact with our portfolio companies’ management teams and their respective financial sponsors.
Credit and Investment Grading System. Our loan and compliance administration group uses an investment grading system to characterize and monitor our outstanding loans. Our loan and compliance administration group monitors and, when appropriate, recommends changes to investment grading. Our investment committee reviews the recommendations and/or changes to the investment grading, which are submitted on a quarterly basis to the Valuation Committee and our Board of Directors for approval.
From time to time, we will identify investments that require closer monitoring or become workout assets. We develop a workout strategy for workout assets and our investment committee monitors the progress against the strategy. We may incur losses from our investing activities, however, we work with our troubled portfolio companies in order to recover as much of our investments as is practicable, including possibly taking control of the portfolio company. There can be no assurance that principal will be recovered.
We use the following investment grading system approved by our Board of Directors:
| Grade 1. | Loans involve the least amount of risk in our portfolio. The borrower is performing above expectations, and the trends and risk profile is generally favorable. |
| Grade 2. | The borrower is performing as expected and the risk profile is neutral to favorable. All new loans are initially graded 2. |
| Grade 3. | The borrower may be performing below expectations, and the loan’s risk has increased materially since origination. We increase procedures to monitor a borrower that may have limited amounts of cash remaining on the balance sheet, is approaching its next equity capital raise within the next three to six months, or if the estimated fair value of the enterprise may be lower than when the loan was originated. We will generally lower the loan grade to a level 3 even if the company is performing in accordance to plan as it approaches the need to raise additional cash to fund its operations. Once the borrower closes its new equity capital raise, we may increase the loan grade back to grade 2 or maintain it at a grade 3 as the company continues to pursue its business plan. |
11
Table of Contents
| Grade 4. | The borrower is performing materially below expectations, and the loan risk has substantially increased since origination. Loans graded 4 may experience some partial loss or full return of principal but are expected to realize some loss of interest which is not anticipated to be repaid in full, which, to the extent not already reflected, may require the fair value of the loan to be reduced to the amount we anticipate will be recovered. Grade 4 investments are closely monitored. |
| Grade 5. | The borrower is in workout, materially performing below expectations and a significant risk of principal loss is probable. Loans graded 5 will experience some partial principal loss or full loss of remaining principal outstanding is expected. Grade 5 loans will require the fair value of the loans be reduced to the amount, if any, we anticipate will be recovered. |
At December 31, 2012, our investments had a weighted average investment grading of 2.06.
Managerial Assistance
As a business development company, we are required to offer, and provide upon request, managerial assistance to our portfolio companies. This assistance could involve, among other things, monitoring the operations of our portfolio companies, participating in board and management meetings, consulting with and advising officers of portfolio companies and providing other organizational and financial guidance. We may receive fees for these services.
COMPETITION
Our primary competitors provide financing to prospective portfolio companies and include non-bank financial institutions, federally or state chartered banks, venture debt funds, financial institutions, venture capital funds, private equity funds, investment funds and investment banks. Many of these entities have greater financial and managerial resources than we have, and the 1940 Act imposes certain regulatory restrictions on us as a business development company to which many of our competitors are not subject. However, we believe that few of our competitors possess the expertise to properly structure and price debt investments to venture capital-backed companies in technology-related markets. We believe that our specialization in financing technology-related companies will enable us to determine a range of potential values of intellectual property assets, evaluate the business prospects and operating characteristics of prospective portfolio companies and, as a result, identify investment opportunities that produce attractive risk-adjusted returns. For additional information concerning the competitive risks we face, see “Item 1A. Risk Factors—Risks Related to our Business and Structure—We operate in a highly competitive market for investment opportunities, and we may not be able to compete effectively.”
BROKERAGE ALLOCATIONS AND OTHER PRACTICES
Because we generally acquire and dispose of our investments in privately negotiated transactions, we rarely use brokers in the normal course of business. In those cases where we do use a broker, we do not execute transactions through any particular broker or dealer, but will seek to obtain the best net results for Hercules, taking into account such factors as price (including the applicable brokerage commission or dealer spread), size of order, difficulty of execution, and operational facilities of the firm and the firm’s risk and skill in positioning blocks of securities. While we generally seek reasonably competitive execution costs, we may not necessarily pay the lowest spread or commission available. Subject to applicable legal requirements, we may select a broker based partly upon brokerage or research services provided to us. In return for such services, we may pay a higher commission than other brokers would charge if we determine in good faith that such commission is reasonable in relation to the services provided.
12
Table of Contents
EMPLOYEES
As of December 31, 2012, we had 56 employees, including approximately 31 investment and portfolio management professionals, all of whom have extensive experience working on financing transactions for technology-related companies.
REGULATION
The following discussion is a general summary of the material prohibitions and descriptions governing business development companies. It does not purport to be a complete description of all of the laws and regulations affecting business development companies.
A business development company primarily focuses on investing in or lending to private companies and making managerial assistance available to them. A business development company provides stockholders with the ability to retain the liquidity of a publicly-traded stock, while sharing in the possible benefits of investing in emerging-growth, expansion-stage or established-stage companies. The 1940 Act contains prohibitions and restrictions relating to transactions between business development companies and their directors and officers and principal underwriters and certain other related persons and requires that a majority of the directors be persons other than “interested persons,” as that term is defined in the 1940 Act. In addition, the 1940 Act provides that we may not change the nature of our business so as to cease to be, or to withdraw our election as, a business development company unless approved by a majority of our outstanding voting securities. A majority of the outstanding voting securities of a company is defined under the 1940 Act as the lesser of: (i) 67% or more of such company’s shares present at a meeting if more than 50% of the outstanding shares of such company are present or represented by proxy, or (ii) more than 50% of the outstanding shares of such company.
Qualifying Assets
Under the 1940 Act, a business development company may not acquire any asset other than assets of the type listed in Section 55(a) of the 1940 Act, which are referred to as qualifying assets, unless, at the time the acquisition is made, qualifying assets represent at least 70% of the company’s total assets. The principal categories of qualifying assets relevant to our proposed business are the following:
| (1) | Securities purchased in transactions not involving any public offering from the issuer of such securities, which issuer (subject to certain limited exceptions) is an eligible portfolio company, or from any person who is, or has been during the preceding 13 months, an affiliated person of an eligible portfolio company, or from any other person, subject to such rules as may be prescribed by the SEC. An eligible portfolio company is defined in the 1940 Act as any issuer which: |
| (a) | is organized under the laws of, and has its principal place of business in, the United States; |
| (b) | is not an investment company (other than a small business investment company wholly owned by the business development company) or a company that would be an investment company but for certain exclusions under the 1940 Act; and |
| (c) | does not have any class of securities listed on a national securities exchange; or if it has securities listed on a national securities exchange such company has a market capitalization of less than $250 million; is controlled by the business development company and has an affiliate of a business development company on its board of directors; or meets such other criteria as may be established by the SEC. |
| (2) | Securities purchased in a private transaction from a U.S. issuer that is not an investment company or from an affiliated person of the issuer, or in transactions incident thereto, if the issuer is in bankruptcy and subject to reorganization or if the issuer, immediately prior to the purchase of its securities was unable to meet its obligations as they came due without material assistance other than conventional lending or financing arrangements. |
13
Table of Contents
| (3) | Securities of an eligible portfolio company purchased from any person in a private transaction if there is no ready market for such securities and we already own 60% of the outstanding equity of the eligible portfolio company. |
| (4) | Securities received in exchange for or distributed on or with respect to securities described in (1) through (4) above, or pursuant to the exercise of warrants or rights relating to such securities. |
| (5) | Cash, cash equivalents, U.S. Government securities or high-quality debt securities maturing in one year or less from the time of investment. |
Control, as defined by the 1940 Act, is presumed to exist where a business development company beneficially owns more than 25% of the outstanding voting securities of the portfolio company.
We do not intend to acquire securities issued by any investment company that exceed the limits imposed by the 1940 Act. Under these limits, we generally cannot acquire more than 3% of the voting stock of any investment company (as defined in the 1940 Act), invest more than 5% of the value of our total assets in the securities of one such investment company or invest more than 10% of the value of our total assets in the securities of such investment companies in the aggregate. With regard to that portion of our portfolio invested in securities issued by investment companies, it should be noted that such investments might subject our stockholders to additional expenses.
Significant Managerial Assistance
In order to count portfolio securities as qualifying assets for the purpose of the 70% test discussed above, a business development company must either control the issuer of the securities or must offer to make available significant managerial assistance; except that, where the business development company purchases such securities in conjunction with one or more other persons acting together, one of the other persons in the group may make available such managerial assistance. Making available significant managerial assistance means, among other things, any arrangement whereby the business development company, through its directors, officers or employees, offers to provide and, if accepted, does so provide, significant guidance and counsel concerning the management, operations or business objectives and policies of a portfolio company through monitoring of portfolio company operations, selective participation in board and management meetings, consulting with and advising a portfolio company’s officers or other organizational or financial guidance.
Temporary Investments
Pending investment in other types of qualifying assets, as described above, our investments may consist of cash, cash equivalents, U.S. government securities or high quality debt securities maturing in one year or less from the time of investment, which we refer to, collectively, as temporary investments, so that 70% of our assets are qualifying assets. Typically, we invest in U.S. treasury bills or in repurchase agreements, provided that such agreements are fully collateralized by cash or securities issued by the U.S. government or its agencies. A repurchase agreement involves the purchase by an investor, such as us, of a specified security and the simultaneous agreement by the seller to repurchase it at an agreed upon future date and at a price which is greater than the purchase price by an amount that reflects an agreed-upon interest rate. There is no percentage restriction on the proportion of our assets that may be invested in such repurchase agreements. However, if more than 25% of our total assets constitute repurchase agreements from a single counterparty, we would not meet the diversification tests imposed on us by the Code in order to qualify as a RIC for federal income tax purposes. Thus, we do not intend to enter into repurchase agreements with a single counterparty in excess of this limit. We will monitor the creditworthiness of the counterparties with which we enter into repurchase agreement transactions.
14
Table of Contents
Warrants and Options
Under the 1940 Act, a business development company is subject to restrictions on the amount of warrants, options, restricted stock or rights to purchase shares of capital stock that it may have outstanding at any time. In particular, the amount of capital stock that would result from the conversion or exercise of all outstanding warrants, options or rights to purchase capital stock cannot exceed 25% of the business development company’s total outstanding shares of capital stock. This amount is reduced to 20% of the business development company’s total outstanding shares of capital stock if the amount of warrants, options or rights issued pursuant to an executive compensation plan would exceed 15% of the business development company’s total outstanding shares of capital stock. We have received exemptive relief from the SEC permitting us to issue stock options and restricted stock to our employees and directors subject to the above conditions, among others. For a discussion regarding the conditions of this exemptive relief, see “—Exemptive Relief” below and Note 7 to our consolidated financial statements.
Senior Securities; Coverage Ratio
We will be permitted, under specified conditions, to issue multiple classes of indebtedness and one class of stock senior to our common stock if our asset coverage, as defined in the 1940 Act, is at least equal to 200% immediately after each such issuance. In addition, we may not be permitted to declare any cash dividend or other distribution on our outstanding common shares, or purchase any such shares, unless, at the time of such declaration or purchase, we have asset coverage of at least 200% after deducting the amount of such dividend, distribution, or purchase price. We may also borrow amounts up to 5% of the value of our total assets for temporary or emergency purposes. For a discussion of the risks associated with the resulting leverage, see “Item 1A. Risk Factors—Risks Related to Our Business & Structure—Because we borrow money, there could be increased risk in investing in our company.”
Capital Structure
We are not generally able to issue and sell our common stock at a price below net asset value per share. We may, however, sell our common stock, at a price below the current net asset value of the common stock, or sell warrants, options or rights to acquire such common stock, at a price below the current net asset value of the common stock if our board of directors determines that such sale is in the best interests of the Company and our stockholders have approved the practice of making such sales.
At our Annual Meeting of Stockholders on May 30, 2012, our stockholders approved a proposal authorizing us to sell up to 20% of our common stock at a price below the Company’s net asset value per share, subject to Board approval of the offering. If we were to issue shares at a price below net asset value, such sales would result in an immediate dilution to existing common stockholders, which would include a reduction in the net asset value per share as a result of the issuance. This dilution would also include a proportionately greater decrease in a stockholder’s interest in our earnings and assets and voting interest in us than the increase in our assets resulting from such issuance. In addition, if we determined to conduct additional offerings in the future there may be even greater discounts if we determine to conduct such offerings at prices below net asset value.
As a result, investors will experience further dilution and additional discounts to the price of our common stock. In any such case, the price at which our securities are to be issued and sold may not be less than a price which, in the determination of our board of directors, closely approximates the market value of such securities (less any distributing commission or discount).
Code of Ethics
We have adopted and will maintain a code of ethics that establishes procedures for personal investments and restricts certain personal securities transactions. Personnel subject to the code may invest in securities for their personal investment accounts, including securities that may be purchased or held by us, so long as such
15
Table of Contents
investments are made in accordance with the code’s requirements. Our code of ethics will generally not permit investments by our employees in securities that may be purchased or held by us. We may be prohibited under the 1940 Act from conducting certain transactions with our affiliates without the prior approval of our directors who are not interested persons and, in some cases, the prior approval of the SEC.
Our code of ethics is posted on our website at www.htgc.com and was filed with the SEC as an exhibit to the registration statement (Registration No. 333-126604) for our initial public offering. You may read and copy the code of ethics at the SEC’s Public Reference Room in Washington, D.C. You may obtain information on the operation of the Public Reference Room by calling the SEC at (202) 551-8090. In addition, the code of ethics is available on the EDGAR Database on the SEC’s Internet site at http://www.sec.gov. You may also obtain copies of the code of ethics, after paying a duplicating fee, by electronic request at the following e-mail address: publicinfo@sec.gov, or by writing the SEC’s Public Reference Section, 100 F Street, N.E., Washington, D.C. 20549.
Privacy Principles
We are committed to maintaining the privacy of our stockholders and safeguarding their non-public personal information. The following information is provided to help you understand what personal information we collect, how we protect that information and why, in certain cases, we may share information with select other parties.
Generally, we do not receive any non-public personal information relating to our stockholders, although certain non-public personal information of our stockholders may become available to us. We do not disclose any non-public personal information about our stockholders or former stockholders, except as permitted by law or as is necessary in order to service stockholder accounts (for example, to a transfer agent).
We restrict access to non-public personal information about our stockholders to our employees with a legitimate business need for the information. We maintain physical, electronic and procedural safeguards designed to protect the non-public personal information of our stockholders.
Proxy Voting Policies and Procedures
We vote proxies relating to our portfolio securities in the best interest of our stockholders. We review on a case-by-case basis each proposal submitted to a stockholder vote to determine its impact on the portfolio securities held by us. Although we generally vote against proposals that may have a negative impact on our portfolio securities, we may vote for such a proposal if there exists compelling long-term reasons to do so.
Our proxy voting decisions are made by our investment committee, which is responsible for monitoring each of our investments. To ensure that our vote is not the product of a conflict of interest, we require that: (i) anyone involved in the decision making process disclose to our Chief Compliance Officer any potential conflict that he or she is aware of and any contact that he or she has had with any interested party regarding a proxy vote; and (ii) employees involved in the decision making process or vote administration are prohibited from revealing how we intend to vote on a proposal in order to reduce any attempted influence from interested parties.
Exemptive Relief
On June 21, 2005, we filed a request with the SEC for exemptive relief to allow us to take certain actions that would otherwise be prohibited by the 1940 Act, as applicable to business development companies. Specifically, we requested that the SEC permit us to issue stock options to our non-employee directors as contemplated by Section 61(a)(3)(B)(i)(II) of the 1940 Act. On February 15, 2007, we received approval from the SEC on this exemptive request. In addition, in June 2007, we filed an amendment to the February 2007 order to adjust the number of shares issued to the non-employee directors. On October 10, 2007, we received approval from the SEC on this amended exemptive request.
16
Table of Contents
On April 5, 2007, we received an exemptive relief from the SEC that permits us to exclude the indebtedness of our wholly-owned subsidiaries that are small business investment companies from the 200% asset coverage requirement applicable to us.
On May 2, 2007, we received approval from the SEC on our exemptive request permitting us to issue restricted stock to our employees, officers and directors. On June 21, 2007, our shareholders approved amendments to the 2004 Equity Incentive Plan and 2006 Non-Employee Incentive Plan permitting such restricted grants.
On June 22, 2010 we received approval from the SEC regarding our request for exemptive relief that would permit our employees to exercise their stock options and restricted stock and pay any related income taxes using a cashless exercise program.
Other
We will be periodically examined by the SEC for compliance with the Securities Exchange Act of 1934 and the 1940 Act.
We are required to provide and maintain a bond issued by a reputable fidelity insurance company to protect us against larceny and embezzlement. Furthermore, as a business development company, we are prohibited from protecting any director or officer against any liability to our stockholders arising from willful misfeasance, bad faith, gross negligence or reckless disregard of the duties involved in the conduct of such person’s office.
We are required to adopt and implement written policies and procedures reasonably designed to prevent violation of the federal securities laws, review these policies and procedures annually for their adequacy and the effectiveness of their implementation. We have designated Mr. Martitsch, our Associate General Counsel, as our Chief Compliance Officer who is responsible for administering these policies and procedures.
Recently, legislation was introduced in the U.S. House of Representatives which may revise certain regulations applicable to business development companies. The legislation provides for (i) increasing the amount of funds business development companies may borrow by reducing asset to debt limitations from 2:1 to 3:2, (ii) permitting business development companies to file registration statements with the U.S. Securities and Exchange Commission that incorporate information from already-filed reports by reference, (iii) utilizing other streamlined registration processes afforded to operating companies, and (iv) allowing business development companies to own investment adviser subsidiaries. There are no assurances as to when the legislation will be enacted by Congress, if at all, or, if enacted, what final form the legislation would take.
Small Business Administration Regulations
On September 27, 2006, HT II received a license to operate as a SBIC under the SBIC program and is able to borrow funds from the SBA against eligible investments and additional contributions to regulatory capital. Under the Small Business Investment Company Act and current SBA policy applicable to SBICs, a SBIC can have outstanding at any time SBA guaranteed debentures up to twice the amount of its regulatory capital. With our net investment of $38.0 million in HT II as of December 31, 2012, HT II has the capacity to issue a total of $76.0 million of SBA guaranteed debentures, subject to SBA approval, of which $76.0 million was outstanding as of December 31, 2012. As of December 31, 2012, HT II has paid the SBA commitment fees of approximately $1.5 million. As of December 31, 2012, we held investments in HT II in 51 companies with a fair value of approximately $132.6 million, accounting for approximately 14.6% of our total portfolio.
On May 26, 2010, HT III received a license to operate as a SBIC under the SBIC program and is able to borrow funds from the SBA against eligible investments and additional contributions to regulatory capital. With our net investment of $74.5 million in HT III as of December 31, 2012, HT III has the capacity to issue a total of $149.0 million of SBA guaranteed debentures, subject to SBA approval, of which $149.0 million was outstanding as of December 31, 2012. As of December 31, 2012, HT III has paid commitment fees of approximately $1.5 million. As of December 31, 2012, we held investments in HT III in 35 companies with a fair value of approximately $223.6 million, accounting for approximately 24.7% of our total portfolio.
17
Table of Contents
We have issued $225.0 million in SBA-guaranteed debentures in HT II and HT III, which is the maximum amount allowed for a group of SBICs under common control.
SBICs are designed to stimulate the flow of private equity capital to eligible small businesses. Under present SBA regulations, eligible small businesses include businesses that have a tangible net worth not exceeding $18.0 million and have average annual fully taxed net income not exceeding $6.0 million for the two most recent fiscal years. In addition, SBICs must devote 25.0% of their investment activity to “smaller” concerns as defined by the SBA. A smaller concern is one that has a tangible net worth not exceeding $6.0 million and has average annual fully taxed net income not exceeding $2.0 million for the two most recent fiscal years. SBA regulations also provide alternative size standard criteria to determine eligibility, which depend on the industry in which the business is engaged and are based on such factors as the number of employees and gross sales. According to SBA regulations, SBICs may make long-term loans to small businesses, invest in the equity securities of such businesses and provide them with consulting and advisory services. Through its wholly-owned subsidiaries HT II and HT III, we plan to provide long-term loans to qualifying small businesses, and in connection therewith, make equity investments.
HT II and HT III are periodically examined and audited by the SBA’s staff to determine their compliance with SBA regulations. If HT II or HT III fails to comply with applicable SBA regulations, the SBA could, depending on the severity of the violation, limit or prohibit HT II’s or HT III’s use of debentures, declare outstanding debentures immediately due and payable, and/or limit HT II or HT III from making new investments. In addition, HT II or HT III may also be limited in their ability to make distributions to us if they do not have sufficient capital in accordance with SBA regulations. Such actions by the SBA would, in turn, negatively affect us because HT II and III are our wholly owned subsidiaries. HT II and HT III were in compliance with the terms of the SBIC’s leverage as of December 31, 2012 as a result of having sufficient capital as defined under the SBA regulations.
The rates of borrowings under various draws from the SBA beginning in April 2007 are set semiannually in March and September and range from 2.25% to 5.73%. Interest payments on SBA debentures are payable semi-annually. There are no principal payments required on these issues prior to maturity and no prepayment penalties. Debentures under the SBA generally mature ten years after being borrowed. Based on the initial draw down date of April 2007, the initial maturity of SBA debentures will occur in April 2017. In addition, the SBA charges a fee that is set annually, depending on the Federal fiscal year the leverage commitment was delegated by the SBA, regardless of the date that the leverage was drawn by the SBIC. The annual fees related to HT II debentures that pooled on September 22, 2010 were 0.406% and 0.285%, depending upon the year in which the underlying commitment was closed. The annual fees related to HT III debentures that pooled on September 19, 2012 were 0.804%. The annual fees on other debentures have been set at 0.906%. The average amount of debentures outstanding for the year ended December 31, 2012 for HT II was approximately $95.2 million with an average interest rate of approximately 5.68%. The average amount of debentures outstanding for the year ended December 31, 2012 for HT III was approximately $112.0 million with an average interest rate of approximately 3.25%.
HT II and HT III hold approximately $154.4 million and $250.8 million in assets, respectively, and accounted for approximately 10.5% and 17.0% of our total assets prior to consolidation at December 31, 2012.
The SBA restricts the ability of SBICs to repurchase their capital stock. SBA regulations also include restrictions on a “change of control” or transfer of an SBIC and require that SBICs invest idle funds in
accordance with SBA regulations. In addition, HT II and HT III may also be limited in their ability to make distributions to us if they do not have sufficient capital, in accordance with SBA regulations.
Our SBIC subsidiaries are subject to regulation and oversight by the SBA, including requirements with respect to maintaining certain minimum financial ratios and other covenants. Receipt of an SBIC license does not assure that our SBIC subsidiaries will receive SBA guaranteed debenture funding, which is dependent upon our
18
Table of Contents
SBIC subsidiaries continuing to be in compliance with SBA regulations and policies. The SBA, as a creditor, will have a superior claim to our SBIC subsidiaries’ assets over our stockholders in the event we liquidate our SBIC subsidiaries or the SBA exercises its remedies under the SBA-guaranteed debentures issued by our SBIC subsidiaries upon an event of default.
CERTAIN UNITED STATES FEDERAL INCOME TAX CONSIDERATIONS
The following discussion is a general summary of certain material U.S. federal income tax considerations relating to our qualification and taxation as a RIC and the acquisition, ownership and disposition of our preferred stock or common stock, but does not purport to be a complete description of the income tax considerations relating thereto.
Election to be Taxed as a RIC
Through December 31, 2005, we were subject to Federal income tax as an ordinary corporation under subchapter C of the Code. Effective beginning on January 1, 2006 we met the criteria specified below to qualify as a RIC, and elected to be treated as a RIC under Subchapter M of the Code with the filing of our federal income tax return for 2006. As a RIC, we generally will not have to pay corporate taxes on any income we distribute to our stockholders as dividends, which allows us to reduce or eliminate our corporate level tax. On December 31, 2005, immediately before the effective date of our RIC election, we held assets with “built-in gain,” which are assets whose fair market value as of the effective date of the election exceeded their tax basis as of such date. We elected to recognize all of our net built-in gains at the time of the conversion and paid tax on the built-in gain with the filing of our 2005 federal income tax return. In making this election, we marked our portfolio to market at the time of our RIC election and paid approximately $294,000 in income tax on the resulting gains.
Taxation as a Regulated Investment Company
For any taxable year in which we:
| • | qualify as a RIC; and |
| • | distribute at least 90% of our net ordinary income and realized net short-term gains in excess of realized net long-term capital losses, if any (the “Annual Distribution Requirement”); we generally will not be subject to federal income tax on the portion of our investment company taxable income and net capital gain (i.e., net realized long-term capital gains in excess of net realized short-term capital losses) we distribute (or are deemed to distribute) to stockholders with respect to that year. As described above, we made the election to recognize built-in gains as of the effective date of our election to be treated as a RIC and therefore will not be subject to built-in gains tax when we sell those assets. However, if we subsequently acquire built-in gain assets from a C corporation in a carryover basis transaction, then we may be subject to tax on the gains recognized by us on dispositions of such assets unless we make a special election to pay corporate-level tax on such built-in gain at the time the assets are acquired. We will be subject to U.S. federal income tax at the regular corporate rates on any income or capital gains not distributed (or deemed distributed) to our stockholders. |
In order to qualify as a RIC for federal income tax purposes and obtain the tax benefits of RIC status, in addition to satisfying the Annual Distribution Requirement, we must, among other things:
| • | have in effect at all times during each taxable year an election to be regulated as a business development company under the 1940 Act; |
| • | derive in each taxable year at least 90% of our gross income from (a) dividends, interest, payments with respect to certain securities loans, gains from the sale of stock or other securities, or other income derived with respect to our business of investing in such stock or securities and (b) net income derived from an interest in a “qualified publicly traded partnership” (the “90% Income Test”); and |
19
Table of Contents
| • | diversify our holdings so that at the end of each quarter of the taxable year: |
| • | at least 50% of the value of our assets consists of cash, cash equivalents, U.S. government securities, securities of other RICs, and other securities if such other securities of any one issuer do not represent more than 5% of the value of our assets or more than 10% of the outstanding voting securities of such issuer; and |
| • | no more than 25% of the value of our assets is invested in (i) securities (other than U.S. government securities or securities of other RICs) of one issuer, (ii) securities of two or more issuers that are controlled, as determined under applicable tax rules, by us and that are engaged in the same or similar or related trades or businesses or (iii) securities of one or more “qualified publicly traded partnerships” (the “Diversification Tests”). |
Under applicable Treasury regulations and certain private rulings issued by the Internal Revenue Service, RICs are permitted to treat certain distributions payable in up to 80% in their stock, as taxable dividends that will satisfy their annual distribution obligations for federal income tax and excise tax purposes provided that shareholders have the opportunity to elect to receive the distribution in cash. Taxable stockholders receiving such dividends will be required to include the full amount of the dividend as ordinary income (or as long-term capital gain to the extent such distribution is properly designated as a capital gain dividend) to the extent of our current and accumulated earnings and profits for United States federal income tax purposes. As a result, a U.S. stockholder may be required to pay tax with respect to such dividends in excess of any cash received. If a U.S. stockholder sells the stock it receives as a dividend in order to pay this tax, the sales proceeds may be less than the amount included in income with respect to the dividend, depending on the market price of our stock at the time of the sale. Furthermore, with respect to non-U.S. stockholders, we may be required to withhold U.S. tax with respect to such dividends, including in respect of all or a portion of such dividend that is payable in stock. In addition, if a significant number of our stockholders determine to sell shares of our stock in order to pay taxes owed on dividends, then such sales may put downward pressure on the trading price of our stock. We may in the future determine to distribute taxable dividends that are payable in part in our common stock.
As a RIC, we will be subject to a 4% nondeductible federal excise tax on certain undistributed income unless we distribute in a timely manner an amount at least equal to the sum of (1) 98% of our ordinary income for each calendar year, (2) 98.2% of our capital gain net income for the 1-year period ending October 31 in that calendar year and (3) any income recognized, but not distributed, in preceding years and on which we paid no federal income tax (the “Excise Tax Avoidance Requirements”). We will not be subject to excise taxes on amounts on which we are required to pay corporate income tax (such as retained net capital gains). Depending on the level of taxable income earned in a tax year, we may choose to carry over taxable income in excess of current year distributions from such taxable income into the next tax year and pay a 4% excise tax on such income, as required. The maximum amount of excess taxable income that may be carried over for distribution in the next year under the Code is the total amount of dividends paid in the following year, subject to certain declaration and payment guidelines. To the extent we choose to carry over taxable income into the next tax year, dividends declared and paid by us in a year may differ from taxable income for that year as such dividends may include the distribution of current year taxable income, the distribution of prior year taxable income carried over into and distributed in the current year, or returns of capital.
We may be required to recognize taxable income in circumstances in which we do not receive a corresponding payment in cash. For example, if we hold debt obligations that are treated under applicable tax rules as having original issue discount (such as debt instruments with payment-in-kind interest or, in certain cases, increasing interest rates or debt instruments that were issued with warrants), we must include in income each year a portion of the original issue discount that accrues over the life of the obligation, regardless of whether cash representing such income is received by us in the same taxable year. Because any original issue discount accrued will be included in our investment company taxable income for the year of accrual, we may be required to make a distribution to our stockholders in order to satisfy the Annual Distribution Requirement and the Excise Tax Avoidance Requirement, even though we will not have received any corresponding cash amount.
20
Table of Contents
Gain or loss realized by us from the sale or exchange of warrants acquired by us as well as any loss attributable to the lapse of such warrants generally will be treated as capital gain or loss. Such gain or loss generally will be long-term or short-term, depending on how long we held a particular warrant.
We are authorized to borrow funds and to sell assets in order to satisfy the Annual Distribution Requirement and the Excise Tax Avoidance Requirement (collectively, the “Distribution Requirements”). However, under the 1940 Act, we are not permitted to make distributions to our stockholders while our debt obligations and other senior securities are outstanding unless certain “asset coverage” tests are met. See “—Regulation—Senior Securities; Coverage Ratio.” We may be restricted from making distributions under the terms of our debt obligations themselves unless certain conditions are satisfied. Moreover, our ability to dispose of assets to meet the Distribution Requirements may be limited by (1) the illiquid nature of our portfolio, or (2) other requirements relating to our status as a RIC, including the Diversification Tests. If we dispose of assets in order to meet the Distribution Requirements, we may make such dispositions at times that, from an investment standpoint, are not advantageous. If we are prohibited from making distributions or are unable to obtain cash from other sources to make the distributions, we may fail to qualify as a RIC, which would result in us becoming subject to corporate-level federal income tax.
In addition, we will be partially dependent on our SBIC subsidiaries for cash distributions to enable us to meet the RIC Distribution Requirements. Our SBIC subsidiaries may be limited by the Small Business Investment Act of 1958, and SBA regulations governing SBICs, from making certain distributions to us that may be necessary to maintain our status as a RIC. We may have to request a waiver of the SBA’s restrictions for our SBIC subsidiaries to make certain distributions to maintain our RIC status. We cannot assure you that the SBA will grant such waiver. If our SBIC subsidiaries are unable to obtain a waiver, compliance with the SBA regulations may cause us to fail to qualify as a RIC, which would result in us becoming subject to corporate-level federal income tax.
Any transactions in options, futures contracts, constructive sales, hedging, straddle, conversion or similar transactions, and forward contracts will be subject to special tax rules, the effect of which may be to accelerate income to us, defer losses, cause adjustments to the holding periods of our investments, convert long-term capital gains into short-term capital gains, convert short-term capital losses into long-term capital losses or have other tax consequences. These rules could affect the amount, timing and character of distributions to stockholders. We do not currently intend to engage in these types of transactions.
A RIC is limited in its ability to deduct expenses in excess of its “investment company taxable income” (which is, generally, ordinary income plus net realized short-term capital gains in excess of net realized long-term capital losses). If our expenses in a given year exceed gross taxable income (e.g., as the result of large amounts of equity-based compensation), we would experience a net operating loss for that year. However, a RIC is not permitted to carry forward net operating losses to subsequent years and such net operating losses do not pass through to the RIC’s stockholders. In addition, expenses can be used only to offset investment company taxable income, not net capital gain. A RIC may not use any net capital losses (that is, realized capital losses in excess of realized capital gains) to offset the RIC’s investment company taxable income, but may carry forward such losses, and use them to offset capital gains indefinitely. Due to these limits on the deductibility of expenses and net capital losses, we may for tax purposes have aggregate taxable income for several years that we are required to distribute and that is taxable to our stockholders even if such income is greater than the aggregate net income we actually earned during those years. Such required distributions may be made from our cash assets or by liquidation of investments, if necessary. We may realize gains or losses from such liquidations. In the event we realize net capital gains from such transactions, you may receive a larger capital gain distribution than you would have received in the absence of such transactions.
Investment income received from sources within foreign countries, or capital gains earned by investing in securities of foreign issuers, may be subject to foreign income taxes withheld at the source. In this regard, withholding tax rates in countries with which the United States does not have a tax treaty are often as high as
21
Table of Contents
35% or more. The United States has entered into tax treaties with many foreign countries that may entitle us to a reduced rate of tax or exemption from tax on this related income and gains. The effective rate of foreign tax cannot be determined at this time since the amount of our assets to be invested within various countries is not now known. We do not anticipate being eligible for the special election that allows a RIC to treat foreign income taxes paid by such RIC as paid by its shareholders.
If we acquire stock in certain foreign corporations that receive at least 75% of their annual gross income from passive sources (such as interest, dividends, rents, royalties or capital gain) or hold at least 50% of their total assets in investments producing such passive income (“passive foreign investment companies”), we could be subject to federal income tax and additional interest charges on “excess distributions” received from such companies or gain from the sale of stock in such companies, even if all income or gain actually received by us is timely distributed to our shareholders. We would not be able to pass through to our shareholders any credit or deduction for such a tax. Certain elections may, if available, ameliorate these adverse tax consequences, but any such election requires us to recognize taxable income or gain without the concurrent receipt of cash. We intend to limit and/or manage our holdings in passive foreign investment companies to minimize our tax liability.
Foreign exchange gains and losses realized by us in connection with certain transactions involving non-dollar debt securities, certain foreign currency futures contracts, foreign currency option contracts, foreign currency forward contracts, foreign currencies, or payables or receivables denominated in a foreign currency are subject to Code provisions that generally treat such gains and losses as ordinary income and losses and may affect the amount, timing and character of distributions to our stockholders. Any such transactions that are not directly related to our investment in securities (possibly including speculative currency positions or currency derivatives not used for hedging purposes) could, under future Treasury regulations, produce income not among the types of “qualifying income” from which a RIC must derive at least 90% of its annual gross income.
Failure to Qualify as a Regulated Investment Company
If we fail to satisfy the 90% Income Test or the Diversification Tests for any taxable year, we may nevertheless continue to qualify as a RIC for such year if certain relief provisions are applicable (which may, among other things, require us to pay certain corporate-level federal taxes or to dispose of certain assets).
If we were unable to qualify for treatment as a RIC and the foregoing relief provisions are not applicable, we would be subject to tax on all of our taxable income at regular corporate rates. We would not be able to deduct distributions to stockholders, nor would they be required to be made. Such distributions would be taxable to our stockholders and if provided certain holding period and other requirements were met, could qualify for treatment as “qualified dividend income” eligible for the 20% maximum rate to the extent of our current and accumulated earnings and profits. Subject to certain limitations under the Code, corporate distributions would be eligible for the dividends-received deduction. Distributions in excess of our current and accumulated earnings and profits would be treated first as a return of capital to the extent of the stockholder’s tax basis, and any remaining distributions would be treated as a capital gain. To requalify as a RIC in a subsequent taxable year, we would be required to satisfy the RIC qualification requirements for that year and dispose of any earnings and profits from any year in which we failed to qualify as a RIC. Subject to a limited exception applicable to RICs that qualified as such under Subchapter M of the Code for at least one year prior to disqualification and that requalify as a RIC no later than the second year following the nonqualifying year, we could be subject to tax on any unrealized net built-in gains in the assets held by us during the period in which we failed to qualify as a RIC that are recognized within the subsequent 10 years, unless we made a special election to pay corporate-level tax on such built-in gain at the time of our requalification as a RIC.
22
Table of Contents
DETERMINATION OF NET ASSET VALUE
We determine the net asset value per share of our common stock quarterly. The net asset value per share is equal to the value of our total assets minus liabilities and any preferred stock outstanding divided by the total number of shares of common stock outstanding. As of the date of this report, we do not have any preferred stock outstanding.
Our investments are carried at fair value in accordance with the 1940 Act and Accounting Standards Codification (“ASC”) topic 820 Fair Value Measurements and Disclosures. At December 31, 2012, approximately 80.7% of the Company’s total assets represented investments in portfolio companies that are valued at fair value by the Board of Directors. Value, as defined in Section 2(a) (41) of the 1940 Act, is (i) the market price for those securities for which a market quotation is readily available and (ii) for all other securities and assets, fair value is as determined in good faith by the Board of Directors. Our debt securities are primarily invested in equity sponsored technology-related companies including life science, clean technology and select lower middle market technology companies. Given the nature of lending to these types of businesses, our investments in these portfolio companies are generally considered Level 3 assets under ASC 820 because there is no known or accessible market or market indexes for these investment securities to be traded or exchanged. As such, it values substantially all of its investments at fair value as determined in good faith pursuant to a consistent valuation policy and our Board of Directors in accordance with the provisions of ASC 820 and the 1940 Act. Due to the inherent uncertainty in determining the fair value of investments that do not have a readily available market value, the fair value of our investments determined in good faith by our Board may differ significantly from the value that would have been used had a readily available market existed for such investments, and the differences could be material.
Our Board of Directors may from time to time engage an independent valuation firm to provide us with valuation assistance with respect to certain of our portfolio companies on a quarterly basis. We intend to continue to engage an independent valuation firm to provide us with assistance regarding our determination of the fair value of selected portfolio investments each quarter unless directed by the Board of Directors to cancel such valuation services. The scope of the services rendered by an independent valuation firm is at the discretion of the Board of Directors. Our Board of Directors is ultimately and solely responsible for determining the fair value of our investments in good faith.
With respect to investments for which market quotations are not readily available or when such market quotations are deemed not to represent fair value, our board of directors has approved a multi-step valuation process each quarter, as described below:
(1) our quarterly valuation process begins with each portfolio company or investment being initially valued by the investment professionals responsible for the portfolio investment;
(2) preliminary valuation conclusions are then documented and discussed with our investment committee;
(3) the valuation committee of the board of directors reviews the preliminary valuation of the investment committee and that of the independent valuation firm and responds to the valuation recommendation of the independent valuation firm to reflect any comments, if any; and
(4) the Board of Directors discusses valuations and determines the fair value of each investment in our portfolio in good faith based on the input of, where applicable, the respective independent valuation firm and the valuation committee.
We adopted ASC 820 on January 1, 2008. ASC 820 establishes a framework for measuring the fair value of the assets and liabilities and outlines a fair value hierarchy which prioritizes the inputs used to measure fair value and the effect of fair value measures on earnings. ASC 820 also enhances disclosure requirements for fair value measurements based on the level within the hierarchy of the information used in the valuation. ASC 820 applies whenever other standards require (or permit) assets or liabilities to be measured at fair value but doesn’t expand
23
Table of Contents
the use of fair value in any new circumstances. ASC 820 defines fair value as the price that would be received to sell an asset or paid to transfer a liability in an orderly transaction between market participants at the measurement date.
The Company has categorized all investments recorded at fair value in accordance with ASC 820 based upon the level of judgment associated with the inputs used to measure their fair value. Hierarchical levels, defined by ASC 820 and directly related to the amount of subjectivity associated with the inputs to fair valuation of these assets and liabilities, are as follows:
Level 1—Inputs are unadjusted, quoted prices in active markets for identical assets at the measurement date. The types of assets carried at Level 1 fair value generally are equities listed in active markets.
Level 2—Inputs (other than quoted prices included in Level 1) are either directly or indirectly observable for the asset in connection with market data at the measurement date and for the extent of the instrument’s anticipated life. Fair valued assets that are generally included in this category are warrants held in a public company.
Level 3—Inputs reflect management’s best estimate of what market participants would use in pricing the asset at the measurement date. It includes prices or valuations that require inputs that are both significant to
the fair value measurement and unobservable. Generally, assets carried at fair value and included in this category are the debt investments and warrants and equities held in a private company.
Debt Investments
We follow the guidance set forth in ASC 820 which establishes a framework for measuring the fair value of assets and liabilities and outlines a fair value hierarchy which prioritizes the inputs used to measure fair value and the effect of fair value measures on earnings. Our debt securities are primarily invested in venture capital-backed companies in technology-related markets, including technology, biotechnology, life science and clean-technology industries at all stages of development. Given the nature of lending to these types of businesses, the Company’s investments in these portfolio companies are considered Level 3 assets under ASC 820 because there is no known or accessible market or market indexes for these investment securities to be traded or exchanged.
In making a good faith determination of the value of our investments, we generally start with the cost basis of the investment, which includes the value attributed to the OID, if any, and PIK interest which has been accrued to principal as earned. We then apply the valuation methods as set forth below.
We apply a procedure that assumes a sale of investment in a hypothetical market to a hypothetical market participant where buyers and sellers are willing participants. The hypothetical market does not include scenarios where the underlying security was simply repaid or extinguished, but includes an exit concept. Under this process, we also evaluate the collateral for recoverability of the debt investments as well as apply all of its historical fair value analysis. We use pricing on recently issued comparable debt securities to determine the baseline hypothetical market yields as of the measurement date. We consider each portfolio company’s credit rating, security liens and other characteristics of the investment to adjust the baseline yield to derive a hypothetical yield for each investment. The anticipated future cash flows from each investment are then discounted at the hypothetical yield to estimate each investment’s fair value as of the measurement date.
Our process includes, among other things, the underlying investment performance, the current portfolio company’s financial condition and market changing events that impact valuation, estimated remaining life, current market yield and interest rate spreads of similar securities as of the measurement date. We value our syndicated loans using broker quotes and bond indices amongst other factors. If there is a significant deterioration of the credit quality of a debt investment, we may consider other factors to estimate fair value, including the proceeds that would be received in a liquidation analysis.
24
Table of Contents
We record unrealized depreciation on investments when we believe that an investment has decreased in value, including where collection of a loan is doubtful or if under the in exchange premise when the value of a debt security were to be less than amortized cost of the investment. Conversely, where appropriate, we record unrealized appreciation if we believe that the underlying portfolio company has appreciated in value and, therefore, that our investment has also appreciated in value or if under the in exchange premise the value of a debt security were to greater than amortized cost.
When originating a debt instrument, we generally receive warrants or other equity-related securities from the borrower. We determine the cost basis of the warrants or other equity-related securities received based upon their respective fair values on the date of receipt in proportion to the total fair value of the debt and warrants or other equity-related securities received. Any resulting discount on the loan from recordation of the warrant or other equity instruments is accreted into interest income over the life of the loan.
Equity-Related Securities and Warrants
Securities that are traded in the over-the-counter markets or on a stock exchange will be valued at the prevailing bid price at period end. We have a limited number of equity securities in public companies. In accordance with the 1940 Act, unrestricted publicly traded securities for which market quotations are readily available are valued at the closing market quote on the measurement date.
We estimate the fair value of warrants using a Black Scholes pricing model. At each reporting date, privately held warrant and equity related securities are valued based on an analysis of various factors including, but not limited to, the portfolio company’s operating performance and financial condition and general market conditions, price to enterprise value or price to equity ratios, discounted cash flow, valuation comparisons to comparable public companies or other industry benchmarks. When an external event occurs, such as a purchase transaction, public offering, or subsequent equity sale, the pricing indicated by that external event is utilized to corroborate the Company’s valuation of the warrant and equity related. We periodically review the valuation of its portfolio companies that have not been involved in a qualifying external event to determine if the enterprise value of the portfolio company may have increased or decreased since the last valuation measurement date.
Determinations In Connection With Offerings
In connection with each offering of shares of our common stock, the Board of Directors or a committee thereof is required to make the determination that we are not selling shares of our common stock at a price below our then current net asset value at the time at which the sale is made. The Board of Directors considers the following factors, among others, in making such determination:
| • | the net asset value of our common stock disclosed in the most recent periodic report we filed with the SEC; |
| • | our management’s assessment of whether any material change in the net asset value has occurred (including through the realization of net gains on the sale of our portfolio investments) from the period beginning on the date of the most recently disclosed net asset value to the period ending two days prior to the date of the sale of our common stock; and |
| • | the magnitude of the difference between the net asset value disclosed in the most recent periodic report we filed with the SEC and our management’s assessment of any material change in the net asset value since the date of the most recently disclosed net asset value, and the offering price of the shares of our common stock in the proposed offering. |
Importantly, this determination does not require that we calculate net asset value in connection with each offering of shares of our common stock, but instead it involves the determination by the Board of Directors or a committee thereof that we are not selling shares of our common stock at a price below the then current net asset value at the time at which the sale is made.
25
Table of Contents
Moreover, to the extent that there is even a remote possibility that we may (i) issue shares of our common stock at a price below the then current net asset value of our common stock at the time at which the sale is made or (ii) trigger the undertaking (which we provided to the SEC in the registration statement to which this prospectus is a part) to suspend the offering of shares of our common stock pursuant to this prospectus if the net asset value fluctuates by certain amounts in certain circumstances until the prospectus is amended, the Board of Directors or a committee thereof will elect, in the case of clause (i) above, either to postpone the offering until such time that there is no longer the possibility of the occurrence of such event or to undertake to determine net asset value within two days prior to any such sale to ensure that such sale will not be below our then current net asset value, and, in the case of clause (ii) above, to comply with such undertaking or to undertake to determine net asset value to ensure that such undertaking has not been triggered.
These processes and procedures are part of our compliance policies and procedures. Records will be made contemporaneously with all determinations described in this section and these records will be maintained with other records we are required to maintain under the 1940 Act.
| Item 1A. | Risk Factors |
Investing in our securities may be speculative and involves a high degree of risk. You should consider carefully the risks described below and all other information contained in this Annual Report, including our financial statements and the related notes and the schedules and exhibits to this Annual Report. The risks set forth below are not the only risks we face. If any of the following risks occur, our business, financial condition and results of operations could be materially adversely affected. In such case, our net asset value and the trading price of our securities could decline, and you may lose all or part of your investment.
Risks Related to our Business Structure
We are dependent upon key management personnel for their time availability and our future success, particularly Manuel A. Henriquez, and if we are not able to hire and retain qualified personnel, or if we lose any member of our senior management team, our ability to implement our business strategy could be significantly harmed.
We depend upon the members of our senior management, particularly Mr. Henriquez, as well as other key personnel for the identification, final selection, structuring, closing and monitoring of our investments. These employees have critical industry experience and relationships on which we rely to implement our business plan. If we lose the services of Mr. Henriquez, or of any other senior management members, we may not be able to operate the business as we expect, and our ability to compete could be harmed, which could cause our operating results to suffer. Furthermore, we do not have an employment agreement with Mr. Henriquez and our senior management is not restricted from creating new investment vehicles subject to compliance with applicable law. We believe our future success will depend, in part, on our ability to identify, attract and retain sufficient numbers of highly skilled employees. If we do not succeed in identifying, attracting and retaining such personnel, we may not be able to operate our business as we expect.
Our business model depends to a significant extent upon strong referral relationships with venture capital and private equity fund sponsors, and our inability to develop or maintain these relationships, or the failure of these relationships to generate investment opportunities, could adversely affect our business.
We expect that members of our management team will maintain their relationships with venture capital and private equity firms, and we will rely to a significant extent upon these relationships to provide us with our deal flow. If we fail to maintain our existing relationships, our relationships become strained as a result of enforcing our rights with respect to non-performing portfolio companies in protecting our investments or we fail to develop new relationships with other firms or sources of investment opportunities, then we will not be able to grow our investment portfolio. In addition, persons with whom members of our management team have relationships are not obligated to provide us with investment opportunities and, therefore, there is no assurance that such relationships will lead to the origination of debt or other investments.
26
Table of Contents
We operate in a highly competitive market for investment opportunities, and we may not be able to compete effectively.
A number of entities compete with us to make the types of investments that we plan to make in prospective portfolio companies. We compete with a large number of venture capital and private equity firms, as well as with other investment funds, investment banks and other sources of financing, including traditional financial services companies such as commercial banks and finance companies. Many of our competitors are substantially larger and have considerably greater financial, technical, marketing and other resources than we do. For example, some competitors may have a lower cost of funds and/or access to funding sources that are not available to us. This may enable some competitors to make commercial loans with interest rates that are comparable to or lower than the rates that we typically offer. We may lose prospective portfolio companies if we do not match competitors’ pricing, terms and structure. If we do match competitors’ pricing, terms or structure, we may experience decreased net interest income and increased risk of credit losses. In addition, some of our competitors may have higher risk tolerances or different risk assessments, which could allow them to consider a wider variety of investments, establish more relationships and build their market shares. Furthermore, many potential competitors are not subject to the regulatory restrictions that the 1940 Act imposes on us as a business development company or that the Code would impose on us as a RIC. If we are not able to compete effectively, our business, financial condition, and results of operations will be adversely affected. As a result of this competition, there can be no assurance that we will be able to identify and take advantage of attractive investment opportunities that we identify, or that we will be able to fully invest our available capital.
Because we intend to distribute substantially all of our income to our stockholders in order to qualify as a RIC, we will continue to need additional capital to finance our growth. If additional funds are unavailable or not available on favorable terms, our ability to grow will be impaired.
In order to satisfy the tax requirements applicable to a RIC, to avoid payment of excise taxes and to minimize or avoid payment of income taxes, we intend to distribute to our stockholders substantially all of our ordinary income and realized net capital gains except for certain realized net long-term capital gains, which we may retain, pay applicable income taxes with respect thereto and elect to treat as deemed distributions to our stockholders. As a business development company, we generally are required to meet a coverage ratio of total assets to total borrowings and other senior securities, which includes all of our borrowings and any preferred stock that we may issue in the future, of at least 200%. This requirement limits the amount that we may borrow. This limitation may prevent us from incurring debt and require us to raise additional equity at a time when it may be disadvantageous to do so. We cannot assure you that debt and equity financing will be available to us on favorable terms, or at all, and debt financings may be restricted by the terms of any of our outstanding borrowings. If we are unable to incur additional debt, we may be required to raise additional equity at a time when it may be disadvantageous to do so. In addition, shares of closed-end investment companies have recently traded at discounts to their net asset values. This characteristic of closed-end investment companies is separate and distinct from the risk that our net asset value per share may decline. We cannot predict whether shares of our common stock will trade above, at or below our net asset value. If our common stock trades below its net asset value, we generally will not be able to issue additional shares of our common stock at its market price without first obtaining the approval for such issuance from our stockholders and our independent directors. If additional funds are not available to us, we could be forced to curtail or cease new lending and investment activities, and our net asset value could decline. In addition, our results of operations and financial condition could be adversely affected.
Because we have substantial indebtedness, there could be increased risk in investing in our company.
Lenders have fixed dollar claims on our assets that are superior to the claims of stockholders, and we have granted, and may in the future grant, lenders a security interest in our assets in connection with borrowings. In the case of a liquidation event, those lenders would receive proceeds before our stockholders. In addition, borrowings, also known as leverage, magnify the potential for gain or loss on amounts invested and, therefore, increase the risks associated with investing in our securities. Leverage is generally considered a speculative investment technique. If the value of our assets increases, then leveraging would cause the net asset value
27
Table of Contents
attributable to our common stock to increase more than it otherwise would have had we not leveraged. Conversely, if the value of our assets decreases, leveraging would cause the net asset value attributable to our common stock to decline more than it otherwise would have had we not leveraged. Similarly, any increase in our revenue in excess of interest expense on our borrowed funds would cause our net income to increase more than it would without the leverage. Any decrease in our revenue would cause our net income to decline more than it would have had we not borrowed funds and could negatively affect our ability to make distributions on common stock. Our ability to service any debt that we incur will depend largely on our financial performance and will be subject to prevailing economic conditions and competitive pressures. We and, indirectly, our stockholders will bear the cost associated with our leverage activity. If we are not able to service our substantial indebtedness, our business could be harmed materially.
Our secured credit facilities with Wells Fargo Capital Finance LLC (the “Wells Facility”) and Union Bank, N.A. (the “Union Bank Facility,” and together with the Wells Facility, our “Credit Facilities”) our Convertible Senior Notes, our 2019 Notes and our Asset-Backed Notes (as each term is defined below) contain financial and operating covenants that could restrict our business activities, including our ability to declare dividends if we default under certain provisions.
As of December 31, 2012, we did not have any outstanding borrowings under our Credit Facilities. In addition, as of December 31, 2012, we had approximately $225.0 million of indebtedness outstanding incurred by our SBIC subsidiaries, $75.0 million of Convertible Senior Notes payable, approximately $170.4 million of 2019 Notes and approximately $129.3 million in aggregate principal amount of fixed rate asset-backed notes (the “Asset-Backed Notes”) in connection with our $230.7 million debt Securitization (the “Debt Securitization”). There can be no assurance that we will be successful in obtaining any additional debt capital on terms acceptable to us or at all. If we are unable to obtain debt capital, then our equity investors will not benefit from the potential for increased returns on equity resulting from leverage to the extent that our investment strategy is successful and we may be limited in our ability to make new commitments or fundings to our portfolio companies.
As a business development company, generally, we are not permitted to incur indebtedness unless immediately after such borrowing we have an asset coverage for total borrowings of at least 200% (i.e., the amount of debt may not exceed 50% of the value of our assets). In addition, we may not be permitted to declare any cash dividend or other distribution on our outstanding common shares, or purchase any such shares, unless, at the time of such declaration or purchase, we have an asset coverage of at least 200% after deducting the amount of such dividend, distribution, or purchase price. If this ratio declines below 200%, we may not be able to incur additional debt and may need to sell a portion of our investments to repay some debt when it is disadvantageous to do so, and we may not be able to make distributions. As of December 31, 2012 our asset coverage ratio under our regulatory requirements as a business development company was 296.8%, excluding our SBIC debentures as a result of our exemptive order from the SEC which allows us to exclude all SBA leverage from our asset coverage ratio.
Illustration. The following table illustrates the effect of leverage on returns from an investment in our common stock assuming various annual returns, net of expenses. The calculations in the table below are hypothetical and actual returns may be higher or lower than those appearing below.
| Assumed Return on Our Portfolio (Net of Expenses) |
||||||||||||||||||||
| (10)% | (5)% | 0% | 5% | 10% | ||||||||||||||||
| Corresponding return to stockholder(1) |
(29.42 | %) | (18.53 | %) | (7.65 | %) | 3.24 | % | 14.13 | % | ||||||||||
| (1) | Assumes $1,123.6 million in total assets, $599.7 million in debt outstanding, $516.0 million in stockholders’ equity, and an average cost of funds of 6.6%, which is the approximate average cost of borrowed funds, including our Credit Facilities, our Convertible Senior Notes, 2019 Notes, our SBA debentures and our Asset-Backed Notes for the period ended December 31, 2012. Actual interest payments may be different. |
28
Table of Contents
It is likely that the terms of any current or future long-term or revolving credit or warehouse facility we may enter into in the future could constrain our ability to grow our business.
Under our borrowings and Credit Facilities, current lenders have, and any future lender or lenders may have, fixed dollar claims on our assets that are senior to the claims of our stockholders and, thus, will have a preference over our stockholders with respect to our assets in the collateral pool. Our Credit Facilities and borrowings also subject us to various financial and operating covenants, including, but not limited to, maintaining certain financial ratios and minimum tangible net worth amounts. Future credit facilities and borrowings will likely subject us to similar or additional covenants. In addition, we may grant a securities interest in our assets in connection with any such credit facilities and borrowings.
Our Credit Facilities generally contain customary default provisions such as a minimum net worth amount, a profitability test, and a restriction on changing our business and loan quality standards. In addition, our Credit Facilities require or are expected to require the repayment of all outstanding debt on the maturity which may disrupt our business and potentially the business of our portfolio companies that are financed through the facilities. An event of default under these facilities would likely result, among other things, in termination of the availability of further funds under the facilities and accelerated maturity dates for all amounts outstanding under the facilities, which would likely disrupt our business and, potentially, the business of the portfolio companies whose loans we finance through the facilities. This could reduce our revenues and, by delaying any cash payment allowed to us under our facilities until the lender has been paid in full, reduce our liquidity and cash flow and impair our ability to grow our business and maintain our status as a RIC.
The terms of future available financing may place limits on our financial and operation flexibility. If we are unable to obtain sufficient capital in the future, we may be forced to reduce or discontinue our operations, not be able to make new investments, or otherwise respond to changing business conditions or competitive pressures.
In addition to regulatory requirements that restrict our ability to raise capital, our Credit Facilities, the Convertible Senior Notes and the 2019 Notes contain various covenants which, if not complied with, could accelerate repayment under the facility or require us to repurchase the Convertible Senior Notes and the 2019 Notes thereby materially and adversely affecting our liquidity, financial condition, results of operations and ability to pay dividends.
The credit agreements governing our Credit Facilities, the Convertible Senior Notes and the 2019 Notes require us to comply with certain financial and operational covenants. These covenants require us to, among other things, maintain certain financial ratios, including asset coverage, debt to equity and interest coverage. Our ability to continue to comply with these covenants in the future depends on many factors, some of which are beyond our control. There are no assurances that we will be able to comply with these covenants. Failure to comply with these covenants would result in a default which, if we were unable to obtain a waiver from the lenders under our Credit Facilities or the trustee or holders under the Convertible Senior Notes and could accelerate repayment under the facilities or the Convertible Senior Notes or the 2019 Notes and thereby have a material adverse impact on our liquidity, financial condition, results of operations and ability to pay dividends. In addition, holders of the Convertible Senior Notes will have the right to require us to repurchase the Convertible Senior Notes upon the occurrence of a fundamental change at a repurchase price equal to 100% of their principal amount, plus accrued and unpaid interest, if any. We may not have enough available cash or be able to obtain financing at the time we are required to make repurchases. See “Item 7. Management’s Discussion and Analysis of Results of Operations and Financial Condition—Borrowings.”
We are subject to certain risks as a result of our interests in connection with the Debt Securitization and our equity interest in the Securitization Issuer.
On December 19, 2012, in connection with the Debt Securitization and the offering of the Asset-Backed Notes by Hercules Capital Funding Trust 2012-1 (the “Securitization Issuer”), we sold and/or contributed to Hercules Capital Funding 2012-1 LLC, as Trust Depositor (the “Trust Depositor”), certain senior loans made to
29
Table of Contents
certain of our portfolio companies (the “Loans”), which the Trust Depositor in turn sold and/or contributed to the Securitization Issuer in exchange for 100% of the equity interest in the Securitization Issuer, cash proceeds and other consideration. Following these transfers, the Securitization Issuer, and not the Trust Depositor or us, held all of the ownership interest in the Loans.
As a result of the Debt Securitization, we hold, indirectly through the Trust Depositor, 100% of the equity interest in the Securitization Issuer. As a result, we consolidate the financial statements of the Trust Depositor and the Securitization Issuer, as well as our other subsidiaries, in our consolidated financial statements. Because each of the Trust Depositor and the Securitization Issuer is disregarded as an entity separate from its owner for U.S. federal income tax purposes, the sale or contribution by us to the Trust Depositor, and by the Trust Depositor to the Securitization Issuer, did not constitute a taxable event for U.S. federal income tax purposes. If the U.S. Internal Revenue Service were to take a contrary position, there could be a material adverse effect on our business, financial condition, results of operations or cash flows. Further, a failure of the Securitization Issuer to be treated as a disregarded entity for U.S. federal income tax purposes would constitute an event of default pursuant to the indenture under the Debt Securitization, upon which the trustee under the Debt Securitization (the “Trustee”) may and will at the direction of a supermajority of the holders of the Asset-Backed Notes (the “Noteholders”) declare the Asset-Backed Notes to be immediately due and payable and exercise remedies under the indenture, including (i) to institute proceedings for the collection of all amounts then payable on the Asset-Backed Notes or under the indenture, enforce any judgment obtained, and collect from the Securitization Issuer and any other obligor upon the Asset-Backed Notes monies adjudged due; (ii) institute proceedings from time to time for the complete or partial foreclosure of the indenture with respect to the property of the Securitization Issuer; (iii) exercise any remedies as a secured party under the relevant UCC and take other appropriate action under applicable law to protect and enforce the rights and remedies of the Trustee and the Noteholders; or (iv) sell the property of the Securitization Issuer or any portion thereof or rights or interest therein at one or more public or private sales called and conducted in any matter permitted by law. Any such exercise of remedies could have a material adverse effect on our business, financial condition, results of operations or cash flows.
An event of default in connection with the Debt Securitization could give rise to a cross-default under our other material indebtedness.
The documents governing our other material indebtedness contain customary cross-default provisions that could be triggered if an event of default occurs in connection with the Debt Securitization. An event of default with respect to our other indebtedness could lead to the acceleration of such indebtedness and the exercise of other remedies as provided in the documents governing such other indebtedness. This could have a material adverse effect on our business, financial condition, results of operations and cash flows and may result in our inability to make distributions sufficient to maintain our status as a RIC.
We may not receive cash distributions in respect of our indirect ownership interest in the Securitization Issuer.
Apart from fees payable to us in connection with our role as servicer of the Loans and the reimbursement of related amounts under the Debt Securitization documents, we receive cash in connection with the Debt Securitization only to the extent that the Trust Depositor receives payments in respect of its equity interest in the Securitization Issuer. The holder of the equity interest in the Securitization Issuer is the residual claimant on distributions, if any, made by the Securitization Issuer after the Noteholders and other claimants have been paid in full on each payment date or upon maturity of the notes, subject to the priority of payments under the Debt Securitization documents. To the extent that the value of the Securitization Issuer’s portfolio of Loans is reduced as a result of conditions in the credit markets (relevant in the event of a liquidation event), other macroeconomic factors, distressed or defaulted Loans or the failure of individual portfolio companies to otherwise meet their obligations in respect of the Loans, or for any other reason, the ability of the Securitization Issuer to make cash distributions in respect of the Trust Depositor’s equity interest would be negatively affected and consequently, the value of the equity interest in the Securitization Issuer would also be reduced. In the event that we fail to receive cash indirectly from the Securitization Issuer, we could be unable to make distributions, if at all, in amounts sufficient to maintain our status as a RIC.
30
Table of Contents
The interests of the Noteholders may not be aligned with our interests.
The Asset-Backed Notes are debt obligations ranking senior in right of payment to the rights of the holder of the equity interest in the Securitization Issuer, as residual claimant in respect of distributions, if any, made by the Securitization Issuer. As such, there are circumstances in which the interests of the Noteholders may not be aligned with the interests of holders of the equity interest in the Securitization Issuer. For example, under the terms of the documents governing the Debt Securitization, the Noteholders have the right to receive payments of principal and interest prior to holders of the equity interest.
For as long as the Asset-Backed Notes remain outstanding, the Noteholders have the right to act in certain circumstances with respect to the Loans in ways that may benefit their interests but not the interests of holder of the equity interest in the Securitization Issuer, including by exercising remedies under the documents governing the Debt Securitization.
If an event of default occurs, the Noteholders will be entitled to determine the remedies to be exercised, subject to the terms of the documents governing the Debt Securitization. For example, upon the occurrence of an event of default with respect to the Asset-Backed Notes, the Trustee may and will at the direction of the holders of a supermajority of the Asset-Backed Notes declare the principal, together with any accrued interest, of the notes to be immediately due and payable. This would have the effect of accelerating the principal on such notes, triggering a repayment obligation on the part of the Securitization Issuer. The Asset-Backed Notes then outstanding will be paid in full before any further payment or distribution on the equity interest is made. There can be no assurance that there will be sufficient funds through collections on the Loans or through the proceeds of the sale of the Loans in the event of a bankruptcy or insolvency to repay in full the obligations under the Asset-Backed Notes, or to make any distribution to holder of the equity interest in the Securitization Issuer.
Remedies pursued by the Noteholders could be adverse to our interests as the indirect holder of the equity interest in the Securitization Issuer. The Noteholders have no obligation to consider any possible adverse effect on such other interests. Thus, there can be no assurance that any remedies pursued by the Noteholders will be consistent with the best interests of the Trust Depositor or that we will receive, indirectly through the Trust Depositor, any payments or distributions upon an acceleration of the Asset-Backed Notes. Any failure of the Securitization Issuer to make distributions in respect of the equity interest that we indirectly hold, whether as a result of an event of default and the acceleration of payments on the Asset-Backed Notes or otherwise, could have a material adverse effect on our business, financial condition, results of operations and cash flows and may result in our inability to make distributions sufficient to maintain our status as a RIC.
Certain events related to the performance of Loans could lead to the acceleration of principal payments on the Asset-Backed Notes.
The following constitute rapid amortization events (“Rapid Amortization Events”) under the documents governing the Debt Securitization: (i) the aggregate outstanding principal balance of delinquent Loans and restructured Loans that would have been delinquent Loans had such Loans not become restructured Loans exceeds 10% of the current aggregate outstanding principal balance of the Loans, excluding all defaulted Loans and all purchased Loans (the “Pool Balance”) for a period of three consecutive months; (ii) the aggregate outstanding principal balance of defaulted Loans exceeds 5% of the initial Pool Balance determined as of December 19, 2012 for a period of three consecutive months; (iii) the aggregate outstanding principal balance of the Asset-Backed Notes exceeds the borrowing base for a period of three consecutive months; (iv) the Securitization Issuer’s pool of Loans contains Loans to ten or fewer obligors; and (v) the occurrence of an event of default under the documents governing the Debt Securitization. After a Rapid Amortization Event has occurred, subject to the priority of payments under the documents governing the Debt Securitization, principal collections on the Loans will be used to make accelerated payments of principal on the Asset-Backed Notes until the payment of principal balance of the Asset-Backed Loans is reduced to zero. Such an event could delay, reduce or eliminate the ability of the Securitization Issuer to make distributions in respect of the equity interest
31
Table of Contents
that we indirectly hold, which could have a material adverse effect on our business, financial condition, results of operations and cash flows and may result in our inability to make distributions sufficient to maintain our status as a RIC.
We have certain repurchase obligations with respect to the Loans transferred in connection with the Debt Securitization.
As part of the Debt Securitization, we entered into a sale and contribution agreement and a sale and servicing agreement under which we would be required to repurchase any Loan (or participation interest therein) which was sold to the Securitization Issuer in breach of certain customary representations and warranty made by us or by the Trust Depositor with respect to such Loan or the legal structure of the Debt Securitization. To the extent that such there is a breach of such representations and warranties and we fail to satisfy any such repurchase obligation, the Trustee may, on behalf of the Securitization Issuer, bring an action against us to enforce these repurchase obligations.
Because most of our investments typically are not in publicly-traded securities, there is uncertainty regarding the value of our investments, which could adversely affect the determination of our net asset value.
At December 31, 2012, portfolio investments, which are valued at fair value by the Board of Directors, were approximately 80.7% of our total assets. We expect our investments to continue to consist primarily of securities issued by privately-held companies, the fair value of which is not readily determinable. In addition, we are not permitted to maintain a general reserve for anticipated loan losses. Instead, we are required by the 1940 Act to specifically value each investment and record an unrealized gain or loss for any asset that we believe has increased or decreased in value.
There is no single standard for determining fair value in good faith. We value these securities at fair value as determined in good faith by our Board of Directors, based on the recommendations of our Valuation Committee. In making a good faith determination of the value of these securities, we generally start with the cost basis of each security, which includes the amortized OID and PIK interest, if any. The Valuation Committee uses its best judgment in arriving at the fair value of these securities. As a result, determining fair value requires that judgment be applied to the specific facts and circumstances of each portfolio investment while applying a valuation process for the types of investments we make, which includes but is not limited to deriving a hypothetical exit price. However, the Board of Directors retains ultimate authority as to the appropriate valuation of each investment. Because such valuations are inherently uncertain and may be based on estimates, our determinations of fair value may differ materially from the values that would be assessed if a ready market for these securities existed. We adjust quarterly the valuation of our portfolio to reflect the Board of Directors’ determination of the fair value of each investment in our portfolio. Any changes in fair value are recorded in our statement of operations as net change in unrealized appreciation or depreciation. Our net asset value could be adversely affected if our determinations regarding the fair value of our investments were materially higher than the values that we ultimately realize upon the disposal of such securities.
Our equity ownership in a portfolio company may represent a control investment. Our ability to exit an investment in a timely manner because we are in a control position or have access to inside information in the portfolio company could result in a realized loss on the investment.
If we obtain a control investment in a portfolio company our ability to divest ourselves from a debt or equity investment could be restricted due to illiquidity in a private stock, limited trading volume on a public company’s stock, inside information on a company’s performance, insider blackout periods, or other factors that could prohibit us from disposing of the investment as we would if it were not a control investment. Additionally, we may choose not to take certain actions to protect a debt investment in a control investment portfolio company. As a result, we could experience a decrease in the value of our portfolio company holdings and potentially incur a realized loss on the investment.
32
Table of Contents
Regulations governing our operations as a business development company may affect our ability to, and the manner in which, we raise additional capital, which may expose us to risks.
Our business will require a substantial amount of capital. We may acquire additional capital from the issuance of senior securities, including borrowings, securitization transactions or other indebtedness, or the issuance of additional shares of our common stock. However, we may not be able to raise additional capital in the future on favorable terms or at all. We may issue debt securities, other evidences of indebtedness or preferred stock, and we may borrow money from banks or other financial institutions, which we refer to collectively as “senior securities,” up to the maximum amount permitted by the 1940 Act. Under the 1940 Act, we are not permitted to incur indebtedness unless immediately after such borrowing we have an asset coverage for total borrowings of at least 200% (i.e., the amount of debt may not exceed 50% of the value of our assets). In addition, we may not be permitted to declare any cash dividend or other distribution on our outstanding common shares, or purchase any such shares, unless, at the time of such declaration or purchase, we have an asset coverage of at least 200% after deducting the amount of such dividend, distribution, or purchase price. Our ability to pay dividends or issue additional senior securities would be restricted if our asset coverage ratio were not at least 200%. If the value of our assets declines, we may be unable to satisfy this test. If that happens, we may be required to liquidate a portion of our investments and repay a portion of our indebtedness at a time when such sales may be disadvantageous. As a result of issuing senior securities, we would also be exposed to typical risks associated with leverage, including an increased risk of loss. If we issue preferred stock, the preferred stock would rank “senior” to common stock in our capital structure, preferred stockholders would have separate voting rights and might have rights, preferences, or privileges more favorable than those of our common stockholders and the issuance of preferred stock could have the effect of delaying, deferring, or preventing a transaction or a change of control that might involve a premium price for holders of our common stock or otherwise be in your best interest.
To the extent that we are constrained in our ability to issue debt or other senior securities, we will depend on issuances of common stock to finance operations. Other than in certain limited situations such as rights offerings, as a business development company, we are generally not able to issue our common stock at a price below net asset value without first obtaining required approvals from our stockholders and our independent directors. If we raise additional funds by issuing more common stock or senior securities convertible into, or exchangeable for, our common stock, then the percentage ownership of our stockholders at that time will decrease, and you might experience dilution. Moreover, we can offer no assurance that we will be able to issue and sell additional equity securities in the future, on favorable terms or at all.
When we are a debt or minority equity investor in a portfolio company, we may not be in a position to control the entity, and management of the company may make decisions that could decrease the value of our portfolio holdings.
We make both debt and minority equity investments; therefore, we are subject to the risk that a portfolio company may make business decisions with which we disagree, and the stockholders and management of such company may take risks or otherwise act in ways that do not serve our interests. As a result, a portfolio company may make decisions that could decrease the value of our portfolio holdings.
If we do not invest a sufficient portion of our assets in qualifying assets, we could fail to qualify as a business development company or be precluded from investing according to our current business strategy.
As a business development company, we may not acquire any assets other than “qualifying assets” unless, at the time of and after giving effect to such acquisition, at least 70% of our total assets are qualifying assets. See “Item 1. Business—Regulation.”
We believe that most of the senior loans we make will constitute qualifying assets. However, we may be precluded from investing in what we believe are attractive investments if such investments are not qualifying assets for purposes of the 1940 Act. If we do not invest a sufficient portion of our assets in qualifying assets, we
33
Table of Contents
could lose our status as a business development company, which would have a material adverse effect on our business, financial condition and results of operations. Similarly, these rules could prevent us from making follow-on investments in existing portfolio companies (which could result in the dilution of our position) or could require us to dispose of investments at inappropriate times in order to comply with the 1940 Act. If we need to dispose of such investments quickly, it would be difficult to dispose of such investments on favorable terms. For example, we may have difficulty in finding a buyer and, even if we do find a buyer, we may have to sell the investments at a substantial loss.
A failure on our part to maintain our qualification as a business development company would significantly reduce our operating flexibility.
If we fail to continuously qualify as a business development company, we might be subject to regulation as a registered closed-end investment company under the 1940 Act, which would significantly decrease our operating flexibility. In addition, failure to comply with the requirements imposed on business development companies by the 1940 Act could cause the SEC to bring an enforcement action against us. For additional information on the qualification requirements of a business development company, see “Item 1. Business— Regulation.”
To the extent original issue discount and paid-in-kind interest constitute a portion of our income, we will be exposed to typical risks associated with such income being required to be included in taxable and accounting income prior to receipt of cash representing such income.
Our investments may include original issue discount, or OID, instruments and contractual payment-in-kind, or PIK, interest, which represents contractual interest added to a loan balance and due at the end of such loan’s
term. To the extent OID or PIK interest constitute a portion of our income, we are exposed to typical risks associated with such income being required to be included in taxable and accounting income prior to receipt of cash, including the following:
| • | OID instruments may have higher yields, which reflect the payment deferral and credit risk associated with these instruments. |
| • | OID and PIK instruments may have unreliable valuations because their continuing accruals require continuing judgments about the collectability of the deferred payments and the value of the collateral; and |
| • | OID and PIK instruments may represent a higher credit risk than coupon loans. |
If we are unable to satisfy Code requirements for qualification as a RIC, then we will be subject to corporate-level income tax, which would adversely affect our results of operations and financial condition.
We elected to be treated as a RIC for federal income tax purposes with the filing of our federal corporate income tax return for 2006. We will not qualify for the tax treatment allowable to RICs if we are unable to comply with the source of income, asset diversification and distribution requirements contained in Subchapter M of the Code, or if we fail to maintain our election to be regulated as a business development company under the 1940 Act. If we fail to qualify for the federal income tax benefits allowable to RICs for any reason and become subject to a corporate-level income tax, the resulting taxes could substantially reduce our net assets, the amount of income available for distribution to our stockholders and the actual amount of our distributions. Such a failure would have a material adverse effect on us, the net asset value of our common stock and the total return, if any, obtainable from your investment in our common stock. Any net operating losses that we incur in periods during which we qualify as a RIC will not offset net capital gains (i.e., net realized long-term capital gains in excess of net realized short-term capital losses) that we are otherwise required to distribute, and we cannot pass such net operating losses through to our stockholders. In addition, net operating losses that we carry over to a taxable year in which we qualify as a RIC normally cannot offset ordinary income or capital gains.
34
Table of Contents
We may have difficulty paying our required distributions under applicable tax rules if we recognize income before or without receiving cash representing such income.
In accordance with generally accepted accounting principles and U.S. federal tax requirements, we include in income certain amounts that we have not yet received in cash, such as contractual PIK interest, which represents contractual interest added to a loan balance and due at the end of such loan’s term. In addition to the cash yields received on our loans, in some instances, certain loans may also include any of the following: end-of-term payments, exit fees, balloon payment fees or prepayment fees. The increases in loan balances as a result of contractual PIK arrangements are included in income for the period in which such payment-in-kind interest was accrued, which is often in advance of receiving cash payment, and are separately identified on our statements of cash flows. We also may be required to include in income certain other amounts prior to receiving the related cash.
Any warrants that we receive in connection with our debt investments will generally be valued as part of the negotiation process with the particular portfolio company. As a result, a portion of the aggregate purchase price for the debt investments and warrants will be allocated to the warrants that we receive. This will generally result in “original issue discount” for tax purposes, which we must recognize as ordinary income, increasing the amount that we are required to distribute to qualify for the federal income tax benefits applicable to RICs. Because these warrants generally will not produce distributable cash for us at the same time as we are required to make distributions in respect of the related original issue discount, we would need to obtain cash from other sources or to pay a portion of our distributions using shares of newly issued common stock, consistent with Internal Revenue Service requirements, to satisfy such distribution requirements.
Other features of the debt instruments that we hold may also cause such instruments to generate an original issue discount, resulting in a dividend distribution requirement in excess of current cash interest received. Since in certain cases we may recognize income before or without receiving cash representing such income, we may have difficulty meeting the RIC tax requirement to distribute generally an amount equal to at least 90% of our net ordinary income and realized net short-term capital gains in excess of realized net long-term capital losses, if any. Under such circumstances, we may have to sell some of our assets, raise additional debt or equity capital or reduce new investment originations to meet these distribution requirements. If we are unable to obtain cash from other sources and are otherwise unable to satisfy such distribution requirements, we may fail to qualify for the federal income tax benefits allowable to RICs and, thus, become subject to a corporate-level income tax on all our income. See “Item 1. Business—Certain United States Federal Income Tax Considerations.”
There is a risk that you may not receive distributions or that our distributions may not grow over time.
We intend to make distributions on a quarterly basis to our stockholders. We cannot assure you that we will achieve investment results, or our business may not perform in a manner that will allow us to make a specified level of distributions or year-to-year increases in cash distributions. In addition, due to the asset coverage test applicable to us as a business development company, we may be limited in our ability to make distributions. Also, our Credit Facilities limit our ability to declare dividends if we default under certain provisions.
We have and may in the future choose to pay dividends in our own stock, in which case you may be required to pay tax in excess of the cash you receive.
Under applicable Treasury regulations and certain private rulings issued by the Internal Revenue Service, RICs are permitted to treat certain distributions payable in up to 80% in their stock, as taxable dividends that will satisfy their annual distribution obligations for federal income tax and excise tax purposes provided that shareholders have the opportunity to elect to receive the distribution in cash. Taxable stockholders receiving such dividends will be required to include the full amount of the dividend as ordinary income (or as long-term capital gain to the extent such distribution is properly designated as a capital gain dividend) to the extent of our current and accumulated earnings and profits for United States federal income tax purposes. As a result, a U.S. stockholder may be required to pay tax with respect to such dividends in excess of any cash received. If a U.S.
35
Table of Contents
stockholder sells the stock it receives as a dividend in order to pay this tax, the sales proceeds may be less than the amount included in income with respect to the dividend, depending on the market price of our stock at the time of the sale. Furthermore, with respect to non-U.S. stockholders, we may be required to withhold U.S. tax with respect to such dividends, including in respect of all or a portion of such dividend that is payable in stock. In addition, if a significant number of our stockholders determine to sell shares of our stock in order to pay taxes owed on dividends, then such sales may put downward pressure on the trading price of our stock. We may in the future determine to distribute taxable dividends that are payable in part in our common stock.
If we are unable to manage our future growth effectively, we may be unable to achieve our investment objective, which could adversely affect our financial condition and results of operations and cause the value of your investment to decline.
Our ability to achieve our investment objective will depend on our ability to sustain growth. Sustaining growth will depend, in turn, on our senior management team’s ability to identify, evaluate, finance and invest in suitable companies that meet our investment criteria. Accomplishing this result on a cost-effective basis is largely a function of our marketing capabilities, our management of the investment process, our ability to provide efficient services and our access to financing sources on acceptable terms. Failure to manage our future growth effectively could have a material adverse effect on our business, financial condition and results of operations.
Our quarterly and annual operating results are subject to fluctuation as a result of the nature of our business, and if we fail to achieve our investment objective, the net asset value of our common stock may decline.
We could experience fluctuations in our quarterly and annual operating results due to a number of factors, some of which are beyond our control, including, but not limited to, the interest rate payable on the debt securities that we acquire, the default rate on such securities, the level of our expenses, variations in and the timing of the recognition of realized and unrealized gains or losses, changes in our portfolio composition, the degree to which we encounter competition in our markets, market volatility in our publicly traded securities and the securities of our portfolio companies, and general economic conditions. As a result of these factors, results for any period should not be relied upon as being indicative of performance in future periods. In addition, any of these factors could negatively impact our ability to achieve our investment objectives, which may cause our net asset value of our common stock to decline.
We are exposed to risks associated with changes in interest rates, including fluctuations in interest rates which could adversely affect our profitability
General interest rate fluctuations may have a substantial negative impact on our investments and investment opportunities, and, accordingly, may have a material adverse effect on our investment objective and rate of return on investment capital. A portion of our income will depend upon the difference between the rate at which we borrow funds and the interest rate on the debt securities in which we invest. Because we will borrow money to make investments and may issue debt securities, preferred stock or other securities, our net investment income is dependent upon the difference between the rate at which we borrow funds or pay interest or dividends on such debt securities, preferred stock or other securities and the rate at which we invest these funds. Typically, we anticipate that our interest-earning investments will accrue and pay interest at both variable and fixed rates, and that our interest-bearing liabilities will accrue interest at variable rates. As a result, there can be no assurance that a significant change in market interest rates will not have a material adverse effect on our net investment income. We anticipate using a combination of equity and long-term and short-term borrowings to finance our investment activities.
A significant increase in market interest rates could harm our ability to attract new portfolio companies and originate new loans and investments. We expect that most of our current initial investments in debt securities will be at floating rate with a floor. However, in the event that we make investments in debt securities at variable rates, a significant increase in market interest rates could also result in an increase in our non-performing assets
36
Table of Contents
and a decrease in the value of our portfolio because our floating-rate loan portfolio companies may be unable to meet higher payment obligations. In periods of rising interest rates, our cost of funds would increase, resulting in a decrease in our net investment income. In addition, a decrease in interest rates may reduce net income, because new investments may be made at lower rates despite the increased demand for our capital that the decrease in interest rates may produce. We may, but will not be required to, hedge against the risk of adverse movement in interest rates in our short-term and long-term borrowings relative to our portfolio of assets. If we engage in hedging activities, it may limit our ability to participate in the benefits of lower interest rates with respect to the hedged portfolio. Adverse developments resulting from changes in interest rates or hedging transactions could have a material adverse effect on our business, financial condition, and results of operations.
Our realized gains are reduced by amounts paid pursuant to the warrant participation agreement.
Citigroup, a former credit facility provider to Hercules, has an equity participation right through a warrant participation agreement on the pool of loans and certain warrants formerly collateralized under its then existing credit facility (the “Citigroup Facility”). Pursuant to the warrant participation agreement, we granted to Citigroup a 10% participation in all warrants held as collateral. As a result, Citigroup is entitled to 10% of the realized gains on certain warrants until the realized gains paid to Citigroup pursuant to the agreement equals $3,750,000 (the “Maximum Participation Limit”). The obligations under the warrant participation agreement continue even after the Citigroup Facility is terminated until the Maximum Participation Limit has been reached.
During the year ended December 31, 2012, we reduced our realized gain by approximately $270,000 for Citigroup’s participation in the gain on sale of equity securities and recorded a decrease on participation liability and increased our unrealized gains by a net amount of approximately $386,000 for Citigroup’s participation. The value of their participation right on unrealized gains in the related equity investments was approximately $313,000 as of December 31, 2012 and is included in accrued liabilities. There can be no assurances that the unrealized appreciation of the warrants will not be higher or lower in future periods due to fluctuations in the value of the warrants, thereby increasing or reducing the effect on the cost of borrowing. Since inception of the agreement, we have paid Citigroup approximately $1.4 million under the warrant participation agreement thereby reducing our realized gains by this amount. We will continue to pay Citigroup under the warrant participation agreement until the Maximum Participation Limit is reached or the warrants expire. Warrants subject to the Citigroup participation agreement are set to expire between January 2013 and January 2017.
Pending legislation may allow us to incur additional leverage.
As a business development company, under the 1940 Act generally we are not permitted to incur indebtedness unless immediately after such borrowing we have an asset coverage for total borrowings of at least 200% (i.e., the amount of debt may not exceed 50% of the value of our assets). Recent legislation introduced in the U.S. House of Representatives, if passed, would modify this section of the 1940 Act and increase the amount of debt that business development companies may incur by modifying the percentage from 200% to 150%. As a result, we may be able to incur additional indebtedness in the future and therefore your risk of an investment in us may increase.
Two of our wholly-owned subsidiaries are licensed by the U.S. Small Business Administration, and as a result, we will be subject to SBA regulations.
Our wholly-owned subsidiaries HT II and HT III are licensed to act as SBICs and are regulated by the SBA. As of December 31, 2012, HT II’s and HT III’s portfolio companies accounted for approximately 14.6% and 24.7%, respectively, of our total portfolio. The SBIC licenses allow our SBIC subsidiaries to obtain leverage by issuing SBA-guaranteed debentures, subject to the issuance of a capital commitment by the SBA and other customary procedures. The SBA regulations require, among other things, that a licensed SBIC be examined periodically and audited by an independent auditor to determine the SBIC’s compliance with the relevant SBA regulations.
37
Table of Contents
Under current SBA regulations, a licensed SBIC can provide capital to those entities that have a tangible net worth not exceeding $18.0 million and an average annual net income after Federal income taxes not exceeding $6.0 million for the two most recent fiscal years. In addition, a licensed SBIC must devote 25.0% of its investment activity to those entities that have a tangible net worth not exceeding $6.0 million and an average annual net income after Federal income taxes not exceeding $2.0 million for the two most recent fiscal years. The SBA regulations also provide alternative size standard criteria to determine eligibility, which depend on the industry in which the business is engaged and are based on factors such as the number of employees and gross sales. The SBA regulations permit licensed SBICs to make long term loans to small businesses, invest in the equity securities of such businesses and provide them with consulting and advisory services. The SBA also places certain limitations on the financing terms of investments by SBICs in portfolio companies and prohibits SBICs from providing funds for certain purposes or to businesses in a few prohibited industries. Compliance with SBA requirements may cause HT II and HT III to forego attractive investment opportunities that are not permitted under SBA regulations.
Further, the SBA regulations require that a licensed SBIC be periodically examined and audited by the SBA to determine its compliance with the relevant SBA regulations. The SBA prohibits, without prior SBA approval, a “change of control” of an SBIC or transfers that would result in any person (or a group of persons acting in concert) owning 10.0% or more of a class of capital stock of a licensed SBIC. If either HT II or HT III fail to comply with applicable SBA regulations, the SBA could, depending on the severity of the violation, limit or prohibit HT II’s or HT III’s use of debentures, declare outstanding debentures immediately due and payable, and/ or limit HT II or HT III from making new investments. Such actions by the SBA would, in turn, negatively affect us because HT II and HT III are our wholly owned subsidiaries. HT II and HT III were in compliance with the terms of the SBIC’s leverage as of December 31, 2012 as a result of having sufficient capital as defined under the SBA regulations. See “Item 1. Business—Regulation—Small Business Administration Regulations.”
SBA regulations limit the outstanding dollar amount of SBA guaranteed debentures that may be issued by an SBIC or group of SBICs under common control.
The SBA regulations currently limit the dollar amount of SBA-guaranteed debentures that can be issued by any one SBIC to $150.0 million or to a group of SBICs under common control to $225.0 million. Moreover, an SBIC may not borrow an amount in excess of two times (and in certain cases, up to three times) its regulatory capital. As of December 31, 2012, we have issued $225.0 million in SBA-guaranteed debentures in our SBIC Subsidiaries, which is the maximum allowed for a group of SBICs under common control. During times that we reach the maximum dollar amount of SBA-guaranteed debentures permitted, and if we require additional capital, our cost of capital is likely to increase, and there is no assurance that we will be able to obtain additional financing on acceptable terms.
Moreover, the current status of our SBIC subsidiaries as SBICs does not automatically assure that our SBIC subsidiaries will continue to receive SBA-guaranteed debenture funding. Receipt of SBA leverage funding is dependent upon our SBIC subsidiaries continuing to be in compliance with SBA regulations and policies and available SBA funding. The amount of SBA leverage funding available to SBICs is dependent upon annual Congressional authorizations and in the future may be subject to annual Congressional appropriations. There can be no assurance that there will be sufficient debenture funding available at the times desired by our SBIC subsidiaries.
The debentures guaranteed by the SBA have a maturity of ten years and require semi-annual payments of interest. Our SBIC subsidiaries will need to generate sufficient cash flow to make required interest payments on the debentures. If our SBIC subsidiaries are unable to meet their financial obligations under the debentures, the SBA, as a creditor, will have a superior claim to our SBIC subsidiaries’ assets over our stockholders in the event we liquidate our SBIC subsidiaries or the SBA exercises its remedies under such debentures as the result of a default by us.
38
Table of Contents
Our wholly-owned SBIC subsidiaries may be unable to make distributions to us that will enable us to meet or maintain RIC status, which could result in the imposition of an entity-level tax.
In order for us to continue to qualify for RIC tax treatment and to minimize corporate-level taxes, we will be required to distribute substantially all of our net ordinary income and net capital gain income, including income from certain of our subsidiaries, which includes the income from our SBIC subsidiaries. We will be partially dependent on our SBIC subsidiaries for cash distributions to enable us to meet the RIC distribution requirements. Our SBIC subsidiaries may be limited by the Small Business Investment Act of 1958, and SBA regulations governing SBICs, from making certain distributions to us that may be necessary to maintain our status as a RIC. We may have to request a waiver of the SBA’s restrictions for our SBIC subsidiaries to make certain distributions to maintain our RIC status. We cannot assure you that the SBA will grant such waiver. If our SBIC subsidiaries are unable to obtain a waiver, compliance with the SBA regulations may result in loss of RIC tax treatment and a consequent imposition of an entity-level tax on us. See “Items 1. Business—Regulation—Small Business Administration Regulations.”
Changes in laws or regulations governing our business could negatively affect the profitability of our operations.
Changes in the laws or regulations, or the interpretations of the laws and regulations, which govern business development companies, SBICs, RICs or non-depository commercial lenders could significantly affect our operations and our cost of doing business. We are subject to federal, state and local laws and regulations and are subject to judicial and administrative decisions that affect our operations, including our loan originations maximum interest rates, fees and other charges, disclosures to portfolio companies, the terms of secured transactions, collection and foreclosure procedures, and other trade practices. If these laws, regulations or decisions change, or if we expand our business into jurisdictions that have adopted more stringent requirements than those in which we currently conduct business, then we may have to incur significant expenses in order to comply or we may have to restrict our operations. In addition, if we do not comply with applicable laws, regulations and decisions, then we may lose licenses needed for the conduct of our business and be subject to civil fines and criminal penalties, any of which could have a material adverse effect upon our business results of operations or financial condition.
Our business is subject to increasingly complex corporate governance, public disclosure and accounting requirements that could adversely affect our business and financial results.
We are subject to changing rules and regulations of federal and state government as well as the stock exchange on which our common stock is listed. These entities, including the Public Company Accounting Oversight Board, the SEC and the New York Stock Exchange, or NYSE, have issued a significant number of new and increasingly complex requirements and regulations over the course of the last several years and continue to develop additional regulations and requirements in response to laws enacted by Congress. On July 21, 2010, the Dodd-Frank Wall Street Reform and Protection Act, or the Dodd-Frank Act, was enacted. There are significant corporate governance and executive compensation-related provisions in the Dodd-Frank Act, and the SEC has adopted additional rules and regulations that may impact us. Our efforts to comply with these requirements have resulted in, and are likely to continue to result in, an increase in expenses and a diversion of management’s time from other business activities.
Results may fluctuate and may not be indicative of future performance.
Our operating results may fluctuate and, therefore, you should not rely on current or historical period results to be indicative of our performance in future reporting periods. Factors that could cause operating results to fluctuate include, but are not limited to, variations in the investment origination volume and fee income earned, changes in the accrual status of our debt investments, variations in timing of prepayments, variations in and the timing of the recognition of net realized gains or losses and changes in unrealized appreciation or depreciation, the level of our expenses, the degree to which we encounter competition in our markets, and general economic conditions.
39
Table of Contents
Risks Related to Current Economic and Market Conditions
Capital markets may experience periods of disruption and instability and we cannot predict when these conditions will occur. Such market conditions could materially and adversely affect debt and equity capital markets in the United States and abroad, which could have a negative impact on our business, financial condition and results of operations.
The global capital markets have experienced a period of disruption as evidenced by a lack of liquidity in the debt capital markets, write-offs in the financial services sector, the re-pricing of credit risk and the failure of certain major financial institutions. Despite actions of the United States federal government and foreign governments, these events contributed to worsening general economic conditions that have materially and adversely impacted the broader financial and credit markets and reduced the availability of debt and equity capital for the market as a whole and financial services firms in particular. While indicators suggest improvement in the capital markets, these conditions could deteriorate in the future. During such market disruptions, we may have difficulty raising debt or equity capital especially as a result of regulatory constraints.
Market conditions may in the future make it difficult to extend the maturity of or refinance our existing indebtedness and any failure to do so could have a material adverse effect on our business. The illiquidity of our investments may make it difficult for us to sell such investments if required. As a result, we may realize significantly less than the value at which we have recorded our investments. In addition, significant changes in the capital markets, including the disruption and volatility, have had, and may in the future have, a negative effect on the valuations of our investments and on the potential for liquidity events involving our investments. An inability to raise capital, and any required sale of our investments for liquidity purposes, could have a material adverse impact on our business, financial condition and results of operations.
The current financial market situation, as well as various social and political tensions in the United States and around the world, particularly in the Middle East, may continue to contribute to increased market volatility, may have long-term effects on the United States and worldwide financial markets, and may cause further economic uncertainties or deterioration in the United States and worldwide. Since 2010, several European Union (“EU”) countries, including Greece, Ireland, Italy, Spain, and Portugal, have faced budget issues, some of which may have negative long-term effects for the economies of those countries and other EU countries. There is continued concern about national-level support for the euro and the accompanying coordination of fiscal and wage policy among European Economic and Monetary Union member countries. The recent United States and global economic downturn or a return to the recessionary period in the United States could adversely impact our investments. We do not know how long the financial markets will continue to be affected by these events and cannot predict the effects of these or similar events in the future on the United States economy and securities markets or on our investments. We monitor developments and seek to manage our investments in a manner consistent with achieving our investment objective, but there can be no assurance that it will be successful in doing so.
If we cannot obtain additional capital because of either regulatory or market price constraints, we could be forced to curtail or cease our new lending and investment activities, our net asset value could decrease and our level of distributions and liquidity could be affected adversely.
Our ability to secure additional financing and satisfy our financial obligations under indebtedness outstanding from time to time will depend upon our future operating performance, which is subject to the prevailing general economic and credit market conditions, including interest rate levels and the availability of credit generally, and financial, business and other factors, many of which are beyond our control. The prolonged continuation or worsening of current economic and capital market conditions could have a material adverse effect on our ability to secure financing on favorable terms, if at all.
If we are unable to obtain debt capital, then our equity investors will not benefit from the potential for increased returns on equity resulting from leverage to the extent that our investment strategy is successful and we may be limited in our ability to make new commitments or fundings to our portfolio companies.
40
Table of Contents
Depending on funding requirements, we may need to raise additional capital to meet our unfunded commitments either through equity offerings or through additional borrowings.
As of December 31, 2012, we had unfunded debt commitments of approximately $61.9 million. Since these commitments may expire without being drawn upon, the total commitment amount does not necessarily represent future cash requirements or future earning assets. Closed commitments generally fund 70-80% of the committed amount in aggregate over the life of the commitment. We intend to use cash flow from normal and early principal repayments, SBA debentures, our Credit Facilities and proceeds from the Convertible Senior Notes, 2019 Notes and the Asset-Backed Notes to fund these commitments. However, there can be no assurance that we will have sufficient capital available to fund these commitments as they come due.
Risks Related to Our Investments
Our investments are concentrated in certain industries and in a number of technology-related companies, which subjects us to the risk of significant loss if any of these companies default on their obligations under any of their debt securities that we hold, or if any of the technology-related industry sectors experience a downturn.
We have invested and intend to continue investing in a limited number of technology-related companies. A consequence of this limited number of investments is that the aggregate returns we realize may be significantly adversely affected if a small number of investments perform poorly or if we need to write down the value of any one investment. Beyond the asset diversification requirements to which we will be subject as a RIC, we do not have fixed guidelines for diversification or limitations on the size of our investments in any one portfolio company and our investments could be concentrated in relatively few issuers. In addition, we have invested in and intend to continue investing, under normal circumstances, at least 80% of the value of our total assets (including the amount of any borrowings for investment purposes) in technology-related companies.
As of December 31, 2012, approximately 65.8% of the fair value of our portfolio was composed of investments in five industries: 20.8% was composed of investments in the drug discovery and development industry, 15.0% was composed of investments in the internet consumer and business services industry, 14.0% was composed of investments in the clean technology industry, 8.2% was composed of investments in the drug delivery industry and 7.8% was composed of investments in the software industry. As a result, a downturn in technology-related industry sectors and particularly those in which we are heavily concentrated could materially adversely affect our financial condition.
Our financial results could be negatively affected if a significant portfolio investment fails to perform as expected.
Our total investment in companies may be significant individually or in the aggregate. As a result, if a significant investment in one or more companies fails to perform as expected, our financial results could be more negatively affected and the magnitude of the loss could be more significant than if we had made smaller investments in more companies. The following table shows the fair value of the totals of investments held in portfolio companies at December 31, 2012 that represent greater than 5% of net assets:
| December 31, 2012 | ||||||||
| (in thousands) |
Fair Value | Percentage of Net Assets |
||||||
| Box, Inc. |
$ | 47,941 | 9.3 | % | ||||
| Merrimack Pharmaceuticals, Inc. |
$ | 43,639 | 8.5 | % | ||||
| BrightSource Energy, Inc. |
$ | 35,118 | 6.8 | % | ||||
| Comverge, Inc. |
$ | 33,281 | 6.5 | % | ||||
| Jab Wireless, Inc. |
$ | 30,270 | 5.9 | % | ||||
| Aveo Pharmaceuticals, Inc. |
$ | 28,381 | 5.5 | % | ||||
| Education Dynamics, LLC |
$ | 26,976 | 5.2 | % | ||||
| Tectura Corporation |
$ | 25,960 | 5.0 | % | ||||
41
Table of Contents
Box, Inc. is an online storage and sharing service that gives users access to their files from anywhere.
Merrimack Pharmaceuticals, Inc. is a biopharmaceutical company discovering, developing and preparing to commercialize innovative medicines paired with companion diagnostics for the treatment of serious diseases, with an initial focus on cancer.
Brightsource Energy, Inc. designs, develops and sells solar thermal power systems that deliver reliable, clean energy to utilities and industrial companies.
Comverge, Inc. provides clean energy solutions.
Jab Wireless, Inc. is engaged in the acquisition and expansion of wireless broadband operators, bundled voice and data services.
Aveo Pharmaceuticals, Inc. is a biopharmaceutical company dedicated to the discovery and development of new, targeted cancer therapeutics.
Education Dynamics is a provider of high quality, student focused products and services.
Tectura Corporation is an IT services firm that specializes in Microsoft Business Solutions applications.
Our financial results could be materially adversely affected if these portfolio companies or any of our other significant portfolio companies encounter financial difficulty and fail to repay their obligations or to perform as expected.
Our investments may be in portfolio companies which may have limited operating histories and financial resources.
We expect that our portfolio will continue to consist of investments that may have relatively limited operating histories. These companies may be particularly vulnerable to U.S. and foreign economic downturns such as the current recession and European financial crisis may have more limited access to capital and higher funding costs, may have a weaker financial position and may need more capital to expand or compete. These businesses also may experience substantial variations in operating results. They may face intense competition, including from companies with greater financial, technical and marketing resources. Furthermore, some of these companies do business in regulated industries and could be affected by changes in government regulation. Accordingly, these factors could impair their cash flow or result in other events, such as bankruptcy, which could limit their ability to repay their obligations to us, and may adversely affect the return on, or the recovery of, our investment in these companies. We cannot assure you that any of our investments in our portfolio companies will be successful. Our portfolio companies compete with larger, more established companies with greater access to, and resources for, further development in these new technologies. We may lose our entire investment in any or all of our portfolio companies.
Our investment strategy focuses on technology-related companies, which are subject to many risks, including volatility, intense competition, shortened product life cycles, changes in regulatory and governmental programs and periodic downturns, and you could lose all or part of your investment.
We have invested and will continue investing primarily in technology-related companies, many of which may have narrow product lines and small market shares, which tend to render them more vulnerable to competitors’ actions and market conditions, as well as to general economic downturns. The revenues, income (or losses), and valuations of technology-related companies can and often do fluctuate suddenly and dramatically. In addition, technology-related markets are generally characterized by abrupt business cycles and intense competition. Overcapacity in technology-related industries, together with cyclical economic downturns, may result in substantial decreases in the market capitalization of many technology-related companies. While such valuations have recovered to some extent, such decreases in market capitalization may occur again, and any future decreases in technology-related company valuations may be substantial and may not be temporary in nature. Therefore, our portfolio companies may face considerably more risk of loss than do companies in other industry sectors.
42
Table of Contents
Because of rapid technological change, the average selling prices of products and some services provided by technology-related companies have historically decreased over their productive lives. As a result, the average selling prices of products and services offered by technology-related companies may decrease over time, which could adversely affect their operating results, their ability to meet obligations under their debt securities and the value of their equity securities. This could, in turn, materially adversely affect our business, financial condition and results of operations.
A natural disaster may also impact the operations of our portfolio companies, including our technology- related portfolio companies. The nature and level of natural disasters cannot be predicted and may be exacerbated by global climate change. A portion of our technology-related portfolio companies rely on items assembled or produced in areas susceptible to natural disasters, and may sell finished goods into markets susceptible to natural disasters. A major disaster, such as an earthquake, tsunami, flood or other catastrophic event could result in disruption to the business and operations of our technology-related portfolio companies.
We will invest in technology-related companies that are reliant on U.S. and foreign regulatory and governmental programs. Any material changes or discontinuation, due to change in administration or U.S. Congress or otherwise could have a material adverse affect on the operations of a portfolio company in these industries and, in turn, impair our ability to timely collect principal and interest payments owed to us to the extent applicable.
We have invested in and may continue investing in technology-related companies that do not have venture capital or private equity firms as equity investors, and these companies may entail a higher risk of loss than do companies with institutional equity investors, which could increase the risk of loss of your investment.
Our portfolio companies will often require substantial additional equity financing to satisfy their continuing working capital and other cash requirements and, in most instances, to service the interest and principal payments on our investment. Portfolio companies that do not have venture capital or private equity investors may be unable to raise any additional capital to satisfy their obligations or to raise sufficient additional capital to reach the next stage of development. Portfolio companies that do not have venture capital or private equity investors may be less financially sophisticated and may not have access to independent members to serve on their boards, which means that they may be less successful than portfolio companies sponsored by venture capital or private equity firms. Accordingly, financing these types of companies may entail a higher risk of loss than would financing companies that are sponsored by venture capital or private equity firms.
Our investments in the clean technology industry are subject to many risks, including volatility, intense competition, unproven technologies, periodic downturns and potential litigation.
Our investments in clean technology, or cleantech, companies are subject to substantial operational risks, such as underestimated cost projections, unanticipated operation and maintenance expenses, loss of government subsidies, and inability to deliver cost-effective alternative energy solutions compared to traditional energy products. In addition, energy companies employ a variety of means of increasing cash flow, including increasing utilization of existing facilities, expanding operations through new construction or acquisitions, or securing additional long-term contracts. Thus, some energy companies may be subject to construction risk, acquisition risk or other risks arising from their specific business strategies. Furthermore, production levels for solar, wind and other renewable energies may be dependent upon adequate sunlight, wind, or biogas production, which can vary from market to market and period to period, resulting in volatility in production levels and profitability. In addition, our cleantech companies may have narrow product lines and small market shares, which tend to render them more vulnerable to competitors’ actions and market conditions, as well as to general economic downturns. The revenues, income (or losses) and valuations of clean technology companies can and often do fluctuate suddenly and dramatically and the markets in which clean technology companies operate are generally characterized by abrupt business cycles and intense competition. Demand for cleantech and renewable energy is also influenced by the available supply and prices for other energy products, such as coal, oil and natural gases.
43
Table of Contents
A change in prices in these energy products could reduce demand for alternative energy. Our investments in cleantech companies also face potential litigation, including significant warranty and product liability claims, as well as class action and government claims arising from the increased attention to the industry from the failure of Solyndra. Such litigation could adversely affect the business and results of operations of our cleantech portfolio companies. There is also particular uncertainty about whether agreements providing incentives for reductions in greenhouse gas emissions, such as the Kyoto Protocol, will continue and whether countries around the world will enact or maintain legislation that provides incentives for reductions in greenhouse gas emissions, without which such investments in clean technology dependent portfolio companies may not be economical or financing for such projects may become unavailable. As a result, these portfolio company investments face considerable risk, including the risk that favorable regulatory regimes expire or are adversely modified. This could, in turn, materially adversely affect the value of the clean technology companies in our portfolio.
Cleantech companies are subject to extensive government regulation and certain other risks particular to the sectors in which they operate and our business and growth strategy could be adversely affected if government regulations, priorities and resources impacting such sectors change or if our portfolio companies fail to comply with such regulations.
As part of our investment strategy, we plan to invest in portfolio companies in Cleantech sectors that may be subject to extensive regulation by foreign, U.S. federal, state and/or local agencies. Changes in existing laws, rules or regulations, or judicial or administrative interpretations thereof, or new laws, rules or regulations could have an adverse impact on the business and industries of our portfolio companies. In addition, changes in government priorities or limitations on government resources could also adversely impact our portfolio companies. We are unable to predict whether any such changes in laws, rules or regulations will occur and, if they do occur, the impact of these changes on our portfolio companies and our investment returns. Furthermore, if any of our portfolio companies fail to comply with applicable regulations, they could be subject to significant penalties and claims that could materially and adversely affect their operations. Our portfolio companies may be subject to the expense, delay and uncertainty of the regulatory approval process for their products and, even if approved, these products may not be accepted in the marketplace.
In addition, there is considerable uncertainty about whether foreign, U.S., state and/or local governmental entities will enact or maintain legislation or regulatory programs that mandate reductions in greenhouse gas emissions or provide incentives for Cleantech companies. Without such regulatory policies, investments in Cleantech companies may not be economical and financing for Cleantech companies may become unavailable, which could materially adversely affect the ability of our portfolio companies to repay the debt they owe to us. Any of these factors could materially and adversely affect the operations and financial condition of a portfolio company and, in turn, the ability of the portfolio company to repay the debt they owe to us.
Our investments in the life science industry are subject to extensive government regulation, litigation risk and certain other risks particular to that industry.
We have invested and plan to continue investing in companies in the life science industry that are subject to extensive regulation by the Food and Drug Administration, or the FDA, and to a lesser extent, other federal, state and other foreign agencies. If any of these portfolio companies fail to comply with applicable regulations, they could be subject to significant penalties and claims that could materially and adversely affect their operations. Portfolio companies that produce medical devices or drugs are subject to the expense, delay and uncertainty of the regulatory approval process for their products and, even if approved, these products may not be accepted in the marketplace. In addition, governmental budgetary constraints effecting the regulatory approval process, new laws, regulations or judicial interpretations of existing laws and regulations might adversely affect a portfolio company in this industry. Portfolio companies in the life science industry may also have a limited number of suppliers of necessary components or a limited number of manufacturers for their products, and therefore face a risk of disruption to their manufacturing process if they are unable to find alternative suppliers when needed. Any of these factors could materially and adversely affect the operations of a portfolio company in this industry and, in turn, impair our ability to timely collect principal and interest payments owed to us.
44
Table of Contents
Our investments in the drug discovery industry are subject to numerous risks, including competition, extensive government regulation, product liability and commercial difficulties.
Our investments in the drug discovery industry are subject to numerous risks. The successful and timely implementation of the business model of our drug discovery portfolio companies depends on their ability to adapt to changing technologies and introduce new products. As competitors continue to introduce competitive products, the development and acquisition of innovative products and technologies that improve efficacy, safety, patient’s and clinician’s ease of use and cost-effectiveness are important to the success of such portfolio companies. The success of new product offerings will depend on many factors, including the ability to properly anticipate and satisfy customer needs, obtain regulatory approvals on a timely basis, develop and manufacture products in an economic and timely manner, obtain or maintain advantageous positions with respect to intellectual property, and differentiate products from those of competitors. Failure by our portfolio companies to introduce planned products or other new products or to introduce products on schedule could have a material adverse effect on our business, financial condition and results of operations.
Further, the development of products by drug discovery companies requires significant research and development, clinical trials and regulatory approvals. The results of product development efforts may be affected by a number of factors, including the ability to innovate, develop and manufacture new products, complete clinical trials, obtain regulatory approvals and reimbursement in the US and abroad, or gain and maintain market approval of products. In addition, regulatory review processes by U.S. and foreign agencies may extend longer than anticipated as a result of decreased funding and tighter fiscal budgets. Further, patents attained by others can preclude or delay the commercialization of a product. There can be no assurance that any products now in development will achieve technological feasibility, obtain regulatory approval, or gain market acceptance. Failure can occur at any point in the development process, including after significant funds have been invested. Products may fail to reach the market or may have only limited commercial success because of efficacy or safety concerns, failure to achieve positive clinical outcomes, inability to obtain necessary regulatory approvals, failure to achieve market adoption, limited scope of approved uses, excessive costs to manufacture, the failure to establish or maintain intellectual property rights, or the infringement of intellectual property rights of others.
Future legislation, and/or regulations and policies adopted by the FDA or other U.S. or foreign regulatory authorities may increase the time and cost required by some of our portfolio companies to conduct and complete clinical trials for the product candidates that they develop, and there is no assurance that these companies will obtain regulatory approval to market and commercialize their products in the U.S. and in foreign countries
The FDA has established regulations, guidelines and policies to govern the drug development and approval process, as have foreign regulatory authorities, which affect some of our portfolio companies. Any change in regulatory requirements due to the adoption by the FDA and/or foreign regulatory authorities of new legislation, regulations, or policies may require some of our portfolio companies to amend existing clinical trial protocols or add new clinical trials to comply with these changes. Such amendments to existing protocols and/or clinical trial applications or the need for new ones, may significantly impact the cost, timing and completion of the clinical trials.
In addition, increased scrutiny by the U.S. Congress of the FDA’s and other authorities approval processes may significantly delay or prevent regulatory approval, as well as impose more stringent product labeling and post-marketing testing and other requirements. Foreign regulatory authorities may also increase their scrutiny of approval processes resulting in similar delays. Increased scrutiny and approvals processes may limit the ability of our portfolio companies to market and commercialize their products in the U.S. and in foreign countries.
Changes in healthcare laws and other regulations applicable to some of our portfolio companies’ businesses may constrain their ability to offer their products and services.
Changes in healthcare or other laws and regulations applicable to the businesses of some of our portfolio companies may occur that could increase their compliance and other costs of doing business, require significant
45
Table of Contents
systems enhancements, or render their products or services less profitable or obsolete, any of which could have a material adverse effect on their results of operations. There has also been an increased political and regulatory focus on healthcare laws in recent years, and new legislation could have a material effect on the business and operations of some of our portfolio companies.
Price declines and illiquidity in the corporate debt markets could adversely affect the fair value of our portfolio investments, reducing our net asset value through increased net unrealized depreciation.
As a business development company, we are required to carry our investments at market value or, if no market value is ascertainable, at fair market value as determined in good faith by or under the direction of our board of directors. As part of the valuation process, we may take into account the following types of factors, if relevant, in determining the fair value of our investments: the enterprise value of a portfolio company (an estimate of the total fair value of the portfolio company’s debt and equity), the nature and realizable value of any collateral, the portfolio company’s ability to make payments and its earnings and discounted cash flow, the markets in which the portfolio company does business, a comparison of the portfolio company’s securities to similar publicly traded securities, changes in the interest rate environment and the credit markets generally that may affect the price at which similar investments may be made in the future and other relevant factors. When an external event such as a purchase transaction, public offering or subsequent equity sale occurs, we use the pricing indicated by the external event to corroborate our valuation. While most of our investments are not publicly traded, applicable accounting standards require us to assume as part of our valuation process that our investments are sold in a principal market to market participants (even if we plan on holding an investment through its maturity). As a result, volatility in the capital markets can also adversely affect our investment valuations. Decreases in the market values or fair values of our investments are recorded as unrealized depreciation. The effect of all of these factors on our portfolio can reduce our net asset value by increasing net unrealized depreciation in our portfolio.
Depending on market conditions, we could incur substantial realized losses and may suffer substantial unrealized depreciation in future periods, which could have a material adverse impact on our business, financial condition and results of operations.
Economic recessions or slowdowns could impair the ability of our portfolio companies to repay loans, which, in turn, could increase our non-performing assets, decrease the value of our portfolio, reduce our volume of new loans and have a material adverse effect on our results of operations.
Many of our portfolio companies may be susceptible to economic slowdowns or recessions in both the U.S. and foreign countries (including the economic downturn that began in 2007), and may be unable to repay our loans during such periods. Therefore, during such periods, our non-performing assets are likely to increase and the value of our portfolio is likely to decrease. Adverse economic conditions also may decrease the value of collateral securing some of our loans and the value of our equity investments. Economic slowdowns or recessions could lead to financial losses in our portfolio and a decrease in revenues, net income and assets. Unfavorable economic conditions also could increase our funding costs, limit our access to the capital markets or result in a decision by lenders not to extend credit to us. These events could prevent us from increasing investments and harm our operating results.
In particular, intellectual property owned or controlled by our portfolio companies may constitute an important portion of the value of the collateral of our loans to our portfolio companies. Adverse economic conditions may decrease the demand for our portfolio companies’ intellectual property and consequently its value in the event of a bankruptcy or required sale through a foreclosure proceeding. As a result, our ability to fully recover the amounts owed to us under the terms of the loans may be impaired by such events.
A portfolio company’s failure to satisfy financial or operating covenants imposed by us or other lenders could lead to defaults and, potentially, termination of the portfolio company’s loans and foreclosure on its secured assets, which could trigger cross-defaults under other agreements and jeopardize the portfolio company’s
46
Table of Contents
ability to meet its obligations under the debt securities that we hold. We may incur expenses to the extent necessary to seek recovery upon default or to negotiate new terms with a defaulting portfolio company. In addition, if a portfolio company goes bankrupt, even though we may have structured our investment as senior debt or secured debt, depending on the facts and circumstances, including the extent to which we actually provided significant “managerial assistance,” if any, to that portfolio company, a bankruptcy court might re-characterize our debt holding and subordinate all or a portion of our claim to that of other creditors. These events could materially adversely affect our financial condition and operating results.
Generally, we do not control our portfolio companies. These portfolio companies may face intense competition, including competition from companies with greater financial resources, more extensive research and development, manufacturing, marketing and service capabilities and greater number of qualified and experienced managerial and technical personnel. They may need additional financing which they are unable to secure and which we are unable or unwilling to provide, or they may be subject to adverse developments unrelated to the technologies they acquire.
The business, financial condition and results of operations of our portfolio companies could be adversely affected by worldwide economic conditions, as well as political and economic conditions in the countries in which they conduct business.
The business and operating results of our portfolio companies may be impacted by worldwide economic conditions. Although the U.S. economy has in recent quarters shown signs of recovery from the 2008–2009 global recession, the strength and duration of any economic recovery will be impacted by worldwide economic growth. For instance, a number of recent reports indicate that growth in China and other emerging markets may be slowing relative to historical growth rates. The significant debt in U.S. and European countries is expected to hinder growth in those countries for the foreseeable future. Multiple factors relating to the international operations of some of our portfolio companies and to particular countries in which they operate could negatively impact their business, financial condition and results of operations.
Some of the products of our portfolio companies are developed, manufactured, assembled, tested or marketed outside the U.S. Any conflict or uncertainty in these countries, including due to natural disasters, public health concerns, political unrest or safety concerns, could harm their business, financial condition and results of operations. In addition, if the government of any country in which their products are developed, manufactured or sold sets technical or regulatory standards for products developed or manufactured in or imported into their country that are not widely shared, it may lead some of their customers to suspend imports of their products into that country, require manufacturers or developers in that country to manufacture or develop products with different technical or regulatory standards and disrupt cross-border manufacturing, marketing or business relationships which, in each case, could harm their businesses.
Any unrealized losses we experience on our investment portfolio may be an indication of future realized losses, which could reduce our income available for distribution and could materially adversely affect our ability to service our outstanding borrowings.
As a business development company, we are required to carry our investments at market value or, if no market value is ascertainable, at fair value as determined in good faith by or under the direction of our Board of Directors. Decreases in the market values or fair values of our investments will be recorded as unrealized depreciation. Any unrealized losses in our investment portfolio could be an indication of a portfolio company’s inability to meet its repayment obligations to us with respect to the affected investments. This could result in realized losses in the future and ultimately in reductions of our income available for distribution in future periods and could materially adversely affect our ability to service our outstanding borrowings.
47
Table of Contents
A lack of initial public offering opportunities may cause companies to stay in our portfolio longer, leading to lower returns, unrealized depreciation, or realized losses.
A lack of IPO opportunities for venture capital-backed companies could lead to companies staying longer in our portfolio as private entities still requiring funding. This situation may adversely affect the amount of available funding for early-stage companies in particular as, in general, venture-capital firms are being forced to provide additional financing to late-stage companies that cannot complete an IPO. In the best case, such stagnation would dampen returns, and in the worst case, could lead to unrealized depreciation and realized losses as some companies run short of cash and have to accept lower valuations in private fundings or are not able to access additional capital at all. A lack of IPO opportunities for venture capital-backed companies can also cause some venture capital firms to change their strategies, leading some of them to reduce funding of their portfolio companies and making it more difficult for such companies to access capital and to fulfill their potential, which can result in unrealized depreciation and realized losses in such companies by other companies such as ourselves who are co-investors in such companies.
To the extent venture capital or private equity firms decrease or discontinue funding to their portfolio companies, our portfolio companies may not be able to meet their obligations under the debt securities that we hold.
Most of our portfolio companies rely heavily on future rounds of funding from venture capital or private equity firms in order to continue operating their businesses and repaying their obligations to us under the debt securities that we hold. Venture capital and private equity firms in turn rely on their limited partners to pay in capital over time in order to fund their ongoing and future investment activities.
To the extent that venture capital and private equity firms’ limited partners are unable to fulfill their ongoing funding obligations, the venture capital or private equity firms may be unable to continue financially supporting the ongoing operations of our portfolio companies. As a result, our portfolio companies may be unable to repay their obligations under the debt securities that we hold, which would harm our financial condition and results of operations.
If the assets securing the loans that we make decrease in value, then we may lack sufficient collateral to cover losses.
We believe that our portfolio companies generally will be able to repay our loans from their available capital, from future capital-raising transactions, or from cash flow from operations. However, to attempt to mitigate credit risks, we will typically take a security interest in the available assets of these portfolio companies, including the equity interests of their subsidiaries and, in some cases, the equity interests of our portfolio companies held by their stockholders. In many cases, our loans will include a period of interest-only payments. There is a risk that the collateral securing our loans may decrease in value over time, may be difficult to sell in a timely manner, may be difficult to appraise and may fluctuate in value based upon the success of the business and market conditions, including as a result of the inability of a portfolio company to raise additional capital. In some circumstances, our lien could be subordinated to claims of other creditors. Additionally, deterioration in a portfolio company’s financial condition and prospects, including its inability to raise additional capital, may be accompanied by deterioration in the value of the collateral for the loan. Moreover, in the case of some of our structured debt with warrants, we may not have a first lien position on the collateral. Consequently, the fact that a loan is secured does not guarantee that we will receive principal and interest payments according to the loan’s terms, or that we will be able to collect on the loan should we be forced to enforce our remedies.
In addition, because we invest in technology-related companies, a substantial portion of the assets securing our investment may be in the form of intellectual property, if any, inventory and equipment and, to a lesser extent, cash and accounts receivable. Intellectual property, if any, that is securing our loan could lose value if, among other things, the company’s rights to the intellectual property are challenged or if the company’s license
48
Table of Contents
to the intellectual property is revoked or expires. Inventory may not be adequate to secure our loan if our valuation of the inventory at the time that we made the loan was not accurate or if there is a reduction in the demand for the inventory.
Similarly, any equipment securing our loan may not provide us with the anticipated security if there are changes in technology or advances in new equipment that render the particular equipment obsolete or of limited value, or if the company fails to adequately maintain or repair the equipment. Any one or more of the preceding factors could materially impair our ability to recover principal in a foreclosure.
We may suffer a loss if a portfolio company defaults on a loan and the underlying collateral is not sufficient.
In the event of a default by a portfolio company on a secured loan, we will only have recourse to the assets collateralizing the loan. If the underlying collateral value is less than the loan amount, we will suffer a loss. In addition, we sometimes make loans that are unsecured, which are subject to the risk that other lenders may be directly secured by the assets of the portfolio company. In the event of a default, those collateralized lenders would have priority over us with respect to the proceeds of a sale of the underlying assets. In cases described above, we may lack control over the underlying asset collateralizing our loan or the underlying assets of the portfolio company prior to a default, and as a result the value of the collateral may be reduced by acts or omissions by owners or managers of the assets.
In the event of bankruptcy of a portfolio company, we may not have full recourse to its assets in order to satisfy our loan, or our loan may be subject to equitable subordination. In addition, certain of our loans are subordinate to other debt of the portfolio company. If a portfolio company defaults on our loan or on debt senior to our loan, or in the event of a portfolio company bankruptcy, our loan will be satisfied only after the senior debt receives payment. Where debt senior to our loan exists, the presence of intercreditor arrangements may limit our ability to amend our loan documents, assign our loans, accept prepayments, exercise our remedies (through “standstill” periods) and control decisions made in bankruptcy proceedings relating to the portfolio company. Bankruptcy and portfolio company litigation can significantly increase collection losses and the time needed for us to acquire the underlying collateral in the event of a default, during which time the collateral may decline in value, causing us to suffer losses.
If the value of collateral underlying our loan declines or interest rates increase during the term of our loan, a portfolio company may not be able to obtain the necessary funds to repay our loan at maturity through refinancing. Decreasing collateral value and/or increasing interest rates may hinder a portfolio company’s ability to refinance our loan because the underlying collateral cannot satisfy the debt service coverage requirements necessary to obtain new financing. If a borrower is unable to repay our loan at maturity, we could suffer a loss which may adversely impact our financial performance.
The inability of our portfolio companies to commercialize their technologies or create or develop commercially viable products or businesses would have a negative impact on our investment returns.
The possibility that our portfolio companies will not be able to commercialize their technology, products or business concepts presents significant risks to the value of our investment. Additionally, although some of our portfolio companies may already have a commercially successful product or product line when we invest, technology-related products and services often have a more limited market- or life-span than have products in other industries. Thus, the ultimate success of these companies often depends on their ability to continually innovate, or raise additional capital, in increasingly competitive markets. Their inability to do so could affect our investment return. In addition, the intellectual property held by our portfolio companies often represents a substantial portion of the collateral, if any, securing our investments. We cannot assure you that any of our portfolio companies will successfully acquire or develop any new technologies, or that the intellectual property the companies currently hold will remain viable. Even if our portfolio companies are able to develop
49
Table of Contents
commercially viable products, the market for new products and services is highly competitive and rapidly changing. Neither our portfolio companies nor we have any control over the pace of technology development. Commercial success is difficult to predict, and the marketing efforts of our portfolio companies may not be successful.
An investment strategy focused primarily on privately-held companies presents certain challenges, including the lack of available information about these companies, a dependence on the talents and efforts of only a few key portfolio company personnel and a greater vulnerability to economic downturns.
We invest primarily in privately-held companies. Generally, very little public information exists about these companies, and we are required to rely on the ability of our management team to obtain adequate information to evaluate the potential returns from investing in these companies. If we are unable to uncover all material information about these companies, then we may not make a fully informed investment decision, and we may not receive the expected return on our investment or lose some or all of the money invested in these companies.
Also, privately-held companies frequently have less diverse product lines and a smaller market presence than do larger competitors. Privately-held companies are, thus, generally more vulnerable to economic downturns and may experience more substantial variations in operating results than do larger competitors. These factors could affect our investment returns and our results of operations and financial condition.
In addition, our success depends, in large part, upon the abilities of the key management personnel of our portfolio companies, who are responsible for the day-to-day operations of our portfolio companies. Competition for qualified personnel is intense at any stage of a company’s development, and high turnover of personnel is common in technology-related companies. The loss of one or more key managers can hinder or delay a company’s implementation of its business plan and harm its financial condition. Our portfolio companies may not be able to attract and retain qualified managers and personnel. Any inability to do so may negatively impact our investment returns and our results of operations and financial condition.
If our portfolio companies are unable to protect their intellectual property rights, then our business and prospects could be harmed. If our portfolio companies are required to devote significant resources to protecting their intellectual property rights, then the value of our investment could be reduced.
Our future success and competitive position depend in part upon the ability of our portfolio companies to obtain and maintain proprietary technology used in their products and services, which will often represent a significant portion of the collateral, if any, securing our investment. The portfolio companies will rely, in part, on patent, trade secret and trademark law to protect that technology, but competitors may misappropriate their intellectual property, and disputes as to ownership of intellectual property may arise. Portfolio companies may, from time to time, be required to institute litigation in order to enforce their patents, copyrights or other intellectual property rights, to protect their trade secrets, to determine the validity and scope of the proprietary rights of others or to defend against claims of infringement. Such litigation could result in substantial costs and diversion of resources. Similarly, if a portfolio company is found to infringe upon or misappropriate a third party’s patent or other proprietary rights, that portfolio company could be required to pay damages to such third party, alter its own products or processes, obtain a license from the third party and/or cease activities utilizing such proprietary rights, including making or selling products utilizing such proprietary rights. Any of the foregoing events could negatively affect both the portfolio company’s ability to service our debt investment and the value of any related debt and equity securities that we own, as well as any collateral securing our investment.
Portfolio company litigation could result in additional costs, the diversion of management time and resources and have an adverse impact on the fair value of our investment.
In the course of providing significant managerial assistance to certain of our portfolio companies, we may serve as directors on the boards of such companies. In addition, in the course of making portfolio company investments, we may elect to take an equity position in any given company. To the extent that litigation arises out
50
Table of Contents
of our investments, we may be named as a defendant, which could result in additional costs and the diversion of management time and resources. In addition, litigation involving a portfolio company may be costly and affect the operations of the business, which could in turn have an adverse impact on the fair value of our investment.
We may not be able to realize our entire investment on equipment-based loans in the case of default.
We may from time-to-time provide loans that will be collateralized only by equipment of the portfolio company. If the portfolio company defaults on the loan we would take possession of the underlying equipment to satisfy the outstanding debt. The residual value of the equipment at the time we would take possession may not be sufficient to satisfy the outstanding debt and we could experience a loss on the disposition of the equipment.
Our investments in foreign securities may involve significant risks in addition to the risks inherent in U.S. investments.
Our investment strategy contemplates that a portion of our investments may be in securities of foreign companies. Our total investments at value in foreign companies were approximately $5.3 million or 0.6% of total investments at December 31, 2012. Investing in foreign companies may expose us to additional risks not typically associated with investing in U.S. companies. These risks include changes in exchange control regulations, political and social instability, expropriation, imposition of foreign taxes, less liquid markets and less available information than is generally the case in the U.S., higher transaction costs, less government supervision of exchanges, brokers and issuers, less developed bankruptcy laws, difficulty in enforcing contractual obligations, lack of uniform accounting and auditing standards and greater price volatility.
Some of our portfolio companies may need additional capital, which may not be readily available and may be needed if necessary regulatory review processes are extended or approvals not obtained.
Our portfolio companies will often require substantial additional equity financing to satisfy their continuing working capital and other requirements, and in most instances to service the interest and principal payments on our investment. Each round of venture financing is typically intended to provide a company with only enough capital to reach the next stage of development. We cannot predict the circumstances or market conditions under which our portfolio companies will seek additional capital. It is possible that one or more of our portfolio companies will not be able to raise additional financing or may be able to do so only at a price or on terms unfavorable to us, either of which would negatively impact our investment returns. Some of these companies may be unable to obtain sufficient financing from private investors, public capital markets or traditional lenders. This may have a significant impact if the companies are unable to obtain certain federal, state or foreign agency approval for their products or the marketing thereof, of if regulatory review processes extend longer than anticipated, and the companies need continued funding for their operations during these times. Accordingly, financing these types of companies may entail a higher risk of loss than would financing companies that are able to utilize traditional credit sources.
We may be unable or decide not to make additional cash investments in our portfolio companies which could result in our losing our initial investment if the portfolio company fails.
We may have to make additional cash investments in our portfolio companies to protect our overall investment value in the particular company. We retain the discretion to make any additional investments as our management determines. The failure to make such additional investments may jeopardize the continued viability of a portfolio company, and our initial (and subsequent) investments. Moreover, additional investments may limit the number of companies in which we can make initial investments. In determining whether to make an additional investment our management will exercise its business judgment and apply criteria similar to those used when making the initial investment. We cannot assure you that we will have sufficient funds to make any necessary additional investments, which could adversely affect our success and result in the loss of a substantial portion or all of our investment in a portfolio company.
51
Table of Contents
If our investments do not meet our performance expectations, you may not receive distributions.
We intend to make distributions on a quarterly basis to our stockholders. We may not be able to achieve operating results that will allow us to make distributions at a specific level or to increase the amount of these distributions from time to time. In addition, due to the asset coverage test applicable to us as a business development company, we may be limited in our ability to make distributions. See “Item1. Business—Regulation.” Also, restrictions and provisions in any future credit facilities may limit our ability to make distributions. As a RIC, if we do not distribute a certain percentage of our income annually, we will suffer adverse tax consequences, including failure to obtain, or possible loss of, the federal income tax benefits allowable to RICs. See “Item 1. Business—Certain United States Federal Income Tax Considerations—Taxation as a Regulated Investment Company.” We cannot assure you that you will receive distributions at a particular level or at all.
We may not have sufficient funds to make follow-on investments. Our decision not to make a follow-on investment may have a negative impact on a portfolio company in need of such an investment or may result in a missed opportunity for us.
After our initial investment in a portfolio company, we may be called upon from time to time to provide additional funds to such company or have the opportunity to increase our investment in a successful situation, for example, the exercise of a warrant to purchase common stock. Any decision we make not to make a follow-on investment or any inability on our part to make such an investment may have a negative impact on a portfolio company in need of such an investment or may result in a missed opportunity for us to increase our participation in a successful operation and may dilute our equity interest or otherwise reduce the expected yield on our investment. Moreover, a follow-on investment may limit the number of companies in which we can make initial investments. In determining whether to make a follow-on investment, our management will exercise its business judgment and apply criteria similar to those used when making the initial investment. There is no assurance that we will make, or will have sufficient funds to make, follow-on investments and this could adversely affect our success and result in the loss of a substantial portion or all of our investment in a portfolio company.
Any unrealized depreciation that we experience on our loan portfolio may be an indication of future realized losses, which could reduce our income available for distribution and could adversely affect our ability to service our outstanding borrowings.
As a business development company, we are required to carry our investments at market value or, if no market value is ascertainable, at the fair value as determined in good faith by our Board of Directors in accordance with procedures approved by our Board of Directors. Decreases in the market values or fair values of our investments will be recorded as unrealized depreciation. Any unrealized depreciation in our loan portfolio could be an indication of a portfolio company’s inability to meet its repayment obligations to us with respect to the affected loans. This could result in realized losses in the future and ultimately in reductions of our income available for distribution in future periods and could materially adversely affect our ability to service our outstanding borrowings.
The lack of liquidity in our investments may adversely affect our business and, if we need to sell any of our investments, we may not be able to do so at a favorable price. As a result, we may suffer losses.
We generally invest in debt securities with terms of up to seven years and hold such investments until maturity, and we do not expect that our related holdings of equity securities will provide us with liquidity opportunities in the near-term. We invest and expect to continue investing in companies whose securities have no established trading market and whose securities are and will be subject to legal and other restrictions on resale or whose securities are and will be less liquid than are publicly-traded securities. The illiquidity of these investments may make it difficult for us to sell these investments when desired. In addition, if we are required to liquidate all or a portion of our portfolio quickly, we may realize significantly less than the value at which we had previously recorded these investments. As a result, we do not expect to achieve liquidity in our investments
52
Table of Contents
in the near-term. However, to maintain our qualification as a business development company and as a RIC, we may have to dispose of investments if we do not satisfy one or more of the applicable criteria under the respective regulatory frameworks. Our investments are usually subject to contractual or legal restrictions on resale, or are otherwise illiquid, because there is usually no established trading market for such investments. The illiquidity of most of our investments may make it difficult for us to dispose of the investments at a favorable price and, as a result, we may suffer losses.
Our portfolio companies may incur debt or issue equity securities that rank equally with, or senior to, our investments in such companies.
We invest primarily in debt securities issued by our portfolio companies. In some cases, portfolio companies will be permitted to incur other debt, or issue other equity securities, that rank equally with, or senior to, our investment By their terms, .such instruments may provide that the holders thereof are entitled to receive payment of dividends, interest or principal on or before the dates on which we are entitled to receive payments in respect of our investments. These debt instruments would usually prohibit the portfolio companies from paying interest on or repaying our investments in the event and during the continuance of a default under such debt. Also, in the event of insolvency, liquidation, dissolution, reorganization or bankruptcy of a portfolio company, holders of securities ranking senior to our investment in that portfolio company would typically be entitled to receive payment in full before we receive any distribution in respect of our investment. After repaying such holders, the portfolio company might not have any remaining assets to use for repaying its obligation to us. In the case of securities ranking equally with our investments, we would have to share on a pari passu basis any distributions with other security holders in the event of an insolvency, liquidation, dissolution, reorganization or bankruptcy of the relevant portfolio company. In addition, we would not be in a position to control any portfolio company by investing in its debt securities. As a result, we are subject to the risk that a portfolio company in which we invest may make business decisions with which we disagree and the management of such companies, as representatives of the holders of their common equity, may take risks or otherwise act in ways that do not best serve our interests as debt investors.
The rights we may have with respect to the collateral securing any junior priority loans we make to our portfolio companies may also be limited pursuant to the terms of one or more intercreditor agreements that we enter into with the holders of senior debt. Under such an intercreditor agreement, at any time that senior obligations are outstanding, we may forfeit certain rights with respect to the collateral to the holders of the senior obligations. These rights may include the right to commence enforcement proceedings against the collateral, the right to control the conduct of such enforcement proceedings, the right to approve amendments to collateral documents, the right to release liens on the collateral and the right to waive past defaults under collateral documents. We may not have the ability to control or direct such actions, even if as a result our rights as junior lenders are adversely affected.
Our equity related investments are highly speculative, and we may not realize gains from these investments. If our equity investments do not generate gains, then the return on our invested capital will be lower than it would otherwise be, which could result in a decline in the value of shares of our common stock.
When we invest in debt securities, we generally expect to acquire warrants or other equity securities as well. Our goal is ultimately to dispose of these equity interests and realize gains upon disposition of such interests. Over time, the gains that we realize on these equity interests may offset, to some extent, losses that we experience on defaults under debt securities that we hold. However, the equity interests that we receive may not appreciate in value and, in fact, may decline in value. Accordingly, we may not be able to realize gains from our equity interests, and any gains that we do realize on the disposition of any equity interests may not be sufficient to offset any other losses that we experience.
53
Table of Contents
We may not realize expected returns on warrants received in connection with our debt investments.
We generally receive warrants in connection with our debt investments. At December 31, 2012, we held warrant positions received in connection with many of our debt investment; however, these warrant positions accounted for only approximately 3.3% of the total value of our portfolio investments. If we do not receive the returns that are anticipated on the warrants, our investment returns on our portfolio companies, and the value of an investment in us, may be lower than expected.
We generally do not control our portfolio companies and therefore our portfolio companies may make decisions with which we disagree.
Generally, we do not control any of our portfolio companies, even though we may have board observation rights and our debt agreements may contain certain restrictive covenants. As a result, we are subject to the risk that a portfolio company in which we invest may make business decisions with which we disagree and the management of such company, as representatives of the holders of their common equity, may take risks or otherwise act in ways that do not serve our interests as debt investors.
Prepayments of our debt investments by our portfolio companies could adversely impact our results of operations and reduce our return on equity.
In 2012, we received early loan repayments and pay down of working capital loans of approximately $245.8 million. We are subject to the risk that the investments we make in our portfolio companies may be repaid prior to maturity. When this occurs, we will generally reinvest these proceeds in temporary investments, pending their future investment in new portfolio companies. These temporary investments will typically have substantially lower yields than the debt being prepaid and we could experience significant delays in reinvesting these amounts. Any future investment in a new portfolio company may also be at lower yields than the debt that was repaid. As a result, our results of operations could be materially adversely affected if one or more of our portfolio companies elect to prepay amounts owed to us. Additionally, prepayments could negatively impact our return on equity, which could result in a decline in the market price of our common stock.
We may not realize gains from our equity investments.
When we invest in debt securities, we generally expect to acquire warrants or other equity securities as well. However, the equity interests we receive may not appreciate in value and, in fact, may decline in value. Accordingly, we may not be able to realize gains from our equity interests, and any gains that we do realize on the disposition of any equity interests may not be sufficient to offset any other losses we experience.
Our financial results could be negatively affected if we are unable to recover our principal investment as a result of a negative pledge on the intellectual property of our portfolio companies.
In some cases, we collateralize our investments by obtaining a first priority security interest in a portfolio companies’ assets, which may include their intellectual property. In other cases, we may obtain a first priority security interest in a portion of a portfolio company’s assets and a negative pledge covering a company’s intellectual property and a first priority security interest in the proceeds from such intellectual property. In the case of a negative pledge, the portfolio company cannot encumber or pledge their intellectual property without our permission. In the event of a default on a loan, the intellectual property of the portfolio company will most likely be liquidated to provide proceeds to pay the creditors of the company. As a result, a negative pledge may affect our ability to fully recover our principal investment. In addition, there can be no assurance that our security interest in the proceeds of the intellectual property will be enforceable in a court of law or bankruptcy court.
At December 31, 2012, approximately 62.4% of the Company’s portfolio company loans were secured by a first priority security in all of the assets of the portfolio company (including their intellectual property), 36.0% of portfolio company loans were to portfolio companies that were prohibited from pledging or encumbering their intellectual property and 1.6% of portfolio company loans had an equipment only lien.
54
Table of Contents
We may choose to waive or defer enforcement of covenants in the debt securities held in our portfolio, which may cause us to lose all or part of our investment in these companies.
We structure the debt investments in our portfolio companies to include business and financial covenants placing affirmative and negative obligations on the operation of the company’s business and its financial condition. However, from time to time we may elect to waive breaches of these covenants, including our right to payment, or waive or defer enforcement of remedies, such as acceleration of obligations or foreclosure on collateral, depending upon the financial condition and prospects of the particular portfolio company. These actions may reduce the likelihood of our receiving the full amount of future payments of interest or principal and be accompanied by a deterioration in the value of the underlying collateral as many of these companies may have limited financial resources, may be unable to meet future obligations and may go bankrupt. This could negatively impact our ability to pay dividends, could adversely affect our results of operation and financial condition and cause the loss of all or part of your investment.
We may also be subject to lender liability claims for actions taken by us with respect to a borrower’s business or instances where we exercise control over the borrower. It is possible that we could become subject to a lender’s liability claim, including as a result of actions taken in rendering significant managerial assistance or actions to compel and collect payments from the borrower outside the ordinary course of business.
Our loans could be subject to equitable subordination by a court which would increase our risk of loss with respect to such loans or we could be subject to lender liability claims.
Courts may apply the doctrine of equitable subordination to subordinate the claim or lien of a lender against a borrower to claims or liens of other creditors of the borrower, when the lender or its affiliates is found to have engaged in unfair, inequitable or fraudulent conduct. The courts have also applied the doctrine of equitable subordination when a lender or its affiliates is found to have exerted inappropriate control over a client, including control resulting from the ownership of equity interests in a client. We have made direct equity investments or received warrants in connection with loans. These investments represent approximately 8.7% of the outstanding balance of our portfolio as of December 31, 2012. Payments on one or more of our loans, particularly a loan to a client in which we also hold an equity interest, may be subject to claims of equitable subordination. If we were deemed to have the ability to control or otherwise exercise influence over the business and affairs of one or more of our portfolio companies resulting in economic hardship to other creditors of that company, this control or influence may constitute grounds for equitable subordination and a court may treat one or more of our loans as if it were unsecured or common equity in the portfolio company. In that case, if the portfolio company were to liquidate, we would be entitled to repayment of our loan on a pro-rata basis with other unsecured debt or, if the effect of subordination was to place us at the level of common equity, then on an equal basis with other holders of the portfolio company’s common equity only after all of its obligations relating to its debt and preferred securities had been satisfied.
Risks Related to Our Common Stock
Investing in shares of our common stock may involve an above average degree of risk.
The investments we make in accordance with our investment objective may result in a higher amount of risk, volatility or loss of principal than alternative investment options. Our investments in portfolio companies may be highly speculative and aggressive, and therefore, an investment in our common stock may not be suitable for investors with lower risk tolerance.
Our common stock may trade below its net asset value per share, which limits our ability to raise additional equity capital.
If our common stock is trading below its net asset value per share, we will generally not be able to issue additional shares of our common stock at its market price without first obtaining the approval for such issuance from our stockholders and our independent directors. If our common stock trades below net asset value, the higher
55
Table of Contents
cost of equity capital may result in it being unattractive to raise new equity, which may limit our ability to grow. The risk of trading below net asset value is separate and distinct from the risk that our net asset value per share may decline. We cannot predict whether shares of our common stock will trade above, at or below our net asset value.
Provisions of our charter and bylaws could deter takeover attempts and have an adverse impact on the price of our common stock.
Our charter and bylaws contain provisions that may have the effect of discouraging, delaying, or making difficult a change in control of our company or the removal of our incumbent directors. Under our charter, our Board of Directors is divided into three classes serving staggered terms, which will make it more difficult for a hostile bidder to acquire control of us. In addition, our Board of Directors may, without stockholder action, authorize the issuance of shares of stock in one or more classes or series, including preferred stock. Subject to compliance with the 1940 Act, our Board of Directors may, without stockholder action, amend our charter to increase the number of shares of stock of any class or series that we have authority to issue. The existence of these provisions, among others, may have a negative impact on the price of our common stock and may discourage third party bids for ownership of our company. These provisions may prevent any premiums being offered to you for shares of our common stock.
We may again obtain the approval of our stockholders to issue shares of our common stock at prices below the then current net asset value per share of our common stock. If we receive such approval from the stockholders, we may again issue shares of our common stock at a price below the then current net asset value per share of common stock. Any such issuance could materially dilute your interest in our common stock and reduce our net asset value per share.
We may again obtain the approval of our stockholders to issue shares of our common stock at prices below the then current net asset value per share of our common stock. Such approval has allowed and may again allow us to access the capital markets in a way that we typically are unable to do as a result of restrictions that, absent stockholder approval, apply to business development companies under the 1940 Act. Any decision to sell shares of our common stock below the then current net asset value per share of our common stock is subject to the determination by our board of directors that such issuance and sale is in our and our stockholders’ best interests.
Any sale or other issuance of shares of our common stock at a price below net asset value per share has resulted and will continue to result in an immediate dilution to your interest in our common stock and a reduction of our net asset value per share. This dilution would occur as a result of a proportionately greater decrease in a stockholder’s interest in our earnings and assets and voting interest in us than the increase in our assets resulting from such issuance. Because the number of future shares of common stock that may be issued below our net asset value per share and the price and timing of such issuances are not currently known, we cannot predict the actual dilutive effect of any such issuance. We also cannot determine the resulting reduction in our net asset value per share of any such issuance at this time. We caution you that such effects may be material, and we undertake to describe all the material risks and dilutive effects of any offering that we make at a price below our then current net asset value in the future in a prospectus supplement issued in connection with any such offering. We cannot predict whether shares of our common stock will trade above, at or below our net asset value.
If we conduct an offering of our common stock at a price below net asset value, investors are likely to incur immediate dilution upon the closing of the offering.
We are not generally able to issue and sell our common stock at a price below net asset value per share. We may, however, sell our common stock, at a price below the current net asset value of the common stock, or sell warrants, options or rights to acquire such common stock, at a price below the current net asset value of the common stock if our board of directors determines that such sale is in our best interests and the best interests of our stockholders have approved the practice of making such sales.
56
Table of Contents
At our Annual Meeting of Stockholders on May 30, 2012, our stockholders approved a proposal authorizing us to sell up to 20% of our common stock at a price below our net asset value per share, subject to Board approval of the offering. Our Board of Directors, subject to its fiduciary duties and regulatory requirements, has the discretion to determine the amount of the discount, and as a result, the discount could be up to 100% of net asset value per share. If we were to issue shares at a price below net asset value, such sales would result in an immediate dilution to existing common stockholders, which would include a reduction in the net asset value per share as a result of the issuance. This dilution would also include a proportionately greater decrease in a stockholder’s interest in our earnings and assets and voting interest in us than the increase in our assets resulting from such issuance.
In addition, if we determined to conduct additional offerings in the future there may be even greater discounts if we determine to conduct such offerings at prices below net asset value. As a result, investors will experience further dilution and additional discounts to the price of our common stock. Because the number of shares of common stock that could be so issued and the timing of any issuance is not currently known, the actual dilutive effect of an offering cannot be predicted. We did not sell any of our securities at a price below net asset value during the year ended December 31, 2012.
Our shares may trade at discounts from net asset value or at premiums that are unsustainable over the long term.
Shares of business development companies may trade at a market price that is less than the net asset value that is attributable to those shares. Our shares have traded above and below our NAV. The possibility that our shares of common stock will trade at a discount from net asset value or at a premium that is unsustainable over the long term is separate and distinct from the risk that our net asset value will decrease. It is not possible to predict whether our shares will trade at, above or below net asset value in the future.
Our common stock price has been and continues to be volatile and may decrease substantially.
As with any company, the price of our common stock will fluctuate with market conditions and other factors, which include, but are not limited to, the following:
| • | price and volume fluctuations in the overall stock market from time to time; |
| • | significant volatility in the market price and trading volume of securities of RICs, business development companies or other financial services companies; |
| • | any inability to deploy or invest our capital; |
| • | fluctuations in interest rates; |
| • | any shortfall in revenue or net income or any increase in losses from levels expected by investors or securities analysts; |
| • | the financial performance of specific industries in which we invest in on a recurring basis; |
| • | announcement of strategic developments, acquisitions, and other material events by us or our competitors, or operating performance of companies comparable to us; |
| • | changes in regulatory policies or tax guidelines with respect to RICs, SBICs or business development companies; |
| • | losing RIC status; |
| • | actual or anticipated changes in our earnings or fluctuations in our operating results, or changes in the expectations of securities analysts; |
| • | changes in the value of our portfolio of investments; |
| • | realized losses in investments in our portfolio companies; |
57
Table of Contents
| • | general economic conditions and trends; |
| • | inability to access the capital markets; |
| • | loss of a major funded source; or |
| • | departures of key personnel. |
In the past, following periods of volatility in the market price of a company’s securities, securities class action litigation has often been brought against that company. Due to the potential volatility of our stock price, we may be the target of securities litigation in the future. Securities litigation could result in substantial costs and could divert management’s attention and resources from our business.
| Item 1B. | Unresolved Staff Comments |
None.
| Item 2. | Properties |
Neither we nor any of our subsidiaries own any real estate or other physical properties materially important to our operation or any of our subsidiaries. Currently, we lease approximately 14,500 square feet of office space in Palo Alto, CA for our corporate headquarters. We also lease office space in Boston, MA, Boulder, CO and McLean, VA.
| Item 3. | Legal Proceedings |
We may, from time to time, be involved in litigation arising out of our operations in the normal course of business or otherwise. Furthermore, third parties may try to seek to impose liability on us in connection with the activities of our portfolio companies. While the outcome of any current legal proceedings cannot at this time be predicted with certainty, we do not expect any current matters will materially affect our financial condition or results of operations; however, there can be no assurance whether any pending legal proceedings will have a material adverse effect on our financial condition or results of operations in any future reporting period.
| Item 4. | Mine Safety Disclosures |
Not applicable.
58
Table of Contents
| Item 5. | Market for Registrant’s Common Equity, Related Stockholder Matters and Issuer Purchases of Equity Securities |
PRICE RANGE OF COMMON STOCK
Our common stock is traded on the NYSE under the symbol “HTGC.” The following table sets forth the range of high and low sales prices of our common stock for each fiscal quarter during the two most recently completed fiscal years as reported on the Nasdaq Global Select Market for those periods prior to April 30, 2012 and the NYSE thereafter.
| Price Range | ||||||||
| Quarter Ended |
High | Low | ||||||
| March 31, 2011 |
$ | 11.40 | $ | 10.42 | ||||
| June 30, 2011 |
11.36 | 10.09 | ||||||
| September 30, 2011 |
10.80 | 8.51 | ||||||
| December 31, 2011 |
9.99 | 8.20 | ||||||
| March 31, 2012 |
10.53 | 8.72 | ||||||
| June 30, 2012 |
10.84 | 9.76 | ||||||
| September 30, 2012 |
11.26 | 10.50 | ||||||
| December 31, 2012 |
11.18 | 9.84 | ||||||
The last reported price for our common stock on February 25, 2013 was $12.28 per share.
As of February 4, 2013, we had 48 stockholders of record. Most of the shares of our common stock are held by brokers and other institutions on behalf of stockholders. We believe that there are currently approximately 25,000 additional beneficial holders of our common stock.
Shares of business development companies may trade at a market price that is less than the value of the net assets attributable to those shares. The possibilities that our shares of common stock will trade at a discount from net asset value or at premiums that are unsustainable over the long term are separate and distinct from the risk that our net asset value will decrease. At times, our shares of common stock have traded at a premium to net asset value or at a significant discount to the net assets attributable to those shares.
SALES OF UNREGISTERED SECURITIES
During 2012, 2011 and 2010, the Board of Directors elected to receive approximately $150,000, $105,000 and $105,000 respectively, of their compensation in the form of common stock and the Company issued 13,584, 9,942 and 10,479 shares, respectively, to the directors based on the closing prices of the common stock on the specified election dates.
During 2012 and 2011, we issued approximately 219,000 and 167,000 shares, respectively, of common stock to shareholders in connection with the dividend reinvestment plan. These issuances were not subject to the registration requirements of the Securities Act of 1933, as amended. The aggregate value the shares of our common stock issued under our dividend reinvestment plan was approximately $2.3 million.
ISSUER PURCHASES OF EQUITY SECURITIES
In February 2010, the Board of Directors approved a $35.0 million open market share repurchase program and on July 25, 2012, the Board of Directors approved the extension of the share repurchase program. Pursuant to
59
Table of Contents
the share repurchase program, we may repurchase common stock in the open market, including block purchases, at prices that may be above or below the net asset value as reported in its then most recently published financial statements. We anticipate that the manner, timing, and amount of any share purchases will be determined by company management based upon the evaluation of market conditions, stock price, and additional factors in accordance with regulatory requirements. As a 1940 Act reporting company, we are required to notify shareholders of the existence of a repurchase program when such a program is initiated or implemented. The repurchase program does not require us to acquire any specific number of shares and may be extended, modified, or discontinued at any time. The share repurchase program is set to expire on February 26, 2013 unless the Board of Directors approves another extension.
During the year ended December 31, 2012, the Company did not repurchase any common stock.
EQUITY COMPENSATION PLAN INFORMATION
Information relating to compensation plans under which our equity securities are authorized for issuance is set forth under the heading “Executive Compensation—Equity Compensation Plan Information” in our definitive proxy statement for our 2013 Annual Meeting of Stockholders.
DIVIDEND POLICY
As a RIC, we intend to distribute quarterly dividends to our stockholders. To the extent we do not distribute during each calendar year an amount at least equal to the sum of (1) 98% of our ordinary income for the calendar year, (2) 98.2% of our capital gains in excess of capital losses for the one year period ending on October 31 of the calendar year, and (3) any ordinary income and net capital gains for the preceding year that were not distributed during such years we are required to pay a 4% excise tax on our undistributed income.
To the extent that we earn annual taxable income in excess of dividends paid from such taxable income for the year, we may carry over the excess taxable income into the next year and such excess income will be available for distribution in the next year as permitted by the Code. We will not be subject to excise taxes on amounts on which we are required to pay corporate income tax (such as retained net capital gains). In order to obtain the tax benefits applicable to RICs, we will be required to distribute to our stockholders with respect to each taxable year at least 90% of our ordinary income and realized net short-term capital gains in excess of realized net long-term capital losses. We currently intend to retain for investment realized net long-term capital gains in excess of realized net short-term capital losses. Please refer to “Item 1. Business—Certain United States Federal Income Tax Considerations” for further information regarding the consequences of our retention of net capital gains. We may, in the future, make actual distributions to our stockholders of some or all realized net long-term capital gains in excess of realized net short-term capital losses. We can offer no assurance that we will achieve results that will permit the payment of any distributions and, if we issue senior securities, we may be prohibited from making distributions if doing so causes us to fail to maintain the asset coverage ratios stipulated by the 1940 Act or if distributions are limited by the terms of any of our borrowings. See “Item 1. Business— Regulation.”
For the years ended December 31, 2012 and 2011, we did not record a provision for excise tax since we have paid out greater than 98% of our taxable earnings for each fiscal year.
60
Table of Contents
The following table summarizes dividends declared and paid or to be paid on all shares, including restricted stock, to date:
| Date Declared |
Record Date | Payment Date | Amount Per Share | |||||
| October 27, 2005 |
November 1, 2005 | November 17, 2005 | $ | 0.03 | ||||
| December 9, 2005 |
January 6, 2006 | January 27, 2006 | 0.30 | |||||
| April 3, 2006 |
April 10, 2006 | May 5, 2006 | 0.30 | |||||
| July 19, 2006 |
July 31, 2006 | August 28, 2006 | 0.30 | |||||
| October 16, 2006 |
November 6, 2006 | December 1, 2006 | 0.30 | |||||
| February 7, 2007 |
February 19, 2007 | March 19, 2007 | 0.30 | |||||
| May 3, 2007 |
May 16, 2007 | June 18, 2007 | 0.30 | |||||
| August 2, 2007 |
August 16, 2007 | September 17, 2007 | 0.30 | |||||
| November 1, 2007 |
November 16, 2007 | December 17, 2007 | 0.30 | |||||
| February 7, 2008 |
February 15, 2008 | March 17, 2008 | 0.30 | |||||
| May 8, 2008 |
May 16, 2008 | June 16, 2008 | 0.34 | |||||
| August 7, 2008 |
August 15, 2008 | September 19, 2008 | 0.34 | |||||
| November 6, 2008 |
November 14, 2008 | December 15, 2008 | 0.34 | |||||
| February 12, 2009 |
February 23, 2009 | March 30, 2009 | 0.32 | * | ||||
| May 7, 2009 |
May 15, 2009 | June 15, 2009 | 0.30 | |||||
| August 6, 2009 |
August 14, 2009 | September 14, 2009 | 0.30 | |||||
| October 15, 2009 |
October 20, 2009 | November 23, 2009 | 0.30 | |||||
| December 16, 2009 |
December 24, 2009 | December 30, 2009 | 0.04 | |||||
| February 11, 2010 |
February 19, 2010 | March 19, 2010 | 0.20 | |||||
| May 3, 2010 |
May 12, 2010 | June 18, 2010 | 0.20 | |||||
| August 2, 2010 |
August 12, 2010 | September 17, 2010 | 0.20 | |||||
| November 4, 2010 |
November 10, 2010 | December 17, 2010 | 0.20 | |||||
| March 1, 2011 |
March 10, 2011 | March 24, 2011 | 0.22 | |||||
| May 5, 2011 |
May 11, 2011 | June 23, 2011 | 0.22 | |||||
| August 4, 2011 |
August 15, 2011 | September 15, 2011 | 0.22 | |||||
| November 3, 2011 |
November 14, 2011 | November 29, 2011 | 0.22 | |||||
| February 27, 2012 |
March 12, 2012 | March 15, 2012 | 0.23 | |||||
| April 30, 2012 |
May 18, 2012 | May 25, 2012 | 0.24 | |||||
| July 30, 2012 |
August 17, 2012 | August 24, 2012 | 0.24 | |||||
| October 26, 2012 |
November 14, 2012 | November 21, 2012 | 0.24 | |||||
| February 26, 2013 |
March 11, 2013 | March 19, 2013 | 0.25 | |||||
|
|
|
|||||||
| $ | 7.89 | |||||||
|
|
|
|||||||
| * | Dividend paid in cash and stock. |
On February 26, 2013 the Board of Directors increased the quarterly dividend by $0.01, or approximately 4.02%, and declared a cash dividend of $0.25 per share to be paid on March 19, 2013 to shareholders of record as of March 11, 2013. This dividend would represent our thirtieth consecutive dividend declaration since our initial public offering, bringing the total cumulative dividend declared to date to $7.89 per share.
Our Board of Directors maintains a variable dividend policy with the objective of distributing four quarterly distributions in an amount that approximates 90—100% of our taxable quarterly income or potential annual income for a particular year. In addition, at the end of the year, we may also pay an additional special dividend or fifth dividend, such that we may distribute approximately all of our annual taxable income in the year it was earned, while maintaining the option to spill over our excess taxable income.
Distributions in excess of our current and accumulated earnings and profits generally would be treated first as a return of capital to the extent of the stockholder’s tax basis, and any remaining distributions would be treated as a capital gain. The determination of the tax attributes of our distributions is made annually as of the end of our fiscal year based upon its taxable income for the full year and distributions paid for the full year. Of the dividends declared during the year ended December 31, 2012 and 2011, 100% were distributions of ordinary income. There can be no certainty to stockholders that this determination is representative of what the tax attributes of our 2012 distributions to stockholders will actually be.
We maintain an “opt out” dividend reinvestment plan for our common stockholders. As a result, if we declare a dividend, cash dividends will be automatically reinvested in additional shares of our common stock unless you specifically “opt out” of the dividend reinvestment plan and choose to receive cash dividends. During 2012 and 2011, we issued approximately 219,000 and 167,000 shares, respectively, of common stock to shareholders in connection with the dividend reinvestment plan.
61
Table of Contents
PERFORMANCE GRAPH
The following stock performance graph compares the cumulative stockholder return assuming that, on December 31, 2007, a person invested $100 in each of our common stock, the NYSE Composite Index and the NASDAQ Financial 100 Index. The NYSE Composite Index was added this year because our common stock began trading on the NYSE in April 2012. The graph measures total shareholder return, which takes into account both changes in stock price and dividends. It assumes that dividends paid are reinvested in like securities.
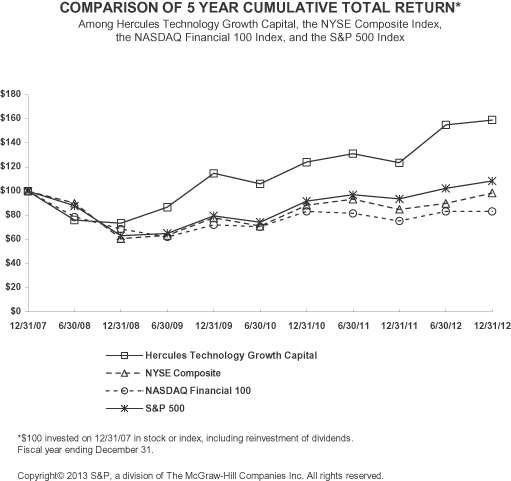
This graph and other information furnished under Part II. Item 5 of the Form 10-K shall not be deemed to be “soliciting material” or to be “filed” with the SEC or subject to Regulation 14A or 14C, or to the liabilities of Section 18 of the Securities Exchange Act of 1934. The stock price performance included in the above graph is not necessarily indicative of future stock price performance.
62
Table of Contents
| Item 6. | Selected Consolidated Financial Data |
Selected Consolidated Financial Data
The following consolidated financial data is derived from our audited consolidated financial statements. The selected consolidated financial data should be read in conjunction with “Management’s Discussion and Analysis of Financial Condition and Results of Operations” and the consolidated financial statements and related notes included elsewhere herein. Historical data is not necessarily indicative of results to be expected for any future period.
| As of December 31, 2012 | ||||||||||||||||||||
| ($ in thousands, except per share data) |
2012 | 2011 | 2010 | 2009 | 2008 | |||||||||||||||
| Balance sheet data: |
||||||||||||||||||||
| Investments, at value |
$ | 906,300 | $ | 652,870 | $ | 472,032 | $ | 374,669 | $ | 578,211 | ||||||||||
| Cash and cash equivalents |
182,994 | 64,474 | 107,014 | 124,828 | 17,242 | |||||||||||||||
| Total assets |
1,123,643 | 747,394 | 591,247 | 508,967 | 608,672 | |||||||||||||||
| Total liabilities |
607,675 | 316,353 | 178,716 | 142,452 | 226,214 | |||||||||||||||
| Total net assets |
515,968 | 431,041 | 412,531 | 366,515 | 382,458 | |||||||||||||||
| Other Data: |
||||||||||||||||||||
| Total debt investments, at value |
827,540 | 585,767 | 401,618 | 325,134 | 536,964 | |||||||||||||||
| Total warrant investments, at value |
29,550 | 30,045 | 23,690 | 14,450 | 17,883 | |||||||||||||||
| Total equity investments, at value |
49,210 | 37,058 | 46,724 | 35,085 | 23,364 | |||||||||||||||
| Unfunded Commitments |
61,851 | 168,196 | 117,200 | 11,700 | 82,000 | |||||||||||||||
| Net asset value per share(1) |
$ | 9.75 | $ | 9.83 | $ | 9.50 | $ | 10.29 | $ | 11.56 | ||||||||||
| (1) | Based on common shares outstanding at period end. |
| For the Years Ended December 31, | ||||||||||||||||||||
| (in thousands, except per share amounts) |
2012 | 2011 | 2010 | 2009 | 2008 | |||||||||||||||
| Investment income: |
||||||||||||||||||||
| Interest |
$ | 87,603 | $ | 70,346 | $ | 54,700 | $ | 62,200 | $ | 67,283 | ||||||||||
| Fees |
9,917 | 9,509 | 4,774 | 12,077 | 8,552 | |||||||||||||||
|
|
|
|
|
|
|
|
|
|
|
|||||||||||
| Total investment income |
97,520 | 79,855 | 59,474 | 74,277 | 75,835 | |||||||||||||||
| Operating expenses: |
||||||||||||||||||||
| Interest. |
19,835 | 13,252 | 8,572 | 9,387 | 13,121 | |||||||||||||||
| Loan fees |
3,917 | 2,635 | 1,259 | 1,880 | 2,649 | |||||||||||||||
| General and administrative |
8,108 | 7,992 | 7,086 | 7,281 | 6,899 | |||||||||||||||
| Employee Compensation: |
||||||||||||||||||||
| Compensation and benefits |
13,326 | 13,260 | 10,474 | 10,737 | 11,595 | |||||||||||||||
| Stock-based compensation |
4,227 | 3,128 | 2,709 | 1,888 | 1,590 | |||||||||||||||
|
|
|
|
|
|
|
|
|
|
|
|||||||||||
| Total employee compensation |
17,553 | 16,388 | 13,183 | 12,625 | 13,185 | |||||||||||||||
|
|
|
|
|
|
|
|
|
|
|
|||||||||||
| Total operating expenses |
49,413 | 40,267 | 30,100 | 31,173 | 35,854 | |||||||||||||||
| Net investment income before provision for income taxes and investment gains and losses |
48,107 | 39,588 | 29,374 | 43,104 | 39,981 | |||||||||||||||
| Provision for income taxes |
— | — | — | — | — | |||||||||||||||
|
|
|
|
|
|
|
|
|
|
|
|||||||||||
| Net investment income |
48,107 | 39,588 | 29,374 | 43,104 | 39,981 | |||||||||||||||
| Net realized gain (loss) on investments |
3,168 | 2,741 | (26,382 | ) | (30,801 | ) | 2,643 | |||||||||||||
| Provision for excise tax |
— | — | — | — | (203 | ) | ||||||||||||||
| Net increase in unrealized appreciation on investments |
(4,516 | ) | 4,607 | 1,990 | 1,269 | (21,426 | ) | |||||||||||||
|
|
|
|
|
|
|
|
|
|
|
|||||||||||
| Net realized and unrealized gain |
(1,348 | ) | 7,348 | (24,392 | ) | (29,532 | ) | (18,986 | ) | |||||||||||
|
|
|
|
|
|
|
|
|
|
|
|||||||||||
| Net increase in net assets resulting from operations |
$ | 46,759 | $ | 46,936 | $ | 4,982 | $ | 13,572 | $ | 20,995 | ||||||||||
|
|
|
|
|
|
|
|
|
|
|
|||||||||||
| Change in net assets per common share (basic): |
$ | 0.93 | $ | 1.08 | $ | 0.12 | $ | 0.38 | $ | 0.64 | ||||||||||
|
|
|
|
|
|
|
|
|
|
|
|||||||||||
| Cash dividends declared per common share |
$ | 0.95 | $ | 0.88 | $ | 0.80 | $ | 1.26 | $ | 1.32 | ||||||||||
|
|
|
|
|
|
|
|
|
|
|
|||||||||||
63
Table of Contents
| Item 7. | Management’s Discussion and Analysis of Financial Condition and Results of Operations |
FORWARD-LOOKING STATEMENTS
The matters discussed in this report, as well as in future oral and written statements by management of Hercules Technology Growth Capital, that are forward-looking statements are based on current management expectations that involve substantial risks and uncertainties which could cause actual results to differ materially from the results expressed in, or implied by, these forward-looking statements. Forward-looking statements relate to future events or our future financial performance. We generally identify forward-looking statements by terminology such as “may,” “will,” “should,” “expects,” “plans,” “anticipates,” “could,” “intends,” “target,” “projects,” “contemplates,” “believes,” “estimates,” “predicts,” “potential” or “continue” or the negative of these terms or other similar words. Important assumptions include our ability to originate new investments, achieve certain margins and levels of profitability, the availability of additional capital, and the ability to maintain certain debt to asset ratios. In light of these and other uncertainties, the inclusion of a projection or forward-looking statement in this report should not be regarded as a representation by us that our plans or objectives will be achieved. The forward-looking statements contained in this report include statements as to:
| • | our future operating results; |
| • | our business prospects and the prospects of our prospective portfolio companies; |
| • | the impact of investments that we expect to make; |
| • | the impact of a protracted decline in the liquidity of credit markets on our business; |
| • | our informal relationships with third parties including in the venture capital industry; |
| • | the expected market for venture capital investments and our addressable market; |
| • | the dependence of our future success on the general economy and its impact on the industries in which we invest; |
| • | our ability to access debt markets and equity markets; |
| • | the ability of our portfolio companies to achieve their objectives; |
| • | our expected financings and investments; |
| • | our regulatory structure and tax status; |
| • | our ability to operate as a BDC, a SBIC and a RIC; |
| • | the adequacy of our cash resources and working capital; |
| • | the timing of cash flows, if any, from the operations of our portfolio companies; |
| • | the timing, form and amount of any dividend distributions; |
| • | the impact of fluctuations in interest rates on our business; |
| • | the valuation of any investments in portfolio companies, particularly those having no liquid trading market; and |
| • | our ability to recover unrealized losses. |
For a discussion of factors that could cause our actual results to differ from forward-looking statements contained in this report, please see the discussion under “Item 1A. Risk Factors.” You should not place undue reliance on these forward-looking statements. The forward-looking statements made in this report relate only to events as of the date on which the statements are made. We undertake no obligation to update any forward-looking statement to reflect events or circumstances occurring after the date of this report.
64
Table of Contents
The following discussion should be read in conjunction with our consolidated financial statements and related notes and other financial information appearing elsewhere in this report. In addition to historical information, the following discussion and other parts of this report contain forward-looking information that involves risks and uncertainties. Our actual results could differ materially from those anticipated by such forward-looking information due to the factors discussed under “Item 1A—Risk Factors” and “Forward-Looking Statements” of this Item 7.
Overview
We are a specialty finance company focused on providing senior secured loans to venture capital-backed companies in technology-related markets, including technology, biotechnology, life science, and clean-technology industries at all stages of development. We source our investments through our principal office located in Silicon Valley, as well as through its additional offices in Boston, MA, Boulder, CO and McLean, VA.
Our goal is to be the leading structured debt financing provider of choice for venture capital-backed companies in technology-related markets requiring sophisticated and customized financing solutions. Our strategy is to evaluate and invest in a broad range of technology-related markets including technology, biotechnology, life science, and clean-technology industries and to offer a full suite of growth capital products up and down the capital structure. We invest primarily in structured debt with warrants and, to a lesser extent, in senior debt and equity investments. We use the term “structured debt with warrants” to refer to any debt investment, such as a senior or subordinated secured loan, that is coupled with an equity component, including warrants, options or rights to purchase common or preferred stock. Our structured debt with warrants investments will typically be secured by some or all of the assets of the portfolio company.
Our investment objective is to maximize our portfolio total return by generating current income from our debt investments and capital appreciation from our equity-related investments. Our primary business objectives are to increase our net income, net operating income and net asset value by investing in structured debt with warrants and equity of venture capital-backed companies in technology-related markets with attractive current yields and the potential for equity appreciation and realized gains. Our structured debt investments typically include warrants or other equity interests, giving us the potential to realize equity-like returns on a portion of our investments. Our equity ownership in our portfolio companies may represent a controlling interest. In some cases, we receive the right to make additional equity investments in our portfolio companies in connection with future equity financing rounds. Capital that we provide directly to venture capital-backed companies in technology-related markets is generally used for growth and general working capital purposes as well as in select cases for acquisitions or recapitalizations.
We are an internally managed, non-diversified closed-end investment company that has elected to be regulated as a business development company under the 1940 Act. As a business development company, we are required to comply with certain regulatory requirements. For instance, we generally have to invest at least 70% of our total assets in “qualifying assets,” including securities of private U.S. companies, cash, cash equivalents, and high-quality debt investments that mature in one year or less.
From incorporation through December 31, 2005, we were taxed as a corporation under Subchapter C of the Internal Revenue Code, or the Code. As of January 1, 2006, we have elected to be treated for federal income tax purposes as a regulated investment company, or a RIC, under Subchapter M of the Code. Pursuant to this election, we generally will not have to pay corporate-level taxes on any income that we distribute to our stockholders. However, such an election and qualification to be treated as a RIC requires that we comply with certain requirements contained in Subchapter M of the Code. For example, a RIC must meet certain requirements, including source-of income, asset diversification and income distribution requirements. The income source requirement mandates that we receive 90% or more of our income from qualified earnings, typically referred to as “good income.”
65
Table of Contents
Our portfolio is comprised of, and we anticipate that our portfolio will continue to be comprised of, investments primarily in technology-related companies at various stages of their development. Consistent with regulatory requirements, we invest primarily in United States based companies and to a lesser extent in foreign companies.
We regularly engage in discussions with third parties in respect of various potential transactions. We may acquire an investment or a portfolio of investments or an entire company or sell a portion of our portfolio on an opportunistic basis. We or our subsidiaries may also agree to manage certain other funds that invest in debt, equity or provide other financing or services to companies in a variety of industries for which we may earn management or other fees for our services. We may also invest in the equity of these funds, along with other third parties, from which we would seek to earn a return and/or future incentive allocations. Some of these transactions could be material to our business. Consummation of any such transaction will be subject to completion of due diligence, finalization of key business and financial terms (including price) and negotiation of final definitive documentation as well as a number of other factors and conditions including, without limitation, the approval of our board of directors and required regulatory or third party consents and, in certain cases, the approval of our stockholders. Accordingly, there can be no assurance that any such transaction would be consummated. Any of these transactions or funds may require significant management resources either during the transaction phase or on an ongoing basis depending on the terms of the transaction.
Portfolio and Investment Activity
The total fair value of our investment portfolio was $906.3 million at December 31, 2012 as compared to $652.9 million at December 31, 2011.
The fair value of the loan portfolio at December 31, 2012 was approximately $827.5 million, compared to a fair value of approximately $585.8 million at December 31, 2011. The fair value of the equity portfolio at December 31, 2012 and 2011 was approximately $49.2 million and $37.1 million, respectively. The fair value of our warrant portfolio at December 31, 2012 and 2011 was approximately $29.5 million and $30.0 million, respectively.
66
Table of Contents
Portfolio Activity
Our investments in portfolio companies take a variety of forms, including unfunded contractual commitments and funded investments. From time to time, unfunded contractual commitments are dependent upon a portfolio company reaching certain milestones before the debt commitment is available to the portfolio company. These commitments will be subject to the same underwriting and ongoing portfolio maintenance as the on-balance sheet financial instruments that we hold. Debt commitments generally fund over the two succeeding quarters from close. Not all debt investments represent our future cash requirements. Similarly, unfunded contractual commitments may expire without being drawn and do not represent our future cash requirements.
Prior to entering into a contractual commitment, we generally issue a non-binding term sheet to a prospective portfolio company. Non-binding terms sheets are subject to completion of our due diligence and final approval process, as well as the negotiation of definitive documentation with the prospective portfolio companies. Not all non-binding term sheets are expected to close and do not necessarily represent our future cash requirements.
Our portfolio activity for the years ended December 31, 2012 and 2011 was comprised of the following:
| Year Ended December 31, |
||||||||
| (in millions) |
2012 | 2011 | ||||||
| Debt Commitments(1) |
||||||||
| New portfolio company |
$ | 362.3 | $ | 402.5 | ||||
| Existing portfolio company |
274.3 | 225.8 | ||||||
|
|
|
|
|
|||||
| Total |
$ | 636.6 | $ | 628.3 | ||||
| Funded Debt Investments |
||||||||
| New portfolio company |
$ | 267.9 | $ | 338.7 | ||||
| Existing portfolio company |
191.4 | 94.7 | ||||||
|
|
|
|
|
|||||
| Total |
$ | 459.3 | $ | 433.4 | ||||
| Funded Equity Investments |
||||||||
| New portfolio company |
$ | 6.0 | $ | — | ||||
| Existing portfolio company |
3.7 | 2.1 | ||||||
|
|
|
|
|
|||||
| Total |
$ | 9.7 | $ | 2.1 | ||||
| As of December 31, |
||||||||
| 2012 | 2011 | |||||||
| Unfunded Contractual Commitments(2) | ||||||||
| Total |
$ | 61.9 | $ | 168.2 | ||||
|
|
|
|
|
|||||
| Non-Binding Term Sheets |
||||||||
| New portfolio company |
$ | 70.0 | $ | 82.5 | ||||
| Existing portfolio company |
— | — | ||||||
|
|
|
|
|
|||||
| Total |
$ | 70.0 | $ | 82.5 | ||||
| (1) | Includes restructured loans. |
| (2) | Includes unfunded contractual commitments in 21 new and existing portfolio companies. Approximately $35.6 million of these unfunded origination activity commitments as of December 31, 2012 are dependent upon the portfolio company reaching certain milestones before the debt commitment becomes available. |
We receive payments in our loan portfolio based on scheduled amortization of the outstanding balances. In addition, we receive repayments of some of our loans prior to their scheduled maturity date. The frequency or volume of these repayments may fluctuate significantly from period to period. During the year ended December 31, 2012, we received normal principal amortization repayments of approximately $120.7 million, and early repayments and working line of credit pay-downs of approximately $125.1 million. During the year ended December 31, 2012, we restructured certain debt investments for approximately $85.0 million and converted approximately $669,000 of debt to equity.
67
Table of Contents
Total portfolio investment activity (inclusive of unearned income) as of and for each of the years ended December 31, 2012 and 2011 was as follows:
| (in millions) |
December 31, 2012 |
December 31, 2011 |
||||||
| Beginning Portfolio |
$ | 652.9 | $ | 472.0 | ||||
| New Fundings |
469.9 | 433.8 | ||||||
| Warrants not related to current period fundings |
(0.2 | ) | 1.5 | |||||
| Principal payments received on investments |
(120.7 | ) | 16.1 | |||||
| Early payoffs |
(125.1 | ) | (65.2 | ) | ||||
| Restructure payoffs |
(48.5 | ) | (182.1 | ) | ||||
| Restructure fundings |
85.0 | (16.1 | ) | |||||
| Accretion of loan discounts and paid-in-kind principal |
21.3 | 17.0 | ||||||
| New loan fees |
(12.8 | ) | (10.4 | ) | ||||
| Conversion of “Other Assets” |
9.6 | 0.2 | ||||||
| Debt Converted to Equity |
0.6 | — | ||||||
| Proceeds from sale of investments |
(7.2 | ) | (20.6 | ) | ||||
| Net realized (loss) gain on investments |
(14.1 | ) | 2.1 | |||||
| Net change in unrealized appreciation (depreciation) |
(4.4 | ) | 4.6 | |||||
|
|
|
|
|
|||||
| Ending Portfolio |
$ | 906.3 | $ | 652.9 | ||||
|
|
|
|
|
|||||
The following table shows the fair value of our portfolio of investments by asset class as of December 31, 2012 and December 31, 2011 (excluding unearned income).
| December 31, 2012 | December 31, 2011 | |||||||||||||||
| (in thousands) |
Investments at
Fair Value |
Percentage of
Total Portfolio |
Investments at
Fair Value |
Percentage of
Total Portfolio |
||||||||||||
| Senior secured debt with warrants |
$ | 652,041 | 72.0 | % | $ | 482,268 | 73.9 | % | ||||||||
| Senior secured debt |
205,049 | 22.6 | % | 133,544 | 20.4 | % | ||||||||||
| Preferred stock |
33,885 | 3.7 | % | 30,181 | 4.6 | % | ||||||||||
| Common Stock |
15,325 | 1.7 | % | 6,877 | 1.1 | % | ||||||||||
|
|
|
|
|
|
|
|
|
|||||||||
| $ | 906,300 | 100.0 | % | $ | 652,870 | 100.0 | % | |||||||||
|
|
|
|
|
|
|
|
|
|||||||||
A summary of our investment portfolio at value by geographic location is as follows:
| December 31, 2012 | December 31, 2011 | |||||||||||||||
| (in thousands) |
Investments at
Fair Value |
Percentage of
Total Portfolio |
Investments at
Fair Value |
Percentage of
Total Portfolio |
||||||||||||
| United States |
$ | 901,041 | 99.4 | % | $ | 634,736 | 97.2 | % | ||||||||
| England |
5,259 | 0.6 | % | 8,266 | 1.3 | % | ||||||||||
| Iceland |
— | — | 4,970 | 0.7 | % | |||||||||||
| Ireland |
— | — | 3,842 | 0.6 | % | |||||||||||
| Canada |
— | — | 672 | 0.1 | % | |||||||||||
| Israel |
— | — | 384 | 0.1 | % | |||||||||||
|
|
|
|
|
|
|
|
|
|||||||||
| $ | 906,300 | 100.0 | % | $ | 652,870 | 100.0 | % | |||||||||
|
|
|
|
|
|
|
|
|
|||||||||
As of December 31, 2012, we held warrants or equity positions in two companies which have filed registration statements on Form S-1 with the SEC in contemplation of potential initial public offerings. There can be no assurance that these companies will complete their initial public offering in a timely manner or at all.
Changes in Portfolio
We generate revenue in the form of interest income, primarily from our investments in debt securities, and commitment and facility fees. Fees generated in connection with our debt investments are recognized over the life of the loan or, in some cases, recognized as earned. In addition, we generate revenue in the form of capital gains, if any, on warrants or other equity-related securities that we acquire from our portfolio companies. Our investments generally range from $1.0 million to $25.0 million. Our debt investments have a term of between
68
Table of Contents
two and seven years and typically bear interest at a rate ranging from Prime to approximately 14.0% as of December 31, 2012. In addition to the cash yields received on our loans, in some instances, our loans may also include any of the following: end-of-term payments, exit fees, balloon payment fees, commitment fees, success fees, PIK provisions or prepayment fees which may be required to be included in income prior to receipt. Loan origination and commitment fees received in full at the inception of a loan are deferred and amortized into fee income as an enhancement to the related loan’s yield over the contractual life of the loan. We recognize nonrecurring fees amortized over the remaining term of the loan commencing in the quarter relating to specific loan modifications. Loan exit fees to be paid at the termination of the loan are accreted into interest income over the contractual life of the loan. We had approximately $2.0 million and $4.5 million of unamortized fees at December 31, 2012 and December 31, 2011, respectively, and approximately $6.8 million and $4.4 million in exit fees receivable at December 31, 2012 and December 31, 2011, respectively.
We have loans in our portfolio that contain a PIK provision. The PIK interest, computed at the contractual rate specified in each loan agreement, is added to the principal balance of the loan and recorded as interest income. To maintain our status as a RIC, this non-cash source of income must be paid out to stockholders in the form of dividends even though we have not yet collected the cash. Amounts necessary to pay these dividends may come from available cash or the liquidation of certain investments. We recorded approximately $1.5 million and $1.7 million in PIK income in the twelve month periods ended December 31, 2012 and 2011.
In some cases, we may collateralize our investments by obtaining a first priority security interest in a portfolio company’s assets, which may include their intellectual property. In other cases, we may obtain a negative pledge covering a company’s intellectual property.
At December 31, 2012, approximately 62.4% of our portfolio company loans were secured by a first priority security in all of the assets of the portfolio company, 36.0% of the loans were to portfolio companies that were prohibited from pledging or encumbering their intellectual property and 1.6% of portfolio company loans had an equipment only lien.
Interest on debt securities is generally payable monthly, with amortization of principal typically occurring over the term of the security for emerging-growth, expansion-stage and established-stage companies. In addition, certain loans may include an interest-only period ranging from three to eighteen months for emerging-growth and expansion-stage companies and longer for established-stage companies. In limited instances in which we choose to defer amortization of the loan for a period of time from the date of the initial investment, the principal amount of the debt securities and any accrued but unpaid interest become due at the maturity date.
The effective yield on our debt investments during the year was 14.37% and was attributed in part to interest charges and fees related to loan restructurings and acceleration of fee income recognition from early loan repayments. The overall weighted average yield to maturity of our loan investments was approximately 12.91% at December 31, 2012, a slight increase compared to 12.64% at December 31, 2011. The weighted average yield to maturity is computed using the interest rates in effect at the inception of each of the loans, and includes amortization of the loan facility fees, commitment fees and market premiums or discounts over the expected life of the debt investments, weighted by their respective costs when averaged and based on the assumption that all contractual loan commitments have been fully funded and held to maturity.
Portfolio Composition
Our portfolio companies are primarily privately held companies which are active in the drug discovery and development, internet consumer and business services, clean technology, software, drug delivery, medical device and equipment, media/content/info, communications and networking, information services, healthcare services, diagnostic, specialty pharmaceuticals, biotechnology tools, surgical devices, consumer and business products, semiconductors, electronics and computer hardware and therapeutic industry sectors. These sectors are characterized by high margins, high growth rates, consolidation and product and market extension opportunities. Value is often vested in intangible assets and intellectual property.
69
Table of Contents
As of December 31, 2012, approximately 65.8% of the fair value of our portfolio was composed of investments in five industries: 20.8% was composed of investments in the drug discovery and development industry, 15.0% was composed of investments in the internet consumer and business services industry, 14.0% was composed of investments in the clean technology industry, 8.2% was composed of investments in the drug delivery industry and 7.8% was composed of investments in the software industry.
The following table shows the fair value of our portfolio by industry sector at December 31, 2012 and December 31, 2011:
| December 31, 2012 | December 31, 2011 | |||||||||||||||
| (in thousands) |
Investments at Fair Value |
Percentage of Total Portfolio |
Investments at Fair Value |
Percentage of Total Portfolio |
||||||||||||
| Drug Discovery & Development |
$ | 188,479 | 20.8 | % | $ | 131,428 | 20.1 | % | ||||||||
| Internet Consumer & Business Services |
136,149 | 15.0 | % | 117,542 | 18.0 | % | ||||||||||
| Clean Technology |
126,600 | 14.0 | % | 64,587 | 9.9 | % | ||||||||||
| Drug Delivery |
74,218 | 8.2 | % | 62,665 | 9.6 | % | ||||||||||
| Software |
70,838 | 7.8 | % | 27,850 | 4.3 | % | ||||||||||
| Medical Device & Equipment |
54,575 | 6.0 | % | — | 0.0 | % | ||||||||||
| Information Services |
53,523 | 5.9 | % | 45,850 | 7.0 | % | ||||||||||
| Media/Content/Info |
51,534 | 5.7 | % | 38,476 | 5.9 | % | ||||||||||
| Communications & Networking |
37,560 | 4.1 | % | 28,618 | 4.4 | % | ||||||||||
| Healthcare Services, Other |
36,481 | 4.0 | % | — | 0.0 | % | ||||||||||
| Diagnostic |
16,307 | 1.8 | % | 15,158 | 2.3 | % | ||||||||||
| Consumer & Business Products |
13,723 | 1.5 | % | 4,186 | 0.6 | % | ||||||||||
| Electronics & Computer Hardware |
12,715 | 1.4 | % | 1,223 | 0.2 | % | ||||||||||
| Specialty Pharma |
12,473 | 1.4 | % | 39,384 | 6.0 | % | ||||||||||
| Surgical Devices |
11,358 | 1.3 | % | 11,566 | 1.8 | % | ||||||||||
| Biotechnology Tools |
6,845 | 0.8 | % | 18,693 | 2.9 | % | ||||||||||
| Semiconductors |
2,922 | 0.3 | % | 9,733 | 1.5 | % | ||||||||||
| Therapeutic |
— | — | 35,911 | 5.5 | % | |||||||||||
|
|
|
|
|
|
|
|
|
|||||||||
| $ | 906,300 | 100.0 | % | $ | 652,870 | 100.0 | % | |||||||||
|
|
|
|
|
|
|
|
|
|||||||||
Industry and sector concentrations vary as new loans are recorded and loans pay off. Loan revenue, consisting of interest, fees, and recognition of gains on equity interests, can fluctuate dramatically when a loan is paid off or a related warrant or equity interest is sold. Revenue recognition in any given year can be highly concentrated among several portfolio companies.
For the years ended December 31, 2012 and 2011, our ten largest portfolio companies represented approximately 35.2% and 37.9% of the total fair value of our investments in portfolio companies, respectively. At December 31, 2012 and 2011, we had eight and seven investments, respectively, that represented 5% or more of our net assets. At December 31, 2012, we had six equity investments representing approximately 70.9% of the total fair value of our equity investments, and each represented 5% or more of the total fair value of our equity investments. At December 31, 2011, we had seven equity investments which represented approximately 63.8% of the total fair value of our equity investments, and each represented 5% or more of the total fair value of such investments.
As of December 31, 2012, over 98.4% of our debt investments were in a senior secured first lien position, and more than 98.5% of the debt investment portfolio was priced at floating interest rates or floating interest rates with a Prime or LIBOR based interest rate floor. As a result, we believe we are well positioned to benefit should market rates increase. Our investments in senior secured debt with warrants have equity enhancement features, typically in the form of warrants or other equity-related securities designed to provide us with an opportunity for capital appreciation. Our warrant coverage generally ranges from 3% to 20% of the principal amount invested in a portfolio company, with a strike price equal to the most recent equity financing round. As of December 31, 2012, we held warrants in 116 portfolio companies, with a fair value of approximately $29.5 million. The fair value of the warrant portfolio has decreased by approximately 1.7% as compared to the fair value of $30.0 million at December 31, 2011. These warrant holdings would require us to invest approximately $71.2 million to exercise such warrants. Warrants may appreciate or depreciate in value depending largely upon the underlying portfolio company’s performance and overall market conditions. Of the warrants which have monetized since
70
Table of Contents
inception, we have realized warrant gain multiples in the range of approximately 1.04x to 10.20x based on the historical rate of return on our investments. However, these warrants may not appreciate in value and, in fact, may decline in value. Accordingly, we may not be able to realize gains from our warrant interests.
As required by the 1940 Act, the Company classifies its investments by level of control. “Control investments” are defined in the 1940 Act as investments in those companies that the Company is deemed to “control”. Generally, under the 1940 Act, the Company is deemed to “control” a company in which it has invested if it owns 25% or more of the voting securities of such company or has greater than 50% representation on its board. “Affiliate investments” are investments in those companies that are “affiliated companies” of the Company, as defined in the 1940 Act, which are not control investments. The Company is deemed to be an “affiliate” of a company in which it has invested if it owns 5% or more but less than 25% of the voting securities of such company. “Non-control/non-affiliate investments” are investments that are neither control investments nor affiliate investments.
The following table summarizes our realized and unrealized gain and loss and changes in our unrealized appreciation and depreciation on control and affiliate investments for the years ended December 31, 2012 and December 31, 2011:
| (in thousands) | Year Ended December 31, 2012 |
|||||||||||||||||||||
| Portfolio Company |
Type | Fair Value at December 31, 2012 |
Investment Income |
Unrealized (Depreciation)/ Appreciation |
Reversal
of Unrealized (Depreciation)/ Appreciation |
Realized Gain/(Loss) |
||||||||||||||||
| E-Band Communications, Corp. |
Non-Controlled Affiliate | $ | — | $ | 4 | $ | 18 | $ | — | $ | — | |||||||||||
| Gelesis, Inc |
Non-Controlled Affiliate | 1,665 | 712 | (672 | ) | — | — | |||||||||||||||
| Optiscan BioMedical, Corp. |
Non-Controlled Affiliate | 10,207 | 1,649 | 2,722 | — | — | ||||||||||||||||
|
|
|
|
|
|
|
|
|
|
|
|||||||||||||
| Total |
$ | 11,872 | $ | 2,365 | $ | 2,068 | $ | — | $ | — | ||||||||||||
|
|
|
|
|
|
|
|
|
|
|
|||||||||||||
| (in thousands) |
Year Ended December 31, 2011 |
|||||||||||||||||||||
| Portfolio Company |
Type | Fair Value at December 31, 2011 |
Investment Income |
Unrealized (Depreciation)/ Appreciation |
Reversal
of Unrealized (Depreciation)/ Appreciation |
Realized Gain/(Loss) |
||||||||||||||||
| MaxVision Holding, LLC |
Control | $ | 1,027 | $ | 889 | $ | (5,158 | ) | $ | — | $ | — | ||||||||||
| E-Band Communications, Corp. |
Non-Controlled Affiliate | — | 14 | (3,425 | ) | — | — | |||||||||||||||
|
|
|
|
|
|
|
|
|
|
|
|||||||||||||
| Total |
$ | 1,027 | $ | 903 | $ | (8,583 | ) | $ | — | $ | — | |||||||||||
|
|
|
|
|
|
|
|
|
|
|
|||||||||||||
At December 31, 2012, the Company did not hold any Control Investments. The Company’s investment in MaxVision Holding, L.L.C., a company that was a Control Investment as of December 31, 2011, was liquidated during the year ended December 31, 2012. On July 31, 2012, the Company received payment of $2.0 million for its total debt investments in Maxvision Holding, L.L.C. Approximately $8.7 million of realized losses and $10.5 million of net change in unrealized appreciation was recognized on this control debt and equity investment during the year ended December 31, 2012.
Portfolio Grading
We use an investment grading system, which grades each debt investment on a scale of 1 to 5, to characterize and monitor our expected level of risk on the debt investments in our portfolio with 1 being the highest quality. See “Item 1. Business—Investment Process—Loan and Compliance Administration.” The following table shows the distribution of our outstanding debt investments on the 1 to 5 investment grading scale at fair value as of December 31, 2012 and 2011, respectively:
71
Table of Contents
| December 31, 2012 | December 31, 2011 | |||||||||||||||
| (in thousands) |
Investments at Fair Value |
Percentage of Total Portfolio |
Investments at Fair Value |
Percentage of Total Portfolio |
||||||||||||
| Investment Grading |
||||||||||||||||
|
1 |
$ | 134,166 | 16.2 | % | $ | 104,516 | 17.8 | % | ||||||||
|
2 |
542,885 | 65.6 | % | 403,114 | 68.8 | % | ||||||||||
|
3 |
127,560 | 15.4 | % | 70,388 | 12.0 | % | ||||||||||
|
4 |
22,929 | 2.8 | % | 6,722 | 1.2 | % | ||||||||||
|
5 |
— | — | 1,027 | 0.2 | % | |||||||||||
|
|
|
|
|
|
|
|
|
|||||||||
| $ | 827,540 | 100.0 | % | $ | 585,767 | 100.0 | % | |||||||||
|
|
|
|
|
|
|
|
|
|||||||||
As of December 31, 2012, our investments had a weighted average investment grading of 2.06 as compared to 2.01 at December 31, 2011. Our policy is to lower the grading on our portfolio companies as they approach the point in time when they will require additional equity capital. Additionally, we may downgrade our portfolio companies if they are not meeting our financing criteria and their respective business plans. Various companies in our portfolio will require additional funding in the near term or have not met their business plans and have therefore been downgraded until their funding is complete or their operations improve. At December 31, 2012, nine portfolio companies were graded 1, 52 portfolio companies were graded 2, 16 portfolio companies were graded 3, five portfolio companies were graded 4, and one portfolio company was graded 5 as compared to 43, 12, two and two portfolio companies, respectively, at December 31, 2011.
At December 31, 2012, we had one loan on non-accrual with no fair market value compared to one loan at December 31, 2011 with a fair value of approximately $1.0 million.
Results of Operations
Comparison of periods ended December 31, 2012 and 2011
Investment Income
Interest income totaled approximately $87.6 million and $70.3 million for 2012 and 2011, respectively. Income from commitment, facility and loan related fees totaled approximately $9.9 million 2012, compared with $9.5 million for 2011. The increase in interest income was directly related to an increase in the average investment portfolio outstanding in 2012 than in 2011.
In 2012 and 2011, interest income included approximately $8.4 million and $7.4 million of income from exit fees, respectively. The year over year increase is attributed to an increase in early payoffs for the year ended December 31, 2012 and an increase in the average investment portfolio outstanding in 2012 than in 2011.
At December 31, 2012 and 2011, we had approximately $11.4 million and $10.3 million of deferred income related to commitment, facility and loan related fees, respectively. The increase in deferred income was attributed to increased investment originations in 2012.
The following table shows the PIK-related activity for the years ended December 31, 2012 and 2011, at
cost:
| Years ended December 31, |
||||||||
| (in thousands) |
2012 | 2011 | ||||||
| Beginning PIK loan balance |
$ | 2,041 | $ | 3,955 | ||||
| PIK interest capitalized during the period |
1,400 | 2,093 | ||||||
| Payments received from PIK loans |
(132 | ) | (3,567 | ) | ||||
| PIK converted to other securities |
— | (440 | ) | |||||
|
|
|
|
|
|||||
| Ending PIK loan balance |
$ | 3,309 | $ | 2,041 | ||||
|
|
|
|
|
|||||
72
Table of Contents
The decrease in payments received from PIK loans and PIK interest capitalized during the year ended December 31, 2012 is due to approximately $1.4 million, $1.0 million, $493,000, $302,000, and $268,000 of PIK collected in conjunction with the sale of our investment in Infologix, Inc. and the early payoffs of IPA Holdings, LLC., Unify Corporation, HighJump Acquisition, LLC., and Velocity Technology Solutions, Inc., respectively, in the year ended December 31, 2011. The decrease in PIK converted to other securities during the year December 31, 2012 is due to approximately $440,000 related to the conversion of MaxVision Holding, LLC. debt to equity during the year ended December 31, 2011.
In certain investment transactions, we may provide advisory services. For services that are separately identifiable and external evidence exists to substantiate fair value, income is recognized as earned, which is generally when the investment transaction closes. We had no income from advisory services during the year ended December 31, 2012.
Operating Expenses
Operating expenses, which are comprised of interest and fees on borrowings, general and administrative and employee compensation, totaled approximately $49.4 million and $40.3 million during the periods ended December 31, 2012 and 2011, respectively.
Interest and fees on borrowings totaled approximately $23.8 million and $15.9 million during the periods ended December 31, 2012 and 2011, respectively. This $7.9 million year over year increase is largely attributed to $1.6 million of incremental interest and fee expense due to the Convertible Senior Notes issued on April 15, 2011 and $5.6 million related to the 2019 Notes. Additionally, we incurred approximately $577,000 of non cash interest expense during the period ended December 31, 2012 attributed to the accretion of the fair value of the conversion feature on the Convertible Senior Notes. We had a weighted average cost of debt comprised of interest and fees of approximately 6.58% at December 31, 2012, as compared to 6.23% as of December 31, 2011.
General and administrative expenses include legal fees, consulting fees, accounting fees, printer fees, insurance premiums, rent, workout and various other expenses. Expenses increased to $8.1 million from $8.0 million for the periods ended December 31, 2012 and 2011, respectively.
Employee compensation and benefits totaled approximately $13.3 million during both the periods ended December 31, 2012 and 2011. Stock-based compensation totaled approximately $4.2 million and $3.1 million during the periods ended December 31, 2012 and 2011, respectively. This increase was due primarily to the expense on restricted stock grants of approximately 672,000 shares issued in the first quarter of 2012.
Net Investment Income Before Income Tax Expense and Investment Gains and Losses
Net investment income before income tax expense for the year ended December 31, 2012 totaled $48.1 million as compared with a net investment income before income tax expense in 2011 of approximately $39.6 million. The changes are made up of the items described above under “Investment Income” and “Operating Expenses.”
Net Investment Realized Gains and Losses and Unrealized Appreciation and Depreciation
Realized gains or losses are measured by the difference between the net proceeds from the repayment or sale and the cost basis of the investment without regard to unrealized appreciation or depreciation previously recognized, and includes investments charged off during the period, net of recoveries. Net change in unrealized appreciation or depreciation primarily reflects the change in portfolio investment values during the reporting period, including the reversal of previously recorded unrealized appreciation or depreciation when gains or losses are realized.
73
Table of Contents
A summary of realized gains and losses for the years ended December 31, 2012 and 2011 is as follows:
| December 31, | ||||||||
| (in thousands) |
2012 | 2011 | ||||||
| Realized gains |
$ | 17,481 | $ | 11,092 | ||||
| Realized losses |
(14,313 | ) | (8,351 | ) | ||||
|
|
|
|
|
|||||
| Net realized gains (losses) |
$ | 3,168 | $ | 2,741 | ||||
|
|
|
|
|
|||||
During the year ended December 31, 2012, we recognized gross realized gains of approximately $17.5 million and gross realized losses of approximately $14.3 million, respectively, on the portfolio. During the year ended December 31, 2012, we recorded realized gains of approximately $5.1 million, $3.1 million, $2.6 million, $2.4 million and $2.4 million from the sale of our investments in NEXX Systems, BARRX Medical, Inc., DeCode Genetics, Aegerion Pharmaceuticals, and Annie’s, respectively. These gains were partially offset by the liquidation of our investments in MaxVision Holding, L.L.C, Razorgator Interactive Group, Zeta Interactive Corporation and Magi.com (pka Hi5 Networks, Inc.), of approximately $8.7 million, $2.2 million, $672,000 and $463,000, respectively.
During the year ended December 31, 2011 we recognized total gross realized gains of approximately $11.1 million primarily due to the sale of warrants and equity investments in three portfolio companies. We recognized gross realized losses in 2011 of approximately $8.4 million on the disposition of investments in 13 portfolio companies.
The net unrealized appreciation and depreciation of our investments is based on fair value of each investment determined in good faith by our Board of Directors. The following table itemizes the change in net unrealized appreciation/depreciation of investments for the years ended December 31, 2012 and 2011:
| December 31, | ||||||||
| (in thousands) |
2012 | 2011 | ||||||
| Gross unrealized appreciation on portfolio investments |
$ | 65,871 | $ | 58,980 | ||||
| Gross unrealized depreciation on portfolio investments |
(73,158 | ) | (49,327 | ) | ||||
| Reversal of prior period net unrealized appreciation upon a realization event |
(12,575 | ) | (13,224 | ) | ||||
| Reversal of prior period net unrealized depreciation upon a realization event |
14,944 | 8,395 | ||||||
| Citigroup Warrant Participation |
402 | (217 | ) | |||||
|
|
|
|
|
|||||
| Net unrealized appreciation (depreciation) on portfolio investments |
$ | (4,516 | ) | $ | 4,607 | |||
|
|
|
|
|
|||||
During the year ended December 31, 2012, we recorded approximately $4.5 million of net unrealized depreciation from our debt, equity and warrant investments. Approximately $1.3 million is attributed to net unrealized appreciation on equity, of which approximately $6.0 million is due to the reversal of prior period net unrealized appreciation upon being realized as a gain and $5.7 million is due to the reversal of prior period net unrealized depreciation upon being realized as a loss.
We recorded approximately $3.4 million and $2.3 million of net unrealized depreciation on our warrant and debt investments, respectively, of which approximately $6.6 million is due to the reversal of prior period net unrealized appreciation upon being realized as a gain and $9.2 million is due to the reversal of prior period net unrealized depreciation upon being realized as a loss.
During the year ended December 31, 2012, net unrealized investment appreciation recognized by the Company was reduced by approximately $402,000 due to the warrant participation agreement with Citigroup.
During the year ended December 31, 2011 net change in unrealized appreciation totaled approximately $4.6 million from debt, warrant and equity investments. Approximately $9.0 million was due to net unrealized appreciation on debt investments attributable to reversal of unrealized depreciation to realized loss of approximately $5.0 million on one technology debt investment and due to the reversal of unrealized depreciation
74
Table of Contents
of approximately $3.1 million on one life science debt investment as a result of improvements at the portfolio company. Approximately $5.8 million of net unrealized depreciation on equity investments during the year ended December 31, 2011, was primarily attributable to the sale of InfoLogix, Inc. resulting in the reversal of $7.7 million of unrealized appreciation on equity investments to realized gains offset by approximately $1.9 million of net appreciation due to net increases in private and public portfolio company valuations.
The following table itemizes the change in net unrealized appreciation/(depreciation) in the investment portfolio by category for the year ended December 31, 2012.
| Year Ended December 31, 2012 | ||||||||||||||||||||
| (in millions) |
Loans | Equity | Warrants | Other Assets |
Total | |||||||||||||||
| Collateral based impairments |
$ | (11.4 | ) | $ | (2.1 | ) | $ | (1.2 | ) | $ | — | $ | (14.7 | ) | ||||||
| Reversals of Prior Period Collateral based impairments |
10.0 | 0.5 | 0.7 | — | 11.2 | |||||||||||||||
| Reversals due to Loan Payoffs & Warrant/Equity sales |
7.0 | (0.3 | ) | (5.0 | ) | (0.5 | ) | 1.6 | ||||||||||||
| Fair Value Market/Yield Adjustments* |
||||||||||||||||||||
| Level 1 & 2 Assets |
— | (6.5 | ) | 1.9 | — | (4.6 | ) | |||||||||||||
| Level 3 Assets |
(7.9 | ) | 9.7 | 0.2 | — | 1.6 | ||||||||||||||
|
|
|
|
|
|
|
|
|
|
|
|||||||||||
| Total Fair Value Market/Yield Adjustments |
(7.9 | ) | 3.2 | 2.1 | — | (3.0 | ) | |||||||||||||
|
|
|
|
|
|
|
|
|
|
|
|||||||||||
| Net Unrealized Appreciation/(Depreciation) |
$ | (2.3 | ) | $ | 1.3 | $ | (3.4 | ) | $ | (0.5 | ) | $ | (4.9 | ) | ||||||
|
|
|
|
|
|
|
|
|
|
|
|||||||||||
| * | Level 1 assets are generally equities listed in active markets and level 2 assets are generally warrants held in a public company. Observable market prices are typically the primary input in valuing level 1 and 2 assets. Level 3 asset valuations require inputs that are both significant and unobservable. Generally, level 3 assets are debt investments and warrants and equities held in a private company. See Note 2 to the financial statements discussing ASC 820. |
During the year ended December 31, 2012, we recorded approximately $7.9 million net unrealized depreciation on our debt investments related to fluctuations in current market interest rates.
Income and Excise Taxes
We account for income taxes in accordance with the provisions of ASC 740, Income Taxes, which requires that deferred income taxes be determined based upon the estimated future tax effects of differences between the financial statement and tax basis of assets and liabilities given the provisions of the enacted tax law. Valuation allowances are used to reduce deferred tax assets to the amount likely to be realized. We intend to distribute approximately $1.5 million of spillover earnings from the year ended December 31, 2012 to our shareholders in 2013.
Net Increase in Net Assets Resulting from Operations and Earnings Per Share
For the year ended December 31, 2012 net increase in net assets resulting from operations totaled approximately $46.8 million compared to net income of approximately $46.9 million for the period ended December 31, 2011. These changes are made up of the items previously described.
Basic and fully diluted net change in net assets per common share were $0.93 and $0.93, respectively, for the year ended December 31, 2012, compared to a basic and fully diluted net income per share of $1.08 and $1.07, respectively, for the year ended December 31, 2011.
Comparison of periods ended December 31, 2011 and 2010
Investment Income
Interest income totaled approximately $70.3 million and $54.7 million for 2011 and 2010, respectively. Income from commitment, facility and loan related fees such as amendment fees and pre-payment penalties totaled approximately $9.5 million and $4.8 million for 2011 and 2010, respectively. The increase in interest income was directly related to an increase in the average investment portfolio outstanding in 2011 than in 2010.
75
Table of Contents
In 2011 and 2010, interest income included approximately $7.4 million and $6.2 million of income from accrued exit gees, respectively. The year over year increase was attributed to an increase in the average investment portfolio outstanding in 2011 than in 2010.
At December 31, 2011 and 2010, we had approximately $10.3 million and $6.6 million of deferred income related to commitment, facility and loan related fees, respectively. The increase in deferred income was attributed to increased investment originations in 2011.
Operating Expenses
Operating expenses, which are comprised of interest and fees, general and administrative and employee compensation, totaled approximately $40.3 million and $30.1 million during the periods ended December 31, 2011 and 2010, respectively.
Interest and fees totaled approximately $15.9 million and $9.8 million during the periods ended December 31, 2011 and 2010, respectively. This $6.1 million year over year increase is largely attributed to $1.4 million of incremental interest and fee expense due to the increase in SBA debentures from $170.0 million as of December 31, 2010 to $225.0 million as of December 31, 2011 and $4.5 million of interest and fee expenses during the period ended December 31, 2011 related to the $75.0 million of Convertible Senior Notes issued on April 15, 2011. Additionally, we incurred approximately $767,000 of non cash interest expense during the period ended December 31, 2011 attributed to the accretion of the fair value of the conversion feature on the Convertible Senior Notes. We had a weighted average cost of debt comprised of interest and fees of approximately 6.23% at December 31, 2011, as compared to 6.27% as of December 31, 2010. The increase was primarily attributed to the weighted average cost of debt on the senior convertible notes of 8.1% offset by a lower weighted average cost of debt on outstanding SBA debentures at 5.0% in 2011 as compared to 6.1% in 2010.
General and administrative expenses include legal, consulting, accounting fees, printer fees, insurance premiums, rent, workout and various other expenses. Expenses increased to approximately $8.0 million from $7.1 million for the periods ended December 31, 2011 and 2010, respectively, largely due to an increase in accounting and printer fees from approximately $1.0 million to $1.6 million during the same periods, respectively.
Employee compensation and benefits totaled approximately $13.3 million and $10.5 million during the periods ended December 31, 2011 and 2010, respectively. The $2.8 million increase is due to $1.6 million of increases in compensation expense attributable to increases in headcount, executive severance payments and payroll taxes associated with restricted stock vesting and $1.2 million in increases in variable compensation expense. Stock-based compensation totaled approximately $3.1 million and $2.7 million during the periods ended December 31, 2011 and 2010, respectively. This increase is due to the incremental expense attributed to restricted stock grants issued in the first quarter of 2011.
Net Investment Income Before Income Tax Expense and Investment Gains and Losses
Net investment income before income tax expense for the year ended December 31, 2011 totaled $39.6 million as compared with a net investment income before income tax expense in 2010 of approximately $29.4 million. The changes are made up of the items described above under “Investment Income” and “Operating Expenses.”
Net Investment Realized Gains and Losses and Unrealized Appreciation and Depreciation
Realized gains or losses are measured by the difference between the net proceeds from the repayment or sale and the cost basis of the investment without regard to unrealized appreciation or depreciation previously recognized, and includes investments charged off during the period, net of recoveries. Net change in unrealized
76
Table of Contents
appreciation or depreciation primarily reflects the change in portfolio investment values during the reporting period, including the reversal of previously recorded unrealized appreciation or depreciation when gains or losses are realized.
In 2011, we generated realized gains totaling approximately $11.1 million primarily due to the sale of warrants and equity investments in 3 portfolio companies. We recognized realized losses in 2011 of approximately $8.4 million on the disposition of investments in 13 portfolio companies. We recognized realized gains of approximately $4.7 million during the year ended December 31, 2010 primarily due to the sale of warrants and common stock of twelve portfolio companies. We recognized realized losses in 2010 of approximately $31.1 million on the disposition of investments in ten portfolio companies. A summary of realized gains and losses for the years end December 31, 2011 and 2010 is as follows:
| December 31, | ||||||||
| (in thousands) |
2011 | 2010 | ||||||
| Realized gains |
$ | 11,092 | $ | 4,677 | ||||
| Realized losses |
(8,351 | ) | (31,059 | ) | ||||
|
|
|
|
|
|||||
| Net realized gains (losses) |
$ | 2,741 | $ | (26,382 | ) | |||
|
|
|
|
|
|||||
During the year ended December 31, 2011 net change in unrealized appreciation totaled approximately $4.6 million from loan, warrant and equity investments. Approximately $9.0 million was due to net unrealized appreciation on debt investments attributable to reversal of unrealized depreciation to realized loss of approximately $5.0 million on one technology debt investment and due to the reversal of unrealized depreciation of approximately $3.1 million on one life science debt investment as a result of improvements at the portfolio company. Approximately $5.8 million of net unrealized depreciation on equity investments during the year ended December 31, 2011, was primarily attributable to the sale of InfoLogix, Inc. resulting in the reversal of $7.7 million of unrealized appreciation on equity investments to realized gains offset by approximately $1.9 million of net appreciation due to net increases in private and public portfolio company valuations. For the year ended December 31, 2010 approximately $ 3.6 million and approximately $500,000 of the net unrealized depreciation was attributable to debt and warrant investments, respectively, and approximately $5.2 million of appreciation that was attributable to equity investments. During the year ended December 31, 2011, net unrealized investment appreciation recognized by the Company was reduced by approximately $217,000 due to the warrant participation agreement with Citigroup. For a more detailed discussion of the warrant participation agreement, see the discussion set forth under “—Borrowings.”
The following table itemizes the change in net unrealized appreciation (depreciation) of investments for 2011 and 2010:
| December 31, | ||||||||
| (in thousands) |
2011 | 2010 | ||||||
| Gross unrealized appreciation on portfolio investments |
$ | 58,980 | $ | 40,696 | ||||
| Gross unrealized depreciation on portfolio investments |
(49,327 | ) | (64,465 | ) | ||||
| Reversal of prior period net unrealized appreciation upon a realization event |
(13,224 | ) | (3,902 | ) | ||||
| Reversal of prior period net unrealized depreciation upon a realization event |
8,395 | 29,674 | ||||||
| Citigroup Warrant Participation |
(217 | ) | (13 | ) | ||||
|
|
|
|
|
|||||
| Net unrealized appreciation/(depreciation) on portfolio investments |
$ | 4,607 | $ | 1,990 | ||||
|
|
|
|
|
|||||
Net Increase in Net Assets Resulting from Operations and Earnings Per Share
For the year ended December 31, 2011 net increase in net assets resulting from operations totaled approximately $46.9 million compared to net income of approximately $5.0 million for the period ended December 31, 2010. These changes are made up of the items previously described.
77
Table of Contents
Basic and fully diluted net change in net assets per common share were $1.08 and $1.07, respectively, for the year ended December 31, 2011, compared to a basic and fully diluted net income per share of $0.12 and $0.12, respectively, for the year ended December 31, 2010.
Financial Condition, Liquidity and Capital Resources
Our liquidity and capital resources are derived from our Credit Facilities, SBA debentures, Convertible Senior Notes, 2019 Notes, Asset-Backed Notes and cash flows from operations, including investment sales and repayments, and income earned. Our primary use of funds from operations includes investments in portfolio companies and payments of fees and other operating expenses we incur. We have used, and expect to continue to use, our borrowings and the proceeds from the rotation of our portfolio and from public and private offerings of securities to finance our investment objectives. We may raise additional equity or debt capital through both registered offerings off a shelf registration and private offerings of securities, by securitizing a portion of our investments or borrowing, including from the SBA through our SBIC subsidiaries.
At December 31, 2012, we had $75.0 million of Convertible Senior Notes payable, $170.4 million of 2019 Notes, $129.3 million of Asset-Backed Notes and $225.0 million of SBA debentures payable. We had no borrowings outstanding under either the Wells Facility or the Union Bank Facility. At December 31, 2011, we had approximately $10.2 million of outstanding borrowings under the Wells Facility, $75.0 million of Convertible Senior Notes payable and $225.0 million SBA debentures payable. We had no borrowings outstanding under the Union Bank Facility.
At December 31, 2012, we had $288.0 million in available liquidity, including $183.0 million in cash and $105.0 million in our Credit Facilities. At December 31, 2012, we had available borrowing capacity of approximately $75.0 million under the Wells Facility and $30.0 million under the Union Bank Facility, subject to existing terms and advance rates and regulatory requirements. We primarily invest cash on hand in interest bearing deposit accounts.
In January 2012, we completed a follow-on public offering of 5.0 million shares of common stock for proceeds of approximately $48.05 million, before deducting offering expenses, to us.
In October 2012, we completed a follow-on public offering of 3.1 million shares of common stock for proceeds of approximately $33.6 million, before deducting offering expenses.
During the year ended December 31, 2012, our operating activities used $193.9 million of cash and cash equivalents, compared to $139.5 million used during the year ended December 31, 2011. The $54.4 million increase in cash used in operating activities resulted primarily from additional purchases of investments of approximately $62.0 million partially offset by a decrease in proceeds from sale of investments of approximately $8.2 million. During the year ended December 31, 2012, our financing activities provided $312.5 million of cash, compared to $97.2 million during the year ended December 31, 2011. This $215.3 million increase in cash provided by financing activities was due primarily due to the issuance of $170.4 million of 2019 Notes Payable and $129.3 million of Asset-Backed Notes, partially offset by a decrease in borrowings of from our Credit Facilities and increase in repayments of to our Credit Facilities of approximately $28.5 million and $46.9 million, respectively, as well as an increase in dividends paid of approximately $8.8 million due to the public offerings of 8.1 million shares of common stock.
As of December 31, 2012, net assets totaled $516.0 million, with a net asset value per share of $9.75. We intend to generate additional cash primarily from cash flows from operations, including income earned from investments in our portfolio companies and, to a lesser extent, from the temporary investment of cash in other high-quality debt investments that mature in one year or less as well as from future borrowings as required to meet our lending activities. Our primary use of funds will be investments in portfolio companies and cash distributions to holders of our common stock.
78
Table of Contents
Additionally, we expect to raise additional capital to support our future growth through future equity and debt offerings, and/or future borrowings, to the extent permitted by the 1940 Act. To the extent we determine to raise additional equity through an offering of our common stock at a price below net asset value, existing investors will experience dilution. During our 2012 Annual Shareholder Meeting held on May 30, 2012, our stockholders authorized us, with the approval of our Board of Directors, to sell up to 20% of our outstanding common stock at a price below our then current net asset value per share and to offer and issue debt with warrants or debt convertible into shares of our common stock at an exercise or conversion price that will not be less than the fair market value per share but may be below the then current net asset value per share. There can be no assurance that these capital resources will be available.
On July 25, 2012, our Board of Directors approved an extension of the stock repurchase plan under the same terms and conditions that allowed us to repurchase up to $35.0 million of our common stock. The stock repurchase plan expired on February 26, 2013 and no shares were repurchased in 2012.
As required by the 1940 Act, our asset coverage must be at least 200% after each issuance of senior securities. As of December 31, 2012 our asset coverage ratio under our regulatory requirements as a business development company was 296.8%, excluding our SBA debentures as a result of our exemptive order from the SEC which allows us to exclude all SBA leverage from our asset coverage ratio. Total leverage when including our SBA debentures was 185.4% at December 31, 2012. As a result of the SEC exemptive order, our ratio of total assets on a consolidated basis to outstanding indebtedness may be less than 200%, which while providing increased investment flexibility, also may increase our exposure to risks associated with leverage.
Outstanding Borrowings
At December 31, 2012 and December 31, 2011, we had the following borrowing capacity and outstanding amounts:
| December 31, 2012 | December 31, 2011 | |||||||||||||||
| Total Available | Carrying Value(1) |
Total Available | Carrying Value(1) |
|||||||||||||
| (in thousands) |
||||||||||||||||
| Union Bank Facility |
$ | 30,000 | $ | — | $ | 55,000 | $ | — | ||||||||
| Wells Facility |
75,000 | — | 75,000 | 10,187 | ||||||||||||
| Convertible Senior Notes(2) |
75,000 | 71,436 | 75,000 | 70,353 | ||||||||||||
| 2019 Notes |
170,364 | 170,364 | — | — | ||||||||||||
| Asset-Backed Notes |
129,300 | 129,300 | — | — | ||||||||||||
| SBA Debentures(3) |
225,000 | 225,000 | 225,000 | 225,000 | ||||||||||||
|
|
|
|
|
|
|
|
|
|||||||||
| Total |
$ | 704,664 | $ | 596,100 | $ | 430,000 | $ | 305,540 | ||||||||
|
|
|
|
|
|
|
|
|
|||||||||
| (1) | Except for the Convertible Senior Notes (as defined below), all carrying values are the same as the principal amount outstanding. |
| (2) | Represents the aggregate principal amount outstanding of the Convertible Senior Notes (as defined below) less the unaccreted discount initially recorded upon issuance of the Convertible Senior Notes. The total unaccreted discount for the Convertible Senior Notes was $3.6 million at December 31, 2012. |
| (3) | In January 2012, we repaid $25.0 million of SBA debentures under HT II, priced at approximately 6.63%, including annual fees. In April 2012, the SBA approved a $25.0 million dollar commitment for HT III. In February 2012, we repaid $24.25 million of SBA debentures under HT II, priced at approximately 6.63%, including annual fees. In June 2012, the SBA approved a $24.25 million dollar commitment for HT III. In August 2012, the Company repaid $24.75 million of SBA debentures under HT II, $12.0 million priced at 6.43%, including annual fees, and $12.75 million priced at 6.38%, including annual fees. In September 2012, the SBA approved a $24.75 million dollar commitment for HT III bringing the total available borrowings to $225.0 million, of which $76.0 million was available in HT II and $149.0 million was available in HT III. |
Our net asset value may decline as a result of economic conditions in the United States. Our continued compliance with the covenants under our Credit Facilities, Convertible Senior Notes, 2019 Notes Payable, Asset-Backed Notes and SBA debentures depend on many factors, some of which are beyond our control. Material net asset devaluation could have a material adverse effect on our operations and could require us to reduce our borrowings order to comply with certain covenants, including the ratio of total assets to total indebtedness. We
79
Table of Contents
believe that our current cash and cash equivalents, cash generated from operations, and funds available from our Credit Facilities will be sufficient to meet our working capital and capital expenditure commitments for at least the next 12 months.
Debt financing costs are fees and other direct incremental costs incurred by the Company in obtaining debt financing and are recognized as prepaid expenses and amortized into the consolidated statement of operations as loan fees over the term of the related debt instrument. Prepaid financing costs, net of accumulated amortization, were as follows:
| As of December 31 |
||||||||
| (in thousands) |
2012 | 2011 | ||||||
| Wells facility |
$ | 867 | $ | 906 | ||||
| SBA Debenture |
5,877 | 5,828 | ||||||
| Convertible Senior Notes |
1,900 | 2,477 | ||||||
| Asset-Backed Notes |
4,074 | — | ||||||
| 2019 Notes |
6,287 | — | ||||||
|
|
|
|
|
|||||
| $ | 19,005 | $ | 9,211 | |||||
|
|
|
|
|
|||||
Commitments
In the normal course of business, we are party to financial instruments with off-balance sheet risk. These consist primarily of unfunded commitments to extend credit, in the form of loans, to our portfolio companies. Unfunded commitments to provide funds to portfolio companies are not reflected on our balance sheet. Our unfunded commitments may be significant from time to time. As of December 31, 2012, we had unfunded commitments of approximately $61.9 million. Approximately $35.6 million of these unfunded debt commitments are dependent upon the portfolio company reaching certain milestones before the debt commitment becomes available. These commitments will be subject to the same underwriting and ongoing portfolio maintenance as are the on-balance sheet financial instruments that we hold. Since these commitments may expire without being drawn upon, the total commitment amount does not necessarily represent future cash requirements. Closed commitments generally fund 70-80% of the committed amount in aggregate over the life of the commitment. We intend to use cash flow from normal and early principal repayments, and proceeds from borrowings and notes to fund these commitments. However, there can be no assurance that we will have sufficient capital available to fund these commitments as they come due.
In addition, we had approximately $70.0 million of non-binding term sheets outstanding to seven new and existing companies, which generally convert to contractual commitments within approximately 45 to 60 days of signing. Non-binding outstanding term sheets are subject to completion of our due diligence and final approval process, as well as the negotiation of definitive documentation with the prospective portfolio companies. Not all non-binding term sheets are expected to close and do not necessarily represent future cash requirements.
Contractual Obligations
The following table shows our contractual obligations as of December 31, 2012:
| Payments due by period (in thousands) |
||||||||||||||||||||
| Contractual Obligations(1)(2) |
Total | Less than 1 year |
1 - 3 years |
3 - 5 years | After 5 years |
|||||||||||||||
| Borrowings(3)(4) |
$ | 596,100 | $ | — | $ | 129,300 | $ | 71,436 | $ | 395,364 | ||||||||||
| Operating Lease Obligations(5) |
8,819 | 1,245 | 2,881 | 3,044 | 1,649 | |||||||||||||||
|
|
|
|
|
|
|
|
|
|
|
|||||||||||
| Total |
$ | 604,919 | $ | 1,245 | $ | 132,181 | $ | 74,480 | $ | 397,013 | ||||||||||
|
|
|
|
|
|
|
|
|
|
|
|||||||||||
| (1) | Excludes commitments to extend credit to our portfolio companies. |
| (2) | The Company also has a warrant participation agreement with Citigroup. See Note 4. |
80
Table of Contents
| (3) | Includes $225.0 million in borrowings under the SBA debentures, $170.4 million of the 2019 Notes, $129.3 million in aggregate principal amount of the Asset-Backed Notes and $71.4 million of the Convertible Senior Notes. |
| (4) | Except for the Convertible Senior Notes, all carrying values are the same as the principal amount outstanding. The aggregate principal amount outstanding of the Convertible Senior Notes less the unaccreted discount initially recorded upon issuance of the Convertible Senior Notes was $3.6 million at December 31, 2012. |
| (5) | Long-term facility leases. |
Certain premises are leased under agreements which expire at various dates through December 2020. Total rent expense amounted to approximately $1.2 million, $1.1 million and $1.0 million during the years ended December 31, 2012, 2011 and 2010, respectively.
We and our executives and directors are covered by Directors and Officers Insurance, with the directors and officers being indemnified by us to the maximum extent permitted by Maryland law subject to the restrictions in the 1940 Act.
Borrowings
Long-term SBA Debentures
On September 27, 2006, HT II received a license to operate as a SBIC under the SBIC program and is able to borrow funds from the SBA against eligible investments and regulatory capital. Under the Small Business Investment Company Act and current SBA policy applicable to SBICs, a SBIC can have outstanding at any time SBA guaranteed debentures up to twice the amount of its regulatory capital. HT II has a total of $76.0 million of SBA guaranteed debentures outstanding as of December 31, 2012 and has paid the SBA commitment fees of approximately $1.5 million. As of December 31, 2012, we held investments in HT II in 51 companies with a fair value of approximately $132.6 million, accounting for approximately 14.6% of our total portfolio at December 31, 2012.
On May 26, 2010, HT III received a license to operate as a SBIC under the SBIC program and is able to borrow funds from the SBA against eligible investments and additional contributions to regulatory capital. With our net investment of $74.5 million in HT III as of December 31, 2012, HT III has the capacity to issue a total of $149.0 million of SBA guaranteed debentures, subject to SBA approval, of which $149.0 million was outstanding as of December 31, 2012. As of December 31, 2012, HT III has paid commitment fees of approximately $1.5 million. As of December 31, 2012, we held investments in HT III in 35 companies with a fair value of approximately $223.6 million accounting for approximately 24.7% of our total portfolio at December 31, 2012.
SBICs are designed to stimulate the flow of private equity capital to eligible small businesses. Under present SBA regulations, eligible small businesses include businesses that have a tangible net worth not exceeding $18.0 million and have average annual fully taxed net income not exceeding $6.0 million for the two most recent fiscal years. In addition, SBICs must devote 25.0% of its investment activity to “smaller” concerns as defined by the SBA. A smaller concern is one that has a tangible net worth not exceeding $6.0 million and has average annual fully taxed net income not exceeding $2.0 million for the two most recent fiscal years. SBA regulations also provide alternative size standard criteria to determine eligibility, which depend on the industry in which the business is engaged and are based on such factors as the number of employees and gross sales. According to SBA regulations, SBICs may make long-term loans to small businesses, invest in the equity securities of such businesses and provide them with consulting and advisory services. Through its wholly-owned subsidiaries HT II and HT III, we plan to provide long-term loans to qualifying small businesses, and in connection therewith, make equity investments.
HT II and HT III are periodically examined and audited by the SBA’s staff to determine their compliance with SBA regulations. If HT II or HT III fails to comply with applicable SBA regulations, the SBA could, depending on the severity of the violation, limit or prohibit HT II’s or HT III’s use of debentures, declare outstanding debentures immediately due and payable, and/or limit HT II or HT III from making new investments. In addition, HT II or HT III may also be limited in their ability to make distributions to us if they do not have
81
Table of Contents
sufficient capital in accordance with SBA regulations. Such actions by the SBA would, in turn, negatively affect us because HT II and III are our wholly owned subsidiaries. HT II and HT III were in compliance with the terms of the SBIC’s leverage as of December 31, 2012 as a result of having sufficient capital as defined under the SBA regulations.
The rates of borrowings under various draws from the SBA beginning in April 2007 are set semiannually in March and September and range from 2.25% to 5.73%. Interest payments on SBA debentures are payable semi-annually. There are no principal payments required on these issues prior to maturity and no prepayment penalties. Debentures under the SBA generally mature ten years after being borrowed. Based on the initial draw down date of April 2007, the initial maturity of SBA debentures will occur in April 2017. In addition, the SBA charges a fee that is set annually, depending on the Federal fiscal year the leverage commitment was delegated by the SBA, regardless of the date that the leverage was drawn by the SBIC. The annual fees related to HT II debentures that pooled on September 22, 2010 were 0.406% and 0.285%, depending upon the year in which the underlying commitment was closed. The annual fees related to HT III debentures that pooled on September 19, 2012 were 0.804%. The annual fees on other debentures have been set at 0.906%. The average amount of debentures outstanding for the year ended December 31, 2012 for HT II was approximately $95.2 million with an average interest rate of approximately 5.68%. The average amount of debentures outstanding for the year ended December 31, 2012 for HT III was approximately $112.0 million with an average interest rate of approximately 3.25%.
In January 2011, we repaid $25.0 million of SBA debentures under HT II, priced at approximately 6.63%, including annual fees. In April 2011, the SBA approved a $25.0 million dollar commitment for HT III. In February 2012, we repaid $24.25 million of SBA debentures under HT II, priced at 6.63%, including annual fees. In June 2012, the SBA approved a $24.25 million dollar commitment for HT III. In August 2012, we repaid $24.75 million of SBA debentures under HT II, $12.0 million priced at 6.43%, including annual fees and $12.75 million priced at 6.38%, including annual fees.
As of December 31, 2012, the maximum statutory limit on the dollar amount of outstanding SBA guaranteed debentures issued by a single SBIC is $150.0 million, subject to periodic adjustments by the SBA, and a maximum amount of $225.0 million for funds under common control, subject to periodic adjustments by the SBA. In the aggregate, at December 31, 2012 there was $225.0 million principal amount of indebtedness outstanding incurred by our SBIC subsidiaries, bringing us to the maximum statutory limit on the dollar amount of SBA guaranteed debentures under the SBIC program.
We reported the following SBA debentures outstanding as of December 31, 2012 and December 31, 2011:
| December 31, | ||||||||||||||
| (in thousands) Issuance/Pooling Date |
Maturity Date | Interest Rate(1) | 2012 | 2011 | ||||||||||
| SBA Debentures: |
||||||||||||||
| September 26, 2007 |
September 1, 2017 | 6.43 | % | $ | — | $ | 12,000 | |||||||
| March 26, 2008 |
March 1, 2018 | 6.38 | % | 34,800 | 58,050 | |||||||||
| September 24, 2008 |
September 1, 2018 | 6.63 | % | — | 13,750 | |||||||||
| March 25, 2009 |
March 1, 2019 | 5.53 | % | 18,400 | 18,400 | |||||||||
| September 23, 2009 |
September 1, 2019 | 4.64 | % | 3,400 | 3,400 | |||||||||
| September 22, 2010 |
September 1, 2020 | 3.62 | % | 6,500 | 6,500 | |||||||||
| September 22, 2010 |
September 1, 2020 | 3.50 | % | 22,900 | 22,900 | |||||||||
| March 29, 2011 |
March 1, 2021 | 4.37 | % | 28,750 | 28,750 | |||||||||
| September 21, 2011 |
September 1, 2021 | 3.16 | % | 25,000 | 25,000 | |||||||||
| March 21, 2012 |
March 1, 2022 | 3.05 | % | 11,250 | 11,250 | |||||||||
| March 21, 2012 |
March 1, 2022 | 3.28 | % | 25,000 | 25,000 | |||||||||
| September 19, 2012 |
September 1, 2022 | 3.05 | % | 24,250 | — | |||||||||
| November 14, 2012 |
November 1, 2022 | 3.05 | %(2) | 24,750 | — | |||||||||
|
|
|
|
|
|||||||||||
| Total SBA Debentures |
$ | 225,000 | $ | 225,000 | ||||||||||
|
|
|
|
|
|||||||||||
| (1) | Interest rate includes annual charge |
| (2) | Interim interest on the November 14, 2012 borrowing is expected to pool in March 2013 at which date the principal interest rate will be set. |
82
Table of Contents
Wells Facility
In August 2008, we entered into a $50.0 million two-year revolving senior secured credit facility with Wells Fargo Capital Finance (the “Wells Facility”). On June 20, 2011, we renewed the Wells Facility. Under this three-year senior secured facility, Wells Fargo Capital Finance has made commitments of $75.0 million. The facility contains an accordion feature, in which we can increase the credit line up to an aggregate of $300.0 million, funded by additional lenders and with the agreement of Wells Fargo Capital Finance and subject to other customary conditions. We expect to continue discussions with various other potential lenders to join the new facility; however, there can be no assurances that additional lenders will join the Wells Facility.
On August 1, 2012, we entered into an amendment to the Wells Facility. The amendment reduces the interest rate floor by 75 basis points to 4.25% and extends the maturity date by one year to August 2015. Additionally, an amortization period of 12 months was added to pay down the principal balance as of the maturity date, and the unused line fee was reduced.
Borrowings under the Wells Facility will generally bear interest at a rate per annum equal to LIBOR plus 3.50%, with a floor of 4.25% and an advance rate of 50% against eligible loans. The Wells Facility is secured by loans in the borrowing base. The Wells Facility requires payment of a non-use fee on a scale of 0.0% to 0.50% of the average monthly outstanding balance. The monthly payment of a non-use fee thereafter shall depend on the average balance that was outstanding on a scale between 0.0% and 0.50%. For the three-month period ended December 31, 2012, this non-use fee was approximately $96,000. On June 20, 2011 we paid an additional $1.1 million in structuring fees in connection with the Wells Facility which is being amortized through the end of the term. At December 31, 2012, there were no borrowings outstanding on this facility.
The Wells Facility includes various financial and operating covenants applicable to us and our subsidiaries, in addition to those applicable to Hercules Funding II, LLC. These covenants require us to maintain certain financial ratios and a minimum tangible net worth in an amount, when added to outstanding subordinated indebtedness, that is in excess of $362.0 million plus 90% of the cumulative amount of equity raised after June 30, 2012. In addition, the tangible net worth covenant will increase by 90 cents on the dollar for every dollar of equity capital that we subsequently raise. As of December 31, 2012, the minimum tangible net worth covenant has increased to $392.3 million as a result of the October 2012 follow-on public offering of 3.1 million shares of common stock for proceeds of approximately $33.6 million. The Wells Facility provides for customary events of default, including, but not limited to, payment defaults, breach of representations or covenants, bankruptcy events and change of control. We were in compliance with all covenants at December 31, 2012.
Union Bank Facility
On February 10, 2010, we entered a $20.0 million one-year revolving senior secured credit facility with Union Bank (the “Union Bank Facility”). On November 2, 2011, we renewed and amended the Union Bank Facility and added a new lender under the Union Bank Facility. Union Bank and RBC Capital Markets (“RBC”) have made commitments of $30.0 million and $25.0 million, respectively. The Union Bank Facility contains an accordion feature, in which we can increase the credit line up to an aggregate of $150.0 million, funded by additional lenders and with the agreement of Union Bank and subject to other customary conditions. We expect to continue discussions with various other potential lenders to join the new facility; however, there can be no assurances that additional lenders will join the Union Bank Facility.
On March 30, 2012 we entered into an amendment to the Union Bank Facility which permitted us to issue additional senior notes relating to the offer and sale of our 2019 Notes. On September 17, 2012, we entered into an amendment to the Union Bank Facility. Pursuant to the terms of the amendment, we are permitted to increase our unsecured indebtedness by an aggregate original principal amount not to exceed $200.0 million incurred after March 30, 2012 in one or more issuances, provided certain conditions are satisfied for each issuance.
83
Table of Contents
On December 17, 2012, we further amended the Union Bank Facility to remove RBC from the Union Bank Facility. Following the removal of RBC, the Union Bank Facility consists solely of Union Bank’s commitment of $30.0 million. In connection with the amendment, the maximum availability under the Union Bank Facility, subject to a borrowing base, was reduced from $55.0 million to $30.0 million. The Union Bank Facility contains an accordion feature, in which we could increase the credit line by up to $95.0 million in the aggregate, funded by commitments from additional lenders and with the agreement of Union Bank and subject to other customary conditions. There can be no assurances that additional lenders will join the Union Bank Facility.
Borrowings under the Union Bank Facility will generally bear interest at a rate per annum equal to LIBOR plus 2.25% with a floor of 4.0%. The Union Bank Facility requires the payment of a non-use fee of 0.50% annually. For the three-month period ended December 31, 2012, this nonuse fee was approximately $65,000. The Union Bank Facility is collateralized by debt investments in our portfolio companies, and includes an advance rate equal to 50.0% of eligible loans placed in the collateral pool. The Union Bank Facility generally requires payment of interest on a monthly basis. All outstanding principal is due upon maturity. At December 31, 2012, there were no borrowings outstanding on this facility.
The Union Bank Facility requires various financial and operating covenants. These covenants require us to maintain certain financial ratios and a minimum tangible net worth in an amount, when added to outstanding subordinated indebtedness, that is in excess of $314.0 million plus 90% of the amount of net cash proceeds received from the sale of common stock after March 31, 2011. As of December 31, 2012, the minimum tangible net worth covenant has increased to $386.8 million as a result of the January and October 2012 follow-on public offerings of 5.0 and 3.1 million shares of common stock, respectively, for total net proceeds of approximately $80.9 million. The Union Bank Facility will mature on November 1, 2014, approximately three years from the date of issuance, revolving through the first 24 months with a term out provision for the remaining 12 months. Union Bank Facility also provides for customary events of default, including, but not limited to, payment defaults, breach of representations or covenants, bankruptcy events and change of control. We were in compliance with all covenants at December 31, 2012.
Citibank Credit Facility
We, through Hercules Funding Trust I, an affiliated statutory trust, had a securitized credit facility (the “Citibank Credit Facility”) with Citigroup Global Markets Realty Corp. which expired under normal terms. During the first quarter of 2009, we paid off all principal and interest owed under the Citibank Credit Facility. Citigroup has an equity participation right through a warrant participation agreement on the pool of loans and warrants collateralized under the Citibank Credit Facility. Pursuant to the warrant participation agreement, we granted to Citigroup a 10% participation in all warrants held as collateral. However, no additional warrants were included in collateral subsequent to the facility amendment on May 2, 2007. As a result, Citigroup is entitled to 10% of the realized gains on the warrants until the realized gains paid to Citigroup pursuant to the agreement equal $3,750,000 (the “Maximum Participation Limit”). The obligations under the warrant participation agreement continue even after the Citibank Credit Facility is terminated until the Maximum Participation Limit has been reached.
During the year ended December 31, 2012, we reduced our realized gain by approximately $270,000 for Citigroup’s participation in the gain on sale of equity securities and recorded a decrease on participation liability and increased our unrealized gains by a net amount of approximately $386,000 for Citigroup’s participation. The value of their participation right on unrealized gains in the related equity investments was approximately $313,000 as of December 31, 2012 and is included in accrued liabilities. There can be no assurances that the unrealized appreciation of the warrants will not be higher or lower in future periods due to fluctuations in the value of the warrants, thereby increasing or reducing the effect on the cost of borrowing. Since inception of the agreement, we have paid Citigroup approximately $1.4 million under the warrant participation agreement thereby reducing our realized gains by this amount. We will continue to pay Citigroup under the warrant participation agreement until the Maximum Participation Limit is reached or the warrants expire. Warrants subject to the Citigroup participation agreement are set to expire between January 2013 and January 2017.
84
Table of Contents
Convertible Senior Notes
In April 2011, we issued $75.0 million in aggregate principal amount of 6.00% convertible senior notes (the “Convertible Senior Notes”) due 2016. As of December 31, 2012, the carrying value of the Convertible Senior Notes, comprised of the aggregate principal amount outstanding less the unaccreted discount initially recorded upon issuance of the Convertible Senior Notes, is approximately $71.4 million.
The Convertible Senior Notes mature on April 15, 2016 (the “Maturity Date”), unless previously converted or repurchased in accordance with their terms. The Convertible Senior Notes bear interest at a rate of 6.00% per year payable semiannually in arrears on April 15 and October 15 of each year, commencing on October 15, 2011. The Convertible Senior Notes are our senior unsecured obligations and rank senior in right of payment to our existing and future indebtedness that is expressly subordinated in right of payment to the Convertible Senior Notes; equal in right of payment to our existing and future unsecured indebtedness that is not so subordinated; effectively junior in right of payment to any of our secured indebtedness (including unsecured indebtedness that we later secure) to the extent of the value of the assets securing such indebtedness; and structurally junior to all existing and future indebtedness (including trade payables) incurred by our subsidiaries, financing vehicles or similar facilities.
Prior to the close of business on the business day immediately preceding October 15, 2015, holders may convert their Convertible Senior Notes only under certain circumstances set forth in the Indenture. On or after October 15, 2015 until the close of business on the scheduled trading day immediately preceding the Maturity Date, holders may convert their Convertible Senior Notes at any time. Upon conversion, we will pay or deliver, as the case may be, at our election, cash, shares of our common stock or a combination of cash and shares of our common stock. The conversion rate will initially be 84.0972 shares of common stock per $1,000 principal amount of Convertible Senior Notes (equivalent to an initial conversion price of approximately $11.89 per share of common stock). The conversion rate will be subject to adjustment in some events but will not be adjusted for any accrued and unpaid interest. In addition, if certain corporate events occur prior to the Maturity Date, the conversion rate will be increased for converting holders.
We may not redeem the Convertible Senior Notes prior to maturity. No sinking fund is provided for the Convertible Senior Notes. In addition, if certain corporate events occur, holders of the Convertible Senior Notes may require us to repurchase for cash all or part of their Convertible Senior Notes at a repurchase price equal to 100% of the principal amount of the Convertible Senior Notes to be repurchased, plus accrued and unpaid interest through, but excluding, the required repurchase date.
In accounting for the Convertible Senior Notes, we estimated that the values of the debt and the embedded conversion feature of the Convertible Senior Notes were approximately 92.8% and 7.2%, respectively. The original issue discount of 7.2% attributable to the conversion feature of the Convertible Senior Notes has initially been recorded in “capital in excess of par value” in the consolidated statement of assets and liabilities. As a result, we record interest expense comprised of both stated interest expense as well as accretion of the original issue discount resulting in an estimated effective interest rate of approximately 7.9%.
As of December 31, 2012, the components of the carrying value of the Convertible Senior Notes were as follows:
| (in thousands) |
As of December 31, 2012 | |||
| Principal amount of debt |
$ | 75,000 | ||
| Original issue discount, net of accretion |
(3,564 | ) | ||
|
|
|
|||
| Carrying value of debt |
$ | 71,436 | ||
|
|
|
|||
85
Table of Contents
For the years ended December 31, 2012 and 2011, the components of interest expense, fees and cash paid for interest expense for the Convertible Senior Notes were as follows:
| For the Years Ended December 31, |
||||||||
| (in thousands) | 2012 | 2011 | ||||||
| Stated interest expense |
$ | 4,500 | $ | 3,187 | ||||
| Accretion of original issue discount |
1,083 | 767 | ||||||
| Amortization of debt issuance cost |
577 | 409 | ||||||
|
|
|
|
|
|||||
| Total interest expense |
$ | 6,160 | $ | 4,363 | ||||
|
|
|
|
|
|||||
| Cash paid for interest expense |
$ | 4,500 | $ | 2,250 | ||||
As of December 31, 2012, we are in compliance with the terms of the indentures governing the Convertible Senior Notes. See Note to our consolidated financial statements for more detail on the Convertible Senior Notes.
2019 Notes
On March 6, 2012, we and U.S. Bank National Association (the “Trustee”) entered into an indenture (the “Base Indenture”). On April 17, 2012, we and the Trustee entered into the First Supplemental Indenture to the Base Indenture (the “First Supplemental Indenture”), dated April 17, 2012, relating to our issuance, offer and sale of $43.0 million aggregate principal amount of 7.00% senior notes due 2019 (the “April 2019 Notes”). The sale of the April 2019 Notes generated net proceeds, before expenses, of approximately $41.7 million.
On September 24, 2012, we and the Trustee, entered into the Second Supplemental Indenture to the Base Indenture (the “Second Supplemental Indenture”), dated as of September 24, 2012, relating to our issuance, offer and sale of $75.0 million aggregate principal amount of 7.00% senior notes due 2019 (the “September 2019 Notes” and, together with the April 2019 Notes, the “2019 Notes”). The sale of the September 2019 Notes generated net proceeds, before expenses, of approximately $72.75 million.
April 2019 Notes
The 2019 Notes will mature on April 30, 2019 and may be redeemed in whole or in part at our option at any time or from time to time on or after April 30, 2015, upon not less than 30 days nor more than 60 days written notice by mail prior to the date fixed for redemption thereof, at a redemption price of 100% of the outstanding principal amount thereof plus accrued and unpaid interest payments otherwise payable for the then-current quarterly interest period accrued to but not including the date fixed for redemption. The April 2019 Notes bear interest at a rate of 7.00% per year payable quarterly on January 30, April 30, July 30 and October 30 of each year, commencing on July 30, 2012, and trade on the New York Stock Exchange under the trading symbol “HTGZ.”
The 2019 Notes will be our direct unsecured obligations and will rank: (i) pari passu with our other outstanding and future senior unsecured indebtedness, including without limitation, the $75.0 million in aggregate principal amount of the Convertible Senior Notes; (ii) senior to any of our future indebtedness that expressly provides it is subordinated to the April 2019 Notes; (iii) effectively subordinated to all our existing and future secured indebtedness (including indebtedness that is initially unsecured to which we subsequently grant security), to the extent of the value of the assets securing such indebtedness, including without limitation, borrowings under our Credit Facilities; (iv) structurally subordinated to all existing and future indebtedness and other obligations of any of our subsidiaries, including without limitation, the indebtedness of Hercules Technology II, L.P. and Hercules Technology III, L.P. and borrowings under our revolving senior secured credit facility with Wells Fargo Capital Finance, LLC.
86
Table of Contents
The Indenture, as supplemented by the First Supplemental Indenture, contains certain covenants including covenants requiring our compliance with (regardless of whether it is subject to) the asset coverage requirements set forth in Section 18(a)(1)(A) as modified by Section 61(a)(1) of the 1940 Act to comply with the restrictions on dividends, distributions and purchase of capital stock set forth in Section 18(a)(1)(B) as modified by Section 61(a)(1) of the 1940 Act and to provide financial information to the holders of the April 2019 Notes and the Trustee if the Company should no longer be subject to the reporting requirements under the Securities Exchange Act of 1934. These covenants are subject to important limitations and exceptions that are described in the Indenture, as supplemented by the First Supplemental Indenture. The Indenture provides for customary events of default and further provides that the Trustee or the holders of 25% in aggregate principal amount of the outstanding April 2019 Notes in a series may declare such April 2019 Notes immediately due and payable upon the occurrence of any event of default after expiration of any applicable grace period.
In July 2012, we reopened our April 2019 Notes and issued an additional $41.5 million in aggregate principal amount of April 2019 Notes, which includes exercise of an over-allotment option, bringing the total amount of the April 2019 Notes issued to approximately $84.5 million in aggregate principal amount.
September 2019 Notes
The September 2019 Notes will mature on September 30, 2019 and may be redeemed in whole or in part at our option at any time or from time to time on or after September 30, 2015, upon not less than 30 days nor more than 60 days written notice by mail prior to the date fixed for redemption thereof, at a redemption price of 100% of the outstanding principal amount thereof plus accrued and unpaid interest payments otherwise payable for the then-current quarterly interest period accrued to but not including the date fixed for redemption. The September 2019 Notes bear interest at a rate of 7.00% per year payable quarterly on March 30, June 30, September 30 and December 30 of each year, commencing on December 30, 2012, and trade on the New York Stock Exchange under the trading symbol “HTGY.”
The September 2019 Notes will be the Company’s direct unsecured obligations and will rank: (i) pari passu with our other outstanding and future senior unsecured indebtedness, including without limitation, the $75 million in aggregate principal amount of the Convertible Senior Notes; (ii) senior to any of our future indebtedness that expressly provides it is subordinated to the September 2019 Notes; (iii) effectively subordinated to all our existing and future secured indebtedness (including indebtedness that is initially unsecured to which we subsequently grant security), to the extent of the value of the assets securing such indebtedness, including without limitation, borrowings under our credit facilities; (iv) structurally subordinated to all existing and future indebtedness and other obligations of any of our subsidiaries, including without limitation, the indebtedness of Hercules Technology II, L.P. and Hercules Technology III, L.P. and borrowings under our revolving senior secured credit facility with Wells Fargo Capital Finance.
The Base Indenture, as supplemented by the Second Supplemental Indenture, contains certain covenants including covenants requiring the Company to comply with (regardless of whether it is subject to) the asset coverage requirements set forth in Section 18 (a)(1)(A) as modified by Section 61(a)(1) of the 1940 Act to comply with the restrictions on dividends, distributions and purchase of capital stock set forth in Section 18(a)(1)(B) as modified by Section 61(a)(1) of the 1940 Act and to provide financial information to the holders of the September 2019 Notes and the Trustee if the Company should no longer be subject to the reporting requirements under the Securities Exchange Act of 1934. These covenants are subject to important limitations and exceptions that are described in the Indenture, as supplemented by the Second Supplemental Indenture. The Indenture provides for customary events of default and further provides that the Trustee or the holders of 25% in aggregate principal amount of the outstanding September 2019 Notes in a series may declare such September 2019 Notes immediately due and payable upon the occurrence of any event of default after expiration of any applicable grace period.
87
Table of Contents
In October 2012, the underwriters exercised their over-allotment option for an additional $10.9 million of the September 2019 Notes, bringing the total amount of the September 2019 Notes issued to approximately $85.9 million in aggregate principal amount.
For the years ended December 31, 2012 and 2011, the components of interest expense and cash paid for interest expense for the April 2019 Notes and September 2019 Notes are as follows:
| For the Years Ended December 31, |
||||||||
| (in thousands) | 2012 | 2011 | ||||||
| Stated interest expense |
$ | 5,139 | $ | — | ||||
| Amortization of debt issuance cost |
423 | — | ||||||
|
|
|
|
|
|||||
| Total interest expense and fees |
$ | 5,562 | $ | — | ||||
|
|
|
|
|
|||||
| Cash paid for interest expense and fees |
$ | 4,790 | $ | — | ||||
|
|
|
|
|
|||||
As of December 31, 2012, we are in compliance with the terms of the indenture governing the April 2019 Notes and the September 2019 Notes. See Note 4 to our consolidated financial statements for more detail on the 2019 Notes.
Asset-Backed Notes
On December 19, 2012, we completed a $230.7 million term debt securitization in connection with which an affiliate of ours made an offering of $129.3 million in aggregate principal amount of fixed-rate asset-backed notes (the “Asset-Backed Notes”), which Asset-Backed Notes were rated A2(sf) by Moody’s Investors Service, Inc. The Asset-Backed Notes were issued by Hercules Capital Funding Trust 2012-1 pursuant to a note purchase agreement, dated as of December 12, 2012, by and among us, Hercules Capital Funding 2012-1 LLC, as Trust Depositor (the “Trust Depositor”), Hercules Capital Funding Trust 2012-1, as Issuer (the “Issuer”), and Guggenheim Securities, LLC, as Initial Purchaser, and are backed by a pool of senior loans made to certain of our portfolio companies and secured by certain assets of those portfolio companies and are to be serviced by us. Interest on the Asset-Backed Notes will be paid, to the extent of funds available, at a fixed rate of 3.32% per annum. The Asset-Backed Notes have a stated maturity of December 16, 2017.
As part of this transaction, we entered into a sale and contribution agreement with the Trust Depositor under which we have agreed to sell or have contributed to the Trust Depositor certain senior loans made to certain of our portfolio companies (the “Loans”). We have made customary representations, warranties and covenants in the sale and contribution agreement with respect to the Loans as of the date of their transfer to the Trust Depositor.
In connection with the issuance and sale of the Asset-Backed Notes, we have made customary representations, warranties and covenants in the note purchase agreement. The Asset-Backed Notes are secured obligations of the Issuer and are non-recourse to us. The Issuer also entered into an indenture governing the Asset-Backed Notes, which indenture includes customary representations, warranties and covenants. The Asset-Backed Notes were sold without being registered under the Securities Act of 1933, as amended (the “Securities Act”), to “qualified institutional buyers” in compliance with the exemption from registration provided by Rule 144A under the Securities Act and to institutional “accredited investors” (as defined in Rule 501(a)(1), (2), (3) or (7) under the Securities Act) who in each case, are “qualified purchasers” for purposes of Section 3(c)(7) under the 1940 Act. In addition, the Trust Depositor entered into an amended and restated trust agreement, which includes customary representation, warranties and covenants.
The Loans will be serviced by us pursuant to a sale and servicing agreement, which contains customary representations, warranties and covenants. We will perform certain servicing and administrative functions with respect to the Loans. We will be entitled to receive a monthly fee from the Issuer for servicing the Loans. This
88
Table of Contents
servicing fee will equal the product of one-twelfth (or in the case of the first payment date, a fraction equal to the number of days from and including December 5, 2012 through and including January 15, 2013 over 360) of 2.00% and the aggregate outstanding principal balance of the Loans, excluding all defaulted Loans and all purchased Loans, as of the first day of the related collection period (the period from the 5th day of the immediately preceding calendar month through the 4th day of the calendar month in which a payment date occurs, and for the first payment date, the period from and including December 5, 2012, to the close of business on January 4, 2013).
We will also serve as administrator to the Issuer under an administration agreement, which includes customary representations, warranties and covenants.
Dividends
The following table summarizes our dividends declared and paid or to be paid on all shares, including restricted stock, to date:
| Date Declared |
Record Date | Payment Date | Amount Per Share | |||||
| October 27, 2005 |
November 1, 2005 | November 17, 2005 | $ | 0.03 | ||||
| December 9, 2005 |
January 6, 2006 | January 27, 2006 | 0.30 | |||||
| April 3, 2006 |
April 10, 2006 | May 5, 2006 | 0.30 | |||||
| July 19, 2006 |
July 31, 2006 | August 28, 2006 | 0.30 | |||||
| October 16, 2006 |
November 6, 2006 | December 1, 2006 | 0.30 | |||||
| February 7, 2007 |
February 19, 2007 | March 19, 2007 | 0.30 | |||||
| May 3, 2007 |
May 16, 2007 | June 18, 2007 | 0.30 | |||||
| August 2, 2007 |
August 16, 2007 | September 17, 2007 | 0.30 | |||||
| November 1, 2007 |
November 16, 2007 | December 17, 2007 | 0.30 | |||||
| February 7, 2008 |
February 15, 2008 | March 17, 2008 | 0.30 | |||||
| May 8, 2008 |
May 16, 2008 | June 16, 2008 | 0.34 | |||||
| August 7, 2008 |
August 15, 2008 | September 19, 2008 | 0.34 | |||||
| November 6, 2008 |
November 14, 2008 | December 15, 2008 | 0.34 | |||||
| February 12, 2009 |
February 23, 2009 | March 30, 2009 | 0.32 | * | ||||
| May 7, 2009 |
May 15, 2009 | June 15, 2009 | 0.30 | |||||
| August 6, 2009 |
August 14, 2009 | September 14, 2009 | 0.30 | |||||
| October 15, 2009 |
October 20, 2009 | November 23, 2009 | 0.30 | |||||
| December 16, 2009 |
December 24, 2009 | December 30, 2009 | 0.04 | |||||
| February 11, 2010 |
February 19, 2010 | March 19, 2010 | 0.20 | |||||
| May 3, 2010 |
May 12, 2010 | June 18, 2010 | 0.20 | |||||
| August 2, 2010 |
August 12, 2010 | September 17, 2010 | 0.20 | |||||
| November 4, 2010 |
November 10, 2010 | December 17, 2010 | 0.20 | |||||
| March 1, 2011 |
March 10, 2011 | March 24, 2011 | 0.22 | |||||
| May 5, 2011 |
May 11, 2011 | June 23, 2011 | 0.22 | |||||
| August 4, 2011 |
August 15, 2011 | September 15, 2011 | 0.22 | |||||
| November 3, 2011 |
November 14, 2011 | November 29, 2011 | 0.22 | |||||
| February 27, 2012 |
March 12, 2012 | March 15, 2012 | 0.23 | |||||
| April 30, 2012 |
May 18, 2012 | May 25, 2012 | 0.24 | |||||
| July 30, 2012 |
August 17, 2012 | August 24, 2012 | 0.24 | |||||
| October 26, 2012 |
November 14, 2012 | November 21, 2012 | 0.24 | |||||
| February 26, 2013 |
March 11, 2013 | March 19, 2013 | 0.25 | |||||
|
|
|
|||||||
| $ | 7.89 | |||||||
|
|
|
|||||||
| * | Dividend paid in cash and stock. |
On February 26, 2013 the Board of Directors increased the quarterly dividend $0.01, or approximately 4.02%, and declared a cash dividend of $0.25 per share that is to be paid on March 19, 2013 to shareholders of record as of March 11, 2013. This dividend is our thirtieth consecutive quarterly dividend declaration since our initial public offering, and will bring the total cumulative dividend declared to date to $7.89 per share.
Our Board of Directors maintains a variable dividend policy with the objective of distributing four quarterly distributions in an amount that approximates 90—100% of our taxable quarterly income or potential annual income for a particular year. In addition, at the end of the year, we may also pay an additional special dividend or
89
Table of Contents
fifth dividend, such that we may distribute approximately all of our annual taxable income in the year it was earned, while maintaining the option to spill over our excess taxable income.
Distributions in excess of our current and accumulated earnings and profits would generally be treated first as a return of capital to the extent of the stockholder’s tax basis, and any remaining distributions would be treated as a capital gain. The determination of the tax attributes of our distributions is made annually as of the end of our fiscal year based upon our taxable income for the full year and distributions paid for the full year. Of the dividends declared during the year ended December 31, 2012 and 2011, 100% were distributions of ordinary income. There can be no certainty to stockholders that this determination is representative of what the tax attributes of our 2013 distributions to stockholders will actually be.
Each year a statement on Form 1099-DIV identifying the source of the distribution (i.e., paid from ordinary income, paid from net capital gains on the sale of securities, and/or a return of paid-in-capital surplus which is a nontaxable distribution) is mailed to our stockholders. To the extent our taxable earnings fall below the total amount of our distributions for that fiscal year, a portion of those distributions may be deemed a tax return of capital to our stockholders.
We operate to qualify to be taxed as a RIC under the Code. Generally, a RIC is entitled to deduct dividends it pays to its shareholders from its income to determine “taxable income.” Taxable income includes our taxable interest, dividend and fee income, as well as taxable net capital gains. Taxable income generally differs from net income for financial reporting purposes due to temporary and permanent differences in the recognition of income and expenses, and generally excludes net unrealized appreciation or depreciation, as gains or losses are not included in taxable income until they are realized. In addition, gains realized for financial reporting purposes may differ from gains included in taxable income as a result of our election to recognize gains using installment sale treatment, which generally results in the deferment of gains for tax purposes until notes or other amounts, including amounts held in escrow, received as consideration from the sale of investments are collected in cash. Taxable income includes non-cash income, such as changes in accrued and reinvested interest and dividends, which includes contractual payment-in-kind interest, and the amortization of discounts and fees. Cash collections of income resulting from contractual PIK interest or the amortization of discounts and fees generally occur upon the repayment of the loans or debt securities that include such items. Non-cash taxable income is reduced by non-cash expenses, such as realized losses and depreciation and amortization expense.
We intend to distribute quarterly dividends to our stockholders. In order to avoid certain excise taxes imposed on RICs, we currently intend to distribute during each calendar year an amount at least equal to the sum of (1) 98% of our ordinary income for the calendar year, (2) 98.2% of our capital gains in excess of capital losses for the one year period ending on October 31 of the calendar year, and (3) any ordinary income and net capital gains for the preceding year that were not distributed during such year. We will not be subject to excise taxes on amounts on which we are required to pay corporate income tax (such as retained net capital gains). In order to obtain the tax benefits applicable to RICs, we will be required to distribute to our stockholders with respect to each taxable year at least 90% of our ordinary income and realized net short-term capital gains in excess of realized net long-term capital losses.
We can offer no assurance that we will achieve results that will permit the payment of any cash distributions and, if we issue senior securities, we will be prohibited from making distributions if doing so causes us to fail to maintain the asset coverage ratios stipulated by the 1940 Act or if distributions are limited by the terms of any of our borrowings. See Item 1 “Business—Regulation.”
We maintain an “opt-out” dividend reinvestment plan for our common stockholders. As a result, if we declare a dividend, cash dividends will be automatically reinvested in additional shares of our common stock unless the stockholder specifically “opts out” of the dividend reinvestment plan and chooses to receive cash dividends.
Our ability to make distributions will be limited by the asset coverage requirements under the 1940 Act.
90
Table of Contents
Critical Accounting Policies
The preparation of consolidated financial statements in conformity with U.S. generally accepted accounting principles (“GAAP”) requires management to make estimates and assumptions that affect the reported amounts of assets and liabilities, and disclosure of contingent assets and liabilities at the date of the consolidated financial statements, and revenues and expenses during the period reported. On an ongoing basis, our management evaluates its estimates and assumptions, which are based on historical experience and on various other assumptions that we believe to be reasonable under the circumstances. Actual results could differ from those estimates. Changes in our estimates and assumptions could materially impact our results of operations and financial condition.
Valuation of Portfolio Investments
The most significant estimate inherent in the preparation of our consolidated financial statements is the valuation of investments and the related amounts of unrealized appreciation and depreciation of investments recorded.
Our investments are carried at fair value in accordance with the 1940 Act and Accounting Standards Codification (“ASC”) topic 820 Fair Value Measurements and Disclosures (formerly known as SFAS No. 157, Fair Value Measurements). At December 31, 2012, approximately 80.7% of the Company’s total assets represented investments in portfolio companies that are valued at fair value by the Board of Directors. Value, as defined in Section 2(a)(41) of the 1940 Act, is (i) the market price for those securities for which a market quotation is readily available and (ii) for all other securities and assets, fair value is as determined in good faith by the Board of Directors. Our debt securities are primarily invested in venture capital-backed companies in technology-related markets, including technology, biotechnology, life science and clean technology industries. Given the nature of lending to these types of businesses, our investments in these portfolio companies are generally considered Level 3 assets under ASC 820 because there is no known or accessible market or market indexes for these investment securities to be traded or exchanged. As such, it values substantially all of its investments at fair value as determined in good faith pursuant to a consistent valuation policy and our Board of Directors in accordance with the provisions of ASC 820 and the 1940 Act. Due to the inherent uncertainty in determining the fair value of investments that do not have a readily available market value, the fair value of our investments determined in good faith by our Board may differ significantly from the value that would have been used had a readily available market existed for such investments, and the differences could be material.
Our Board of Directors may from time to time engage an independent valuation firm to provide us with valuation assistance with respect to certain of our portfolio investments on a quarterly basis. We intend to continue to engage an independent valuation firm to provide us with assistance regarding our determination of the fair value of selected portfolio investments each quarter unless directed by the Board of Directors to cancel such valuation services. The scope of the services rendered by an independent valuation firm is at the discretion of the Board of Directors. Our Board of Directors is ultimately and solely responsible for determining the fair value of our investments in good faith.
With respect to investments for which market quotations are not readily available or when such market quotations are deemed not to represent fair value, our Board of Directors has approved a multi-step valuation process each quarter, as described below:
(1) our quarterly valuation process begins with each portfolio company or investment being initially valued by the investment professionals responsible for the portfolio investment;
(2) preliminary valuation conclusions are then documented and business based assumptions are discussed with our investment committee;
(3) the valuation committee of the Board of Directors reviews the preliminary valuation of the investment committee which incorporates the results of the independent valuation firm as appropriate.
(4) the Board of Directors discusses valuations and determines the fair value of each investment in our portfolio in good faith based on the input of, where applicable, the respective independent valuation firm and the valuation committee.
91
Table of Contents
We adopted ASC 820 on January 1, 2008. ASC 820 establishes a framework for measuring the fair value of the assets and liabilities and outlines a fair value hierarchy which prioritizes the inputs used to measure fair value and the effect of fair value measures on earnings. ASC 820 also enhances disclosure requirements for fair value measurements based on the level within the hierarchy of the information used in the valuation. ASC 820 applies whenever other standards require (or permit) assets or liabilities to be measured at fair value but does not expand the use of fair value in any new circumstances. ASC 820 defines fair value as the price that would be received to sell an asset or paid to transfer a liability in an orderly transaction between market participants at the measurement date.
We have categorized all investments recorded at fair value in accordance with ASC 820 based upon the level of judgment associated with the inputs used to measure their fair value. Hierarchical levels, defined by ASC 820 and directly related to the amount of subjectivity associated with the inputs to fair valuation of these assets and liabilities, are as follows:
Level 1—Inputs are unadjusted, quoted prices in active markets for identical assets at the measurement date. The types of assets carried at Level 1 fair value generally are equities listed in active markets.
Level 2—Inputs (other than quoted prices included in Level 1) are either directly or indirectly observable for the asset in connection with market data at the measurement date and for the extent of the instrument’s anticipated life. Fair valued assets that are generally included in this category are warrants held in a public company.
Level 3—Inputs reflect management’s best estimate of what market participants would use in pricing the asset at the measurement date. It includes prices or valuations that require inputs that are both significant to the fair value measurement and unobservable. Generally, assets carried at fair value and included in this category are the debt investments and warrants and equities held in a private company.
In accordance with ASU 2011-04, the following table provides quantitative information about our Level 3 fair value measurements of our investments as of December 31, 2012. In addition to the techniques and inputs noted in the table below, according to our valuation policy we may also use other valuation techniques and methodologies when determining our fair value measurements. The below table is not intended to be all-inclusive, but rather provides information on the significant Level 3 inputs as they relate to our fair value measurements.
| Investment Type - Level Three |
Fair Value at December 31, 2012 |
Valuation Techniques/ Methodologies |
Unobservable Input(a) |
Range | ||||
| (in thousands) | ||||||||
| Pharmaceuticals - Debt | $266,978 | Market Comparable Companies Option Pricing Model(b) |
Hypothetical Market Yield Premium/(Discount) Average Industry Volatility(c) Risk Free Interest Rate Estimated Time to Exit (in months) |
12.83% - 16.11% (2.0%) - 1.0% 57.67% 0.190% 15.2 | ||||
| Medical Devices - Debt | 46,022 | Market Comparable Companies | Hypothetical Market Yield Premium | 16.19% 0.0% - 1.0% | ||||
| Technology - Debt | 159,341 | Market Comparable Companies Liquidation |
Hypothetical Market Yield Premium/(Discount) Investment Collateral |
12.36% - 20.49% (1.5%) - 1.0% $0 - $7.4 million | ||||
| Clean Tech - Debt | 91,305 | Market Comparable Companies | Hypothetical Market Yield Premium | 12.69% 0% - 1.0% | ||||
| Lower Middle Market - Debt | 263,894 | Market Comparable Companies Broker Quote(d) |
Hypothetical Market Yield Premium Price Quotes Market Comparable Index Yield Spreads Par Value |
10.75% - 16.25% 0.0% - 1.0% 78.0% - 100% of par 4.33% - 5.93% $30.0 million | ||||
|
|
||||||||
| Total Level Three Debt Investments | $827,540 | |||||||
|
|
||||||||
92
Table of Contents
| (a) | The significant unobservable inputs used in the fair value measurement of the Company’s debt securities are hypothetical market yields and premiums/(discounts). The hypothetical market yield is defined as the exit price of an investment in a hypothetical market to hypothetical market participants where buyers and sellers are willing participants. The premiums (discounts) relate to company specific characteristics such as underlying investment performance, security liens, and other characteristics of the investment. Significant increases (decreases) in the inputs in isolation would result in a significantly lower (higher) fair value measurement, depending on the materiality of the investment. Debt investments in the industries noted in the Company’s Schedule of Investments are included in the industries note above as follows: |
Pharmaceuticals, above, is comprised of debt investments in the Specialty Pharmaceuticals, Drug Discovery and Development, Drug Delivery, and Diagnostics and Biotechnology industries in the Schedule of Investments.
Medical Devices, above, is comprised of debt investments in the Therapeutic, Surgical Devices, Medical Devices and Equipment and Biotechnology Tools industries in the Schedule of Investments.
Technology, above, is comprised of debt investments in the Software, Semiconductors, Electronics and Computer Hardware, Internet Consumer and Business Services, Information Services, Media/Content/Info and Communications and Networking industries in the Schedule of Investments.
Lower Middle Market, above, is comprised of debt investments in the Communications and Networking, Software, Electronics and Computer Hardware, Information Services, Internet Consumer and Business Services, Media/Content/Info, and Specialty Pharmaceuticals industries in the Schedule of Investments.
Clean Tech, above, aligns with the Clean Tech industry in the Schedule of Investments.
| (b) | An option pricing model valuation technique was used to derive the fair value of the conversion feature of convertible notes. |
| (c) | Represents the range of industry volatility used by market participants when pricing the investment. |
| (d) | A broker quote valuation technique was used to derive the fair value of loans which are part of a syndicated facility. |
| Investment Type - Level Three Warrant and Equity Investments |
Fair Value at December 31, 2012 |
Valuation Techniques/ |
Unobservable Input(a) |
Range | ||||||
| (in thousands) | ||||||||||
| Warrant and Equity positions | $57,685 | Market Comparable Companies |
EBITDA Multiple(b) Revenue Multiple(b) | 1.43x - 20.68x 0.42x - 16.98x | ||||||
| Discount for Lack of Marketability(c) | 10.4% - 25.2% | |||||||||
| Warrant positions additionally subject to: | Option Pricing Model | Average Industry Volatility(d) | 46.49% - 141.2% | |||||||
| Risk-Free Interest Rate | 0.17% - 0.46% | |||||||||
| Estimated Time to Exit (in months) |
12 - 48 | |||||||||
|
|
|
|||||||||
| Total Level Three Warrant and Equity Investments |
$57,685 | |||||||||
|
|
|
|||||||||
| (a) | The significant unobservable inputs used in the fair value measurement of the Company’s warrant and equity-related securities are revenue and/or EBITDA multiples and discounts for lack of marketability. Additional inputs used in the Black Scholes option pricing model include industry volatility, risk free interest rate and estimated time to exit. Significant increases (decreases) in the inputs in isolation would result in a significantly higher (lower) fair value measurement, depending on the materiality of the investment. For some investments, additional consideration may be given to data from the last round of financing or merger/acquisition events near the measurement date. |
| (b) | Represents amounts used when the Company has determined that market participants would use such multiples when pricing the investments. |
| (c) | Represents amounts used when the Company has determined market participants would take into account these discounts when pricing the investments. |
| (d) | Represents the range of industry volatility used by market participants when pricing the investment. |
93
Table of Contents
Debt Investments
We follow the guidance set forth in ASC 820 which establishes a framework for measuring the fair value of assets and liabilities and outlines a fair value hierarchy which prioritizes the inputs used to measure fair value and the effect of fair value measures on earnings. Our debt securities are primarily invested in venture capital-backed companies in technology-related markets, including technology, biotechnology, life science and clean-technology industries at all stages of development. Given the nature of lending to these types of businesses, our investments in these portfolio companies are considered Level 3 assets under ASC 820 because there is no known or accessible market or market indexes for these investment securities to be traded or exchanged.
In making a good faith determination of the value of our investments, we generally start with the cost basis of the investment, which includes the value attributed to the OID, if any, and PIK interest which has been accrued to principal as earned. We then apply the valuation methods as set forth below.
We apply a procedure for debt investments that assumes a sale of investment in a hypothetical market to a hypothetical market participant where buyers and sellers are willing participants. The hypothetical market does not include scenarios where the underlying security was simply repaid or extinguished, but includes an exit concept. Under this process, we also evaluate the collateral for recoverability of the debt investments as well as apply all of its historical fair value analysis. We use pricing on recently issued comparable debt securities to determine the baseline hypothetical market yields as of the measurement date. We consider each portfolio company’s credit rating, security liens and other characteristics of the investment to adjust the baseline yield to derive a hypothetical yield for each investment as of the measurement date. The anticipated future cash flows from each investment are then discounted at the hypothetical yield to estimate each investment’s fair value as of the measurement date.
Our process includes, among other things, the underlying investment performance, the current portfolio company’s financial condition and market changing events that impact valuation, estimated remaining life, current market yield and interest rate spreads of similar securities as of the measurement date. We value our syndicated loans using broker quotes and bond indices amongst other factors. If there is a significant deterioration of the credit quality of a debt investment, we may consider other factors than those a hypothetical market participant would use to estimate fair value, including the proceeds that would be received in a liquidation analysis.
We record unrealized depreciation on investments when we believe that an investment has decreased in value, including where collection of a loan is doubtful or if under the in exchange premise when the value of a debt security were to be less than amortized cost of the investment. Conversely, where appropriate, we record unrealized appreciation if we believe that the underlying portfolio company has appreciated in value and, therefore, that our investment has also appreciated in value or if under the in exchange premise the value of a debt security were to be greater than amortized cost.
When originating a debt instrument, we generally receive warrants or other equity-related securities from the borrower. We determine the cost basis of the warrants or other equity-related securities received based upon their respective fair values on the date of receipt in proportion to the total fair value of the debt and warrants or other equity-related securities received. Any resulting discount on the loan from recordation of the warrant or other equity instruments is accreted into interest income over the life of the loan.
Equity-Related Securities and Warrants
Securities that are traded in the over-the-counter markets or on a stock exchange will be valued at the prevailing bid price at period end. We have a limited number of equity securities in public companies. In accordance with the 1940 Act, unrestricted publicly traded securities for which market quotations are readily available are valued at the closing market quote on the measurement date.
94
Table of Contents
We estimate the fair value of warrants using a Black Scholes pricing model. At each reporting date, privately held warrant and equity related securities are valued based on an analysis of various factors including, but not limited to, the portfolio company’s operating performance and financial condition and general market conditions, price to enterprise value or price to equity ratios, discounted cash flow, valuation comparisons to comparable public companies or other industry benchmarks. When an external event occurs, such as a purchase transaction, public offering, or subsequent equity sale, the pricing indicated by that external event is utilized to corroborate our valuation of the warrant and equity related securities. We periodically review the valuation of our portfolio companies that have not been involved in a qualifying external event to determine if the enterprise value of the portfolio company may have increased or decreased since the last valuation measurement date.
Income Recognition.
We record interest income on the accrual basis and we recognize it as earned in accordance with the contractual terms of the loan agreement to the extent that such amounts are expected to be collected. Original Issue Discount (“OID”) initially represents the value of detachable equity warrants obtained in conjunction with the acquisition of debt securities and is accreted into interest income over the term of the loan as a yield enhancement. When a loan becomes 90 days or more past due, or if management otherwise does not expect the portfolio company to be able to service its debt and other obligations, we will generally place the loan on non-accrual status and cease recognizing interest income on that loan until all principal has been paid. Any uncollected interest related to prior periods is reversed from income in the period that collection of the interest receivable is determined to be doubtful. However, we may make exceptions to this policy if the investment has sufficient collateral value and is in the process of collection. As of December 31, 2012, we had one portfolio company on non-accrual status with an approximate cost of $347,000 and no fair market value. There was one portfolio company on non-accrual status with an aggregate cost of approximately $7.7 million and a fair value of approximately $1.0 million as of December 31, 2011. During the third quarter of 2012 we recognized a realized loss of approximately $5.1 million on our warrant, equity and debt investments in this company.
Paid-In-Kind and End of Term Income.
Contractual paid-in-kind (“PIK”) interest, which represents contractually deferred interest added to the loan balance that is generally due at the end of the loan term, is generally recorded on the accrual basis to the extent such amounts are expected to be collected. We will generally cease accruing PIK interest if there is insufficient value to support the accrual or we do not expect the portfolio company to be able to pay all principal and interest due. In addition, we may also be entitled to an end-of-term payment that we amortize into income over the life of the loan. To maintain our status as a RIC, PIK and end-of-term income must be paid out to stockholders in the form of dividends even though we have not yet collected the cash. Amounts necessary to pay these dividends may come from available cash or the liquidation of certain investments. For the year ended December 31, 2012, 2011 and 2010, approximately $1.5 million, $1.7 million and $2.3 million in PIK income was recorded respectively.
Fee Income.
Fee income, generally collected in advance, includes loan commitment and facility fees for due diligence and structuring, as well as fees for transaction services and management services rendered by us to portfolio companies and other third parties. Loan and commitment fees are amortized into income over the contractual life of the loan. Management fees are generally recognized as income when the services are rendered. Loan origination fees are capitalized and then amortized into interest income using the effective interest rate method. In certain loan arrangements, warrants or other equity interests are received from the borrower as additional origination fees.
We recognize nonrecurring fees amortized over the remaining term of the loan commencing in the quarter relating to specific loan modifications. Certain fees may still be recognized as one-time fees, including prepayment penalties, fees related to select covenant default waiver fees and acceleration of previously deferred loan fees and original issue discount (OID) related to early loan pay-off or material modification of the specific debt outstanding.
95
Table of Contents
Equity Offering Expenses
Our offering costs are charged against the proceeds from equity offerings when received.
Debt Issuance Costs
Debt issuance costs are being amortized over the life of the related debt instrument using the straight line method, which closely approximates the effective yield method.
Stock-Based Compensation.
We have issued and may, from time to time, issue additional stock options and restricted stock to employees under our 2004 Equity Incentive Plan and Board members under our 2006 Equity Incentive Plan. We follow ASC 718, formally known as FAS 123R “Share-Based Payments” to account for stock options granted. Under ASC 718, compensation expense associated with stock-based compensation is measured at the grant date based on the fair value of the award and is recognized over the vesting period.
Federal Income Taxes.
We intend to operate so as to qualify to be taxed as a RIC under Subchapter M of the Code and, as such, will not be subject to federal income tax on the portion of our taxable income and gains distributed to stockholders. To qualify as a RIC, we are required to distribute at least 90% of our investment company taxable income, as defined by the Code. We are subject to a non-deductible federal excise tax if we do not distribute at least 98% of our taxable income and 98.2% of our capital gain net income for each one year period ending on October 31. At December 31, 2012, 2011, 2010 and 2009, no excise tax was recorded. We intend to distribute approximately $1.5 million of spillover earnings from the year ended December 31, 2012 to our shareholders in 2013. Because federal income tax regulations differ from accounting principles generally accepted in the United States, distributions in accordance with tax regulations may differ from net investment income and realized gains recognized for financial reporting purposes. Differences may be permanent or temporary. Permanent differences are reclassified among capital accounts in the financial statement to reflect their tax character. Temporary differences arise when certain items of income, expense, gain or loss are recognized at some time in the future. Differences in classification may also result from the treatment of short-term gains as ordinary income for tax purposes.
Recent Accounting Pronouncements
In May 2011, the Financial Accounting Standards Board (“FASB”) issued Accounting Standards Update No. 2011-04—Fair Value Measurement: Amendments to Achieve Common Fair Value Measurement and Disclosure Requirements in U.S. GAAP and IFRS, or ASU 2011-04. ASU 2011-04 clarifies the application of existing fair value measurement and disclosure requirements, changes the application of some requirements for measuring fair value and requires additional disclosure for fair value measurements. The highest and best use valuation premise is only applicable to non-financial assets. In addition, the disclosure requirements are expanded to include for fair value measurements categorized in Level 3 of the fair value hierarchy: (1) a quantitative disclosure of the unobservable inputs and assumptions used in the measurement; (2) a description of the valuation processes in place; and (3) a narrative description of the sensitivity of the fair value to changes in unobservable inputs and interrelationships between those inputs. ASU 2011-04 is effective for interim and annual periods beginning after December 15, 2011, for public entities and as such we have adopted this ASU beginning with our quarter ended March 31, 2012. We have increased our disclosures related to Level 3 fair value measurement, in addition to other required disclosures. There were no related impacts on our financial position or results of operations.
96
Table of Contents
Subsequent Events
Dividend Declaration
On February 26, 2013 the Board of Directors increased the quarterly dividend by $0.01, or approximately 4.02%, and declared a cash dividend of $0.25 per share that will be payable on March 19, 2013 to shareholders of record as of March 11, 2013. This dividend would represent the Company’s thirtieth consecutive dividend declaration since its initial public offering, bringing the total cumulative dividend declared to date to $7.89 per share.
Closed and Pending Commitments
As of February 25, 2013, we have:
| a. | Closed commitments of approximately $115.6 million to new and existing portfolio companies, and funded approximately $90.0 million since the close of the fourth quarter of 2012. |
| b. | Pending commitments (signed non-binding term sheets) of approximately $126.5 million. The table below summarizes our year-to-date closed and pending commitments as follows: |
The table below summarizes our year-to-date closed and pending commitments as follows:
| Closed and Pending Commitments (in millions) |
||||
| Q1-13 Closed Commitments (as of February 25, 2013) (a,b) |
$ | 115.6 | ||
| Pending Commitments (as of February 25, 2013) (b) |
$ | 126.5 | ||
| Year-to-date 2013 Closed and Pending Commitments |
$ | 242.1 | ||
Notes:
| a. | Not all Closed Commitments result in future cash requirements. Commitments generally fund over the two succeeding quarters from close. |
| b. | Not all pending commitments (signed non-binding term sheets) are expected to close and do not necessarily represent any future cash requirements. |
| Item 7A. | Quantitative and Qualitative Disclosure About Market Risk |
We are subject to financial market risks, including changes in interest rates. Interest rate risk is defined as the sensitivity of our current and future earnings to interest rate volatility, variability of spread relationships, the difference in re-pricing intervals between our assets and liabilities and the effect that interest rates may have on our cash flows. Changes in the general level of interest rates can affect our net investment income, which is the difference between the interest income earned on interest earning assets and our interest expense incurred in connection with our interest bearing debt and liabilities. Changes in interest rates can also affect, among other things, our ability to acquire and originate loans and securities and the value of our investment portfolio.
As of December 31, 2012, approximately 98.5% of our portfolio loans were at variable rates or variable rates with a floor and 1.5% of our loans were at fixed rates. Over time additional investments may be at variable rates. We do not currently engage in any hedging activities. However, we may, in the future, hedge against interest rate fluctuations by using standard hedging instruments such as futures, options, and forward contracts. While hedging activities may insulate us against changes in interest rates, they may also limit our ability to participate in the benefits of lower interest rates with respect to our borrowed funds and higher interest rates with respect to our portfolio of investments. Interest rates on our borrowings are based primarily on LIBOR. Borrowings under our SBA program are fixed at the ten year treasury rate every March and September for borrowings of the preceding nine-months. Borrowings under the program are charged interest based on ten year treasury rates plus a spread and the rates are generally set for a pool of debentures issued by the SBA in nine-month periods. The rates of borrowings under the various draws from the SBA beginning in April 2007 and set semiannually in March and September range from 2.25% to 5.73%. In addition, the SBA charges a fee that is set
97
Table of Contents
annually, depending on the Federal fiscal year the leverage commitment was delegated by the SBA, regardless of the date that the leverage was drawn by the SBIC. The annual fees related to HT II debentures that pooled on September 22, 2010 were 0.406% and 0.285%, depending upon the year in which the underlying commitment was closed. The annual fees related to HT III debentures that pooled on September 19, 2012 were 0.804%. The annual fees on other debentures have been set at 0.906%. The average amount of debentures outstanding for the year ended December 31, 2012 for HT II was approximately $95.2 million with an average interest rate of approximately 5.68%. The average amount of debentures outstanding for the year ended December 31, 2012 for HT III was approximately $112.0 million with an average interest rate of approximately 3.25%. Interest is payable semiannually and there are no principal payments required on these issues prior to maturity. Debentures under the SBA generally mature ten years after being borrowed. Based on the initial draw down date of April 2007, the initial maturity of SBA debentures will occur in April 2017.
Borrowings under the Wells Facility will generally bear interest at a rate per annum equal to LIBOR plus 3.50%, with a floor of 4.25% and an advance rate of 50% against eligible loans. The Wells Facility is secured by loans in the borrowing base. The Wells Facility requires payment of a non-use fee on a scale of 0.0% to 0.50% of the average monthly outstanding balance. For the three-month period ended December 31, 2012, this non-use fee was approximately $96,000. On June 20, 2011 we paid an additional $1.1 million in structuring fees in connection with the Wells Facility which is being amortized through June 2014. At December 31, 2012, there was no debt outstanding under the Wells Facility.
Borrowings under the Union Bank Facility will generally bear interest at a rate per annum equal to LIBOR plus 2.25% with a floor of 4.0%. The Union Bank Facility required the payment of an unused fee of 0.50% annually. For the three-month period ended December 31, 2012, this non-use fee was approximately $65,000. The Union Bank Facility is collateralized by debt investments in our portfolio companies, and includes an advance rate equal to 50% of eligible loans placed in the collateral pool. The Union Bank Facility generally requires payment of interest on a monthly basis. All outstanding principal is due upon maturity. There were no outstanding borrowings under this facility at December 31, 2012. On November 2, 2011, we renewed and amended the Union Bank Facility. The other terms of the Union Bank Facility generally remain unchanged, including the stated interest rate. The Union Bank Facility will mature on November 1, 2014, revolving through the first 24 months with a term out provision for the remaining 12 months.
Borrowings under the Convertible Senior Notes mature on April 15, 2016 (the “Maturity Date”), unless previously converted or repurchased in accordance with their terms. The Convertible Senior Notes bear interest at a rate of 6.00% per year payable semiannually in arrears on April 15 and October 15 of each year, commencing on October 15, 2011. The Convertible Senior Notes are our senior unsecured obligations and rank senior in right of payment to the our existing and future indebtedness that is expressly subordinated in right of payment to the Convertible Senior Notes; equal in right of payment to our existing and future unsecured indebtedness that is not so subordinated; effectively junior in right of payment to any of our secured indebtedness (including unsecured indebtedness that we later secure) to the extent of the value of the assets securing such indebtedness; and structurally junior to all existing and future indebtedness (including trade payables) incurred by our subsidiaries, financing vehicles or similar facilities.
The April 2019 Notes will mature on April 30, 2019 and may be redeemed in whole or in part at our option at any time or from time to time on or after April 30, 2015, upon not less than 30 days nor more than 60 days written notice by mail prior to the date fixed for redemption thereof, at a redemption price of 100% of the outstanding principal amount thereof plus accrued and unpaid interest payments otherwise payable for the then-current quarterly interest period accrued to but not including the date fixed for redemption. The April 2019 Notes bear interest at a rate of 7.00% per year payable quarterly on January 30, April 30, July 30 and October 30 of each year, commencing on July 30, 2012.
The September 2019 Notes will mature on September 30, 2019 and may be redeemed in whole or in part at the Company’s option at any time or from time to time on or after September 30, 2015, upon not less than 30 days nor more than 60 days written notice by mail prior to the date fixed for redemption thereof, at a
98
Table of Contents
redemption price of 100% of the outstanding principal amount thereof plus accrued and unpaid interest payments otherwise payable for the then-current quarterly interest period accrued to but not including the date fixed for redemption. The September 2019 Notes bear interest at a rate of 7.00% per year payable quarterly on March 30, June 30, September 30 and December 30 of each year, commencing on December 30, 2012.
The April 2019 Notes and September 2019 Notes will be our direct unsecured obligations and will rank: (i) pari passu with our other outstanding and future senior unsecured indebtedness, including without limitation, the $75 million in aggregate principal amount of the Convertible Senior Notes; (ii) senior to any of our future indebtedness that expressly provides it is subordinated to the Notes; (iii) effectively subordinated to all our existing and future secured indebtedness (including indebtedness that is initially unsecured to which we subsequently grant security), to the extent of the value of the assets securing such indebtedness, including without limitation, borrowings under our credit facilities; (iv) structurally subordinated to all existing and future indebtedness and other obligations of any of our subsidiaries, including without limitation, the indebtedness of Hercules Technology II, L.P. and Hercules Technology III, L.P. and borrowings under our revolving senior secured credit facility with Wells Fargo Capital Finance.
In connection with our $230.7 million Debt Securitization, the Securitization Issuer made an offering of $129.3 million in aggregate principal amount of the Asset-Backed Notes. Interest on the Asset-Backed Notes will be paid, to the extent of funds available, at a fixed rate of 3.32% per annum. The Asset-Backed Notes have a stated maturity of December 16, 2017.
As of the closing date of the Debt Securitization, all of the floating rate Loans sold and/or contributed to the Securitization Issuer are subject to interest rate floors. As of the closing date of the Debt Securitization, all of the floating rate Loans are accruing interest at the applicable interest rate floors specified thereunder, which rate floors are in excess of the fixed rate of interest accruing on the Asset-Backed Notes, which naturally hedges the Securitization Issuer’s assets and liabilities. However, there is no requirement for any Loan to have an interest rate floor and there can be no assurance that any such interest rate floor will fully mitigate any decrease in “excess spread” (i.e. the difference between the interest collected on the Loans and the sum of the interest payable on the Asset-Backed Notes and certain transaction fees and expenses payable by the Issuer) that otherwise would be available to make payments on the Asset-Backed Notes, as credit support, or as otherwise provided in the priority of payments under the documents governing the Debt Securitization. In the unlikely event that a breach of the representations and warranties under the documents governing the Debt Securitization with respect to the Loans in the pool as of the closing date of the Debt Securitization were to occur, a substantial volume of substitutions of Loans in the pool could result. There can be no assurance that the applicable margins and any applicable interest rate floors on such substitute Loans would be in excess of the interest on the Asset-Backed Notes. As a result of such substitutions, and subject in the case of floating rate Loans to changes in the level of LIBOR or any other applicable floating rate index, a mismatch could therefore arise between the rates of interest accruing in connection with the Loans in the pool and the fixed rate of interest accruing on the Asset-Backed Notes. Consequently, amounts payable by the Securitization Issuer could exceed collections on the Loans in the pool, which could delay, reduce or eliminate the ability of the Securitization Issuer to make distributions in respect of the equity interest that we indirectly hold.
Because we currently borrow, and plan to borrow in the future, money to make investments, our net investment income is dependent upon the difference between the rate at which we borrow funds and the rate at which we invest the funds borrowed. Accordingly, there can be no assurance that a significant change in market interest rates will not have a material adverse effect on our net investment income. In periods of rising interest rates, our cost of funds would increase, which could reduce our net investment income if there is not a corresponding increase in interest income generated by variable rate assets in our investment portfolio.
99
Table of Contents
| Item 8. | Financial Statements and Supplementary Data |
INDEX TO FINANCIAL STATEMENTS
100
Table of Contents
REPORT OF INDEPENDENT REGISTERED PUBLIC ACCOUNTING FIRM
To Board of Directors and Shareholders of
Hercules Technology Growth Capital, Inc.
In our opinion, the accompanying consolidated statement of assets and liabilities, including the consolidated schedule of investments, and the related consolidated statements of operations, of changes in net assets, and of cash flows present fairly, in all material respects, the financial position of Hercules Technology Growth Capital, Inc. and its subsidiaries (the “Company”) at December 31, 2012 and 2011, and the results of their operations and their cash flows for each of the three years in the period ended December 31, 2012 in conformity with accounting principles generally accepted in the United States of America. Also in our opinion, the Company maintained, in all material respects, effective internal control over financial reporting as of December 31, 2012, based on criteria established in Internal Control - Integrated Framework issued by the Committee of Sponsoring Organizations of the Treadway Commission (COSO). The Company’s management is responsible for these financial statements, for maintaining effective internal control over financial reporting and for its assessment of the effectiveness of internal control over financial reporting, included in Management’s Report on Internal Control over Financial Reporting. Our responsibility is to express opinions on these financial statements and on the Company’s internal control over financial reporting based on our integrated audits. We conducted our audits in accordance with the standards of the Public Company Accounting Oversight Board (United States). Those standards require that we plan and perform the audits to obtain reasonable assurance about whether the financial statements are free of material misstatement and whether effective internal control over financial reporting was maintained in all material respects. Our audits of the financial statements included examining, on a test basis, evidence supporting the amounts and disclosures in the financial statements, assessing the accounting principles used and significant estimates made by management, and evaluating the overall financial statement presentation. Our audit of internal control over financial reporting included obtaining an understanding of internal control over financial reporting, assessing the risk that a material weakness exists, and testing and evaluating the design and operating effectiveness of internal control based on the assessed risk. Our audits also included performing such other procedures as we considered necessary in the circumstances. We believe that our audits provide a reasonable basis for our opinions.
A company’s internal control over financial reporting is a process designed to provide reasonable assurance regarding the reliability of financial reporting and the preparation of financial statements for external purposes in accordance with generally accepted accounting principles. A company’s internal control over financial reporting includes those policies and procedures that (i) pertain to the maintenance of records that, in reasonable detail, accurately and fairly reflect the transactions and dispositions of the assets of the company; (ii) provide reasonable assurance that transactions are recorded as necessary to permit preparation of financial statements in accordance with generally accepted accounting principles, and that receipts and expenditures of the company are being made only in accordance with authorizations of management and directors of the company; and (iii) provide reasonable assurance regarding prevention or timely detection of unauthorized acquisition, use, or disposition of the company’s assets that could have a material effect on the financial statements.
Because of its inherent limitations, internal control over financial reporting may not prevent or detect misstatements. Also, projections of any evaluation of effectiveness to future periods are subject to the risk that controls may become inadequate because of changes in conditions, or that the degree of compliance with the policies or procedures may deteriorate.
/s/ PricewaterhouseCoopers LLP
San Francisco, CA
February 28, 2013
101
Table of Contents
HERCULES TECHNOLOGY GROWTH CAPITAL, INC.
CONSOLIDATED STATEMENTS OF ASSETS AND LIABILITIES
(in thousands, except per share data)
| December 31, | ||||||||
| 2012 | 2011 | |||||||
| Assets |
||||||||
| Investments: |
||||||||
| Non-control/Non-affiliate investments (cost of $896,031 and $642,038, respectively) |
$ | 894,428 | $ | 651,843 | ||||
| Affiliate investments (cost of $18,307 and $3,236, respectively) |
11,872 | — | ||||||
| Control investments (cost of $0 and $11,266, respectively) |
— | 1,027 | ||||||
|
|
|
|
|
|||||
| Total investments, at value (cost of $914,338 and $656,540, respectively) |
906,300 | 652,870 | ||||||
| Cash and cash equivalents |
182,994 | 64,474 | ||||||
| Interest receivable |
9,635 | 5,820 | ||||||
| Other assets |
24,714 | 24,230 | ||||||
|
|
|
|
|
|||||
| Total assets |
$ | 1,123,643 | $ | 747,394 | ||||
|
|
|
|
|
|||||
| Liabilities |
||||||||
| Accounts payable and accrued liabilities |
$ | 11,575 | $ | 10,813 | ||||
| Wells Fargo Loan |
— | 10,187 | ||||||
| Long-term Liabilities (Convertible Senior Notes) |
71,436 | 70,353 | ||||||
| Asset-Backed Notes |
129,300 | — | ||||||
| 2019 Notes |
170,364 | — | ||||||
| Long-term SBA Debentures |
225,000 | 225,000 | ||||||
|
|
|
|
|
|||||
| Total liabilities |
$ | 607,675 | $ | 316,353 | ||||
| Commitments and Contingencies (Note 9) |
||||||||
| Net assets consist of: |
||||||||
| Common stock, par value |
53 | 44 | ||||||
| Capital in excess of par value |
564,508 | 484,244 | ||||||
| Unrealized depreciation on investments |
(7,947 | ) | (3,431 | ) | ||||
| Accumulated realized losses on investments |
(36,916 | ) | (43,042 | ) | ||||
| Distributions in excess of investment income |
(3,730 | ) | (6,774 | ) | ||||
|
|
|
|
|
|||||
| Total net assets |
$ | 515,968 | $ | 431,041 | ||||
|
|
|
|
|
|||||
| Total liabilities and net assets |
$ | 1,123,643 | $ | 747,394 | ||||
|
|
|
|
|
|||||
| Shares of common stock outstanding ($0.001 par value, 100,000,000 authorized) |
52,925 | 43,853 | ||||||
| Net asset value per share |
$ | 9.75 | $ | 9.83 | ||||
102
Table of Contents
The following table presents the assets and liabilities of our consolidated variable interest entity (“VIE”). The assets of the VIE can only be used to settle obligations of the consolidated VIE, and the creditors (or beneficial interest holders) do not have recourse to our general credit. These assets and liabilities are included in the Consolidated Statements of Assets and Liabilities above.
| December 31, | ||||||||
| (Dollars in thousands) |
2012 | 2011 | ||||||
| ASSETS |
||||||||
| Total investments, at value (cost of $226,844 and $0, respectively) |
$ | 226,997 | $ | — | ||||
|
|
|
|
|
|||||
| Total assets |
$ | 226,997 | $ | — | ||||
|
|
|
|
|
|||||
| LIABILITIES |
||||||||
| Asset-Backed Notes |
$ | 129,300 | $ | — | ||||
|
|
|
|
|
|||||
| Total liabilities |
$ | 129,300 | $ | — | ||||
|
|
|
|
|
|||||
103
Table of Contents
HERCULES TECHNOLOGY GROWTH CAPITAL, INC.
CONSOLIDATED SCHEDULE OF INVESTMENTS
December 31, 2012
(dollars in thousands)
| Portfolio Company |
Sub-Industry | Type of Investment(1) |
Series | Principal Amount |
Cost(2) | Value(3) | ||||||||||||
| Anthera Pharmaceuticals Inc.(3) |
Drug Discovery & Development |
Senior Debt(11) |
$ | 20,532 | $ | 20,745 | $ | 21,007 | ||||||||||
| Aveo Pharmaceuticals, Inc.(3) |
Drug Discovery & Development |
Senior Debt(11) |
$ | 26,500 | 26,500 | 27,030 | ||||||||||||
| Cempra, Inc.(3) |
Drug Discovery & Development |
Senior Debt(11) |
$ | 10,000 | 9,862 | 9,902 | ||||||||||||
| Chroma Therapeutics, Ltd.(5)(10) |
Drug Discovery & Development |
Senior Debt |
$ | 4,111 | 4,718 | 4,759 | ||||||||||||
| Concert Pharmaceuticals, Inc.(4) |
Drug Discovery & Development |
Senior Debt |
$ | 20,000 | 19,633 | 18,983 | ||||||||||||
| Coronado BioSciences, Inc.(3) |
Drug Discovery & Development |
Senior Debt(11) |
$ | 15,000 | 14,761 | 14,761 | ||||||||||||
| Dicerna Pharmaceuticals, Inc. |
Drug Discovery & Development |
Senior Debt |
$ | 9,166 | 8,996 | 8,929 | ||||||||||||
| Insmed, Inc. |
Drug Discovery & Development |
Senior Debt(11) |
$ | 20,000 | 19,305 | 19,674 | ||||||||||||
| Merrimack Pharmaceuticals, Inc. |
Drug Discovery & Development |
Senior Debt |
$ | 40,000 | 39,670 | 39,670 | ||||||||||||
| NeurogesX, Inc.(3) |
Drug Discovery & Development |
Senior Debt |
$ | 13,662 | 13,645 | 13,884 | ||||||||||||
| Paratek Pharmaceuticals, Inc. |
Drug Discovery & Development |
Senior Debt(9) |
$ | 45 | 45 | 45 | ||||||||||||
| Senior Debt(9) |
$ | 36 | 31 | 31 | ||||||||||||||
|
|
|
|
|
|||||||||||||||
| Total Paratek Pharmaceuticals, Inc. |
|
76 | 76 | |||||||||||||||
|
|
|
|
|
|||||||||||||||
| Total Debt Drug Discovery & Development (34.63%)* |
|
177,911 | 178,675 | |||||||||||||||
|
|
|
|
|
|||||||||||||||
| Bridgewave Communications |
Communications & Networking |
Senior Debt |
$ | 7,500 | 7,003 | 4,896 | ||||||||||||
See notes to consolidated financial statements.
104
Table of Contents
HERCULES TECHNOLOGY GROWTH CAPITAL, INC.
CONSOLIDATED SCHEDULE OF INVESTMENTS
December 31, 2012
(dollars in thousands)
| Portfolio Company |
Sub-Industry | Type of Investment(1) |
Series | Principal Amount |
Cost(2) | Value(3) | ||||||||||||
| OpenPeak, Inc. |
Communications & Networking |
Senior Debt(11) |
$ | 15,000 | $ | 15,008 | $ | 15,158 | ||||||||||
| PeerApp, Inc.(4) |
Communications & Networking |
Senior Debt |
$ | 501 | 588 | 588 | ||||||||||||
| UPH Holdings, Inc. |
Communications & Networking |
Senior Debt |
$ | 7,000 | 6,880 | 6,772 | ||||||||||||
| Senior Debt |
$ | 347 | 343 | 333 | ||||||||||||||
| Senior Debt |
$ | 3,594 | 3,594 | 3,400 | ||||||||||||||
|
|
|
|
|
|||||||||||||||
| Total UPH Holdings, Inc. |
|
10,817 | 10,505 | |||||||||||||||
|
|
|
|
|
|||||||||||||||
| Total Debt Communications & Networking (6.04%)* |
|
33,416 | 31,147 | |||||||||||||||
|
|
|
|
|
|||||||||||||||
| Clustrix, Inc. |
Electronics & Computer Hardware |
Senior Debt |
$ | 235 | 227 | 227 | ||||||||||||
| Identive Group, Inc. |
Electronics & Computer Hardware |
Senior Debt |
$ | 7,500 | 7,447 | 7,447 | ||||||||||||
|
|
|
|
|
|||||||||||||||
| Total Debt Electronics & Computer Hardware (1.49%) |
|
7,674 | 7,674 | |||||||||||||||
|
|
|
|
|
|||||||||||||||
| Box, Inc.(4) |
Software | Senior Debt |
$ | 10,000 | 9,910 | 9,353 | ||||||||||||
| Senior Debt |
$ | 1,018 | 1,075 | 1,060 | ||||||||||||||
| Senior Debt(11) |
$ | 20,000 | 20,138 | 19,274 | ||||||||||||||
|
|
|
|
|
|||||||||||||||
| Total Box, Inc. |
|
31,123 | 29,687 | |||||||||||||||
| Clickfox, Inc. |
Software | Senior Debt |
$ | 8,000 | 7,318 | 7,558 | ||||||||||||
| EndPlay,Inc. |
Software | Senior Debt |
$ | 2,000 | 1,930 | 1,930 | ||||||||||||
See notes to consolidated financial statements.
105
Table of Contents
HERCULES TECHNOLOGY GROWTH CAPITAL, INC.
CONSOLIDATED SCHEDULE OF INVESTMENTS
December 31, 2012
(dollars in thousands)
| Portfolio Company |
Sub-Industry | Type of Investment(1) |
Series | Principal Amount |
Cost(2) | Value(3) | ||||||||||||
| Hillcrest Laboratories, Inc |
Software | Senior Debt |
$ | 4,000 | $ | 3,923 | $ | 3,860 | ||||||||||
| JackBe Corporation |
Software | Senior Debt |
$ | 3,000 | 2,900 | 2,900 | ||||||||||||
| Kxen, Inc.(4) |
Software | Senior Debt |
$ | 2,337 | 2,371 | 2,192 | ||||||||||||
| Tada Innovations, Inc. |
Software | Senior Debt(9) |
$ | 100 | 100 | — | ||||||||||||
|
|
|
|
|
|||||||||||||||
| Total Debt Software (9.33%)* |
|
49,665 | 48,127 | |||||||||||||||
|
|
|
|
|
|||||||||||||||
| Althea Technologies, Inc. |
Specialty Pharmaceuticals |
Senior Debt |
$ | 7,659 | 7,927 | 7,927 | ||||||||||||
| Quatrx Pharmaceuticals Company |
Specialty Pharmaceuticals |
Senior Debt(9) |
$ | 1,888 | 1,888 | 2,394 | ||||||||||||
|
|
|
|
|
|||||||||||||||
| Total Debt Specialty Pharmaceuticals (2.00%)* |
|
9,815 | 10,321 | |||||||||||||||
|
|
|
|
|
|||||||||||||||
| Achronix Semiconductor Corporation |
Semiconductors | Senior Debt |
$ | 1,847 | 1,803 | 1,783 | ||||||||||||
|
|
|
|
|
|||||||||||||||
| Total Debt Semiconductors (0.34%)* |
|
1,803 | 1,783 | |||||||||||||||
|
|
|
|
|
|||||||||||||||
| AcelRX Pharmaceuticals, Inc.(3) |
Drug Delivery | Senior Debt(11) |
$ | 16,345 | 16,222 | 15,983 | ||||||||||||
| ADMA Biologics, Inc. |
Drug Delivery | Senior Debt |
$ | 4,000 | 3,857 | 3,857 | ||||||||||||
| Alexza Pharmaceuticals, Inc.(3) |
Drug Delivery | Senior Debt(11) |
$ | 5,052 | 5,410 | 5,410 | ||||||||||||
| BIND Biosciences, Inc. |
Drug Delivery | Senior Debt |
$ | 3,326 | 3,320 | 3,387 | ||||||||||||
| Intelliject, Inc. |
Drug Delivery | Senior Debt(11) |
$ | 15,000 | 14,615 | 15,065 | ||||||||||||
| Nupathe, Inc.(3) |
Drug Delivery | Senior Debt |
$ | 8,500 | 8,166 | 8,166 | ||||||||||||
See notes to consolidated financial statements.
106
Table of Contents
HERCULES TECHNOLOGY GROWTH CAPITAL, INC.
CONSOLIDATED SCHEDULE OF INVESTMENTS
December 31, 2012
(dollars in thousands)
| Portfolio Company |
Sub-Industry | Type of Investment(1) |
Series | Principal Amount |
Cost(2) | Value(3) | ||||||||||||
| Revance Therapeutics, Inc. |
Drug Delivery | Senior Debt |
$ | 18,446 | $ | 18,330 | $ | 18,263 | ||||||||||
|
|
|
|
|
|||||||||||||||
| Total Debt Drug Delivery (13.59%)* |
|
69,920 | 70,131 | |||||||||||||||
|
|
|
|
|
|||||||||||||||
| Ahhha, Inc.(8) |
Internet Consumer & Business Services |
Senior Debt |
$ | 350 | 347 | — | ||||||||||||
| Blurb, Inc. |
Internet Consumer & Business Services |
Senior Debt |
$ | 8,000 | 7,708 | 7,429 | ||||||||||||
| Education Dynamics, LLC |
Internet Consumer & Business Services |
Senior Debt |
$ | 27,500 | 26,976 | 26,976 | ||||||||||||
| Just.Me, Inc. |
Internet Consumer & Business Services |
Senior Debt |
$ | 750 | 732 | 680 | ||||||||||||
| Senior Debt |
$ | 750 | 727 | 704 | ||||||||||||||
|
|
|
|
|
|
|
|||||||||||||
| 1,459 | 1,384 | |||||||||||||||||
| Loku, Inc. |
Internet Consumer & Business Services |
Senior Debt(9) |
$ | 100 | 100 | 100 | ||||||||||||
| NetPlenish, Inc. |
Internet Consumer & Business Services |
Senior Debt |
$ | 500 | 490 | 452 | ||||||||||||
| Reply! Inc. |
Internet Consumer & Business Services |
Senior Debt(11) |
$ | 11,749 | 11,624 | 11,337 | ||||||||||||
| Senior Debt(11) |
$ | 2,000 | 1,946 | 1,971 | ||||||||||||||
|
|
|
|
|
|
|
|||||||||||||
| Total Reply! Inc. |
|
13,570 | 13,308 | |||||||||||||||
| Second Rotation, Inc. |
Internet Consumer & Business Services |
Senior Debt |
$ | 5,843 | 5,860 | 5,880 | ||||||||||||
| Senior Debt |
$ | 1,947 | 1,888 | 1,909 | ||||||||||||||
See notes to consolidated financial statements.
107
Table of Contents
HERCULES TECHNOLOGY GROWTH CAPITAL, INC.
CONSOLIDATED SCHEDULE OF INVESTMENTS
December 31, 2012
(dollars in thousands)
| Portfolio Company |
Sub-Industry | Type of Investment(1) |
Series | Principal Amount |
Cost(2) | Value(3) | ||||||||||||
| Revolving Line of Credit |
$ | 327 | $ | 313 | $ | 313 | ||||||||||||
|
|
|
|
|
|||||||||||||||
| Total Second Rotation, Inc. |
|
8,061 | 8,102 | |||||||||||||||
| ShareThis, Inc. |
Internet Consumer & Business Services |
Senior Debt |
$ | 15,000 | 14,268 | 14,268 | ||||||||||||
| Tectura Corporation |
Internet Consumer & Business Services |
Revolving Line of Credit Floor rate of 11.00% |
$ | 16,340 | 17,850 | 17,797 | ||||||||||||
| Senior Debt Floor rate of 13.00% |
$ | 6,978 | 6,908 | 6,827 | ||||||||||||||
| Senior Debt Floor rate of 13.00% |
$ | 1,390 | 1,325 | 1,325 | ||||||||||||||
|
|
|
|
|
|
|
|||||||||||||
| Total Tectura Corporation |
|
26,083 | 25,949 | |||||||||||||||
| Trulia, Inc.(3) |
Internet Consumer & Business Services |
Senior Debt(11) |
$ | 5,000 | 4,921 | 4,729 | ||||||||||||
| Senior Debt(11) |
$ | 5,000 | 4,920 | 4,547 | ||||||||||||||
|
|
|
|
|
|
|
|||||||||||||
| Total Trulia, Inc. |
|
9,841 | 9,276 | |||||||||||||||
| Vaultlogix, Inc. |
Internet Consumer & Business Services |
Senior Debt |
$ | 7,500 | 7,681 | 7,721 | ||||||||||||
| Senior Debt |
$ | 10,253 | 10,190 | 9,854 | ||||||||||||||
|
|
|
|
|
|||||||||||||||
| Total Vaultlogix, Inc. |
|
17,871 | 17,575 | |||||||||||||||
| Votizen, Inc. |
Internet Consumer & Business Services |
Senior Debt(9) |
$ | 100 | 100 | 6 | ||||||||||||
| Wavemarket, Inc. |
Internet Consumer & Business Services |
Senior Debt(11) |
$ | 10,000 | 9,840 | 9,444 | ||||||||||||
|
|
|
|
|
|||||||||||||||
| Total Debt Internet Consumer & Business Services (26.02%)* |
|
136,714 | 134,269 | |||||||||||||||
|
|
|
|
|
|||||||||||||||
| Cha Cha Search, Inc. |
Information Services |
Senior Debt |
$ | 2,641 | 2,604 | 2,522 | ||||||||||||
See notes to consolidated financial statements.
108
Table of Contents
HERCULES TECHNOLOGY GROWTH CAPITAL, INC.
CONSOLIDATED SCHEDULE OF INVESTMENTS
December 31, 2012
(dollars in thousands)
| Portfolio Company |
Sub-Industry | Type of Investment(1) |
Series | Principal Amount |
Cost(2) | Value(3) | ||||||||||||
| Eccentex Corporation |
Information Services |
Senior Debt(11) |
$ | 1,000 | $ | 977 | $ | 965 | ||||||||||
| InXpo, Inc. |
Information Services |
Senior Debt |
$ | 2,550 | 2,466 | 2,434 | ||||||||||||
| Jab Wireless, Inc. |
Information Services |
Senior Debt |
$ | 30,000 | 29,852 | 29,850 | ||||||||||||
| RichRelevance, Inc. |
Information Services |
Senior Debt |
$ | 4,245 | 4,210 | 4,068 | ||||||||||||
| Womensforum.com, Inc. |
Information Services |
Senior Debt(11) |
$ | 8,000 | 7,838 | 7,838 | ||||||||||||
| Senior Debt(11) |
$ | 4,500 | 4,422 | 4,422 | ||||||||||||||
|
|
|
|
|
|||||||||||||||
| Total Womensforum.com, Inc. |
|
12,260 | 12,260 | |||||||||||||||
|
|
|
|
|
|||||||||||||||
| Total Debt Information Services (10.10%)* |
|
52,369 | 52,099 | |||||||||||||||
|
|
|
|
|
|||||||||||||||
| Gynesonics, Inc. |
Medical Device & Equipment |
Senior Debt |
$ | 3,912 | 3,975 | 4,014 | ||||||||||||
| Senior Debt |
$ | 253 | 247 | 247 | ||||||||||||||
| Senior Debt |
$ | 36 | 30 | 30 | ||||||||||||||
|
|
|
|
|
|||||||||||||||
| Total Gynesonics, Inc. |
|
4,252 | 4,291 | |||||||||||||||
| Lanx, Inc. |
Medical Device & Equipment |
Senior Debt |
$ | 15,000 | 14,428 | 14,428 | ||||||||||||
| Revolving Line of Credit |
$ | 5,500 | 5,300 | 5,300 | ||||||||||||||
|
|
|
|
|
|||||||||||||||
| Total Lanx, Inc. |
|
19,728 | 19,728 | |||||||||||||||
| Novasys Medical, Inc. |
Medical Device & Equipment |
Senior Debt(9) |
$ | 65 | 65 | 65 | ||||||||||||
See notes to consolidated financial statements.
109
Table of Contents
HERCULES TECHNOLOGY GROWTH CAPITAL, INC.
CONSOLIDATED SCHEDULE OF INVESTMENTS
December 31, 2012
(dollars in thousands)
| Portfolio Company |
Sub-Industry | Type of Investment(1) |
Series | Principal Amount |
Cost(2) | Value(3) | ||||||||||||
| Senior Debt(9) |
$ | 22 | $ | 20 | $ | 20 | ||||||||||||
|
|
|
|
|
|||||||||||||||
| Total Novasys Medical, Inc. |
|
85 | 85 | |||||||||||||||
| Optiscan Biomedical, Corp.(6) |
Medical Device & Equipment |
Senior Debt |
$ | 8,260 | 8,915 | 9,080 | ||||||||||||
| Senior Debt(9) |
$ | 288 | 288 | 288 | ||||||||||||||
| Senior Debt(9) |
$ | 123 | 123 | 123 | ||||||||||||||
|
|
|
|
|
|||||||||||||||
| Total Optiscan Biomedical, Corp. |
|
9,326 | 9,491 | |||||||||||||||
| Oraya Therapeutics, Inc. |
Medical Device & Equipment |
Senior Debt(9) |
$ | 500 | 500 | 500 | ||||||||||||
| Senior Debt(11) |
$ | 10,000 | 9,798 | 10,079 | ||||||||||||||
|
|
|
|
|
|||||||||||||||
| Total Oraya Therapeutics, Inc. |
|
10,298 | 10,579 | |||||||||||||||
| USHIFU, LLC |
Medical Device & Equipment |
Senior Debt(11) |
$ | 6,000 | 5,856 | 5,856 | ||||||||||||
|
|
|
|
|
|||||||||||||||
| Total Debt Medical Device & Equipment (9.69%)* |
|
49,545 | 50,030 | |||||||||||||||
|
|
|
|
|
|||||||||||||||
| Navidea Biopharmaceuticals, Inc. |
Diagnostic | Senior Debt |
$ | 5,741 | 5,691 | 5,752 | ||||||||||||
| Tethys Bioscience Inc. |
Diagnostic | Senior Debt(11) |
$ | 10,000 | 9,940 | 10,026 | ||||||||||||
|
|
|
|
|
|||||||||||||||
| Total Debt Diagnostic (3.06%)* |
|
15,631 | 15,778 | |||||||||||||||
|
|
|
|
|
|||||||||||||||
| Labcyte, Inc. |
Biotechnology Tools |
Senior Debt |
$ | 761 | 834 | 834 | ||||||||||||
| Senior Debt(11) |
$ | 5,000 | 4,890 | 4,995 | ||||||||||||||
|
|
|
|
|
|||||||||||||||
| Total Labcyte, Inc. |
|
5,724 | 5,829 | |||||||||||||||
|
|
|
|
|
|||||||||||||||
| Total Debt Biotechnology Tools (1.13%)* |
|
5,724 | 5,829 | |||||||||||||||
|
|
|
|
|
|||||||||||||||
See notes to consolidated financial statements.
110
Table of Contents
HERCULES TECHNOLOGY GROWTH CAPITAL, INC.
CONSOLIDATED SCHEDULE OF INVESTMENTS
December 31, 2012
(dollars in thousands)
| Portfolio Company |
Sub-Industry | Type of Investment(1) |
Series | Principal Amount |
Cost(2) | Value(3) | ||||||||||||
| MedCall, LLC |
Healthcare Services, Other |
Senior Debt |
$ | 4,908 | $ | 4,844 | $ | 4,695 | ||||||||||
| Senior Debt |
$ | 4,037 | 3,972 | 3,871 | ||||||||||||||
|
|
|
|
|
|||||||||||||||
| Total MedCall, LLC |
|
8,816 | 8,566 | |||||||||||||||
| Pacific Child & Family Associates, LLC |
Healthcare Services, Other |
Senior Debt |
$ | 3,661 | 3,713 | 3,713 | ||||||||||||
| Revolving Line of Credit |
$ | 1,500 | 1,490 | 1,490 | ||||||||||||||
| Senior Debt |
$ | 5,900 | 6,562 | 6,562 | ||||||||||||||
|
|
|
|
|
|||||||||||||||
| Total Pacific Child & Family Associates, LLC |
|
11,765 | 11,765 | |||||||||||||||
| ScriptSave (Medical Security Card Company, LLC) |
Healthcare Services, Other |
Senior Debt |
$ | 16,375 | 16,168 | 16,150 | ||||||||||||
|
|
|
|
|
|||||||||||||||
| Total Debt Health Services, Other (7.07%)* |
|
36,749 | 36,481 | |||||||||||||||
|
|
|
|
|
|||||||||||||||
| Entrigue Surgical, Inc. |
Surgical Devices |
Senior Debt |
$ | 2,463 | 2,431 | 2,427 | ||||||||||||
| Transmedics, Inc. |
Surgical Devices |
Senior Debt(11) |
$ | 7,250 | 7,464 | 7,464 | ||||||||||||
|
|
|
|
|
|||||||||||||||
| Total Debt Surgical Devices (1.92%)* |
|
9,895 | 9,891 | |||||||||||||||
|
|
|
|
|
|||||||||||||||
| Westwood One Communications |
Media/ Content/Info |
Senior Debt |
$ | 20,475 | 18,994 | 17,575 | ||||||||||||
| Women’s Marketing, Inc. |
Media/ Content/Info |
Senior Debt |
$ | 9,681 | 10,002 | 10,002 | ||||||||||||
| Senior Debt(11) |
$ | 16,362 | 16,105 | 15,787 | ||||||||||||||
|
|
|
|
|
|||||||||||||||
| Total Women’s Marketing, Inc. |
|
26,107 | 25,789 | |||||||||||||||
See notes to consolidated financial statements.
111
Table of Contents
HERCULES TECHNOLOGY GROWTH CAPITAL, INC.
CONSOLIDATED SCHEDULE OF INVESTMENTS
December 31, 2012
(dollars in thousands)
| Portfolio Company |
Sub-Industry | Type of Investment(1) |
Series | Principal Amount |
Cost(2) | Value(3) | ||||||||||||
| Zoom Media Corporation |
Media/ Content/Info |
Senior Debt |
$ | 5,000 | $ | 4,657 | $ | 4,657 | ||||||||||
| Media/ Content/Info |
Revolving Line of Credit |
$ | 3,000 | 2,700 | 2,700 | |||||||||||||
|
|
|
|
|
|||||||||||||||
| Total Zoom Media Corporation |
|
7,357 | 7,357 | |||||||||||||||
|
|
|
|
|
|||||||||||||||
| Total Debt Media/Content/Info (9.83%)* |
|
52,458 | 50,721 | |||||||||||||||
|
|
|
|
|
|||||||||||||||
| Alphabet Energy, Inc. |
Clean Tech | Senior Debt |
$ | 1,614 | 1,531 | 1,531 | ||||||||||||
|
American Supercondutor Corporation(3) |
Clean Tech | Senior Debt(11) |
$ | 9,231 | 9,161 | 9,438 | ||||||||||||
| BrightSource Energy, Inc. |
Clean Tech | Revolving Line of Credit |
$ | 35,000 | 34,870 | 34,870 | ||||||||||||
| Comverge, Inc. |
Clean Tech | Senior Debt |
$ | 20,000 | 19,577 | 19,577 | ||||||||||||
| Clean Tech | Senior Debt |
$ | 14,000 | 13,704 | 13,704 | |||||||||||||
|
|
|
|
|
|||||||||||||||
| Total Comverge, Inc. |
|
33,281 | 33,281 | |||||||||||||||
| Enphase Energy, Inc.(3) |
Clean Tech | Senior Debt(11) |
$ | 3,758 | 3,739 | 3,716 | ||||||||||||
| Clean Tech | Senior Debt |
$ | 7,400 | 7,321 | 7,321 | |||||||||||||
|
|
|
|
|
|||||||||||||||
| Total Enphase Energy, Inc. |
|
11,060 | 11,037 | |||||||||||||||
| Glori Energy, Inc. |
Clean Tech | Senior Debt(11) |
$ | 8,000 | 7,832 | 7,988 | ||||||||||||
| Integrated Photovoltaics, Inc. |
Clean Tech | Senior Debt |
$ | 2,572 | 2,494 | 2,508 | ||||||||||||
| Polyera Corporation |
Clean Tech | Senior Debt |
$ | 3,000 | 2,952 | 2,952 | ||||||||||||
See notes to consolidated financial statements.
112
Table of Contents
HERCULES TECHNOLOGY GROWTH CAPITAL, INC.
CONSOLIDATED SCHEDULE OF INVESTMENTS
December 31, 2012
(dollars in thousands)
| Portfolio Company |
Sub-Industry | Type of Investment(1) |
Series |
Principal Amount |
Cost(2) | Value(3) | ||||||||||||
| Redwood Systems, Inc. |
Clean Tech | Senior Debt |
$ | 5,000 | $ | 4,965 | $ | 4,965 | ||||||||||
| SCIenergy, Inc.(4) |
Clean Tech | Senior Debt |
$ | 5,296 | 5,103 | 5,262 | ||||||||||||
| Solexel, Inc. |
Clean Tech | Senior Debt |
$ | 2,884 | 2,877 | 2,877 | ||||||||||||
| Senior Debt |
$ | 331 | 330 | 330 | ||||||||||||||
|
|
|
|
|
|||||||||||||||
| Total Solexel, Inc. |
|
3,207 | 3,207 | |||||||||||||||
| Stion Corporation(4) |
Clean Tech | Senior Debt |
$ | 7,519 | 7,483 | 7,545 | ||||||||||||
|
|
|
|
|
|||||||||||||||
| Total Debt Clean Tech (24.14%)* |
|
123,938 | 124,584 | |||||||||||||||
|
|
|
|
|
|||||||||||||||
| Total Debt (160.38%) |
|
833,228 | 827,540 | |||||||||||||||
|
|
|
|
|
|||||||||||||||
See notes to consolidated financial statements.
113
Table of Contents
HERCULES TECHNOLOGY GROWTH CAPITAL, INC.
CONSOLIDATED SCHEDULE OF INVESTMENTS
December 31, 2012
(dollars in thousands)
| Portfolio Company |
Sub-Industry | Type of Investment(1) |
Series |
Shares | Cost(2) | Value(3) | ||||||||||||
| Acceleron Pharmaceuticals, Inc. |
Drug Discovery & Development |
Common Stock Warrants |
46,446 | $ | 39 | $ | 53 | |||||||||||
| Preferred Stock Warrants |
Series A | 426,000 | 69 | 345 | ||||||||||||||
| Preferred Stock Warrants |
Series B | 110,270 | 35 | 64 | ||||||||||||||
|
|
|
|
|
|
|
|||||||||||||
| Total Warrants Acceleron Pharmaceuticals, Inc. |
582,716 | 143 | 462 | |||||||||||||||
| Anthera Pharmaceuticals Inc.(3) |
Drug Discovery & Development |
Common Stock Warrants |
321,429 | 984 | 66 | |||||||||||||
| Cempra, Inc.(3) |
Drug Discovery & Development |
Common Stock Warrants |
39,038 | 187 | 46 | |||||||||||||
| Chroma Therapeutics, Ltd.(5)(10) |
Drug Discovery & Development |
Preferred Stock Warrants |
Series D | 325,261 | 490 | 500 | ||||||||||||
| Concert Pharmaceuticals, Inc.(4) |
Drug Discovery & Development |
Preferred Stock Warrants |
Series C | 400,000 | 367 | 126 | ||||||||||||
| Coronado Biosciences, Inc.(3) |
Drug Discovery & Development |
Common Stock Warrants |
73,009 | 142 | 81 | |||||||||||||
| Dicerna Pharmaceuticals, Inc. |
Drug Discovery & Development |
Common Stock Warrants |
50,000 | 28 | 16 | |||||||||||||
| Preferred Stock Warrants |
Series A | 525,000 | 236 | 173 | ||||||||||||||
| Preferred Stock Warrants |
Series B | 660,000 | 311 | 217 | ||||||||||||||
|
|
|
|
|
|
|
|||||||||||||
| Total Warrants Dicerna Pharmaceuticals, Inc. |
1,235,000 | 575 | 406 | |||||||||||||||
|
|
|
|
|
|||||||||||||||
| EpiCept Corporation(3) |
Drug Discovery & Development |
Common Stock Warrants |
325,204 | 4 | — | |||||||||||||
| Horizon Pharma, Inc.(3) |
Drug Discovery & Development |
Common Stock Warrants |
22,408 | 231 | — | |||||||||||||
| Insmed, Incorporated(3) |
Drug Discovery & Development |
Common Stock Warrants |
329,931 | 570 | 1,316 | |||||||||||||
| Merrimack Pharmaceuticals, Inc.(3) |
Drug Discovery & Development |
Common Stock Warrants |
302,143 | 155 | 641 | |||||||||||||
| NeurogesX, Inc.(3) |
Drug Discovery & Development |
Common Stock Warrants |
3,421,500 | 503 | 400 | |||||||||||||
| PolyMedix, Inc.(3) |
Drug Discovery & Development |
Common Stock Warrants |
627,586 | 480 | 9 | |||||||||||||
| Portola Pharmaceuticals, Inc. |
Drug Discovery & Development |
Preferred Stock Warrants |
Series B | 687,023 | 152 | 298 | ||||||||||||
|
|
|
|
|
|||||||||||||||
| Total Warrants Drug Discovery & Development (0.84%)* |
|
4,983 | 4,351 | |||||||||||||||
|
|
|
|
|
|||||||||||||||
| Bridgewave Communications |
Communications & Networking |
Preferred Stock Warrants |
Series 5 | 2,942,618 | 753 | — | ||||||||||||
| Intelepeer, Inc. |
Communications & Networking |
Preferred Stock Warrants |
Series C | 117,958 | 101 | 190 | ||||||||||||
| Neonova Holding Company |
Communications & Networking |
Preferred Stock Warrants |
Series A | 450,000 | 94 | 23 | ||||||||||||
| OpenPeak, Inc. |
Communications & Networking |
Preferred Stock Warrants |
Series E | 25,646 | 149 | 9 | ||||||||||||
| PeerApp, Inc.(4) |
Communications & Networking |
Preferred Stock Warrants |
Series B | 298,779 | 61 | 47 | ||||||||||||
| Peerless Network, Inc. |
Communications & Networking |
Preferred Stock Warrants |
Series A | 135,000 | 95 | 352 | ||||||||||||
| Ping Identity Corporation |
Communications & Networking |
Preferred Stock Warrants |
Series B | 1,136,277 | 52 | 112 | ||||||||||||
| UPH Holdings, Inc. |
Communications & Networking |
Common Stock Warrants |
145,877 | 131 | 52 | |||||||||||||
See notes to consolidated financial statements.
114
Table of Contents
HERCULES TECHNOLOGY GROWTH CAPITAL, INC.
CONSOLIDATED SCHEDULE OF INVESTMENTS
December 31, 2012
(dollars in thousands)
| Portfolio Company |
Sub-Industry | Type of Investment(1) |
Series |
Shares | Cost(2) | Value(3) | ||||||||||||
| Purcell Systems, Inc. |
Communications & Networking |
Preferred Stock Warrants |
Series B | 110,000 | $ | 123 | $ | 62 | ||||||||||
| Stoke, Inc. |
Communications & Networking |
Preferred Stock Warrants |
Series C | 158,536 | 53 | 135 | ||||||||||||
| Preferred Stock Warrants |
Series D | 72,727 | 65 | 57 | ||||||||||||||
|
|
|
|
|
|
|
|||||||||||||
| Total Stoke, Inc. |
231,263 | 118 | 192 | |||||||||||||||
|
|
|
|
|
|||||||||||||||
| Total Warrants Communications & Networking (0.20%)* |
|
1,677 | 1,039 | |||||||||||||||
|
|
|
|
|
|||||||||||||||
| Atrenta, Inc. |
Software | Preferred Stock Warrants |
Series D | 392,670 | 121 | 322 | ||||||||||||
| Box, Inc. (4) |
Software | Preferred Stock Warrants |
Series C | 271,070 | 117 | 2,235 | ||||||||||||
| Preferred Stock Warrants |
Series B | 199,219 | 73 | 3,242 | ||||||||||||||
| Preferred Stock Warrants |
Series D-1 | 62,255 | 194 | 566 | ||||||||||||||
|
|
|
|
|
|
|
|||||||||||||
| Total Box, Inc. |
532,544 | 384 | 6,043 | |||||||||||||||
| Braxton Technologies, LLC. |
Software | Preferred Stock Warrants |
Series A | 168,750 | 188 | — | ||||||||||||
| Central Desktop, Inc. |
Software | Preferred Stock Warrants |
Series B | 522,823 | 108 | 166 | ||||||||||||
| Clickfox, Inc. |
Software | Preferred Stock Warrants |
Series B | 1,038,563 | 329 | 332 | ||||||||||||
| Preferred Stock Warrants |
Series C | 592,019 | 730 | 213 | ||||||||||||||
|
|
|
|
|
|
|
|||||||||||||
| Total Clickfox, Inc. |
1,630,582 | 1,059 | 545 | |||||||||||||||
| Daegis Inc. (pka Unify Corporation)(3) |
Software | Common Stock Warrants |
718,860 | 1,434 | 75 | |||||||||||||
| Endplay, Inc. |
Software | Preferred Stock Warrants |
Series B | 180,000 | 67 | 39 | ||||||||||||
| Forescout Technologies, Inc. |
Software | Preferred Stock Warrants |
Series D | 399,687 | 99 | 202 | ||||||||||||
| HighRoads, Inc. |
Software | Preferred Stock Warrants |
Series B | 190,176 | 44 | 9 | ||||||||||||
| Hillcrest Laboratories, Inc. |
Software | Preferred Stock Warrants |
Series E | 1,865,650 | 55 | 70 | ||||||||||||
| JackBe Corporation |
Software | Preferred Stock Warrants |
Series C | 180,000 | 73 | 54 | ||||||||||||
| Kxen, Inc.(4) |
Software | Preferred Stock Warrants |
Series D | 184,614 | 47 | 13 | ||||||||||||
| Rockyou, Inc. |
Software | Preferred Stock Warrants |
Series B | 41,266 | 117 | — | ||||||||||||
| SugarSync Inc. |
Software | Preferred Stock Warrants |
Series CC | 332,726 | 78 | 123 | ||||||||||||
| Preferred Stock Warrants |
Series DD | 107,526 | 34 | 30 | ||||||||||||||
|
|
|
|
|
|
|
|||||||||||||
| Total SugarSync Inc. |
440,252 | 112 | 153 | |||||||||||||||
| Tada Innovations, Inc. |
Software | Preferred Stock Warrants |
Series A | 20,833 | 25 | — | ||||||||||||
| White Sky, Inc. |
Software | Preferred Stock Warrants |
Series B-2 | 124,295 | 54 | 3 | ||||||||||||
| WildTangent, Inc. |
Software | Preferred Stock Warrants |
Series 3A | 100,000 | 238 | 82 | ||||||||||||
|
|
|
|
|
|||||||||||||||
| Total Warrants Software (1.51%)* |
|
4,225 | 7,776 | |||||||||||||||
|
|
|
|
|
|||||||||||||||
| Clustrix, Inc. |
Electronics & Computer Hardware |
Preferred Stock Warrants |
Series B | 49,732 | 12 | 13 | ||||||||||||
| Luminus Devices, Inc. |
Electronics & Computer Hardware |
Common Stock Warrants |
26,386 | 600 | — | |||||||||||||
| Shocking Technologies, Inc. |
Electronics & Computer Hardware |
Preferred Stock Warrants |
Series A-1 | 181,818 | 63 | 106 | ||||||||||||
|
|
|
|
|
|||||||||||||||
| Total Warrant Electronics & Computer Hardware (0.02%)* |
|
675 | 119 | |||||||||||||||
|
|
|
|
|
|||||||||||||||
See notes to consolidated financial statements.
115
Table of Contents
HERCULES TECHNOLOGY GROWTH CAPITAL, INC.
CONSOLIDATED SCHEDULE OF INVESTMENTS
December 31, 2012
(dollars in thousands)
| Portfolio Company |
Sub-Industry | Type of Investment(1) |
Series |
Shares | Cost(2) | Value(3) | ||||||||||||
| Althea Technologies, Inc. |
Specialty Pharmaceuticals |
Preferred Stock Warrants |
Series D | 502,273 | $ | 309 | $ | 889 | ||||||||||
| Pacira Pharmaceuticals, Inc.(3) |
Specialty Pharmaceuticals |
Common Stock Warrants |
178,987 | 1,086 | 1,263 | |||||||||||||
| Quatrx Pharmaceuticals Company |
Specialty Pharmaceuticals |
Preferred Stock Warrants |
Series E | 340,534 | 528 | — | ||||||||||||
|
|
|
|
|
|||||||||||||||
| Total Warrants Specialty Pharmaceuticals (0.42%)* |
|
1,923 | 2,152 | |||||||||||||||
|
|
|
|
|
|||||||||||||||
| IPA Holdings, LLC |
Consumer & Business Products |
Common Stock Warrants |
650,000 | 275 | 485 | |||||||||||||
| Market Force Information, Inc. |
Consumer & Business Products |
Preferred Stock Warrants |
Series A | 99,286 | 24 | 84 | ||||||||||||
| Seven Networks, Inc. |
Consumer & Business Products |
Preferred Stock Warrants |
Series C | 1,821,429 | 174 | 130 | ||||||||||||
| ShareThis, Inc. |
Consumer & Business Products |
Preferred Stock Warrants |
Series B | 535,905 | 547 | 543 | ||||||||||||
| Wageworks, Inc.(3) |
Consumer & Business Products |
Common Stock Warrants |
211,765 | 252 | 2,023 | |||||||||||||
| Wavemarket, Inc. |
Consumer & Business Products |
Preferred Stock Warrants |
Series E | 1,083,333 | 106 | 61 | ||||||||||||
|
|
|
|
|
|||||||||||||||
| Total Warrant Consumer & Business Products (0.64%)* |
|
1,378 | 3,326 | |||||||||||||||
|
|
|
|
|
|||||||||||||||
| Achronix Semiconductor Corporation |
Semiconductors | Preferred Stock Warrants |
Series D | 360,000 | 160 | 84 | ||||||||||||
| Enpirion, Inc. |
Semiconductors | Preferred Stock Warrants |
Series D | 239,872 | 157 | — | ||||||||||||
| iWatt, Inc. |
Semiconductors | Preferred Stock Warrants |
Series C | 558,748 | 45 | 14 | ||||||||||||
| Preferred Stock Warrants |
Series D | 1,954,762 | 583 | 289 | ||||||||||||||
|
|
|
|
|
|
|
|||||||||||||
| Total iWatt, Inc. |
2,513,510 | 628 | 303 | |||||||||||||||
| Kovio Inc. |
Semiconductors | Preferred Stock Warrants |
Series B | 319,352 | 92 | — | ||||||||||||
| Quartics, Inc. |
Semiconductors | Preferred Stock Warrants |
Series C | 69,139 | 53 | — | ||||||||||||
|
|
|
|
|
|||||||||||||||
| Total Warrants Semiconductors (0.08%)* |
|
1,090 | 387 | |||||||||||||||
|
|
|
|
|
|||||||||||||||
| AcelRX Pharmaceuticals, Inc.(3) |
Drug Delivery | Common Stock Warrants |
274,508 | 356 | 406 | |||||||||||||
| ADMA Biologics, Inc. |
Drug Delivery | Common Stock Warrants |
25,000 | 129 | 128 | |||||||||||||
| Alexza Pharmaceuticals, Inc.(3) |
Drug Delivery | Common Stock Warrants |
37,639 | 645 | 8 | |||||||||||||
| BIND Biosciences, Inc. |
Drug Delivery | Preferred Stock Warrants |
Series C-1 | 150,000 | 291 | 446 | ||||||||||||
| Intelliject, Inc. |
Drug Delivery | Preferred Stock Warrants |
Series B | 82,500 | 594 | 574 | ||||||||||||
| NuPathe, Inc.(3) |
Drug Delivery | Common Stock Warrants |
106,631 | 139 | 165 | |||||||||||||
| Revance Therapeutics, Inc. |
Drug Delivery | Preferred Stock Warrants |
Series D | 269,663 | 557 | 618 | ||||||||||||
| Transcept Pharmaceuticals, Inc.(3) |
Drug Delivery | Common Stock Warrants |
61,452 | 87 | 44 | |||||||||||||
|
|
|
|
|
|||||||||||||||
| Total Warrant Drug Delivery (0.46%)* |
|
2,798 | 2,389 | |||||||||||||||
|
|
|
|
|
|||||||||||||||
| Blurb, Inc. |
Internet Consumer & Business Services |
Preferred Stock Warrants |
Series B | 439,336 | 323 | 347 | ||||||||||||
| Preferred Stock Warrants |
Series C | 234,280 | 636 | 218 | ||||||||||||||
|
|
|
|
|
|
|
|||||||||||||
| Total Blurb, Inc. |
673,616 | 959 | 565 | |||||||||||||||
| Invoke Solutions, Inc. |
Internet Consumer & Business Services |
Common Stock Warrants |
53,084 | 38 | — | |||||||||||||
See notes to consolidated financial statements.
116
Table of Contents
HERCULES TECHNOLOGY GROWTH CAPITAL, INC.
CONSOLIDATED SCHEDULE OF INVESTMENTS
December 31, 2012
(dollars in thousands)
| Portfolio Company |
Sub-Industry | Type of Investment(1) |
Series |
Shares | Cost(2) | Value(3) | ||||||||||||
| Just.Me |
Internet Consumer & Business Services |
Preferred Stock Warrants |
Series A | 102,299 | $ | 20 | $ | 20 | ||||||||||
| Prism Education Group, Inc. |
Internet Consumer & Business Services |
Preferred Stock Warrants |
Series B | 200,000 | 43 | — | ||||||||||||
| Reply! Inc. |
Internet Consumer & Business Services |
Preferred Stock Warrants |
Series B | 137,225 | 320 | 802 | ||||||||||||
| Second Rotation |
Internet Consumer & Business Services |
Preferred Stock Warrants |
Series D | 105,819 | 105 | 113 | ||||||||||||
| Tectura Corporation |
Internet Consumer & Business Services |
Preferred Stock Warrants |
Series B-1 | 253,378 | 51 | 12 | ||||||||||||
| Trulia, Inc.(3) |
Internet Consumer & Business Services |
Common Stock Warrants |
56,053 | 188 | 368 | |||||||||||||
|
|
|
|
|
|||||||||||||||
| Total Warrants Internet Consumer & Business Services (0.37%)* |
|
1,724 | 1,880 | |||||||||||||||
|
|
|
|
|
|||||||||||||||
| Buzznet, Inc. |
Information Services | Preferred Stock Warrants |
Series B | 19,962 | 9 | — | ||||||||||||
| Cha Cha Search, Inc. |
Information Services | Preferred Stock Warrants |
Series F | 48,232 | 58 | 5 | ||||||||||||
| Eccentex Corporation |
Information Services | Preferred Stock Warrants |
Series A | 408,719 | 31 | 3 | ||||||||||||
| Intelligent Beauty, Inc. |
Information Services | Preferred Stock Warrants |
Series B | 190,234 | 230 | 579 | ||||||||||||
| InXpo, Inc. |
Information Services | Preferred Stock Warrants |
Series C | 648,400 | 98 | 43 | ||||||||||||
| Information Services | Preferred Stock Warrants |
Series C-1 | 267,049 | 25 | 24 | |||||||||||||
|
|
|
|
|
|
|
|||||||||||||
| Total InXpo, Inc. |
Information Services | 915,449 | 123 | 67 | ||||||||||||||
| Jab Wireless, Inc. |
Information Services | Preferred Stock Warrants |
Series A | 266,567 | 265 | 420 | ||||||||||||
| RichRelevance, Inc. |
Information Services | Preferred Stock Warrants |
Series D | 112,749 | 98 | 28 | ||||||||||||
| Solutionary, Inc. |
Information Services | Preferred Stock Warrants |
Series A-2 | 111,311 | 96 | 5 | ||||||||||||
|
|
|
|
|
|||||||||||||||
| Total Warrants Information Services (0.22%)* |
|
910 | 1,107 | |||||||||||||||
|
|
|
|
|
|||||||||||||||
| EKOS Corporation |
Medical Device & Equipment |
Preferred Stock Warrants |
Series C | 4,448,135 | 327 | — | ||||||||||||
| Gelesis, Inc.(6) |
Medical Device & Equipment |
LLC interest |
263,688 | 78 | 95 | |||||||||||||
| Lanx, Inc. |
Medical Device & Equipment |
Preferred Stock Warrants |
Series C | 1,203,369 | 441 | 445 | ||||||||||||
| Novasys Medical, Inc. |
Medical Device & Equipment |
Preferred Stock Warrants |
Series D | 580,447 | 131 | — | ||||||||||||
| Common Stock Warrants |
109,449 | 2 | — | |||||||||||||||
|
|
|
|
|
|
|
|||||||||||||
| Total Novasys Medial, Inc. |
689,896 | 133 | — | |||||||||||||||
| Optiscan Biomedical, Corp.(6) |
Medical Device & Equipment |
Preferred Stock Warrants |
Series D | 6,206,187 | 1,069 | 151 | ||||||||||||
|
|
|
|
|
|
|
|||||||||||||
| Total Optiscan Biomedical, Corp. |
6,206,187 | 1,069 | 151 | |||||||||||||||
| Oraya Therapeutics, Inc. |
Medical Device & Equipment |
Preferred Stock Warrants |
Series C | 716,948 | 676 | 314 | ||||||||||||
| Common Stock Warrants |
95,498 | 66 | 62 | |||||||||||||||
|
|
|
|
|
|
|
|||||||||||||
| Total Oraya Therapeutics, Inc. |
812,446 | 742 | 376 | |||||||||||||||
| USHIFU, LLC |
Medical Device & Equipment |
Preferred Stock Warrants |
Series G | 141,388 | 188 | 188 | ||||||||||||
|
|
|
|
|
|||||||||||||||
| Total Warrants Medical Device & Equipment (0.24%)* |
|
2,978 | 1,255 | |||||||||||||||
|
|
|
|
|
|||||||||||||||
| Navidea Biopharmaceuticals, Inc. |
Diagnostic | Common Stock Warrants |
333,333 | 244 | 360 | |||||||||||||
| Tethys Bioscience, Inc. |
Diagnostic | Preferred Stock Warrants |
Series E | 617,683 | 148 | 169 | ||||||||||||
|
|
|
|
|
|||||||||||||||
| Total Warrants Diagnostic (0.10%)* |
|
392 | 529 | |||||||||||||||
|
|
|
|
|
|||||||||||||||
See notes to consolidated financial statements.
117
Table of Contents
HERCULES TECHNOLOGY GROWTH CAPITAL, INC.
CONSOLIDATED SCHEDULE OF INVESTMENTS
December 31, 2012
(dollars in thousands)
| Portfolio Company |
Sub-Industry | Type of Investment(1) |
Series |
Shares | Cost(2) | Value(3) | ||||||||||||
| Labcyte, Inc. |
Biotechnology Tools | Preferred Stock Warrants |
Series C | 1,127,624 | $ | 323 | $ | 247 | ||||||||||
| NuGEN Technologies, Inc. |
Biotechnology Tools | Preferred Stock Warrants |
Series B | 204,545 | 45 | 161 | ||||||||||||
| Preferred Stock Warrants |
Series C | 30,114 | 33 | 8 | ||||||||||||||
|
|
|
|
|
|
|
|||||||||||||
| Total NuGEN Technologies, Inc. |
234,659 | 78 | 169 | |||||||||||||||
|
|
|
|
|
|||||||||||||||
| Total Warrants Biotechnology Tools (0.08%)* |
|
401 | 416 | |||||||||||||||
|
|
|
|
|
|||||||||||||||
| Entrigue Surgical, Inc. |
Surgical Devices | Preferred Stock Warrants |
Series B | 62,500 | 87 | 2 | ||||||||||||
| Transmedics, Inc. |
Surgical Devices | Preferred Stock Warrants |
Series B | 40,436 | 225 | — | ||||||||||||
| Preferred Stock Warrants |
Series D | 175,000 | 100 | 100 | ||||||||||||||
|
|
|
|
|
|
|
|||||||||||||
| Total Transmedics, Inc. |
|
325 | 100 | |||||||||||||||
|
|
|
|
|
|||||||||||||||
| Gynesonics, Inc. |
Surgical Devices | Preferred Stock Warrants |
Series A | 123,457 | 18 | 7 | ||||||||||||
| Preferred Stock Warrants |
Series C | 1,474,261 | 387 | 298 | ||||||||||||||
|
|
|
|
|
|
|
|||||||||||||
| Total Gynesonics, Inc. |
1,597,718 | 405 | 305 | |||||||||||||||
|
|
|
|
|
|||||||||||||||
| Total Warrants Surgical Devices (0.08%)* |
|
817 | 407 | |||||||||||||||
|
|
|
|
|
|||||||||||||||
| Everyday Health, Inc. |
Media/Content/ Info | Preferred Stock Warrants |
Series C | 110,018 | 60 | 55 | ||||||||||||
| Glam Media, Inc. |
Media/Content/ Info | Preferred Stock Warrants |
Series D | 407,457 | 482 | — | ||||||||||||
| Zoom Media Group, Inc. |
Media/Content/ Info | Preferred Stock Warrants |
n/a | 1,204 | 348 | 346 | ||||||||||||
|
|
|
|
|
|||||||||||||||
| Total Warrants Media/Content/Info (0.08%)* |
|
890 | 401 | |||||||||||||||
|
|
|
|
|
|||||||||||||||
| Alphabet Energy, Inc. |
Clean Tech | Preferred Stock Warrants |
Series A | 79,083 | 68 | 148 | ||||||||||||
| American Supercondutor Corporation(3) |
Clean Tech | Common Stock Warrants |
139,275 | 244 | 122 | |||||||||||||
| BrightSource Energy, Inc. |
Clean Tech | Preferred Stock Warrants |
Series D | 58,333 | 675 | 248 | ||||||||||||
| Calera, Inc. |
Clean Tech | Preferred Stock Warrants |
Series C | 44,529 | 513 | — | ||||||||||||
| EcoMotors, Inc. |
Clean Tech | Preferred Stock Warrants |
Series B | 437,500 | 308 | 435 | ||||||||||||
| Enphase Energy, Inc.(3) |
Clean Tech | Common Stock Warrants |
37,500 | 102 | 17 | |||||||||||||
| Fulcrum Bioenergy, Inc. |
Clean Tech | Preferred Stock Warrants |
Series C-1 | 187,265 | 211 | 104 | ||||||||||||
| Glori Energy, Inc. |
Clean Tech | Preferred Stock Warrants |
Series C | 145,932 | 165 | 62 | ||||||||||||
| GreatPoint Energy, Inc. |
Clean Tech | Preferred Stock Warrants |
Series D-1 | 393,212 | 548 | 1 | ||||||||||||
| Integrated Photovoltaics, Inc. |
Clean Tech | Preferred Stock Warrants |
Series A-1 | 390,000 | 82 | 119 | ||||||||||||
| Polyera Corporation |
Clean Tech | Preferred Stock Warrants |
Series C | 161,575 | 69 | 68 | ||||||||||||
| Propel Biofuels, Inc. |
Clean Tech | Preferred Stock Warrants |
Series C | 3,200,000 | 211 | 317 | ||||||||||||
| Redwood Systems, Inc. |
Clean Tech | Preferred Stock Warrants |
Series C | 331,250 | 3 | 2 | ||||||||||||
| SCIenergy, Inc.(4) |
Clean Tech | Preferred Stock Warrants |
Series D | 1,061,168 | 361 | 145 | ||||||||||||
| Solexel, Inc. |
Clean Tech | Preferred Stock Warrants |
Series B | 245,682 | 1,161 | 7 | ||||||||||||
| Stion Corporation(4) |
Clean Tech | Preferred Stock Warrants |
Series E | 110,226 | 317 | 167 | ||||||||||||
| Trilliant, Inc. |
Clean Tech | Preferred Stock Warrants |
Series A | 320,000 | 161 | 54 | ||||||||||||
|
|
|
|
|
|||||||||||||||
| Total Warrants Clean Tech (0.39%)* |
|
5,199 | 2,016 | |||||||||||||||
|
|
|
|
|
|||||||||||||||
| Total Warrants (5.73%) |
|
32,060 | 29,550 | |||||||||||||||
|
|
|
|
|
|||||||||||||||
| Aveo Pharmaceuticals, Inc.(3) |
Drug Discovery & Development |
Common Stock |
167,864 | 842 | 1,351 | |||||||||||||
| Dicerna Pharmaceuticals, Inc. |
Drug Discovery & Development |
Preferred Stock |
Series B | 502,684 | 502 | 488 | ||||||||||||
See notes to consolidated financial statements.
118
Table of Contents
HERCULES TECHNOLOGY GROWTH CAPITAL, INC.
CONSOLIDATED SCHEDULE OF INVESTMENTS
December 31, 2012
(dollars in thousands)
| Portfolio Company |
Sub-Industry | Type of Investment(1) |
Series |
Shares | Cost(2) | Value(3) | ||||||||||||
| Inotek Pharmaceuticals Corp. |
Drug Discovery & Development |
Preferred Stock |
Series C | 15,334 | $ | 1,500 | $ | — | ||||||||||
| Merrimack Pharmaceuticals, Inc.(3) |
Drug Discovery & Development |
Common Stock |
546,448 | 2,000 | 3,328 | |||||||||||||
| Paratek Pharmaceuticals, Inc. |
Drug Discovery & Development |
Preferred Stock |
Series H | 244,158 | 1,000 | 282 | ||||||||||||
| Common Stock |
47,471 | 5 | 3 | |||||||||||||||
|
|
|
|
|
|
|
|||||||||||||
| Total Paratek Pharmaceuticals, Inc. |
291,629 | 1,005 | 286 | |||||||||||||||
|
|
|
|
|
|||||||||||||||
| Total Equity Drug Discovery & Development (1.06%)* |
|
5,849 | 5,453 | |||||||||||||||
|
|
|
|
|
|||||||||||||||
| Acceleron Pharmaceuticals, Inc. |
Drug Delivery | Preferred Stock |
Series B | 600,601 | 1,000 | 915 | ||||||||||||
| Preferred Stock |
Series C | 93,456 | 242 | 205 | ||||||||||||||
| Preferred Stock |
Series E | 43,488 | 98 | 174 | ||||||||||||||
| Preferred Stock |
Series F | 19,268 | 61 | 77 | ||||||||||||||
|
|
|
|
|
|
|
|||||||||||||
| Total Acceleron Pharmaceuticals, Inc. |
756,813 | 1,401 | 1,371 | |||||||||||||||
| Merrion Pharma, Plc.(3)(5)(10) |
Drug Delivery | Common Stock |
20,000 | 9 | — | |||||||||||||
| Nupathe, Inc. |
Drug Delivery | Common Stock |
50,000 | 146 | 142 | |||||||||||||
| Transcept Pharmaceuticals, Inc.(3) |
Drug Delivery | Common Stock |
41,570 | 500 | 185 | |||||||||||||
|
|
|
|
|
|||||||||||||||
| Total Equity Drug Delivery (0.33%)* |
|
2,056 | 1,698 | |||||||||||||||
|
|
|
|
|
|||||||||||||||
| E-band Communications, Corp.(6) |
Communications & Networking |
Preferred Stock |
Series B | 564,972 | 2,000 | — | ||||||||||||
| Preferred Stock |
Series C | 649,998 | 372 | — | ||||||||||||||
| Preferred Stock |
Series D | 847,544 | 508 | — | ||||||||||||||
| Preferred Stock |
Series E | 1,987,605 | 374 | — | ||||||||||||||
|
|
|
|
|
|
|
|||||||||||||
| Total E-band Communications, Corp. |
4,050,119 | 3,254 | — | |||||||||||||||
| Glowpoint, Inc.(3) |
Communications & Networking |
Common Stock |
114,192 | 101 | 227 | |||||||||||||
| Neonova Holding Company |
Communications & Networking |
Preferred Stock |
Series A | 500,000 | 250 | 200 | ||||||||||||
| Peerless Network, Inc. |
Communications & Networking |
Preferred Stock |
Series A | 1,000,000 | 1,000 | 3,692 | ||||||||||||
| Stoke, Inc. |
Communications & Networking |
Preferred Stock |
Series E | 152,905 | 500 | 631 | ||||||||||||
| UPH Holdings, Inc. |
Communications & Networking |
Common Stock |
742,887 | — | 624 | |||||||||||||
|
|
|
|
|
|||||||||||||||
| Total Equity Communications & Networking (1.04%)* |
|
5,105 | 5,374 | |||||||||||||||
|
|
|
|
|
|||||||||||||||
| Atrenta, Inc. |
Software | Preferred Stock |
Series C | 1,196,845 | 508 | 1,042 | ||||||||||||
| Preferred Stock |
Series D | 635,513 | 986 | 1,604 | ||||||||||||||
|
|
|
|
|
|
|
|||||||||||||
| 1,832,358 | 1,494 | 2,646 | ||||||||||||||||
| Box, Inc.(4) |
Software | Preferred Stock |
Series C | 390,625 | 500 | 5,117 | ||||||||||||
| Preferred Stock |
Series D | 158,127 | 500 | 2,071 | ||||||||||||||
| Preferred Stock |
Series D-1 | 124,511 | 1,000 | 1,632 | ||||||||||||||
| Preferred Stock |
Series D-2 | 220,751 | 2,001 | 2,892 | ||||||||||||||
| Preferred Stock |
Series E | 38,183 | 500 | 500 | ||||||||||||||
|
|
|
|
|
|
|
|||||||||||||
| Total Box, Inc. |
932,197 | 4,501 | 12,212 | |||||||||||||||
| Caplinked, Inc. |
Software | Preferred Stock |
Series A-3 | 53,614 | 52 | 77 | ||||||||||||
|
|
|
|
|
|||||||||||||||
| Total Equity Software (2.89%)* |
|
6,047 | 14,935 | |||||||||||||||
|
|
|
|
|
|||||||||||||||
See notes to consolidated financial statements.
119
Table of Contents
HERCULES TECHNOLOGY GROWTH CAPITAL, INC.
CONSOLIDATED SCHEDULE OF INVESTMENTS
December 31, 2012
(dollars in thousands)
| Portfolio Company |
Sub-Industry | Type of Investment(1) |
Series |
Shares | Cost(2) | Value(3) | ||||||||||||
| Spatial Photonics, Inc. |
Electronics & Computer Hardware |
Preferred Stock |
Series D | 4,717,813 | $ | 268 | $ | — | ||||||||||
| Virident Systems |
Electronics & Computer Hardware |
Preferred Stock |
Series D | 6,546,217 | 5,000 | 4,922 | ||||||||||||
|
|
|
|
|
|||||||||||||||
| Total Equity Electronics & Computer Hardware (0.95%)* |
|
5,268 | 4,922 | |||||||||||||||
|
|
|
|
|
|||||||||||||||
| Quatrx Pharmaceuticals Company |
Specialty Pharmaceuticals |
Preferred Stock |
Series E | 166,419 | 750 | — | ||||||||||||
|
|
|
|
|
|||||||||||||||
| Total Equity Specialty Pharmaceuticals (0.00%)* |
|
750 | — | |||||||||||||||
|
|
|
|
|
|||||||||||||||
| Caivis Acquisition Corporation |
Consumer & Business Products |
Common Stock |
Series A | 295,861 | 819 | 597 | ||||||||||||
| Facebook, Inc.(3) |
Consumer & Business Products |
Common Stock |
Series B | 307,500 | 9,558 | 8,089 | ||||||||||||
| IPA Holdings, LLC |
Consumer & Business Products |
Preferred Stock |
LLC interest | 500,000 | 500 | 711 | ||||||||||||
| Market Force Information, Inc. |
Consumer & Business Products |
Preferred Stock |
Series B | 187,970 | 500 | 657 | ||||||||||||
| Wageworks, Inc.(3) |
Consumer & Business Products |
Common Stock |
Series D | 19,260 | 250 | 343 | ||||||||||||
|
|
|
|
|
|||||||||||||||
| Total Equity Consumer & Business Products (2.02%)* |
|
11,627 | 10,397 | |||||||||||||||
|
|
|
|
|
|||||||||||||||
| iWatt, Inc. |
Semiconductors | Preferred Stock |
Series E | 2,412,864 | 490 | 752 | ||||||||||||
|
|
|
|
|
|||||||||||||||
| Total Equity Semiconductors (0.15%)* |
|
490 | 752 | |||||||||||||||
|
|
|
|
|
|||||||||||||||
| Buzznet, Inc. |
Information Services | Preferred Stock |
Series C | 263,158 | 250 | — | ||||||||||||
| Good Technologies, Inc. |
Information Services | Common Stock |
500,000 | 603 | — | |||||||||||||
| Solutionary, Inc. |
Information Services | Preferred Stock |
Series A-1 | 189,495 | 18 | 235 | ||||||||||||
| Preferred Stock |
Series A-2 | 65,834 | 325 | 82 | ||||||||||||||
|
|
|
|
|
|
|
|||||||||||||
| Total Solutionary, Inc. |
255,329 | 343 | 317 | |||||||||||||||
|
|
|
|
|
|||||||||||||||
| Total Equity Information Services (0.06%)* |
|
1,196 | 317 | |||||||||||||||
|
|
|
|
|
|||||||||||||||
| Gelesis, Inc.(6) |
Medical Device & Equipment |
674,208 | — | 435 | ||||||||||||||
| LLC interest |
674,208 | 425 | 610 | |||||||||||||||
| LLC interest |
675,676 | 500 | 525 | |||||||||||||||
|
|
|
|
|
|
|
|||||||||||||
| Total Gelesis, Inc. |
2,024,092 | 925 | 1,570 | |||||||||||||||
| Lanx, Inc. |
Medical Device & Equipment |
Preferred Stock |
Series C | 1,203,369 | 1,000 | 1,155 | ||||||||||||
| Novasys Medical, Inc. |
Medical Device & Equipment |
Preferred Stock |
Series D-1 | 4,118,444 | 1,000 | — | ||||||||||||
| Optiscan Biomedical, Corp.(6) |
Medical Device & Equipment |
Preferred Stock |
Series B | 6,185,567 | 3,000 | 314 | ||||||||||||
| Preferred Stock |
Series C-2 | 1,927,309 | 655 | 251 | ||||||||||||||
|
|
|
|
|
|
|
|||||||||||||
| Total Optiscan Biomedical, Corp. |
8,112,876 | 3,655 | 565 | |||||||||||||||
|
|
|
|
|
|||||||||||||||
| Total Equity Medical Device & Equipment (0.64%)* |
|
6,580 | 3,290 | |||||||||||||||
|
|
|
|
|
|||||||||||||||
See notes to consolidated financial statements.
120
Table of Contents
HERCULES TECHNOLOGY GROWTH CAPITAL, INC.
CONSOLIDATED SCHEDULE OF INVESTMENTS
December 31, 2012
(dollars in thousands)
| Portfolio Company |
Sub-Industry | Type of Investment(1) |
Series |
Shares | Cost(2) | Value(3) | ||||||||||||
| NuGEN Technologies, Inc. |
Biotechnology Tools | Preferred Stock |
Series C | 189,394 | $ | 500 | $ | 600 | ||||||||||
|
|
|
|
|
|||||||||||||||
| Total Equity Biotechnology Tools (0.12%)* |
|
500 | 600 | |||||||||||||||
|
|
|
|
|
|||||||||||||||
| Transmedics, Inc. |
Surgical Devices | Preferred Stock |
Series B | 88,961 | 1,100 | — | ||||||||||||
| Preferred Stock |
Series C | 119,999 | 300 | — | ||||||||||||||
| Preferred Stock |
Series D | 260,000 | 650 | 650 | ||||||||||||||
|
|
|
|
|
|
|
|||||||||||||
| Total Transmedics, Inc. |
468,960 | 2,050 | 650 | |||||||||||||||
| Gynesonics, Inc. |
Surgical Devices | Preferred Stock |
Series B | 219,298 | 250 | 159 | ||||||||||||
| Preferred Stock |
Series C | 656,512 | 282 | 251 | ||||||||||||||
|
|
|
|
|
|
|
|||||||||||||
| Total Gynesonics, Inc. |
875,810 | 532 | 410 | |||||||||||||||
|
|
|
|
|
|||||||||||||||
| Total Equity Surgical Devices (0.20%)* |
|
2,582 | 1,060 | |||||||||||||||
|
|
|
|
|
|||||||||||||||
| Everyday Health, Inc. (pka Waterfront Media, Inc.) |
Media/Content/ Info | Preferred Stock |
Series D | 145,590 | 1,000 | 412 | ||||||||||||
|
|
|
|
|
|||||||||||||||
| Total Equity Media/Content/Info (0.08%)* |
|
1,000 | 412 | |||||||||||||||
|
|
|
|
|
|||||||||||||||
| Total Equity (9.54%) |
|
49,050 | 49,210 | |||||||||||||||
|
|
|
|
|
|||||||||||||||
| 49,050 | 49,210 | |||||||||||||||||
|
|
|
|
|
|||||||||||||||
| Total Investments (175.65%) |
|
$ | 914,338 | $ | 906,300 | |||||||||||||
|
|
|
|
|
|||||||||||||||
| * | Value as a percent of net assets |
| (1) | Preferred and common stock, warrants, and equity interests are generally non-income producing. |
| (2) | Gross unrealized appreciation, gross unrealized depreciation, and net depreciation for federal income tax purposes totaled $19.9 million, $27.6 million and $7.8 million respectively. The tax cost of investments is $916.9 million |
| (3) | Except for warrants in twenty publicly traded companies and common stock in eight publicly traded companies, all investments are restricted at December 31, 2012 and were valued at fair value as determined in good faith by the Board of Directors. No unrestricted securities of the same issuer are outstanding. The Company uses the Standard Industrial Code for classifying the industry grouping of its portfolio companies. |
| (4) | Debt investments of this portfolio company have been pledged as collateral under the Wells Facility. |
| (5) | Non-U.S. company or the company’s principal place of business is outside the United States. |
| (6) | Affiliate investment that is defined under the Investment Company Act of 1940 as companies in which HTGC owns as least 5% but not more than 25% of the voting securities of the company. |
| (7) | Control investment that is defined under the Investment Company Act of 1940 as companies in which HTGC owners as least 25% but not more than 50% of the voting securities of the company |
| (8) | Debt is on non-accrual status at December 31, 2012, and is therefore considered non-income producing. |
| (9) | Convertible Senior Debt |
| (10) | Indicates assets that the Company deems not “qualifying assets” under section 55(a) of the Investment Company Act of 1940, as amended. Qualifying assets must represent at least 70% of the Company’s total assets at the time of acquisition of any additional non-qualifying assets. |
| (11) | Denotes that all or a portion of the loan secures the notes offered in the Debt Securitization (as defined in Note 4). |
See notes to consolidated financial statements.
121
Table of Contents
HERCULES TECHNOLOGY GROWTH CAPITAL, INC.
CONSOLIDATED SCHEDULE OF INVESTMENTS
December 31, 2011
(dollars in thousands)
| Portfolio Company |
Industry | Type of Investment(1) |
Series | Principal Amount |
Cost(2) | Value(3) | ||||||||||||
| Anthera Pharmaceuticals Inc. |
Drug Discovery & Development |
Senior Debt |
$ | 25,000 | $ | 24,433 | $ | 25,183 | ||||||||||
|
|
|
|
|
|||||||||||||||
| Total Anthera Pharmaceuticals Inc. |
|
24,433 | 25,183 | |||||||||||||||
| Aveo Pharmaceuticals, Inc. |
Drug Discovery & Development |
Senior Debt |
$ | 25,000 | 25,360 | 26,110 | ||||||||||||
|
|
|
|
|
|||||||||||||||
| Total Aveo Pharmaceuticals, Inc. |
|
25,360 | 26,110 | |||||||||||||||
| Dicerna Pharmaceuticals, Inc. |
Drug Discovery & Development |
Senior Debt |
$ | 12,000 | 11,665 | 11,665 | ||||||||||||
|
|
|
|
|
|||||||||||||||
| Total Dicerna Pharmaceuticals, Inc. |
|
11,665 | 11,665 | |||||||||||||||
| NextWave Pharmaceuticals |
Drug Discovery & Development |
Senior Debt |
$ | 6,000 | 5,925 | 5,926 | ||||||||||||
|
|
|
|
|
|||||||||||||||
| Total NextWave Pharmaceuticals |
|
5,925 | 5,926 | |||||||||||||||
| Concert Pharmaceuticals |
Drug Discovery & Development |
Senior Debt |
$ | 7,500 | 7,350 | 7,350 | ||||||||||||
|
|
|
|
|
|||||||||||||||
| Total Concert Pharmaceuticals |
|
7,350 | 7,350 | |||||||||||||||
| PolyMedix, Inc. |
Drug Discovery & Development |
Senior Debt |
$ | 6,763 | 6,594 | 6,729 | ||||||||||||
|
|
|
|
|
|||||||||||||||
| Total PolyMedix, Inc. |
|
6,594 | 6,729 | |||||||||||||||
| Aegerion Pharmaceuticals, Inc. |
Drug Discovery & Development |
Senior Debt |
$ | 10,000 | 10,070 | 10,070 | ||||||||||||
|
|
|
|
|
|||||||||||||||
| Total Aegerion Pharmaceuticals, Inc. |
|
10,070 | 10,070 | |||||||||||||||
| Chroma Therapeutics, Ltd.(5) |
Drug Discovery & Development |
Senior Debt Matures |
$ | 7,633 | 7,958 | 7,879 | ||||||||||||
|
|
|
|
|
|||||||||||||||
| Total Chroma Therapeutics, Ltd. |
|
7,958 | 7,879 | |||||||||||||||
| NeurogesX, Inc. |
Drug Discovery & Development |
Senior Debt |
$ | 15,000 | 14,558 | 14,558 | ||||||||||||
|
|
|
|
|
|||||||||||||||
| Total NeurogesX, Inc. |
|
14,558 | 14,558 | |||||||||||||||
|
|
|
|
|
|||||||||||||||
122
Table of Contents
HERCULES TECHNOLOGY GROWTH CAPITAL, INC.
CONSOLIDATED SCHEDULE OF INVESTMENTS
December 31, 2011
(dollars in thousands)
| Portfolio Company |
Industry | Type of Investment(1) |
Series | Principal Amount |
Cost(2) | Value(3) | ||||||||||||
| Total Debt Drug Discovery & Development (26.79%)* |
|
$ | 113,913 | $ | 115,470 | |||||||||||||
|
|
|
|
|
|||||||||||||||
| E-band Communications, Corp.(6) |
Communications & Networking |
Convertible Senior Debt |
$ | 356 | 356 | — | ||||||||||||
|
|
|
|
|
|||||||||||||||
| Total E-Band Communications, Corp. |
|
356 | — | |||||||||||||||
| Intelepeer, Inc. |
Communications & Networking |
Senior Debt |
$ | 6,524 | 6,346 | 6,476 | ||||||||||||
| Senior Debt |
$ | 1,100 | 1,100 | 1,070 | ||||||||||||||
|
|
|
|
|
|||||||||||||||
| Total Intelepeer, Inc. |
|
7,446 | 7,546 | |||||||||||||||
| Ahhha, Inc. |
Communications & Networking |
Senior Debt |
$ | 350 | 345 | 345 | ||||||||||||
|
|
|
|
|
|||||||||||||||
| Total Ahhha, Inc. |
|
345 | 345 | |||||||||||||||
| Pac-West Telecomm, Inc. |
Communications & Networking |
Senior Debt |
$ | 4,369 | 4,196 | 4,196 | ||||||||||||
|
|
|
|
|
|||||||||||||||
| Total Pac-West Telecomm, Inc. |
|
4,196 | 4,196 | |||||||||||||||
| PeerApp, Inc. |
Communications & Networking |
Senior Debt |
$ | 1,776 | 1,814 | 1,835 | ||||||||||||
|
|
|
|
|
|||||||||||||||
| Total PeerApp, Inc.(5) |
|
1,814 | 1,835 | |||||||||||||||
| PointOne, Inc. |
Communications & Networking |
Senior Debt |
$ | 8,308 | 8,107 | 8,100 | ||||||||||||
|
|
|
|
|
|||||||||||||||
| Total PointOne, Inc. |
|
8,107 | 8,100 | |||||||||||||||
| Stoke, Inc(4) |
Communications & Networking |
Senior Debt |
$ | 2,627 | 2,586 | 2,612 | ||||||||||||
|
|
|
|
|
|||||||||||||||
| Total Stoke, Inc. |
|
2,586 | 2,612 | |||||||||||||||
|
|
|
|
|
|||||||||||||||
| Total Debt Communications & Networking (5.71%)* |
|
24,850 | 24,634 | |||||||||||||||
|
|
|
|
|
|||||||||||||||
| Central Desktop, Inc. |
Software | Senior Debt |
$ | 3,000 | 2,894 | 2,954 | ||||||||||||
|
|
|
|
|
|||||||||||||||
| Total Central Desktop, Inc. |
|
2,894 | 2,954 | |||||||||||||||
| Clickfox, Inc. |
Software | Senior Debt |
$ | 3,999 | 3,920 | 4,000 | ||||||||||||
|
|
|
|
|
|||||||||||||||
| Total Clickfox, Inc. |
|
3,920 | 4,000 | |||||||||||||||
See notes to consolidated financial statements.
123
Table of Contents
HERCULES TECHNOLOGY GROWTH CAPITAL, INC.
CONSOLIDATED SCHEDULE OF INVESTMENTS
December 31, 2011
(dollars in thousands)
| Portfolio Company |
Industry | Type of Investment(1) |
Series | Principal Amount |
Cost(2) | Value(3) | ||||||||||||
| Kxen, Inc. |
Software | Senior Debt |
$ | 3,000 | $ | 2,958 | $ | 2,858 | ||||||||||
|
|
|
|
|
|||||||||||||||
| Total Kxen, Inc. |
|
2,958 | 2,858 | |||||||||||||||
| RichRelevance, Inc. |
Software | Senior Debt |
$ | 5,000 | 4,879 | 4,879 | ||||||||||||
|
|
|
|
|
|||||||||||||||
| Total RichRelevance, Inc. |
|
4,879 | 4,879 | |||||||||||||||
| Blurb, Inc |
Software | Senior Debt |
$ | 5,000 | 4,873 | 4,873 | ||||||||||||
|
|
|
|
|
|||||||||||||||
| Total Blurb, Inc |
|
4,873 | 4,873 | |||||||||||||||
| SugarSync Inc. |
Software | Senior Debt |
$ | 2,000 | 1,950 | 1,950 | ||||||||||||
|
|
|
|
|
|||||||||||||||
| Total SugarSync Inc. |
|
1,950 | 1,950 | |||||||||||||||
| White Sky, Inc. |
Software | Senior Debt |
$ | 1,418 | 1,357 | 1,400 | ||||||||||||
|
|
|
|
|
|||||||||||||||
| Total White Sky, Inc. |
|
1,357 | 1,400 | |||||||||||||||
| Tada Innovations, Inc. |
Software | Senior Debt |
$ | 100 | 90 | 90 | ||||||||||||
|
|
|
|
|
|||||||||||||||
| Total Tada Innovations, Inc. |
|
90 | 90 | |||||||||||||||
|
|
|
|
|
|||||||||||||||
| Total Debt Software (5.34%)* |
|
22,921 | 23,004 | |||||||||||||||
|
|
|
|
|
|||||||||||||||
| Maxvision Holding, LLC.(7) |
Electronics & Computer Hardware |
Senior Debt |
$ | 4,185 | 4,143 | — | ||||||||||||
| Senior Debt |
$ | 2,539 | 2,515 | — | ||||||||||||||
See notes to consolidated financial statements.
124
Table of Contents
HERCULES TECHNOLOGY GROWTH CAPITAL, INC.
CONSOLIDATED SCHEDULE OF INVESTMENTS
December 31, 2011
(dollars in thousands)
| Portfolio Company |
Industry | Type of Investment(1) |
Series | Principal Amount |
Cost(2) | Value(3) | ||||||||||||
| Revolving Line of Credit |
$ | 892 | $ | 1,027 | $ | 1,027 | ||||||||||||
|
|
|
|
|
|||||||||||||||
| Total Maxvision Holding, LLC |
|
7,685 | 1,027 | |||||||||||||||
|
|
|
|
|
|||||||||||||||
| Total Debt Electronics & Computer Hardware (0.24%)* |
|
7,685 | 1,027 | |||||||||||||||
|
|
|
|
|
|||||||||||||||
| Althea Technologies, Inc. |
Specialty Pharmaceuticals |
Senior Debt |
$ | 10,359 | 10,315 | 10,584 | ||||||||||||
|
|
|
|
|
|||||||||||||||
| Total Althea Technologies, Inc. |
|
10,315 | 10,584 | |||||||||||||||
| Pacira Pharmaceuticals, Inc. |
Specialty Pharmaceuticals |
Senior Debt |
$ | 11,250 | 11,257 | 11,397 | ||||||||||||
| Senior Debt |
$ | 15,000 | 14,386 | 14,574 | ||||||||||||||
|
|
|
|
|
|||||||||||||||
| Total Pacira Pharmaceuticals, Inc. |
|
25,643 | 25,971 | |||||||||||||||
| Quatrx Pharmaceuticals Company |
Specialty Pharmaceuticals |
Convertible Senior Debt |
$ | 1,888 | 1,888 | 1,888 | ||||||||||||
|
|
|
|
|
|||||||||||||||
| Total Quatrx Pharmaceuticals Company |
|
1,888 | 1,888 | |||||||||||||||
|
|
|
|
|
|||||||||||||||
| Total Debt Specialty Pharmaceuticals (8.92%)* |
|
37,846 | 38,443 | |||||||||||||||
|
|
|
|
|
|||||||||||||||
| Achronix Semiconductor Corporation |
Semiconductors | Senior Debt |
$ | 2,500 | 2,329 | 2,329 | ||||||||||||
|
|
|
|
|
|||||||||||||||
| Total Achronix Semiconductor Corporation |
|
2,329 | 2,329 | |||||||||||||||
| Kovio Inc. |
Semiconductors | Senior Debt |
$ | 1,250 | 1,218 | 1,218 | ||||||||||||
| Kovio Inc. |
Semiconductors | Senior Debt |
$ | 3,000 | 2,910 | 2,910 | ||||||||||||
|
|
|
|
|
|||||||||||||||
| Total Kovio Inc. |
|
4,128 | 4,128 | |||||||||||||||
|
|
|
|
|
|||||||||||||||
| Total Debt Semiconductors (1.50%)* |
|
6,457 | 6,457 | |||||||||||||||
|
|
|
|
|
|||||||||||||||
| AcelRX Pharmaceuticals, Inc. |
Drug Delivery | Senior Debt |
$ | 10,000 | 9,773 | 9,579 | ||||||||||||
See notes to consolidated financial statements.
125
Table of Contents
HERCULES TECHNOLOGY GROWTH CAPITAL, INC.
CONSOLIDATED SCHEDULE OF INVESTMENTS
December 31, 2011
(dollars in thousands)
| Portfolio Company |
Industry | Type of Investment(1) |
Series | Principal Amount |
Cost(2) | Value(3) | ||||||||||||
| Senior Debt |
$ | 10,000 | $ | 9,772 | $ | 9,578 | ||||||||||||
|
|
|
|
|
|||||||||||||||
| Total AcelRX Pharmaceuticals, Inc. |
|
19,545 | 19,157 | |||||||||||||||
| Alexza Pharmaceuticals, Inc.(4) |
Drug Delivery | Senior Debt |
$ | 10,497 | 10,537 | 10,695 | ||||||||||||
|
|
|
|
|
|||||||||||||||
| Total Alexza Pharmaceuticals, Inc. |
|
10,537 | 10,695 | |||||||||||||||
| BIND Biosciences, Inc. |
Drug Delivery | Senior Debt |
$ | 5,000 | 4,730 | 4,880 | ||||||||||||
|
|
|
|
|
|||||||||||||||
| Total BIND Biosciences, Inc. |
|
4,730 | 4,880 | |||||||||||||||
| Merrion Pharmaceuticals, Inc.(5) |
Drug Delivery | Senior Debt |
$ | 5,000 | 4,765 | 3,819 | ||||||||||||
|
|
|
|
|
|||||||||||||||
| Total Merrion Pharmaceuticals, Inc. |
|
4,765 | 3,819 | |||||||||||||||
|
|
|
|
|
|||||||||||||||
| Revance Therapeutics, Inc. |
Drug Delivery | Senior Debt |
$ | 22,000 | 21,379 | 21,379 | ||||||||||||
|
|
|
|
|
|||||||||||||||
| Total Revance Therapeutics, Inc. |
|
21,379 | 21,379 | |||||||||||||||
|
|
|
|
|
|||||||||||||||
| Total Debt Drug Delivery (13.90%)* |
|
60,956 | 59,930 | |||||||||||||||
|
|
|
|
|
|||||||||||||||
| Gelesis, Inc.(8) |
Therapeutic | Senior Debt |
$ | 3,428 | 3,514 | 3,254 | ||||||||||||
|
|
|
|
|
|||||||||||||||
| Total Gelesis, Inc. |
|
3,514 | 3,254 | |||||||||||||||
| Gynesonics, Inc. |
Therapeutic | Senior Debt |
$ | 5,336 | 5,309 | 5,383 | ||||||||||||
|
|
|
|
|
|||||||||||||||
| Total Gynesonics, Inc. |
|
5,309 | 5,383 | |||||||||||||||
| Oraya Therapeutics, Inc. |
Therapeutic | Senior Debt |
$ | 7,500 | 7,377 | 7,377 | ||||||||||||
|
|
|
|
|
|||||||||||||||
| Total Oraya Therapeutics, Inc. |
|
7,377 | 7,377 | |||||||||||||||
See notes to consolidated financial statements.
126
Table of Contents
HERCULES TECHNOLOGY GROWTH CAPITAL, INC.
CONSOLIDATED SCHEDULE OF INVESTMENTS
December 31, 2011
(dollars in thousands)
| Portfolio Company |
Industry | Type of Investment(1) |
Series | Principal Amount |
Cost(2) | Value(3) | ||||||||||||
| Pacific Child & Family Associates, LLC |
Therapeutic | Senior Debt |
$ | 4,965 | $ | 4,932 | $ | 4,932 | ||||||||||
| Revolving Line of Credit |
$ | 1,500 | 1,485 | 1,412 | ||||||||||||||
| Senior Debt |
$ | 5,900 | 6,259 | 6,436 | ||||||||||||||
|
|
|
|
|
|||||||||||||||
| Total Pacific Child & Family Associates, LLC |
|
12,676 | 12,780 | |||||||||||||||
|
|
|
|
|
|||||||||||||||
| Total Debt Therapeutic (6.68%)* |
|
28,876 | 28,794 | |||||||||||||||
|
|
|
|
|
|||||||||||||||
| InXpo, Inc. |
Internet Consumer & Business Services |
Senior Debt |
$ | 3,192 | 3,083 | 3,147 | ||||||||||||
|
|
|
|
|
|||||||||||||||
| Total InXpo, Inc. |
|
3,083 | 3,147 | |||||||||||||||
| Westwood One Communications |
Internet Consumer & Business Services |
Senior Debt |
$ | 21,000 | 19,059 | 19,479 | ||||||||||||
|
|
|
|
|
|||||||||||||||
| Total Westwood One Communications |
|
19,059 | 19,479 | |||||||||||||||
| Reply! Inc.(4) |
Internet Consumer & Business Services |
Senior Debt |
$ | 13,000 | 12,877 | 13,131 | ||||||||||||
|
|
|
|
|
|||||||||||||||
| Total Reply! Inc. |
|
12,877 | 13,131 | |||||||||||||||
| MedCall |
Internet Consumer & Business Services |
Senior Debt |
$ | 5,168 | 5,051 | 5,051 | ||||||||||||
|
|
|
|
|
|||||||||||||||
| Total MedCall |
|
5,051 | 5,051 | |||||||||||||||
| ScriptSave (Medical Security Card Company, LLC) |
Internet Consumer & Business Services |
Senior Debt |
$ | 19,646 | 19,307 | 19,896 | ||||||||||||
|
|
|
|
|
|||||||||||||||
| Total ScriptSave |
|
19,307 | 19,896 | |||||||||||||||
See notes to consolidated financial statements.
127
Table of Contents
HERCULES TECHNOLOGY GROWTH CAPITAL, INC.
CONSOLIDATED SCHEDULE OF INVESTMENTS
December 31, 2011
(dollars in thousands)
| Portfolio Company |
Industry | Type of Investment(1) |
Series | Principal Amount |
Cost(2) | Value(3) | ||||||||||||
| Trulia, Inc. |
Internet Consumer & Business Services |
Senior Debt |
$ | 5,000 | $ | 4,871 | $ | 4,871 | ||||||||||
| Senior Debt |
$ | 5,000 | 4,871 | 4,871 | ||||||||||||||
|
|
|
|
|
|||||||||||||||
| Total Trulia, Inc. |
|
9,742 | 9,742 | |||||||||||||||
| Vaultlogix, Inc. |
Internet Consumer & Business Services |
Senior Debt |
$ | 7,500 | 7,441 | 7,441 | ||||||||||||
| Senior Debt |
$ | 11,500 | 11,335 | 11,335 | ||||||||||||||
| Revolving Line of Credit |
$ | 300 | 284 | 284 | ||||||||||||||
|
|
|
|
|
|||||||||||||||
| Total Vaultlogix, Inc. |
|
19,060 | 19,060 | |||||||||||||||
| Tectura Corporation |
Internet Consumer & Services |
Senior Debt |
$ | 5,625 | 6,834 | 6,834 | ||||||||||||
| Revolving Line of Credit |
||||||||||||||||||
| Senior Debt |
$ | 2,500 | 2,556 | 2,556 | ||||||||||||||
| Revolving Line of Credit |
$ | 17,487 | 17,738 | 17,738 | ||||||||||||||
|
|
|
|
|
|||||||||||||||
| Total Tectura Corporation |
|
27,128 | 27,128 | |||||||||||||||
|
|
|
|
|
|||||||||||||||
| Total Debt Internet Consumer & Business Services (27.06%) |
|
115,307 | 116,634 | |||||||||||||||
|
|
|
|
|
|||||||||||||||
| Box.net, Inc. |
Information Services |
Senior Debt |
$ | 9,647 | 9,432 | 9,432 | ||||||||||||
| Senior Debt |
$ | 1,590 | 1,613 | 1,645 | ||||||||||||||
|
|
|
|
|
|||||||||||||||
| Total Box.net, Inc. |
|
11,045 | 11,077 | |||||||||||||||
See notes to consolidated financial statements.
128
Table of Contents
HERCULES TECHNOLOGY GROWTH CAPITAL, INC.
CONSOLIDATED SCHEDULE OF INVESTMENTS
December 31, 2011
(dollars in thousands)
| Portfolio Company |
Industry | Type of Investment(1) |
Series | Principal Amount |
Cost(2) | Value(3) | ||||||||||||
| Cha Cha Search, Inc. |
Information Services |
Senior Debt |
||||||||||||||||
| Matures February 2015 |
$ | 3,000 | $ | 2,926 | $ | 2,903 | ||||||||||||
|
|
|
|
|
|||||||||||||||
| Total Cha Cha Search, Inc. |
|
2,926 | 2,903 | |||||||||||||||
| Jab Wireless, Inc. |
Information Services |
Senior Debt |
$ | 20,272 | 19,993 | 19,993 | ||||||||||||
|
|
|
|
|
|||||||||||||||
| Total Jab Wireless, Inc. |
|
19,993 | 19,993 | |||||||||||||||
|
|
|
|
|
|||||||||||||||
| Total Debt Information Services (7.88%) |
|
33,964 | 33,973 | |||||||||||||||
|
|
|
|
|
|||||||||||||||
| Optiscan Biomedical, Corp. |
Diagnostic | Senior Debt |
$ | 10,750 | 10,884 | 11,147 | ||||||||||||
|
|
|
|
|
|||||||||||||||
| Total Optiscan Biomedical, Corp. |
|
10,884 | 11,147 | |||||||||||||||
|
|
|
|
|
|||||||||||||||
| Total Debt Diagnostic (2.59%)* |
|
10,884 | 11,147 | |||||||||||||||
|
|
|
|
|
|||||||||||||||
| deCODE genetics ehf. |
Biotechnology Tools |
Senior Debt |
$ | 5,000 | 4,664 | 4,664 | ||||||||||||
|
|
|
|
|
|||||||||||||||
| Total deCODE genetics ehf. |
|
4,664 | 4,664 | |||||||||||||||
| Labcyte, Inc. |
Biotechnology Tools |
Senior Debt |
$ | 2,416 | 2,425 | 2,479 | ||||||||||||
|
|
|
|
|
|||||||||||||||
| Total Labcyte, Inc. |
|
2,425 | 2,479 | |||||||||||||||
| Cempra Holdings LLC |
Biotechnology Tools |
Senior Debt |
$ | 10,000 | 9,721 | 9,721 | ||||||||||||
|
|
|
|
|
|||||||||||||||
| Total Cempra Holdings LLC |
|
9,721 | 9,721 | |||||||||||||||
|
|
|
|
|
|||||||||||||||
| Total Debt Biotechnology Tools (3.91%)* |
|
16,810 | 16,864 | |||||||||||||||
|
|
|
|
|
|||||||||||||||
| Entrigue Surgical, Inc. |
Surgical Devices |
Senior Debt |
$ | 3,000 | 2,879 | 2,879 | ||||||||||||
|
|
|
|
|
|||||||||||||||
| Total Entrigue Surgical, Inc. |
|
2,879 | 2,879 | |||||||||||||||
| Transmedics, Inc. (4) |
Surgical Devices |
Senior Debt |
$ | 8,375 | 8,602 | 8,602 | ||||||||||||
|
|
|
|
|
|||||||||||||||
| Total Transmedics, Inc. |
|
8,602 | 8,602 | |||||||||||||||
|
|
|
|
|
|||||||||||||||
| Total Debt Surgical Devices (2.66%)* |
|
11,481 | 11,481 | |||||||||||||||
|
|
|
|
|
|||||||||||||||
See notes to consolidated financial statements.
129
Table of Contents
HERCULES TECHNOLOGY GROWTH CAPITAL, INC.
CONSOLIDATED SCHEDULE OF INVESTMENTS
December 31, 2011
(dollars in thousands)
| Portfolio Company |
Industry | Type of Investment(1) |
Series | Principal Amount |
Cost(2) | Value(3) | ||||||||||||
| Neoprobe (pka Navidea) |
Media/ Content/ Info |
Senior Debt |
$ | 7,000 | $ | 6,733 | $ | 6,733 | ||||||||||
| Total Neoprobe (pka Navidea) |
Matures December 2014 |
|
6,733 | 6,733 | ||||||||||||||
| Women’s Marketing, Inc. |
Media/ Content/ Info |
Senior Debt |
$ | 10,000 | 9,956 | 10,156 | ||||||||||||
| Senior Debt |
$ | 9,710 | 9,503 | 9,896 | ||||||||||||||
| Senior Debt |
$ | 9,956 | 9,744 | 9,744 | ||||||||||||||
|
|
|
|
|
|||||||||||||||
| Total Women’s Marketing, Inc. |
|
29,203 | 29,796 | |||||||||||||||
|
|
|
|
|
|||||||||||||||
| Total Debt Media/Content/Info (8.47%)* |
|
35,936 | 36,529 | |||||||||||||||
|
|
|
|
|
|||||||||||||||
| BrightSource Energy, Inc.(4) |
Clean Tech | Senior Debt |
$ | 11,250 | 11,122 | 11,122 | ||||||||||||
| Senior Debt |
$ | 13,750 | 13,593 | 13,593 | ||||||||||||||
|
|
|
|
|
|||||||||||||||
| Total BrightSource Energy, Inc. |
|
24,715 | 24,715 | |||||||||||||||
| EcoMotors, Inc. |
Clean Tech | Senior Debt |
$ | 4,879 | 4,713 | 4,859 | ||||||||||||
|
|
|
|
|
|||||||||||||||
| Total EcoMotors, Inc. |
|
4,713 | 4,859 | |||||||||||||||
| Enphase Energy, Inc. |
Clean Tech | Senior Debt |
$ | 4,898 | 4,784 | 4,748 | ||||||||||||
|
|
|
|
|
|||||||||||||||
| Total Enphase Energy, Inc. |
|
4,784 | 4,748 | |||||||||||||||
| NanoSolar, Inc. |
Clean Tech | Senior Debt |
$ | 9,212 | 8,795 | 8,795 | ||||||||||||
|
|
|
|
|
|||||||||||||||
| Total NanoSolar, Inc. |
|
8,795 | 8,795 | |||||||||||||||
| Integrated Photovoltaics |
Clean Tech | Senior Debt |
$ | 3,000 | 2,875 | 2,875 | ||||||||||||
|
|
|
|
|
|||||||||||||||
| Total Integrated Photovoltaics |
|
2,875 | 2,875 | |||||||||||||||
See notes to consolidated financial statements.
130
Table of Contents
HERCULES TECHNOLOGY GROWTH CAPITAL, INC.
CONSOLIDATED SCHEDULE OF INVESTMENTS
December 31, 2011
(dollars in thousands)
| Portfolio Company |
Industry | Type of Investment(1) |
Series | Principal Amount |
Cost(2) | Value(3) | ||||||||||||
| Propel Biofuels, Inc. |
Clean Tech | Senior Debt |
$ | 1,348 | $ | 1,356 | $ | 1,320 | ||||||||||
|
|
|
|
|
|||||||||||||||
| Total Propel Biofuels, Inc. |
|
1,356 | 1,320 | |||||||||||||||
| SCIenergy, Inc. |
Clean Tech | Senior Debt |
$ | 202 | 202 | 202 | ||||||||||||
| Senior Debt |
$ | 5,000 | 4,883 | 4,883 | ||||||||||||||
|
|
|
|
|
|||||||||||||||
| Total SCIenergy, Inc. |
|
5,085 | 5,085 | |||||||||||||||
| Solexel, Inc. |
Clean Tech | Senior Debt |
$ | 937 | 594 | 594 | ||||||||||||
| Senior Debt |
$ | 8,120 | 8,389 | 8,389 | ||||||||||||||
|
|
|
|
|
|||||||||||||||
| Total Solexel, Inc. |
|
8,983 | 8,983 | |||||||||||||||
|
|
|
|
|
|||||||||||||||
| Total Debt Clean Tech (14.24%)* |
|
61,306 | 61,380 | |||||||||||||||
|
|
|
|
|
|||||||||||||||
| Total Debt (135.90%) |
|
589,192 | 585,767 | |||||||||||||||
See notes to consolidated financial statements.
131
Table of Contents
HERCULES TECHNOLOGY GROWTH CAPITAL, INC.
CONSOLIDATED SCHEDULE OF INVESTMENTS
December 31, 2011
(dollars in thousands)
| Portfolio Company |
Industry | Type of Investment(1) |
Series | Shares | Cost(2) | Value(3) | ||||||||||||
| Acceleron Pharmaceuticals, Inc. |
Drug Discovery | Common Stock Warrants | 46,446 | $ | 39 | $ | 42 | |||||||||||
| & Development | Preferred Stock Warrants | Series A | 426,000 | 69 | 273 | |||||||||||||
| Preferred Stock Warrants | Series B | 110,270 | 35 | 51 | ||||||||||||||
|
|
|
|
|
|
|
|||||||||||||
| Total Warrants Acceleron Pharmaceuticals, Inc. |
582,716 | 143 | 366 | |||||||||||||||
| Anthera Pharmaceuticals Inc. |
Drug Discovery | Common Stock Warrants | 176,786 | 541 | 551 | |||||||||||||
| & Development | Common Stock Warrants | 144,643 | 443 | 451 | ||||||||||||||
|
|
|
|
|
|
|
|||||||||||||
| Total Warrants Anthera Pharmaceuticals Inc. |
321,429 | 984 | 1,002 | |||||||||||||||
| Dicerna Pharmaceuticals, Inc. |
Drug Discovery | Preferred Stock Warrants | Series A | 525,000 | 236 | 69 | ||||||||||||
| & Development | Common Stock Warrants | 50,000 | 28 | 0 | ||||||||||||||
| Preferred Stock Warrants | Series B | 660,000 | 311 | 137 | ||||||||||||||
|
|
|
|
|
|
|
|||||||||||||
| Total Warrants Dicerna Pharmaceuticals, Inc. |
1,235,000 | 575 | 206 | |||||||||||||||
| EpiCept Corporation(5) |
Drug Discovery & Development |
Common Stock Warrants | 325,204 | 4 | 15 | |||||||||||||
|
|
|
|
|
|
|
|||||||||||||
| Total Warrants EpiCept Corporation |
325,204 | 4 | 15 | |||||||||||||||
| Concert Pharmaceuticals |
Drug Discovery & Development |
Preferred Stock Warrants | Series C | 200,000 | 234 | 233 | ||||||||||||
|
|
|
|
|
|
|
|||||||||||||
| Total Concert Pharmaceuticals |
200,000 | 234 | 233 | |||||||||||||||
| NextWave Pharmaceuticals |
Drug Discovery & Development |
Preferred Stock Warrants | Series A-1 | 540,216 | 126 | 125 | ||||||||||||
|
|
|
|
|
|
|
|||||||||||||
| Total NextWave Pharmaceuticals |
540,216 | 126 | 125 | |||||||||||||||
| Horizon Therapeutics, Inc. |
Drug Discovery & Development |
Common Stock Warrants | 22,408 | 231 | — | |||||||||||||
|
|
|
|
|
|
|
|||||||||||||
| Total Horizon Therapeutics, Inc. |
22,408 | 231 | — | |||||||||||||||
| Merrimack Pharmaceuticals, Inc. |
Drug Discovery & Development |
Preferred Stock Warrants | Series D | 302,143 | 155 | 1,116 | ||||||||||||
|
|
|
|
|
|
|
|||||||||||||
| Total Merrimack Pharmaceuticals, Inc. |
302,143 | 155 | 1,116 | |||||||||||||||
| Paratek Pharmaceuticals, Inc. |
Drug Discovery & Development |
Preferred Stock Warrants | Series F | 210,473 | 137 | 68 | ||||||||||||
|
|
|
|
|
|
|
|||||||||||||
| Total Paratek Pharmaceuticals, Inc. |
210,473 | 137 | 68 | |||||||||||||||
| PolyMedix, Inc. |
Drug Discovery & Development |
Common Stock Warrants | 627,586 | 480 | 97 | |||||||||||||
|
|
|
|
|
|
|
|||||||||||||
| Total PolyMedix, Inc. |
627,586 | 480 | 97 | |||||||||||||||
| Portola Pharmaceuticals, Inc. |
Drug Discovery & Development |
Preferred Stock Warrants | Series B | 687,023 | 152 | 207 | ||||||||||||
|
|
|
|
|
|
|
|||||||||||||
| Total Portola Pharmaceuticals, Inc. |
687,023 | 152 | 207 | |||||||||||||||
| Aegerion Pharmaceuticals, Inc. |
Drug Discovery & Development |
Common Stock Warrants | 107,779 | 69 | 1,115 | |||||||||||||
|
|
|
|
|
|
|
|||||||||||||
| Total Aegerion Pharmaceuticals, Inc. |
107,779 | 69 | 1,115 | |||||||||||||||
See notes to consolidated financial statements.
132
Table of Contents
HERCULES TECHNOLOGY GROWTH CAPITAL, INC.
CONSOLIDATED SCHEDULE OF INVESTMENTS
December 31, 2011
(dollars in thousands)
| Portfolio Company |
Industry | Type of Investment(1) |
Series | Shares | Cost(2) | Value(3) | ||||||||||||
| Chroma Therapeutics, Ltd.(5) |
Drug Discovery & Development |
Preferred Stock Warrants | Series D | 325,261 | $ | 490 | $ | 387 | ||||||||||
|
|
|
|
|
|
|
|||||||||||||
| Total Chroma Therapeutics, Ltd. |
325,261 | 490 | 387 | |||||||||||||||
| NeurogesX, Inc. |
Drug Discovery & Development |
Common Stock Warrants | 791,667 | 503 | 122 | |||||||||||||
|
|
|
|
|
|
|
|||||||||||||
| Total NeurogesX, Inc. |
791,667 | 503 | 122 | |||||||||||||||
|
|
|
|
|
|||||||||||||||
|
|
|
|||||||||||||||||
| Total Warrants Drug Discovery & Development (1.17%)* |
6,278,905 | 4,283 | 5,059 | |||||||||||||||
|
|
|
|
|
|
|
|||||||||||||
| Affinity Videonet, Inc. |
Communications & Networking |
Preferred Stock Warrants | Series A | 201,031 | 102 | 165 | ||||||||||||
|
|
|
|
|
|
|
|||||||||||||
| Total Affinity Videonet, Inc. |
201,031 | 102 | 165 | |||||||||||||||
| IKANO Communications, Inc. |
Communications & Networking |
Preferred Stock Warrants | Series D | 296,344 | 45 | — | ||||||||||||
| Preferred Stock Warrants | Series D | 451,354 | 72 | — | ||||||||||||||
|
|
|
|
|
|
|
|||||||||||||
| Total IKANO Communications, Inc. |
747,698 | 117 | — | |||||||||||||||
| Intelepeer, Inc. |
Communications & Networking |
Preferred Stock Warrants | Series C | 117,958 | 101 | 92 | ||||||||||||
|
|
|
|
|
|
|
|||||||||||||
| Total Intelepeer, Inc. |
117,958 | 101 | 92 | |||||||||||||||
| Neonova Holding Company |
Communications & Networking |
Preferred Stock Warrants | Series A | 450,000 | 94 | 28 | ||||||||||||
|
|
|
|
|
|
|
|||||||||||||
| Total Neonova Holding Company |
450,000 | 94 | 28 | |||||||||||||||
| Pac-West Telecomm, Inc. |
Communications & Networking |
Common Stock Warrants | 54,688 | 121 | — | |||||||||||||
|
|
|
|
|
|
|
|||||||||||||
| Total Pac-West Telecomm, Inc. |
54,688 | 121 | — | |||||||||||||||
| PeerApp, Inc. |
Communications & Networking |
Preferred Stock Warrants | Series B | 298,779 | 61 | 23 | ||||||||||||
|
|
|
|
|
|
|
|||||||||||||
| Total PeerApp, Inc.(5) |
298,779 | 61 | 23 | |||||||||||||||
| Peerless Network, Inc. |
Communications & Networking |
Preferred Stock Warrants | Series A | 135,000 | 95 | 206 | ||||||||||||
|
|
|
|
|
|
|
|||||||||||||
| Total Peerless Network, Inc. |
135,000 | 95 | 206 | |||||||||||||||
| Ping Identity Corporation |
Communications & Networking |
Preferred Stock Warrants | Series B | 1,136,277 | 52 | 109 | ||||||||||||
|
|
|
|
|
|
|
|||||||||||||
| Total Ping Identity Corporation |
1,136,277 | 52 | 109 | |||||||||||||||
| PointOne, Inc. |
Communications & Networking |
Common Stock Warrants | 145,877 | 131 | 5 | |||||||||||||
|
|
|
|
|
|
|
|||||||||||||
| Total PointOne, Inc. |
145,877 | 131 | 5 | |||||||||||||||
| Purcell Systems, Inc. |
Communications & Networking |
Preferred Stock Warrants | Series B | 110,000 | 123 | 121 | ||||||||||||
|
|
|
|
|
|
|
|||||||||||||
See notes to consolidated financial statements.
133
Table of Contents
HERCULES TECHNOLOGY GROWTH CAPITAL, INC.
CONSOLIDATED SCHEDULE OF INVESTMENTS
December 31, 2011
(dollars in thousands)
| Portfolio Company |
Industry | Type of Investment(1) |
Series | Shares | Cost(2) | Value(3) | ||||||||||||
| Total Purcell Systems, Inc. |
110,000 | $ | 123 | $ | 121 | |||||||||||||
| Stoke, Inc(4) |
Communications & Networking |
Preferred Stock Warrants | Series C | 158,536 | 53 | 149 | ||||||||||||
| Preferred Stock Warrants | Series D | 72,727 | 65 | 81 | ||||||||||||||
|
|
|
|
|
|
|
|||||||||||||
| Total Stoke, Inc. |
231,263 | 118 | 230 | |||||||||||||||
|
|
|
|
|
|
|
|||||||||||||
| Total Warrants Communications & Networking (0.23%)* |
3,628,571 | 1,115 | 979 | |||||||||||||||
|
|
|
|
|
|
|
|||||||||||||
| Atrenta, Inc. |
Software | Preferred Stock Warrants | Series C | 1,196,847 | 136 | 815 | ||||||||||||
| Preferred Stock Warrants | Series D | 356,973 | 95 | 284 | ||||||||||||||
|
|
|
|
|
|
|
|||||||||||||
| Total Atrenta, Inc. |
1,553,820 | 231 | 1,099 | |||||||||||||||
| Blurb, Inc. |
Software | Preferred Stock Warrants | Series B | 439,336 | 323 | 855 | ||||||||||||
| Preferred Stock Warrants | Series C | 234,280 | 636 | 636 | ||||||||||||||
|
|
|
|
|
|
|
|||||||||||||
| Total Blurb, Inc. |
673,616 | 959 | 1,491 | |||||||||||||||
| Braxton Technologies, LLC. |
Software | Preferred Stock Warrants | Series A | 168,750 | 189 | — | ||||||||||||
|
|
|
|
|
|
|
|||||||||||||
| Total Braxton Technologies, LLC. |
168,750 | 189 | — | |||||||||||||||
| Bullhorn, Inc. |
Software | Preferred Stock Warrants | Series C | 122,807 | 43 | 229 | ||||||||||||
|
|
|
|
|
|
|
|||||||||||||
| Total Bullhorn, Inc. |
122,807 | 43 | 229 | |||||||||||||||
| Central Desktop, Inc. |
Software | Preferred Stock Warrants | Series B | 522,823 | 108 | 398 | ||||||||||||
|
|
|
|
|
|
|
|||||||||||||
| Total Central Desktop, Inc. |
522,823 | 108 | 398 | |||||||||||||||
| Clickfox, Inc. |
Software | Preferred Stock Warrants | Series B | 1,038,563 | 329 | 522 | ||||||||||||
|
|
|
|
|
|
|
|||||||||||||
| Total Clickfox, Inc. |
1,038,563 | 329 | 522 | |||||||||||||||
| Forescout Technologies, Inc. |
Software | Preferred Stock Warrants | Series D | 399,687 | 99 | 142 | ||||||||||||
|
|
|
|
|
|
|
|||||||||||||
| Total Forescout Technologies, Inc. |
399,687 | 99 | 142 | |||||||||||||||
| HighRoads, Inc. |
Software | Preferred Stock Warrants | Series B | 190,176 | 45 | 7 | ||||||||||||
|
|
|
|
|
|
|
|||||||||||||
| Total HighRoads, Inc. |
190,176 | 45 | 7 | |||||||||||||||
| Kxen, Inc. |
Software | Preferred Stock Warrants | Series D | 184,614 | 47 | 22 | ||||||||||||
|
|
|
|
|
|
|
|||||||||||||
| Total Kxen, Inc. |
184,614 | 47 | 22 | |||||||||||||||
| RichRelevance, Inc. |
Software | Preferred Stock Warrants | Series D | 112,749 | 98 | 12 | ||||||||||||
|
|
|
|
|
|
|
|||||||||||||
| Total RichRelevance, Inc. |
112,749 | 98 | 12 | |||||||||||||||
| Rockyou, Inc. |
Software | Preferred Stock Warrants | Series B | 41,266 | 116 | 1 | ||||||||||||
|
|
|
|
|
|
|
|||||||||||||
| Total Rockyou, Inc. |
41,266 | 116 | 1 | |||||||||||||||
| Sportvision, Inc. |
Software | Preferred Stock Warrants | Series B | 259,139 | 39 | — | ||||||||||||
|
|
|
|
|
|
|
|||||||||||||
See notes to consolidated financial statements.
134
Table of Contents
HERCULES TECHNOLOGY GROWTH CAPITAL, INC.
CONSOLIDATED SCHEDULE OF INVESTMENTS
December 31, 2011
(dollars in thousands)
| Portfolio Company |
Industry | Type of Investment(1) |
Series | Shares | Cost(2) | Value(3) | ||||||||||||
| Total Sportvision, Inc. |
259,139 | $ | 39 | $ | — | |||||||||||||
| SugarSync Inc. |
Software | Preferred Stock Warrants | Series CC | 332,726 | 78 | 162 | ||||||||||||
|
|
|
|
|
|
|
|||||||||||||
| Total SugarSync Inc. |
332,726 | 78 | 162 | |||||||||||||||
| Daegis Inc. (pka Unify Corporation) |
Software | Common Stock Warrants | 718,860 | 1,434 | 237 | |||||||||||||
|
|
|
|
|
|
|
|||||||||||||
| Total Daegis Inc. |
718,860 | 1,434 | 237 | |||||||||||||||
| White Sky, Inc. |
Software | Preferred Stock Warrants | Series B-2 | 124,295 | 54 | 3 | ||||||||||||
|
|
|
|
|
|
|
|||||||||||||
| Total White Sky, Inc. |
124,295 | 54 | 3 | |||||||||||||||
| Tada |
Software | Preferred Stock Warrants | Series A | 20,833 | 25 | 25 | ||||||||||||
|
|
|
|
|
|
|
|||||||||||||
| Total Tada |
20,833 | 25 | 25 | |||||||||||||||
| WildTangent, Inc. |
Software | Preferred Stock Warrants | Series 3A | 100,000 | 238 | 22 | ||||||||||||
|
|
|
|
|
|
|
|||||||||||||
| Total WildTangent, Inc. |
100,000 | 238 | 22 | |||||||||||||||
|
|
|
|
|
|
|
|||||||||||||
| Total Warrants Software (1.01%)* |
6,564,724 | 4,132 | 4,372 | |||||||||||||||
|
|
|
|
|
|
|
|||||||||||||
| Luminus Devices, Inc. |
Electronics & | Common Stock Warrants | 6,681 | 334 | — | |||||||||||||
| Computer Hardware | Common Stock Warrants | 3,341 | 84 | — | ||||||||||||||
| Common Stock Warrants | 16,364 | 183 | — | |||||||||||||||
|
|
|
|
|
|
|
|||||||||||||
| Total Luminus Devices, Inc. |
26,386 | 601 | — | |||||||||||||||
| Shocking Technologies, Inc. |
Electronics & Computer Hardware |
Preferred Stock Warrants | Series A-1 | 181,818 | 63 | 196 | ||||||||||||
|
|
|
|
|
|
|
|||||||||||||
| Total Shocking Technologies, Inc. |
181,818 | 63 | 196 | |||||||||||||||
|
|
|
|
|
|
|
|||||||||||||
| Total Warrant Electronics & Computer Hardware (0.05%)* |
208,204 | 664 | 196 | |||||||||||||||
|
|
|
|
|
|
|
|||||||||||||
| Althea Technologies, Inc. |
Specialty Pharmaceuticals |
Preferred Stock Warrants | Series D | 502,273 | 309 | 516 | ||||||||||||
|
|
|
|
|
|
|
|||||||||||||
| Total Althea Technologies, Inc. |
502,273 | 309 | 516 | |||||||||||||||
| Pacira Pharmaceuticals, Inc. |
Specialty Pharmaceuticals |
Common Stock Warrants | 178,987 | 1,086 | 425 | |||||||||||||
|
|
|
|
|
|
|
|||||||||||||
| Total Pacira Pharmaceuticals, Inc. |
178,987 | 1,086 | 425 | |||||||||||||||
| Quatrx Pharmaceuticals Company |
Specialty Pharmaceuticals |
Preferred Stock Warrants | Series E | 340,534 | 528 | — | ||||||||||||
|
|
|
|
|
|
|
|||||||||||||
| Total Quatrx Pharmaceuticals Company |
340,534 | 528 | — | |||||||||||||||
| Total Warrants Specialty Pharmaceuticals (0.22%)* |
1,021,794 | 1,923 | 941 | |||||||||||||||
|
|
|
|
|
|
|
|||||||||||||
See notes to consolidated financial statements.
135
Table of Contents
HERCULES TECHNOLOGY GROWTH CAPITAL, INC.
CONSOLIDATED SCHEDULE OF INVESTMENTS
December 31, 2011
(dollars in thousands)
| Portfolio Company |
Industry | Type of Investment(1) |
Series | Shares | Cost(2) | Value(3) | ||||||||||||
| Annie’s, Inc. |
Consumer & Business Products |
Preferred Stock Warrants | Series A | 65,000 | $ | 321 | $ | 250 | ||||||||||
|
|
|
|
|
|
|
|||||||||||||
| Total Annie’s, Inc. |
65,000 | 321 | 250 | |||||||||||||||
| IPA Holdings, LLC |
Consumer & Business Products |
Common Stock Warrants | 650,000 | 275 | 58 | |||||||||||||
|
|
|
|
|
|
|
|||||||||||||
| Total IPA Holding, LLC |
650,000 | 275 | 58 | |||||||||||||||
| Market Force Information, Inc. |
Consumer & Business Products |
Preferred Stock Warrants | Series A | 99,286 | 24 | 118 | ||||||||||||
|
|
|
|
|
|
|
|||||||||||||
| Total Market Force Information, Inc. |
99,286 | 24 | 118 | |||||||||||||||
| Wageworks, Inc. |
Consumer & Business Products |
Preferred Stock Warrants | Series C | 423,529 | 252 | 2,495 | ||||||||||||
|
|
|
|
|
|
|
|||||||||||||
| Total Wageworks, Inc. |
423,529 | 252 | 2,495 | |||||||||||||||
| Seven Networks, Inc. |
Consumer & Business Products |
Preferred Stock Warrants | Series C | 1,821,429 | 174 | — | ||||||||||||
|
|
|
|
|
|
|
|||||||||||||
| Total Seven Networks, Inc. |
1,821,429 | 174 | — | |||||||||||||||
| Total Warrant Consumer & Business Products (0.68%)* |
3,059,244 | 1,046 | 2,921 | |||||||||||||||
|
|
|
|
|
|
|
|||||||||||||
| Achronix Semiconductor Corporation |
Semiconductors | Preferred Stock Warrants | Series D | 360,000 | 160 | 145 | ||||||||||||
|
|
|
|
|
|
|
|||||||||||||
| Total Achronix Semiconductor Corporation |
360,000 | 160 | 145 | |||||||||||||||
| Enpirion, Inc. |
Semiconductors | Preferred Stock Warrants | Series D | 239,872 | 157 | — | ||||||||||||
|
|
|
|
|
|
|
|||||||||||||
| Total Enpirion, Inc. |
239,872 | 157 | — | |||||||||||||||
| iWatt, Inc. |
Semiconductors | Preferred Stock Warrants | Series C | 558,748 | 46 | 3 | ||||||||||||
| Preferred Stock Warrants | Series D | 1,954,762 | 582 | 10 | ||||||||||||||
|
|
|
|
|
|
|
|||||||||||||
| Total iWatt, Inc. |
2,513,510 | 628 | 13 | |||||||||||||||
| Kovio Inc. |
Semiconductors | Preferred Stock Warrants | Series B | 319,352 | 92 | 4 | ||||||||||||
|
|
|
|
|
|
|
|||||||||||||
| Total Kovio Inc. |
319,352 | 92 | 4 | |||||||||||||||
| NEXX Systems, Inc. |
Semiconductors | Preferred Stock Warrants | Series D | 2,941,176 | 297 | 1,328 | ||||||||||||
|
|
|
|
|
|
|
|||||||||||||
| Total NEXX Systems, Inc. |
2,941,176 | 297 | 1,328 | |||||||||||||||
| Quartics, Inc. |
Semiconductors | Preferred Stock Warrants | Series C | 69,139 | 53 | — | ||||||||||||
|
|
|
|
|
|
|
|||||||||||||
| Total Quartics, Inc. |
69,139 | 53 | — | |||||||||||||||
| Total Warrants Semiconductors (0.35%)* |
6,443,049 | 1,387 | 1,490 | |||||||||||||||
|
|
|
|
|
|
|
|||||||||||||
See notes to consolidated financial statements.
136
Table of Contents
HERCULES TECHNOLOGY GROWTH CAPITAL, INC.
CONSOLIDATED SCHEDULE OF INVESTMENTS
December 31, 2011
(dollars in thousands)
| Portfolio Company |
Industry | Type of Investment(1) |
Series | Shares | Cost(2) | Value(3) | ||||||||||||
| AcelRX Pharmaceuticals, Inc. |
Drug Delivery | Common Stock Warrants | 137,254 | $ | 178 | $ | 41 | |||||||||||
| Common Stock Warrants | 137,254 | 178 | 41 | |||||||||||||||
|
|
|
|
|
|
|
|||||||||||||
| Total AcelRX Pharmaceuticals, Inc. |
274,508 | 356 | 82 | |||||||||||||||
| Alexza Pharmaceuticals, Inc.(4) |
Drug Delivery | Common Stock Warrants | 376,394 | 645 | 72 | |||||||||||||
|
|
|
|
|
|
|
|||||||||||||
| Total Alexza Pharmaceuticals, Inc. |
376,394 | 645 | 72 | |||||||||||||||
| BIND Biosciences, Inc. |
Drug Delivery | Preferred Stock Warrants | Series C-1 | 150,000 | 291 | 427 | ||||||||||||
|
|
|
|
|
|
|
|||||||||||||
| Total BIND Biosciences, Inc. |
150,000 | 291 | 427 | |||||||||||||||
| Merrion Pharmaceuticals, Inc.(5) |
Drug Delivery | Common Stock Warrants | 1,453,519 | 214 | 194 | |||||||||||||
|
|
|
|
|
|
|
|||||||||||||
| Total Merrion Pharmaceuticals, Inc. |
1,453,519 | 214 | 194 | |||||||||||||||
| Transcept Pharmaceuticals, Inc. |
Drug Delivery | Common Stock Warrants | 24,581 | 36 | 62 | |||||||||||||
| Common Stock Warrants | 36,871 | 51 | 93 | |||||||||||||||
|
|
|
|
|
|
|
|||||||||||||
| Total Transcept Pharmaceuticals, Inc. |
61,452 | 87 | 155 | |||||||||||||||
| Revance Therapeutics, Inc. |
Drug Delivery | Preferred Stock Warrants | Series D | 269,663 | 557 | 565 | ||||||||||||
|
|
|
|
|
|
|
|||||||||||||
| Total Revance Therapeutics, Inc. |
269,663 | 557 | 565 | |||||||||||||||
| Total Warrant Drug Delivery (0.35%)* |
2,585,536 | 2,150 | 1,495 | |||||||||||||||
|
|
|
|
|
|
|
|||||||||||||
| Gelesis |
Therapeutic | Preferred Stock Warrants | Series A-1 | 263,688 | 78 | 106 | ||||||||||||
|
|
|
|
|
|
|
|||||||||||||
| Total Gelesis |
263,688 | 78 | 106 | |||||||||||||||
| BARRX Medical, Inc. |
Therapeutic | Preferred Stock Warrants | Series C | 66,667 | 76 | 189 | ||||||||||||
|
|
|
|
|
|
|
|||||||||||||
| Total BARRX Medical, Inc. |
66,667 | 76 | 189 | |||||||||||||||
| EKOS Corporation |
Therapeutic | Preferred Stock Warrants | Series C | 4,448,135 | 327 | — | ||||||||||||
|
|
|
|
|
|
|
|||||||||||||
| Total EKOS Corporation |
4,448,135 | 327 | — | |||||||||||||||
| Gynesonics, Inc. |
Therapeutic | Preferred Stock Warrants | Series A | 123,457 | 17 | 17 | ||||||||||||
| Series C | 1,087,497 | 211 | 216 | |||||||||||||||
|
|
|
|
|
|
|
|||||||||||||
| Total Gynesonics, Inc. |
1,210,954 | 228 | 233 | |||||||||||||||
| Light Science Oncology, Inc. |
Therapeutic | Preferred Stock Warrants | Series B | 38,829 | 99 | — | ||||||||||||
|
|
|
|
|
|
|
|||||||||||||
| Total Light Science Oncology, Inc. |
38,829 | 99 | — | |||||||||||||||
| Novasys Medical, Inc. |
Therapeutic | Preferred Stock Warrants | Series D | 526,840 | 125 | 13 | ||||||||||||
|
|
|
|
|
|
|
|||||||||||||
| Total Novasys Medical, Inc. |
526,840 | 125 | 13 | |||||||||||||||
| Oraya Therapeutics, Inc. |
Therapeutic | Preferred Stock Warrants | Series C | 477,966 | 551 | 551 | ||||||||||||
|
|
|
|
|
|
|
|||||||||||||
See notes to consolidated financial statements.
137
Table of Contents
HERCULES TECHNOLOGY GROWTH CAPITAL, INC.
CONSOLIDATED SCHEDULE OF INVESTMENTS
December 31, 2011
(dollars in thousands)
| Portfolio Company |
Industry | Type of Investment(1) |
Series | Shares | Cost(2) | Value(3) | ||||||||||||
| Total Oraya Therapeutics, Inc. |
477,966 | $ | 551 | $ | 551 | |||||||||||||
| Total Warrants Therapeutic (0.25%)* |
7,033,079 | 1,484 | 1,092 | |||||||||||||||
|
|
|
|
|
|
|
|||||||||||||
| Cozi Group, Inc. |
Internet Consumer & Business Services |
Preferred Stock Warrants | Series A | 303,872 | 147 | — | ||||||||||||
|
|
|
|
|
|
|
|||||||||||||
| Total Cozi Group, Inc. |
303,872 | 147 | — | |||||||||||||||
| Invoke Solutions, Inc. |
Internet Consumer & Business Services |
Common Stock Warrants | 12,698 | 6 | — | |||||||||||||
| Common Stock Warrants | 13,068 | 6 | — | |||||||||||||||
| Common Stock Warrants | 13,467 | 11 | — | |||||||||||||||
| Common Stock Warrants | 13,851 | 15 | — | |||||||||||||||
| Common Stock Warrants | 97,657 | 44 | — | |||||||||||||||
|
|
|
|
|
|
|
|||||||||||||
| Total Invoke Solutions, Inc. |
150,741 | 82 | — | |||||||||||||||
| InXpo, Inc. |
Internet Consumer & Business Services |
Preferred Stock Warrants | Series C | 648,400 | 98 | 56 | ||||||||||||
|
|
|
|
|
|
|
|||||||||||||
| Total InXpo, Inc. |
648,400 | 98 | 56 | |||||||||||||||
| Prism Education Group, Inc. |
Internet Consumer & Business Services |
Preferred Stock Warrants | Series B | 200,000 | 43 | — | ||||||||||||
|
|
|
|
|
|
|
|||||||||||||
| Total Prism Education Group, Inc. |
200,000 | 43 | — | |||||||||||||||
| RazorGator Interactive Group, Inc. |
Internet Consumer & Business Services |
Preferred Stock Warrants | Series C | 863,599 | 1,224 | — | ||||||||||||
|
|
|
|
|
|
|
|||||||||||||
| Total RazorGator Interactive Group, Inc. |
863,599 | 1,224 | — | |||||||||||||||
| Reply! Inc.(4) |
Internet Consumer & Business Services |
Preferred Stock Warrants | Series B | 137,225 | 320 | 395 | ||||||||||||
|
|
|
|
|
|
|
|||||||||||||
| Total Reply! Inc. |
137,225 | 320 | 395 | |||||||||||||||
| Trulia, Inc. |
Internet Consumer & Business Services |
Preferred Stock Warrants | Series D | 168,165 | 188 | 413 | ||||||||||||
|
|
|
|
|
|
|
|||||||||||||
| Total Trulia, Inc. |
168,165 | 188 | 413 | |||||||||||||||
| Tectura Corporation |
Internet Consumer & Business Services |
Preferred Stock Warrants | Series B-1 | 253,378 | 51 | 26 | ||||||||||||
|
|
|
|
|
|
|
|||||||||||||
| Total Tectura Corporation |
253,378 | 51 | 26 | |||||||||||||||
| Total Warrants Internet Consumer & Business Services (0.21%) |
2,725,380 | 2,153 | 890 | |||||||||||||||
|
|
|
|
|
|
|
|||||||||||||
| Lilliputian Systems, Inc. |
Energy | Preferred Stock Warrants | Series AA | 235,294 | 106 | — | ||||||||||||
| Common Stock Warrants | 34,939 | 49 | — | |||||||||||||||
|
|
|
|
|
|
|
|||||||||||||
See notes to consolidated financial statements.
138
Table of Contents
HERCULES TECHNOLOGY GROWTH CAPITAL, INC.
CONSOLIDATED SCHEDULE OF INVESTMENTS
December 31, 2011
(dollars in thousands)
| Portfolio Company |
Industry | Type of Investment(1) |
Series | Shares | Cost(2) | Value(3) | ||||||||||||
| Total Lilliputian Systems, Inc. |
270,233 | $ | 155 | $ | — | |||||||||||||
| Total Warrants Energy (0.00%)* |
270,233 | 155 | — | |||||||||||||||
|
|
|
|
|
|
|
|||||||||||||
| Box.net, Inc. |
Information Services | Preferred Stock Warrants | Series C | 199,219 | 117 | 1,557 | ||||||||||||
| Preferred Stock Warrants | Series B | 271,070 | 73 | 2,280 | ||||||||||||||
| Preferred Stock Warrants | Series D-1 | 62,255 | 193 | 233 | ||||||||||||||
|
|
|
|
|
|
|
|||||||||||||
| Total Box.net, Inc. |
532,544 | 383 | 4,070 | |||||||||||||||
| Buzznet, Inc. |
Information Services | Preferred Stock Warrants | Series B | 19,962 | 9 | — | ||||||||||||
|
|
|
|
|
|
|
|||||||||||||
| Total Buzznet, Inc. |
19,962 | 9 | — | |||||||||||||||
| Cha Cha Search, Inc. |
Information Services | Preferred Stock Warrants | Series F | 48,232 | 58 | 1 | ||||||||||||
|
|
|
|
|
|
|
|||||||||||||
| Total Cha Cha Search, Inc. |
48,232 | 58 | 1 | |||||||||||||||
| Magi.com (pka Hi5 Networks, Inc.) |
Information Services | Preferred Stock Warrants | Series B | 1,104,020 | 213 | — | ||||||||||||
|
|
|
|
|
|
|
|||||||||||||
| Total Magi.com |
1,104,020 | 213 | — | |||||||||||||||
| Jab Wireless, Inc. |
Information Services | Preferred Stock Warrants | Series A | 266,567 | 265 | 332 | ||||||||||||
|
|
|
|
|
|
|
|||||||||||||
| Total Jab Wireless, Inc. |
266,567 | 265 | 332 | |||||||||||||||
| Solutionary Inc. |
Information Services | Preferred Stock Warrants | Series E | 117,171 | 96 | — | ||||||||||||
|
|
|
|
|
|
|
|||||||||||||
| Total Solutionary, Inc. |
117,171 | 96 | — | |||||||||||||||
| Intelligent Beauty, Inc. |
Information Services | Preferred Stock Warrants | Series B | 190,234 | 230 | 83 | ||||||||||||
|
|
|
|
|
|
|
|||||||||||||
| Total Intelligent Beauty, Inc. |
190,234 | 230 | 83 | |||||||||||||||
| Zeta Interactive Corporation |
Information Services | Preferred Stock Warrants | Series A | 620,000 | 172 | 237 | ||||||||||||
|
|
|
|
|
|
|
|||||||||||||
| Total Zeta Interactive Corporation |
620,000 | 172 | 237 | |||||||||||||||
| Total Warrants Information Services (1.10%) |
2,898,730 | 1,426 | 4,723 | |||||||||||||||
|
|
|
|
|
|
|
|||||||||||||
| Optiscan Biomedical, Corp. |
Diagnostic | Preferred Stock Warrants | Series A | 1,113,403 | 80 | 150 | ||||||||||||
| Preferred Stock Warrants | Series B | 3,092,784 | 680 | 453 | ||||||||||||||
| Preferred Stock Warrants | Series C | 2,000,000 | 309 | 269 | ||||||||||||||
|
|
|
|
|
|
|
|||||||||||||
| Total Optiscan Biomedical, Corp. |
6,206,187 | 1,069 | 872 | |||||||||||||||
| Total Warrants Diagnostic (0.20%)* |
6,206,187 | 1,069 | 872 | |||||||||||||||
|
|
|
|
|
|
|
|||||||||||||
| deCODE genetics ehf. |
Biotechnology Tools | Preferred Stock Warrants | Series A-2 | 135,871 | 305 | 305 | ||||||||||||
|
|
|
|
|
|
|
|||||||||||||
| Total deCODE genetics ehf. |
135,871 | 305 | 305 | |||||||||||||||
| Labcyte, Inc. |
Biotechnology Tools | Common Stock Warrants | Series C | 840,817 | 197 | 263 | ||||||||||||
|
|
|
|
|
|
|
|||||||||||||
| Total Labcyte, Inc. |
840,817 | 197 | 263 | |||||||||||||||
| Cempra Holdings LLC |
Biotechnology Tools | Preferred Stock Warrants | Series C | 370,714 | 187 | 186 | ||||||||||||
|
|
|
|
|
|
|
|||||||||||||
| Total Cempra Holdings LLC |
370,714 | 187 | 186 | |||||||||||||||
| NuGEN Technologies, Inc. |
Biotechnology Tools | Preferred Stock Warrants | Series B | 204,545 | 45 | 203 | ||||||||||||
| Preferred Stock Warrants | Series C | 30,114 | 33 | 15 | ||||||||||||||
|
|
|
|
|
|
|
|||||||||||||
See notes to consolidated financial statements.
139
Table of Contents
HERCULES TECHNOLOGY GROWTH CAPITAL, INC.
CONSOLIDATED SCHEDULE OF INVESTMENTS
December 31, 2011
(dollars in thousands)
| Portfolio Company |
Industry | Type of Investment(1) |
Series | Shares | Cost(2) | Value(3) | ||||||||||||
| Total NuGEN Technologies, Inc. |
234,659 | $ | 78 | $ | 218 | |||||||||||||
| Total Warrants Biotechnology Tools (0.23%)* |
1,582,061 | 767 | 972 | |||||||||||||||
|
|
|
|
|
|
|
|||||||||||||
| Entrigue Surgical, Inc. |
Surgical Devices | Preferred Stock Warrants | Series B | 62,500 | 87 | 85 | ||||||||||||
|
|
|
|
|
|
|
|||||||||||||
| Total Entrigue Surgical, Inc. |
62,500 | 87 | 85 | |||||||||||||||
| Transmedics, Inc. (4) |
Surgical Devices | Preferred Stock Warrants | Series B | 40,436 | 225 | — | ||||||||||||
|
|
|
|
|
|
|
|||||||||||||
| Total Transmedics, Inc. |
40,436 | 225 | — | |||||||||||||||
| Total Warrants Surgical Devices (0.02%)* |
102,936 | 312 | 85 | |||||||||||||||
|
|
|
|
|
|
|
|||||||||||||
| Glam Media, Inc. |
Media/Content/Info | Preferred Stock Warrants | Series D | 407,457 | 482 | 2 | ||||||||||||
|
|
|
|
|
|
|
|||||||||||||
| Total Glam Media, Inc. |
407,457 | 482 | 2 | |||||||||||||||
| Neoprobe (pka Navidea) |
Media/Content/Info | Common Stock Warrants | 333,333 | 244 | 245 | |||||||||||||
|
|
|
|
|
|
|
|||||||||||||
| Total Neoprobe (pka Navidea) |
333,333 | 244 | 245 | |||||||||||||||
| Everyday Health, Inc. (Waterfront Media, Inc.) |
Media/Content/Info | Preferred Stock Warrants | Series C | 110,018 | 60 | 504 | ||||||||||||
|
|
|
|
|
|
|
|||||||||||||
| Total Everyday Health |
110,018 | 60 | 504 | |||||||||||||||
| Total Warrants Media/Content/Info (0.17%)* |
850,808 | 786 | 751 | |||||||||||||||
|
|
|
|
|
|
|
|||||||||||||
| BrightSource Energy, Inc.(4) |
Clean Tech | Preferred Stock Warrants | Series D | 130,120 | 675 | 834 | ||||||||||||
|
|
|
|
|
|
|
|||||||||||||
| Total BrightSource Energy, Inc. |
130,120 | 675 | 834 | |||||||||||||||
| Calera, Inc. |
Clean Tech | Preferred Stock Warrants | Series C | 44,529 | 513 | 475 | ||||||||||||
|
|
|
|
|
|
|
|||||||||||||
| Total Calera, Inc. |
44,529 | 513 | 475 | |||||||||||||||
| EcoMotors, Inc. |
Clean Tech | Preferred Stock Warrants | Series B | 218,750 | 154 | 323 | ||||||||||||
| Preferred Stock Warrants | Series B | 218,750 | 154 | 323 | ||||||||||||||
|
|
|
|
|
|
|
|||||||||||||
| Total EcoMotors, Inc. |
437,500 | 308 | 646 | |||||||||||||||
| Enphase Energy, Inc. |
Clean Tech | Preferred Stock Warrants | Series E | 330,882 | 102 | 49 | ||||||||||||
|
|
|
|
|
|
|
|||||||||||||
| Total Enphase Energy, Inc. |
330,882 | 102 | 49 | |||||||||||||||
| GreatPoint Energy, Inc. |
Clean Tech | Preferred Stock Warrants | Series D-1 | 393,212 | 548 | 208 | ||||||||||||
|
|
|
|
|
|
|
|||||||||||||
| Total GreatPoint Energy, Inc. |
393,212 | 548 | 208 | |||||||||||||||
| NanoSolar, Inc. |
Clean Tech | Preferred Stock Warrants | Series D | 76,353 | 355 | 355 | ||||||||||||
|
|
|
|
|
|
|
|||||||||||||
| Total NanoSolar, Inc. |
76,353 | 355 | 355 | |||||||||||||||
| Propel Biofuels, Inc. |
Clean Tech | Preferred Stock Warrants | Series C | 3,200,000 | 211 | 170 | ||||||||||||
|
|
|
|
|
|
|
|||||||||||||
| Total Propel Biofuels, Inc. |
3,200,000 | 211 | 170 | |||||||||||||||
| SCIenergy, Inc. |
Clean Tech | Preferred Stock Warrants | 5,792 | 8 | 2 | |||||||||||||
| Preferred Stock Warrants | Series C | 92,673 | 130 | 30 | ||||||||||||||
|
|
|
|
|
|
|
|||||||||||||
| Total SCIenergy, Inc. |
98,465 | 138 | 32 | |||||||||||||||
| Solexel, Inc. |
Clean Tech | Preferred Stock Warrants | Series B | 245,682 | 1,161 | 275 | ||||||||||||
|
|
|
|
|
|
|
|||||||||||||
See notes to consolidated financial statements.
140
Table of Contents
HERCULES TECHNOLOGY GROWTH CAPITAL, INC.
CONSOLIDATED SCHEDULE OF INVESTMENTS
December 31, 2011
(dollars in thousands)
| Portfolio Company |
Industry | Type of Investment(1) |
Series | Shares | Cost(2) | Value(3) | ||||||||||||
| Total Solexel, Inc. |
245,682 | $ | 1,161 | $ | 275 | |||||||||||||
| Trilliant, Inc. |
Clean Tech | Preferred Stock Warrants | Series A | 320,000 | 162 | 82 | ||||||||||||
|
|
|
|
|
|
|
|||||||||||||
| Total Trilliant, Inc. |
320,000 | 162 | 82 | |||||||||||||||
| Integrated Photovoltaics |
Clean Tech | Preferred Stock Warrants | Series A-1 | 390,000 | 82 | 81 | ||||||||||||
|
|
|
|
|
|
|
|||||||||||||
| Total Integrated Photovoltaics |
390,000 | 82 | 81 | |||||||||||||||
| Total Warrants Clean Tech (0.74%)* |
5,666,743 | 4,255 | 3,207 | |||||||||||||||
|
|
|
|
|
|
|
|||||||||||||
| Total Warrants (6.97%) |
|
29,107 | 30,045 | |||||||||||||||
|
|
|
|
|
|||||||||||||||
| Aegerion Pharmaceuticals, Inc. |
Drug Discovery & Development |
Common Stock | 144,017 | 1,092 | 2,411 | |||||||||||||
|
|
|
|
|
|
|
|||||||||||||
| Total Aegerion Pharmaceuticals, Inc. |
144,017 | 1,092 | 2,411 | |||||||||||||||
| Aveo Pharmaceuticals |
Drug Discovery & Development |
Common Stock | 167,864 | 842 | 2,887 | |||||||||||||
|
|
|
|
|
|
|
|||||||||||||
| Total Aveo Pharmaceuticals |
167,864 | 842 | 2,887 | |||||||||||||||
| Dicerna Pharmaceuticals, Inc. |
Drug Discovery & Development |
Preferred Stock | Series B | 502,684 | 503 | 374 | ||||||||||||
|
|
|
|
|
|
|
|||||||||||||
| Total Dicerna Pharmaceuticals, Inc. |
502,684 | 503 | 374 | |||||||||||||||
| Inotek Pharmaceuticals Corp. |
Drug Discovery & Development |
Preferred Stock | Series C | 15,334 | 1,500 | — | ||||||||||||
|
|
|
|
|
|
|
|||||||||||||
| Total Inotek Pharmaceuticals Corp. |
15,334 | 1,500 | — | |||||||||||||||
| Merrimack Pharmaceuticals, Inc. |
Drug Discovery & Development |
Preferred Stock | Series E | 546,448 | 2,000 | 3,825 | ||||||||||||
|
|
|
|
|
|
|
|||||||||||||
| Total Merrimack Pharmaceuticals, Inc. |
546,448 | 2,000 | 3,825 | |||||||||||||||
| Paratek Pharmaceuticals, Inc. |
Drug Discovery & Development |
Preferred Stock | Series H | 244,158 | 1,000 | 1,231 | ||||||||||||
|
|
|
|
|
|
|
|||||||||||||
| Total Paratek Pharmaceuticals, Inc. |
244,158 | 1,000 | 1,231 | |||||||||||||||
| Total Equity Drug Discovery & Development (2.49%)* |
1,620,505 | 6,937 | 10,728 | |||||||||||||||
|
|
|
|
|
|
|
|||||||||||||
| Acceleron Pharmaceuticals, Inc. |
Drug Delivery | Preferred Stock | Series C | 93,456 | 243 | 163 | ||||||||||||
| Acceleron Pharmaceuticals, Inc. |
Preferred Stock | Series E | 43,488 | 98 | 138 | |||||||||||||
| Acceleron Pharmaceuticals, Inc. |
Preferred Stock | Series F | 19,268 | 60 | 61 | |||||||||||||
| Acceleron Pharmaceuticals, Inc. |
Preferred Stock | Series B | 600,601 | 1,000 | 724 | |||||||||||||
|
|
|
|
|
|
|
|||||||||||||
| Total Acceleron Pharmaceuticals, Inc. |
756,813 | 1,401 | 1,086 | |||||||||||||||
See notes to consolidated financial statements.
141
Table of Contents
HERCULES TECHNOLOGY GROWTH CAPITAL, INC.
CONSOLIDATED SCHEDULE OF INVESTMENTS
December 31, 2011
(dollars in thousands)
| Portfolio Company |
Industry | Type of Investment(1) |
Series | Shares | Cost(2) | Value(3) | ||||||||||||
| Transcept Pharmaceuticals, Inc. |
Drug Delivery | Common Stock | 41,570 | $ | 500 | $ | 325 | |||||||||||
|
|
|
|
|
|
|
|||||||||||||
| Total Transcept Pharmaceuticals, Inc. |
41,570 | 500 | 325 | |||||||||||||||
| Total Equity Drug Delivery (0.33%)* |
798,383 | 1,901 | 1,411 | |||||||||||||||
|
|
|
|
|
|
|
|||||||||||||
| E-band Communications, Corp.(6) |
Communications & Networking |
Preferred Stock | Series B | 564,972 | 2,000 | — | ||||||||||||
| Preferred Stock | Series C | 649,998 | 372 | — | ||||||||||||||
| Preferred Stock | Series D | 847,544 | 508 | — | ||||||||||||||
|
|
|
|
|
|
|
|||||||||||||
| Total E-Band Communications, Corp. |
2,062,514 | 2,880 | — | |||||||||||||||
| Neonova Holding Company |
Communications & Networking |
Preferred Stock | Series A | 500,000 | 250 | 212 | ||||||||||||
|
|
|
|
|
|
|
|||||||||||||
| Total Neonova Holding Company |
500,000 | 250 | 212 | |||||||||||||||
| Peerless Network, Inc. |
Communications & Networking |
Preferred Stock | Series A | 1,000,000 | 1,000 | 2,335 | ||||||||||||
|
|
|
|
|
|
|
|||||||||||||
| Total Peerless Network, Inc. |
1,000,000 | 1,000 | 2,335 | |||||||||||||||
| Stoke, Inc(4) |
Communications & Networking |
Preferred Stock | Series E | 152,905 | 500 | 458 | ||||||||||||
|
|
|
|
|
|
|
|||||||||||||
| Total Stoke, Inc. |
152,905 | 500 | 458 | |||||||||||||||
| Total Equity Communications & Networking (0.70%)* |
3,715,419 | 4,630 | 3,005 | |||||||||||||||
|
|
|
|
|
|
|
|||||||||||||
| Atrenta, Inc. |
Software | Preferred Stock | Series D | 297,477 | 250 | 474 | ||||||||||||
|
|
|
|
|
|
|
|||||||||||||
| Total Atrenta, Inc. |
297,477 | 250 | 474 | |||||||||||||||
| Total Equity Software (0.11%)* |
297,477 | 250 | 474 | |||||||||||||||
|
|
|
|
|
|
|
|||||||||||||
| Maxvision Holding, LLC.(7) |
Electronics & Computer Hardware |
Common Stock | 3,581,329 | 3,581 | — | |||||||||||||
|
|
|
|
|
|
|
|||||||||||||
| Total Maxvision Holding, LLC |
3,581,329 | 3,581 | — | |||||||||||||||
| Spatial Photonics, Inc.(8) |
Electronics & Computer Hardware |
Preferred Stock | Series D | 4,717,813 | 268 | — | ||||||||||||
|
|
|
|
|
|
|
|||||||||||||
| Total Spatial Photonics Inc. |
4,717,813 | 268 | — | |||||||||||||||
| Total Equity Electronics & Computer Hardware (0.00%)* |
8,299,142 | 3,849 | — | |||||||||||||||
|
|
|
|
|
|
|
|||||||||||||
| Quatrx Pharmaceuticals Company |
Specialty Pharmaceuticals |
Preferred Stock | Series E | 166,419 | 750 | — | ||||||||||||
|
|
|
|
|
|
|
|||||||||||||
| Total Quatrx Pharmaceuticals Company |
166,419 | 750 | — | |||||||||||||||
| Total Equity Specialty Pharmaceuticals (0.00%)* |
166,419 | 750 | — | |||||||||||||||
|
|
|
|
|
|
|
|||||||||||||
See notes to consolidated financial statements.
142
Table of Contents
HERCULES TECHNOLOGY GROWTH CAPITAL, INC.
CONSOLIDATED SCHEDULE OF INVESTMENTS
December 31, 2011
(dollars in thousands)
| Portfolio Company |
Industry | Type of Investment(1) |
Series | Shares | Cost(2) | Value(3) | ||||||||||||
| IPA Holdings, LLC |
Consumer & Business Products |
Preferred Stock | LLC Interest |
500,000 | $ | 500 | $ | 360 | ||||||||||
|
|
|
|
|
|
|
|||||||||||||
| Total IPA Holding, LLC |
500,000 | 500 | 360 | |||||||||||||||
| Market Force Information, Inc. |
Consumer & Business Products |
Preferred Stock | Series B | 187,970 | 500 | 491 | ||||||||||||
|
|
|
|
|
|
|
|||||||||||||
| Total Market Force Information, Inc. |
187,970 | 500 | 491 | |||||||||||||||
| Caivis Acquisition Corporation |
Consumer & Business Products |
Common Stock | 317,893 | 880 | — | |||||||||||||
|
|
|
|
|
|
|
|||||||||||||
| Total Caivis Acquisition Corporation |
317,893 | 880 | — | |||||||||||||||
| Wageworks, Inc. |
Consumer & Business Products |
Preferred Stock | Series D | 38,520 | 250 | 388 | ||||||||||||
|
|
|
|
|
|
|
|||||||||||||
| Total Wageworks, Inc. |
38,520 | 250 | 388 | |||||||||||||||
| Total Equity Consumer & Business Products (0.29%)* |
1,044,383 | 2,130 | 1,239 | |||||||||||||||
|
|
|
|
|
|
|
|||||||||||||
| iWatt, Inc. |
Semiconductors | Preferred Stock | Series E | 2,412,864 | 490 | 984 | ||||||||||||
|
|
|
|
|
|
|
|||||||||||||
| Total iWatt, Inc. |
2,412,864 | 490 | 984 | |||||||||||||||
| NEXX Systems, Inc. |
Semiconductors | Preferred Stock | Series D | 1,273,392 | 277 | 802 | ||||||||||||
|
|
|
|
|
|
|
|||||||||||||
| Total NEXX Systems, Inc. |
1,273,392 | 277 | 802 | |||||||||||||||
| Total Equity Semiconductors (0.41%)* |
3,686,256 | 767 | 1,786 | |||||||||||||||
|
|
|
|
|
|
|
|||||||||||||
| BARRX Medical, Inc. |
Therapeutic | Preferred Stock | Series C | 750,000 | 1,500 | 3,628 | ||||||||||||
|
|
|
|
|
|
|
|||||||||||||
| Total BARRX Medical, Inc. |
750,000 | 1,500 | 3,628 | |||||||||||||||
| Gelesis |
Therapeutic | Common Stock | 674,208 | — | 108 | |||||||||||||
| Preferred Stock | Series A-1 | 674,208 | 425 | 519 | ||||||||||||||
| Preferred Stock | Series A-2 | 675,676 | 500 | 520 | ||||||||||||||
|
|
|
|
|
|
|
|||||||||||||
| Total Gelesis |
2,024,092 | 925 | 1,147 | |||||||||||||||
| Gynesonics, Inc |
Therapeutic | Preferred Stock | Series B | 219,298 | 250 | 156 | ||||||||||||
| Gynesonics, Inc |
Preferred Stock | Series C | 656,512 | 283 | 295 | |||||||||||||
|
|
|
|
|
|
|
|||||||||||||
| Total Gynesonics, Inc |
875,810 | 533 | 451 | |||||||||||||||
| Novasys Medical, Inc. |
Therapeutic | Preferred Stock | Series D-1 | 4,118,444 | 1,000 | 799 | ||||||||||||
|
|
|
|
|
|
|
|||||||||||||
| Total Novasys Medical, Inc. |
4,118,444 | 1,000 | 799 | |||||||||||||||
| Total Equity Therapeutic (1.40%)* |
7,768,346 | 3,958 | 6,025 | |||||||||||||||
|
|
|
|
|
|
|
|||||||||||||
See notes to consolidated financial statements.
143
Table of Contents
HERCULES TECHNOLOGY GROWTH CAPITAL, INC.
CONSOLIDATED SCHEDULE OF INVESTMENTS
December 31, 2011
(dollars in thousands)
| Portfolio Company |
Industry | Type of Investment(1) |
Series | Shares | Cost(2) | Value(3) | ||||||||||||
| Cozi Group, Inc. |
Internet Consumer & Business Services |
Preferred Stock | Series B | 218,251 | $ | 177 | $ | 44 | ||||||||||
|
|
|
|
|
|
|
|||||||||||||
| Total Cozi Group, Inc. |
218,251 | 177 | 44 | |||||||||||||||
| RazorGator Interactive Group, Inc. |
Internet Consumer & Business Services |
Preferred Stock | Series A | 347,827 | 1,000 | — | ||||||||||||
|
|
|
|
|
|
|
|||||||||||||
| Total RazorGator Interactive Group, Inc. |
347,827 | 1,000 | — | |||||||||||||||
| Total Equity Internet Consumer & Business Services (0.01%) |
566,078 | 1,177 | 44 | |||||||||||||||
|
|
|
|
|
|
|
|||||||||||||
| Box.net, Inc. |
Information | Preferred Stock | Series C | 390,625 | 500 | 3,543 | ||||||||||||
| Services | Preferred Stock | Series D | 282,638 | 1,500 | 2,564 | |||||||||||||
|
|
|
|
|
|
|
|||||||||||||
| Total Box.net, Inc. |
673,263 | 2,000 | 6,107 | |||||||||||||||
| Buzznet, Inc. |
Information Services |
Preferred Stock | Series C | 263,158 | 250 | 26 | ||||||||||||
|
|
|
|
|
|
|
|||||||||||||
| Total Buzznet, Inc. |
263,158 | 250 | 26 | |||||||||||||||
| Magi.com (pka Hi5 Networks, Inc.) |
Information Services |
Preferred Stock | Series C | 8,232,092 | 250 | 247 | ||||||||||||
|
|
|
|
|
|
|
|||||||||||||
| Total Magi.com |
8,232,092 | 250 | 247 | |||||||||||||||
| Solutionary, Inc. |
Information Services |
Preferred Stock | Series E | 50,505 | 250 | 55 | ||||||||||||
|
|
|
|
|
|
|
|||||||||||||
| Total Solutionary, Inc. |
50,505 | 250 | 55 | |||||||||||||||
| Good Technologies, Inc. (Visto Inter) |
Information Services |
Common Stock | 500,000 | 603 | 90 | |||||||||||||
|
|
|
|
|
|
|
|||||||||||||
| Total Good Technologies, Inc. |
500,000 | 603 | 90 | |||||||||||||||
| Zeta Interactive Corporation |
Information Services |
Preferred Stock | Series A | 500,000 | 500 | 629 | ||||||||||||
|
|
|
|
|
|
|
|||||||||||||
| Total Zeta Interactive Corporation |
500,000 | 500 | 629 | |||||||||||||||
| Total Equity Information Services (1.66%) |
10,219,018 | 3,853 | 7,154 | |||||||||||||||
|
|
|
|
|
|
|
|||||||||||||
| Novadaq Technologies, Inc.(5) |
Diagnostic | Common Stock | 136,983 | 1,057 | 671 | |||||||||||||
|
|
|
|
|
|
|
|||||||||||||
| Total Novadaq Technologies, Inc. (5) |
136,983 | 1,057 | 671 | |||||||||||||||
| Optiscan Biomedical, Corp. |
Diagnostic | Preferred Stock | Series B | 6,185,567 | 655 | 711 | ||||||||||||
| Preferred Stock | Series C | 1,927,309 | 3,000 | 1,757 | ||||||||||||||
|
|
|
|
|
|
|
|||||||||||||
See notes to consolidated financial statements.
144
Table of Contents
HERCULES TECHNOLOGY GROWTH CAPITAL, INC.
CONSOLIDATED SCHEDULE OF INVESTMENTS
December 31, 2011
(dollars in thousands)
| Portfolio Company |
Industry | Type of Investment(1) |
Series | Shares | Cost(2) | Value(3) | ||||||||||||
| Total Optiscan Biomedical, Corp. |
8,112,876 | $ | 3,655 | $ | 2,468 | |||||||||||||
| Total Equity Diagnostic (0.73%)* |
8,249,859 | 4,712 | 3,139 | |||||||||||||||
|
|
|
|
|
|
|
|||||||||||||
| Kamada, LTD. |
Biotechnology Tools |
Common Stock | 71,490 | 427 | 384 | |||||||||||||
|
|
|
|
|
|
|
|||||||||||||
| Total Kamada, LTD. |
71,490 | 427 | 384 | |||||||||||||||
| NuGEN Technologies, Inc. |
Biotechnology Tools |
Preferred Stock | Series C | 189,394 | 500 | 473 | ||||||||||||
|
|
|
|
|
|
|
|||||||||||||
| Total NuGEN Technologies, Inc. |
189,394 | 500 | 473 | |||||||||||||||
| Total Equity Biotechnology Tools (0.20%)* |
260,884 | 927 | 857 | |||||||||||||||
|
|
|
|
|
|
|
|||||||||||||
| Transmedics, Inc. (4) |
Surgical Devices |
Preferred Stock | Series C | 119,999 | 300 | — | ||||||||||||
| Preferred Stock | Series D | 88,961 | 1,100 | |||||||||||||||
|
|
|
|
|
|
|
|||||||||||||
| Total Transmedics, Inc. |
208,960 | 1,400 | — | |||||||||||||||
| Total Equity Surgical Devices (0.00%)* |
208,960 | 1,400 | — | |||||||||||||||
|
|
|
|
|
|
|
|||||||||||||
| Everyday Health, Inc. (Waterfront Media, Inc.) |
Media/ Content/ Info |
Preferred Stock | Series D | 145,590 | 1,000 | 1,196 | ||||||||||||
|
|
|
|
|
|
|
|||||||||||||
| Total Everyday Health |
145,590 | 1,000 | 1,196 | |||||||||||||||
| Total Equity Media/Content/Info (0.28%)* |
145,590 | 1,000 | 1,196 | |||||||||||||||
|
|
|
|
|
|
|
|||||||||||||
| Total Equity (8.60%) |
|
38,241 | 37,058 | |||||||||||||||
|
|
|
|
|
|||||||||||||||
| Total Investments (151.47%) |
|
$ | 656,540 | $ | 652,870 | |||||||||||||
|
|
|
|
|
|||||||||||||||
| * | Value as a percent of net assets |
| (1) | Preferred and common stock, warrants, and equity interests are generally non-income producing. |
| (2) | Gross unrealized appreciation, gross unrealized depreciation, and net depreciation for federal income tax purposes totaled $34,519, $39,387 and $4,868 respectively. The tax cost of investments is $658,010 |
| (3) | Except for warrants in thirteen publicly traded companies and common stock in five publicly traded companies, all investments are restricted at December 31, 2011 and were valued at fair value as determined in good faith by the Board of Directors. No unrestricted securities of the same issuer are outstanding. The Company uses the Standard Industrial Code for classifying the industry grouping of its portfolio companies. |
| (4) | Debt investments of this portfolio company have been pledged as collateral under the Wells Facility. |
| (5) | Non-U.S. company or the company’s principal place of business is outside the United States. |
| (6) | Affiliate investment that is defined under the Investment Company Act of 1940 as companies in which HTGC owns as least 5% but not more than 25% of the voting securities of the company. |
| (7) | Control investment that is defined under the Investment Company Act of 1940 as companies in which HTGC owners as least 25% but not more than 50% of the voting securities of the company |
| (8) | Debt is on non-accrual status at December 31, 2011, and is therefore considered non-income producing. |
See notes to consolidated financial statements.
145
Table of Contents
HERCULES TECHNOLOGY GROWTH CAPITAL, INC.
CONSOLIDATED STATEMENTS OF OPERATIONS
(in thousands, except per share data)
| For the Years Ended December 31, |
||||||||||||
| (Dollars in thousands, except per share data) |
2012 | 2011 | 2010 | |||||||||
| Investment Income: |
||||||||||||
| Interest income |
||||||||||||
| Non Control/Non Affliate investments |
$ | 85,258 | $ | 69,552 | $ | 51,417 | ||||||
| Affliate investments |
2,345 | — | — | |||||||||
| Control investments. |
— | 794 | 3,283 | |||||||||
|
|
|
|
|
|
|
|||||||
| Total interest income |
87,603 | 70,346 | 54,700 | |||||||||
|
|
|
|
|
|
|
|||||||
| Fees |
||||||||||||
| Non Control/Non Affliate investments |
9,897 | 9,400 | 5,045 | |||||||||
| Affliate investments |
20 | 14 | — | |||||||||
| Control investments |
— | 95 | (271 | ) | ||||||||
|
|
|
|
|
|
|
|||||||
| Total fees |
9,917 | 9,509 | 4,774 | |||||||||
|
|
|
|
|
|
|
|||||||
| Total investment income |
97,520 | 79,855 | 59,474 | |||||||||
| Operating expenses: |
||||||||||||
| Interest |
19,835 | 13,252 | 8,572 | |||||||||
| Loan fees |
3,917 | 2,635 | 1,259 | |||||||||
| General and administrative |
8,108 | 7,992 | 7,086 | |||||||||
| Employee Compensation: |
||||||||||||
| Compensation and benefits |
13,326 | 13,260 | 10,474 | |||||||||
| Stock-based compensation |
4,227 | 3,128 | 2,709 | |||||||||
|
|
|
|
|
|
|
|||||||
| Total employee compensation |
17,553 | 16,388 | 13,183 | |||||||||
|
|
|
|
|
|
|
|||||||
| Total operating expenses |
49,413 | 40,267 | 30,100 | |||||||||
|
|
|
|
|
|
|
|||||||
| Net investment income |
48,107 | 39,588 | 29,374 | |||||||||
| Net realized gains (losses) on invesmtents |
||||||||||||
| Non Control/Non Affliate investments |
3,168 | 2,741 | (28,873 | ) | ||||||||
| Control investments |
— | — | 2,491 | |||||||||
|
|
|
|
|
|
|
|||||||
| Total net realized (loss) gain on investments |
3,168 | 2,741 | (26,382 | ) | ||||||||
|
|
|
|
|
|
|
|||||||
| Net increase (decrease) in unrealized appreciation on investments |
||||||||||||
| Non Control/Non Affliate investments |
(2,448 | ) | (3,976 | ) | 1,118 | |||||||
| Affliate investments |
(2,068 | ) | 3,425 | 795 | ||||||||
| Control investments |
— | 5,158 | 77 | |||||||||
|
|
|
|
|
|
|
|||||||
| Total net unrealized (depreciation) appreciation on investments |
(4,516 | ) | 4,607 | 1,990 | ||||||||
|
|
|
|
|
|
|
|||||||
| Total net realized and unrealized gain (loss) |
(1,348 | ) | 7,348 | (24,392 | ) | |||||||
|
|
|
|
|
|
|
|||||||
| Net increase in net assets resulting from operations |
$ | 46,759 | $ | 46,936 | $ | 4,982 | ||||||
|
|
|
|
|
|
|
|||||||
| Net investment income and investment gains and losses per common share: |
||||||||||||
| Basic |
$ | 0.96 | $ | 0.91 | $ | 0.80 | ||||||
|
|
|
|
|
|
|
|||||||
| Change in net assets per common share: |
||||||||||||
| Basic |
$ | 0.93 | $ | 1.08 | $ | 0.12 | ||||||
|
|
|
|
|
|
|
|||||||
| Diluted |
$ | 0.93 | $ | 1.07 | $ | 0.12 | ||||||
|
|
|
|
|
|
|
|||||||
| Weighted average shares outstanding |
||||||||||||
| Basic |
49,068 | 42,988 | 36,156 | |||||||||
|
|
|
|
|
|
|
|||||||
| Diluted |
49,156 | 43,299 | 36,870 | |||||||||
|
|
|
|
|
|
|
|||||||
See notes to consolidated financial statements.
146
Table of Contents
HERCULES TECHNOLOGY GROWTH CAPITAL, INC.
CONSOLIDATED STATEMENTS OF CHANGES IN NET ASSETS
(in thousands)
| Common Stock | Capital in excess of par value |
Unrealized Appreciation on Investments |
Accumulated Realized Gains (Losses) on Investments |
Distributions from Net Investment Income |
Provision for Income Taxes on Investment Gains |
Net Assets |
||||||||||||||||||||||||||
| Shares | Par Value | |||||||||||||||||||||||||||||||
| Balance at January 1, 2010 |
35,634 | $ | 35 | $ | 409,036 | $ | (10,028 | ) | $ | (28,129 | ) | $ | (4,057 | ) | $ | (342 | ) | $ | 366,515 | |||||||||||||
| Net increase in net assets resulting from operations |
— | — | — | 1,990 | (26,382 | ) | 29,374 | — | 4,982 | |||||||||||||||||||||||
| Issuance of common stock |
531 | 1 | 2,661 | — | — | — | — | 2,662 | ||||||||||||||||||||||||
| Issuance of common stock under restricted stock plan |
485 | — | — | — | — | — | — | — | ||||||||||||||||||||||||
| Acquisition of common stock under repurchase plan |
(403 | ) | — | (3,699 | ) | — | — | — | — | (3,699 | ) | |||||||||||||||||||||
| Issuance of common stock under dividend reinvestment plan |
199 | — | 1,927 | — | — | — | — | 1,927 | ||||||||||||||||||||||||
| Retired shares from net issuance |
(189 | ) | — | (1,934 | ) | — | — | — | — | (1,934 | ) | |||||||||||||||||||||
| Public Offering |
7,187 | 7 | 68,097 | — | — | — | — | 68,104 | ||||||||||||||||||||||||
| Dividends declared |
— | — | — | — | — | (28,816 | ) | — | (28,816 | ) | ||||||||||||||||||||||
| Stock-based compensation |
— | — | 2,790 | — | — | — | — | 2,790 | ||||||||||||||||||||||||
| Tax Reclassification of stockholders’ equity in accordance with generally accepted accounting principles |
— | — | (1,329 | ) | — | 3,478 | (2,149 | ) | — | — | ||||||||||||||||||||||
|
|
|
|
|
|
|
|
|
|
|
|
|
|
|
|
|
|||||||||||||||||
| Balance at December 31, 2010 |
43,444 | $ | 43 | $ | 477,549 | $ | (8,038 | ) | $ | (51,033 | ) | $ | (5,648 | ) | $ | (342 | ) | $ | 412,531 | |||||||||||||
|
|
|
|
|
|
|
|
|
|
|
|
|
|
|
|
|
|||||||||||||||||
| Net increase in net assets resulting from operations |
— | $ | — | $ | — | $ | 4,607 | $ | 2,741 | $ | 39,588 | $ | — | $ | 46,936 | |||||||||||||||||
| Issuance of common stock |
188 | 1 | 981 | — | — | — | — | 982 | ||||||||||||||||||||||||
| Issuance of common stock under restricted stock plan |
140 | — | — | — | — | — | — | — | ||||||||||||||||||||||||
| Issuance of common stock as stock dividend |
167 | — | 1,649 | — | — | — | — | 1,649 | ||||||||||||||||||||||||
| Retired shares from net issuance |
(86 | ) | — | (952 | ) | — | — | — | — | (952 | ) | |||||||||||||||||||||
| Issuance of the Convertible Senior Notes (see Note 4) |
— | — | 5,190 | — | — | — | — | 5,190 | ||||||||||||||||||||||||
| Dividends declared |
— | — | — | — | — | (38,490 | ) | — | (38,490 | ) | ||||||||||||||||||||||
| Stock-based compensation |
— | — | 3,195 | — | — | — | — | 3,195 | ||||||||||||||||||||||||
| Tax Reclassification of stockholders’ equity in accordance with generally accepted accounting principles |
— | — | (3,368 | ) | — | 5,250 | (1,882 | ) | — | — | ||||||||||||||||||||||
|
|
|
|
|
|
|
|
|
|
|
|
|
|
|
|
|
|||||||||||||||||
| Balance at December 31, 2011 |
43,853 | $ | 44 | $ | 484,244 | $ | (3,431 | ) | $ | (43,042 | ) | $ | (6,432 | ) | $ | (342 | ) | $ | 431,041 | |||||||||||||
|
|
|
|
|
|
|
|
|
|
|
|
|
|
|
|
|
|||||||||||||||||
| Net increase in net assets resulting from operations |
— | $ | — | $ | — | $ | (4,516 | ) | $ | 3,168 | $ | 48,107 | $ | — | $ | 46,759 | ||||||||||||||||
| Issuance of common stock |
578 | 1 | 3,287 | — | — | — | — | 3,288 | ||||||||||||||||||||||||
| Issuance of common stock under restricted stock plan |
505 | — | — | — | — | — | — | — | ||||||||||||||||||||||||
| Issuance of common stock as stock dividend |
219 | — | 2,305 | — | — | — | — | 2,305 | ||||||||||||||||||||||||
| Retired shares from net issuance |
(330 | ) | — | (4,625 | ) | — | — | — | — | (4,625 | ) | |||||||||||||||||||||
| Public Offering |
8,100 | 8 | 80,872 | — | — | — | — | 80,880 | ||||||||||||||||||||||||
| Dividends declared |
— | — | — | — | — | (47,983 | ) | — | (47,983 | ) | ||||||||||||||||||||||
| Stock-based compensation |
— | — | 4,303 | — | — | — | — | 4,303 | ||||||||||||||||||||||||
| Tax Reclassification of stockholders’ equity in accordance with generally accepted accounting principles |
— | — | (5,878 | ) | — | 2,958 | 2,920 | — | — | |||||||||||||||||||||||
|
|
|
|
|
|
|
|
|
|
|
|
|
|
|
|
|
|||||||||||||||||
| Balance at December 31, 2012 |
52,925 | $ | 53 | $ | 564,508 | $ | (7,947 | ) | $ | (36,916 | ) | $ | (3,388 | ) | $ | (342 | ) | $ | 515,968 | |||||||||||||
|
|
|
|
|
|
|
|
|
|
|
|
|
|
|
|
|
|||||||||||||||||
See notes to consolidated financial statements.
147
Table of Contents
HERCULES TECHNOLOGY GROWTH CAPITAL, INC.
CONSOLIDATED STATEMENTS OF CASH FLOWS
(in thousands)
| For the Years Ended December 31, |
||||||||||||
| 2012 | 2011 | 2010 | ||||||||||
| Cash flows from operating activities: |
||||||||||||
| Net increase in net assets resulting from operations |
$ | 46,759 | $ | 46,936 | $ | 4,982 | ||||||
| Adjustments to reconcile net increase in net assets resulting from operations to net cash used in and provided by operating activities: |
||||||||||||
| Purchase of investments |
(507,098 | ) | (445,066 | ) | (322,331 | ) | ||||||
| Principal payments received on investments |
245,777 | 247,325 | 196,119 | |||||||||
| Proceeds from sale of investments |
25,948 | 17,733 | 7,613 | |||||||||
| Net unrealized (appreciation) / depreciation on investments |
4,516 | (4,607 | ) | (1,990 | ) | |||||||
| Net realized (gain) / loss on investments |
(3,048 | ) | (2,741 | ) | 26,382 | |||||||
| Net unrealized appreication due to lender |
— | — | (13 | ) | ||||||||
| Accretion of paid-in-kind principal |
(1,400 | ) | (1,943 | ) | (3,246 | ) | ||||||
| Accretion of loan discounts |
(5,441 | ) | (6,999 | ) | (4,526 | ) | ||||||
| Accretion of loan discount on Convertible Senior Notes |
1,083 | 767 | — | |||||||||
| Accretion of loan exit fees |
(3,986 | ) | (94 | ) | 437 | |||||||
| Change in deferred loan origination revenue |
2,301 | 2,420 | 4,013 | |||||||||
| Unearned fees related to unfunded commitments |
(1,900 | ) | 615 | 172 | ||||||||
| Amortization of debt fees and issuance costs |
1,560 | 1,688 | 539 | |||||||||
| Depreciation |
289 | 348 | 400 | |||||||||
| Stock-based compensation and amortization of restricted stock grants |
4,303 | 3,195 | 2,790 | |||||||||
| Common stock issued in lieu of Director compensation |
— | — | 105 | |||||||||
| Change in operating assets and liabilities: |
||||||||||||
| Interest and fees receivable |
(3,815 | ) | (1,300 | ) | (1,200 | ) | ||||||
| Prepaid expenses and other assets |
(988 | ) | 318 | (276 | ) | |||||||
| Accounts payable |
279 | (563 | ) | 350 | ||||||||
| Income tax receivable / (payable) |
— | — | (41 | ) | ||||||||
| Accrued liabilities |
926 | 2,443 | (3,529 | ) | ||||||||
|
|
|
|
|
|
|
|||||||
| Net cash used in operating activities |
(193,935 | ) | (139,525 | ) | (93,250 | ) | ||||||
| Cash flows from investing activities: |
||||||||||||
| Purchases of capital equipment |
(87 | ) | (189 | ) | (244 | ) | ||||||
| Other long-term assets |
— | (25 | ) | 350 | ||||||||
|
|
|
|
|
|
|
|||||||
| Net cash provided by / (used in) investing activities |
(87 | ) | (214 | ) | 106 | |||||||
| Cash flows from financing activities: |
||||||||||||
| Proceeds from issuance of common stock, net |
79,647 | 30 | 68,727 | |||||||||
| Stock repurchase program |
— | — | (3,699 | ) | ||||||||
| Dividends paid |
(45,678 | ) | (36,843 | ) | (26,889 | ) | ||||||
| Borrowings of credit facilities |
64,000 | 92,500 | 39,400 | |||||||||
| Repayments of credit facilities |
(74,228 | ) | (27,313 | ) | — | |||||||
| Issuance of Convertible Senior Notes |
— | 75,000 | — | |||||||||
| Issuance of 2019 Notes Payable |
170,365 | — | — | |||||||||
| Issuance of Asset-Backed Notes |
129,300 | — | — | |||||||||
| Cash paid for debt issuance costs |
(10,864 | ) | (3,110 | ) | — | |||||||
| Fees paid for credit facilities and debentures |
— | (3,065 | ) | (2,209 | ) | |||||||
|
|
|
|
|
|
|
|||||||
| Net cash provided by financing activities |
312,542 | 97,199 | 75,330 | |||||||||
|
|
|
|
|
|
|
|||||||
| Net increase / (decrease) in cash |
118,520 | (42,540 | ) | (17,814 | ) | |||||||
| Cash and cash equivalents at beginning of year |
64,474 | 107,014 | 124,828 | |||||||||
|
|
|
|
|
|
|
|||||||
| Cash and cash equivalents at end of year |
$ | 182,994 | $ | 64,474 | $ | 107,014 | ||||||
|
|
|
|
|
|
|
|||||||
| Supplemental disclosures: |
||||||||||||
| Interest paid |
$ | 18,928 | $ | 11,270 | $ | 8,274 | ||||||
| Income taxes paid |
$ | 44 | $ | 66 | $ | 39 | ||||||
| Stock divided |
$ | 2,305 | $ | 1,649 | $ | 1,927 | ||||||
See notes to consolidated financial statements.
148
Table of Contents
NOTES TO CONSOLIDATED FINANCIAL STATEMENTS
1. Description of Business and Basis of Presentation
Hercules Technology Growth Capital, Inc. (the “Company”) is a specialty finance company focused on providing senior secured loans to venture capital-backed companies in technology-related markets, including technology, biotechnology, life science, and clean-technology industries at all stages of development. The Company sources its investments through its principal office located in Silicon Valley, as well as through its additional offices in Boston, MA, Boulder, CO and McLean, VA. The Company was incorporated under the General Corporation Law of the State of Maryland in December 2003.
The Company is an internally managed, non-diversified closed-end investment company that has elected to be regulated as a business development company (“BDC”) under the Investment Company Act of 1940, as amended (the “1940 Act”). From incorporation through December 31, 2005, the Company was taxed as a corporation under Subchapter C of the Internal Revenue Code of 1986, (the “Code”). Effective January 1, 2006, the Company has elected to be treated for tax purposes as a regulated investment company, or RIC, under the Code (see Note 5).
Hercules Technology II, L.P. (“HT II”), Hercules Technology III, L.P. (“HT III”), and Hercules Technology IV, L.P. (“HT IV”), are Delaware limited partnerships that were formed in January 2005, September 2009 and December 2010, respectively. HT II and HT III were licensed to operate as small business investment companies (“SBICs”), under the authority of the Small Business Administration (“SBA”), on September 27, 2006 and May 26, 2010, respectively. As SBICs, HT II and HT III are subject to a variety of regulations concerning, among other things, the size and nature of the companies in which they may invest and the structure of those investments. The Company also formed Hercules Technology SBIC Management, LLC, or (“HTM”), a limited liability company in November 2003. HTM is a wholly owned subsidiary of the Company and serves as the limited partner and general partner of HT II and HT III (see Note 4).
HT II and HT III hold approximately $154.4 million and $250.8 million in assets, respectively, and accounted for approximately 10.5% and 17.0% of our total assets prior to consolidation at December 31, 2012.
The Company also established wholly owned subsidiaries, all of which are structured as Delaware corporations and limited liability companies, to hold portfolio companies organized as limited liability companies, or LLCs (or other forms of pass-through entities). The Company currently qualifies as a RIC for federal income tax purposes, which allows the Company to avoid paying corporate income taxes on any income or gains that the Company distributes to our stockholders. The purpose of establishing these entities is to satisfy the RIC tax requirement that at least 90% of the Company’s gross income for income tax purposes is investment income.
2. Summary of Significant Accounting Policies
Principles of Consolidation
The Consolidated Financial Statements include the accounts of the Company and its subsidiaries and all variable interest entities of which we are the primary beneficiary. All intercompany accounts and transactions have been eliminated in consolidation.
A VIE is an entity that either (i) has insufficient equity to permit the entity to finance its activities without additional subordinated financial support or (ii) has equity investors who lack the characteristics of a controlling financial interest. The primary beneficiary of a VIE is the party with both the power to direct the activities of the VIE that most significantly impact the VIE’s economic performance and the obligation to absorb the losses or the right to receive benefits that could potentially be significant to the VIE.
149
Table of Contents
To assess whether the Company has the power to direct the activities of a VIE that most significantly impact its economic performance, the Company considers all the facts and circumstances including its role in establishing the VIE and its ongoing rights and responsibilities. This assessment includes identifying the activities that most significantly impact the VIE’s economic performance and identifying which party, if any, has power over those activities. In general, the party that makes the most significant decisions affecting the VIE is determined to have the power to direct the activities of a VIE. To assess whether the Company has the obligation to absorb the losses or the right to receive benefits that could potentially be significant to the VIE, the Company considers all of its economic interests, including debt and equity interests, servicing rights and fee arrangements, and any other variable interests in the VIE. If the Company determines that it is the party with the power to make the most significant decisions affecting the VIE, and the Company has a potentially significant interest in the VIE, then its consolidates the VIE.
The Company performs ongoing reassessments, usually quarterly, of whether it is the primary beneficiary of a VIE. The reassessment process considers whether the Company has acquired or divested the power to direct the activities of the VIE through changes in governing documents or other circumstances. The Company also reconsiders whether entities previously determined not to be VIEs have become VIEs, based on certain events, and therefore are subject to the VIE consolidation framework.
Valuation of Investments
The Company’s investments are carried at fair value in accordance with the 1940 Act and Accounting Standards Codification (“ASC”) topic 820 Fair Value Measurements and Disclosures (formerly known as SFAS No. 157, Fair Value Measurements). At December 31, 2012, 80.7% of the Company’s total assets represented investments in portfolio companies that are valued at fair value by the Board of Directors. Value, as defined in Section 2(a)(41) of the 1940 Act, is (i) the market price for those securities for which a market quotation is readily available and (ii) for all other securities and assets, fair value is as determined in good faith by the Board of Directors. The Company’s debt securities are primarily invested in venture capital-backed companies in technology-related markets, including technology, biotechnology, life science and clean technology industries. Given the nature of lending to these types of businesses, the Company’s investments in these portfolio companies are considered Level 3 assets under ASC 820 because there is no known or accessible market or market indexes for these investment securities to be traded or exchanged. As such, the Company values substantially all of its investments at fair value as determined in good faith pursuant to a consistent valuation policy and the Company’s Board of Directors in accordance with the provisions of ASC 820 and the 1940 Act. Due to the inherent uncertainty in determining the fair value of investments that do not have a readily available market value, the fair value of the Company’s investments determined in good faith by its Board may differ significantly from the value that would have been used had a readily available market existed for such investments, and the differences could be material.
Our Board of Directors may from time to time engage an independent valuation firm to provide the Company with valuation assistance with respect to certain of the Company’s portfolio investments on a quarterly basis. The Company intends to continue to engage an independent valuation firm to provide management with assistance regarding the Company’s determination of the fair value of selected portfolio investments each quarter unless directed by the Board of Directors to cancel such valuation services. The scope of services rendered by an independent valuation firm is at the discretion of the Board of Directors. The Company’s Board of Directors is ultimately and solely responsible for determining the fair value of the Company’s investments in good faith.
With respect to investments for which market quotations are not readily available or when such market quotations are deemed not to represent fair value, the Company’s Board of Directors has approved a multi-step valuation process each quarter, as described below:
(1) the Company’s quarterly valuation process begins with each portfolio company or investment being initially valued by the investment professionals responsible for the portfolio investment;
(2) preliminary valuation conclusions are then documented and business based assumptions are discussed with the Company’s investment committee;
150
Table of Contents
(3) the valuation committee of the Board of Directors reviews the preliminary valuation of the investment committee which incorporates the results of the independent valuation firm as appropriate;
(4) the Board of Directors discusses valuations and determines the fair value of each investment in our portfolio in good faith based on the input of, where applicable, the respective independent valuation firm and the valuation committee.
The Company adopted ASC 820 on January 1, 2008. ASC 820 establishes a framework for measuring the fair value of the assets and liabilities and outlines a fair value hierarchy which prioritizes the inputs used to measure fair value and the effect of fair value measures on earnings. ASC 820 also enhances disclosure requirements for fair value measurements based on the level within the hierarchy of the information used in the valuation. ASC 820 applies whenever other standards require (or permit) assets or liabilities to be measured at fair value but does not expand the use of fair value in any new circumstances. ASC 820 defines fair value as the price that would be received to sell an asset or paid to transfer a liability in an orderly transaction between market participants at the measurement date.
The Company has categorized all investments recorded at fair value in accordance with ASC 820 based upon the level of judgment associated with the inputs used to measure their fair value. Hierarchical levels, defined by ASC 820 and directly related to the amount of subjectivity associated with the inputs to fair valuation of these assets and liabilities, are as follows:
Level 1—Inputs are unadjusted, quoted prices in active markets for identical assets at the measurement date. The types of assets carried at Level 1 fair value generally are equities listed in active markets.
Level 2—Inputs (other than quoted prices included in Level 1) are either directly or indirectly observable for the asset in connection with market data at the measurement date and for the extent of the instrument’s anticipated life. Fair valued assets that are generally included in this category are warrants held in a public company.
Level 3—Inputs reflect management’s best estimate of what market participants would use in pricing the asset at the measurement date. It includes prices or valuations that require inputs that are both significant to the fair value measurement and unobservable. Generally, assets carried at fair value and included in this category are the debt investments and warrants and equities held in a private company.
151
Table of Contents
In accordance with ASU 2011-04, the following table provides quantitative information about the Company’s Level 3 fair value measurements of the Company’s investments as of December 31, 2012. In addition to the techniques and inputs noted in the table below, according to the Company’s valuation policy the Company may also use other valuation techniques and methodologies when determining the Company’s fair value measurements. The below table is not intended to be all-inclusive, but rather provides information on the significant Level 3 inputs as they relate to the Company’s fair value measurements.
| Investment Type - Level Three |
Fair Value at December 31, 2012 |
Valuation Techniques/ |
Unobservable Input(a) |
Range | ||||||
| (in thousands) | ||||||||||
| Pharmaceuticals—Debt | $266,978 | Market Comparable Companies Option Pricing Model(b) |
Hypothetical Market Yield Premium/(Discount) Average Industry Volatility(c) Risk Free Interest Rate Estimated Time to Exit |
12.83% - 16.11% (2.0%) - 1.0% 57.67% 0.190% 15.2 | ||||||
| Medical Devices—Debt | 46,022 | Market Comparable Companies | Hypothetical Market Yield Premium | 16.19% 0.0% - 1.0% | ||||||
| Technology—Debt | 159,341 | Market Comparable Companies Liquidation |
Hypothetical Market Yield Premium/(Discount) Investment Collateral |
12.36% - 20.49% (1.5%) - 1.0% $0 - $7.4 million | ||||||
| Clean Tech—Debt | 91,305 | Market Comparable Companies | Hypothetical Market Yield Premium | 12.69% 0% - 1.0% | ||||||
| Lower Middle Market—Debt | 263,894 | Market Comparable Companies Broker Quote(d) |
Hypothetical Market Yield Premium Price Quotes Market Comparable Index Yield Spreads Par Value |
10.75% - 16.25% 0.0% - 1.0% 78.0% -100% of par 4.33% - 5.93% $30.0 million | ||||||
|
|
|
|||||||||
| Total Level Three Debt Investments |
$827,540 | |||||||||
|
|
|
|||||||||
| (a) | The significant unobservable inputs used in the fair value measurement of our debt securities are hypothetical market yields and premiums/(discounts). The hypothetical market yield is defined as the exit price of an investment in a hypothetical market to hypothetical market participants where buyers and sellers are willing participants. The premiums (discounts) relate to company specific characteristics such as underlying investment performance, security liens, and other characteristics of the investment. Significant increases (decreases) in the inputs in isolation would result in a significantly lower (higher) fair value measurement, depending on the materiality of the investment. Debt investments in the industries noted in our Schedule of Investments are included in the industries note above as follows: |
| Pharmaceuticals, above, is comprised of debt investments in the Therapeutic, Specialty Pharmaceuticals, Drug Discovery and Development, Drug Delivery, and Diagnostics and Biotechnology industries in the Schedule of Investments. |
| Medical Devices, above, is comprised of debt investments in the Therapeutic, Surgical Devices, Medical Devices and Equipment and Biotechnology Tools industries in the Schedule of Investments. |
| Technology, above, is comprised of debt investments in the Software, Semiconductors, Internet Consumer and Business Services, Information Services, and Communications and Networking industries in the Schedule of Investments. |
| Lower Middle Market, above, is comprised of debt investments in the Communications and Networking, Electronics and Computer Hardware, Healthcare Services—Other, Information Services, Internet Consumer and Business Services, Media/Content/Info, and Specialty Pharmaceuticals industries in the Schedule of Investments. |
| Clean Tech, above, aligns with the Clean Tech Industry in the Schedule of Investments. |
| (b) | An option pricing model valuation technique was used to derive the fair value of the conversion feature of convertible notes. |
| (c) | Represents the range of industry volatility used by market participants when pricing the investment. |
| (d) | A broker quote valuation technique was used to derive the fair value of loans which are part of a syndicated facility. |
152
Table of Contents
| Investment
Type - Level Three |
Fair Value at December 31, 2012 |
Valuation
Techniques/ Methodologies |
Unobservable Input(a) |
Range | ||||||
| (in thousands) | ||||||||||
| Warrant and Equity positions |
$57,685 | Market Comparable Companies |
EBITDA Multiple(b) Revenue Multiple(b) Discount for Lack of Marketability(c) |
1.43x -20.68x 0.42x -16.98x 10.4% -25.2% | ||||||
| Warrant positions additionally subject to: |
Option Pricing Model | Average Industry Volatility(d) | 46.49% -141.2% | |||||||
| Risk-Free Interest Rate | 0.17% - 0.46% | |||||||||
| Estimated Time to Exit (in months) |
12 - 48 | |||||||||
|
|
|
|||||||||
| Total Level Three Warrant and Equity Investments |
$57,685 | |||||||||
|
|
|
|||||||||
| (a) | The significant unobservable inputs used in the fair value measurement of the Company’s warrant and equity-related securities are revenue and/or EBITDA multiples and discounts for lack of marketability. Additional inputs used in the Black Scholes option pricing model include industry volatility, risk free interest rate and estimated time to exit. Significant increases (decreases) in the inputs in isolation would result in a significantly higher (lower) fair value measurement, depending on the materiality of the investment. For some investments, additional consideration may be given to data from the last round of financing or merger/acquisition events near the measurement date. |
| (b) | Represents amounts used when the Company has determined that market participants would use such multiples when pricing the investments. |
| (c) | Represents amounts used when the Company has determined market participants would take into account these discounts when pricing the investments. |
| (d) | Represents the range of industry volatility used by market participants when pricing the investment. |
Debt Investments
The Company’s debt securities are primarily invested in venture capital-backed companies in technology-related markets, including technology, biotechnology, life science and clean technology industries. Given the nature of lending to these types of businesses, the Company’s investments in these portfolio companies are considered Level 3 assets under ASC 820 because there is no known or accessible market or market indexes for these investment securities to be traded or exchanged.
The Company applies a procedure that assumes a sale of investment in a hypothetical market to a hypothetical market participant where buyers and sellers are willing participants. The hypothetical market does not include scenarios where the underlying security was simply repaid or extinguished, but includes an exit concept. Under this process, the Company also evaluates the collateral for recoverability of the debt investments as well as applies all of its historical fair value analysis. The Company uses pricing on recently issued comparable debt securities to determine the baseline hypothetical market yields as of the measurement date. The Company considers each portfolio company’s credit rating, security liens and other characteristics of the investment to adjust the baseline yield to derive a hypothetical yield for each investment as of the measurement date. The anticipated future cash flows from each investment are then discounted at the hypothetical yield to estimate each investment’s fair value as of the measurement date.
The Company’s process includes, among other things, the underlying investment performance, the current portfolio company’s financial condition and market changing events that impact valuation, estimated remaining life, current market yield and interest rate spreads of similar securities as of the measurement date. The Company values its syndicated loans using broker quotes and bond indices amongst other factors. If there is a significant deterioration of the credit quality of a debt investment, the Company may consider other factors to estimate fair value, including the proceeds that would be received in a liquidation analysis.
The Company records unrealized depreciation on investments when it believes that an investment has decreased in value, including where collection of a loan is doubtful or if under the in exchange premise when the value of a debt security was to be less than amortized cost of the investment. Conversely, where appropriate, the
153
Table of Contents
Company records unrealized appreciation if it believes that the underlying portfolio company has appreciated in value and, therefore, that its investment has also appreciated in value or if under the in exchange premise the value of a debt security were to be greater than amortized cost.
When originating a debt instrument, the Company generally receives warrants or other equity-related securities from the borrower. The Company determines the cost basis of the warrants or other equity-related securities received based upon their respective fair values on the date of receipt in proportion to the total fair value of the debt and warrants or other equity-related securities received. Any resulting discount on the loan from recordation of the warrant or other equity instruments is accreted into interest income over the life of the loan.
Equity-Related Securities and Warrants
Securities that are traded in the over-the-counter markets or on a stock exchange will be valued at the prevailing bid price at period end. We have a limited number of equity securities in public companies. In accordance with the 1940 Act, unrestricted publicly traded securities for which market quotations are readily available are valued at the closing market quote on the measurement date.
The Company estimates the fair value of warrants using a Black Scholes pricing model. At each reporting date, privately held warrant and equity-related securities are valued based on an analysis of various factors including, but not limited to, the portfolio company’s operating performance and financial condition and general market conditions, price to enterprise value or price to equity ratios, discounted cash flow, valuation comparisons to comparable public companies or other industry benchmarks. When an external event occurs, such as a purchase transaction, public offering, or subsequent equity sale, the pricing indicated by that external event is utilized to corroborate the Company’s valuation of the warrant and equity-related securities. The Company periodically reviews the valuation of its portfolio companies that have not been involved in a qualifying external event to determine if the enterprise value of the portfolio company may have increased or decreased since the last valuation measurement date.
Investments measured at fair value on a recurring basis are categorized in the tables below based upon the lowest level of significant input to the valuations as of December 31, 2012 and as of December 31, 2011. We transfer investments in and out of Level 1, 2 and 3 securities as of the beginning balance sheet date, based on changes in the use of observable and unobservable inputs utilized to perform the valuation for the period. During the year ended December 31, 2012, there were no transfers in between Levels 1 or 2.
| 12/31/2012 | Investments at Fair Value as of December 31, 2012 | |||||||||||||||
| (in thousands) Description |
Quoted Prices In Active Markets For Identical Assets (Level 1) |
Significant
Other Observable Inputs (Level 2) |
Significant Unobservable Inputs (Level 3) |
|||||||||||||
| Senior secured debt |
$ | 827,540 | $ | — | $ | — | 827,540 | |||||||||
| Preferred stock |
33,889 | — | — | 33,889 | ||||||||||||
| Common stock |
15,321 | 13,665 | — | 1,656 | ||||||||||||
| Warrants |
29,550 | — | 7,410 | 22,140 | ||||||||||||
|
|
|
|
|
|
|
|
|
|||||||||
| $ | 906,300 | $ | 13,665 | $ | 7,410 | $ | 885,225 | |||||||||
|
|
|
|
|
|
|
|
|
|||||||||
| 12/31/2011 | Investments at Fair Value as of December 31, 2011 | |||||||||||||||
| (in thousands) Description |
Quoted Prices In Active Markets For Identical Assets (Level 1) |
Significant Other Observable Inputs (Level 2) |
Significant Unobservable Inputs (Level 3) |
|||||||||||||
| Senior secured debt |
$ | 585,767 | $ | — | $ | — | $ | 585,767 | ||||||||
| Preferred stock |
30,289 | — | — | 30,289 | ||||||||||||
| Common stock |
6,769 | 6,679 | — | 90 | ||||||||||||
| Warrants |
30,045 | — | 3,761 | 26,284 | ||||||||||||
|
|
|
|
|
|
|
|
|
|||||||||
| $ | 652,870 | $ | 6,679 | $ | 3,761 | $ | 642,430 | |||||||||
|
|
|
|
|
|
|
|
|
|||||||||
154
Table of Contents
The table below presents reconciliation for all financial assets and liabilities measured at fair value on a recurring basis, excluding accrued interest components, using significant unobservable inputs (Level 3) for the years ended December 31, 2012 and December 31, 2011.
| (in thousands) |
Balance, January 1, 2012 |
Net Realized Gains (losses)(1) |
Net change in unrealized appreciation or depreciation(2) |
Purchases | Sales | Repayments | Exit | Gross Transfers into Level 3(3) |
Gross Transfers out of Level 3(3) |
Balances, December 31, 2012 |
||||||||||||||||||||||||||||||
| Senior Debt |
$ | 585,767 | $ | (5,178 | ) | $ | (2,262 | ) | $ | 545,913 | $ | (2,000 | ) | $ | (294,294 | ) | $ | — | $ | (406 | ) | 827,540 | ||||||||||||||||||
| Preferred Stock |
30,289 | (733 | ) | 4,112 | 10,562 | (6,553 | ) | — | — | 356 | (4,144 | ) | 33,889 | |||||||||||||||||||||||||||
| Common Stock |
90 | (16 | ) | 5,523 | 9,558 | (45 | ) | — | — | — | (13,453 | ) | 1,656 | |||||||||||||||||||||||||||
| Warrants |
$ | 26,284 | 4,413 | (2,453 | ) | 7,362 | (9,211 | ) | — | — | — | (4,256 | ) | 22,140 | ||||||||||||||||||||||||||
|
|
|
|
|
|
|
|
|
|
|
|
|
|
|
|
|
|
|
|
|
|||||||||||||||||||||
| Total |
$ | 642,430 | $ | (1,514 | ) | $ | 4,920 | $ | 573,395 | $ | (17,809 | ) | $ | (294,294 | ) | $ | — | $ | 356 | $ | (22,259 | ) | $ | 885,225 | ||||||||||||||||
|
|
|
|
|
|
|
|
|
|
|
|
|
|
|
|
|
|
|
|
|
|||||||||||||||||||||
| (in thousands) |
Balance, January 1, 2011 |
Net Realized Gains (losses)(1) |
Net change in unrealized appreciation or depreciation(2) |
Purchases | Sales | Repayments | Exit | Gross Transfers into Level 3 |
Gross Transfers out of Level 3 |
Balances, December 31, 2011 |
||||||||||||||||||||||||||||||
| Senior Debt |
$ | 394,198 | $ | (4,301 | ) | $ | 9,050 | $ | 454,640 | $ | — | $ | (263,432 | ) | $ | — | $ | — | $ | (4,388 | ) | $ | 585,767 | |||||||||||||||||
| Subordinated Debt |
7,420 | — | — | — | — | (7,420 | ) | — | — | — | — | |||||||||||||||||||||||||||||
| Preferred Stock |
24,607 | (1,441 | ) | 838 | 1,860 | — | — | — | 4,425 | — | 30,289 | |||||||||||||||||||||||||||||
| Common Stock |
1,030 | — | (940 | ) | — | — | — | — | — | — | 90 | |||||||||||||||||||||||||||||
| Warrants |
17,401 | (1,054 | ) | 5,243 | 6,507 | (497 | ) | — | (51 | ) | — | (1,265 | ) | $ | 26,284 | |||||||||||||||||||||||||
|
|
|
|
|
|
|
|
|
|
|
|
|
|
|
|
|
|
|
|
|
|||||||||||||||||||||
| Total |
$ | 444,656 | $ | (6,796 | ) | $ | 14,191 | $ | 463,007 | $ | (497 | ) | $ | (270,852 | ) | $ | (51 | ) | $ | 4,425 | $ | (5,653 | ) | $ | 642,430 | |||||||||||||||
|
|
|
|
|
|
|
|
|
|
|
|
|
|
|
|
|
|
|
|
|
|||||||||||||||||||||
| (1) | Includes net realized gains (losses) recorded as realized gains or losses in the accompanying consolidated statements of operations. |
| (2) | Included in change in net unrealized appreciation or depreciation in the accompanying consolidated statements of operations. |
| (3) | Transfers in to Level 3 relate to the conversion of E-Band Communications, Inc. debt to equity. Transfers out of Level 3 relate to the respective initial public offerings of Annie’s, Inc., Cempra, Inc., Enphase Energy, Inc. Facebook, Inc., Merrimack Pharmaceuticals, Inc. Trulia, Inc. and WageWorks, Inc. to level 1. |
For the year ended December 31, 2012, approximately $3.8 million in unrealized appreciation and $2.2 million in unrealized depreciation was recorded for equity and warrant Level 3 investments, respectively, relating to assets still held at the reporting date. For the same period, approximately $2.3 million in unrealized depreciation was recorded for Level 3 debt investments relating to assets still held at the reporting date.
For the year ended December 31, 2011, approximately $9.1 million and $3.8 million in unrealized appreciation was recorded for debt and warrant Level 3 investments, respectively, relating to assets still held at the reporting date. For the same period, approximately $480,000 in unrealized depreciation was recorded for equity Level 3 investments relating to assets still held at the reporting date.
As required by the 1940 Act, the Company classifies its investments by level of control. “Control investments” are defined in the 1940 Act as investments in those companies that the Company is deemed to “control”. Generally, under the 1940 Act, the Company is deemed to “control” a company in which it has invested if it owns 25% or more of the voting securities of such company or has greater than 50% representation on its board. “Affiliate investments” are investments in those companies that are “affiliated companies” of the Company, as defined in the 1940 Act, which are not control investments. The Company is deemed to be an “affiliate” of a company in which it has invested if it owns 5% or more but less than 25% of the voting securities of such company. “Non-control/non-affiliate investments” are investments that are neither control investments nor affiliate investments.
155
Table of Contents
The following table summarizes our realized and unrealized gain and loss and changes in our unrealized appreciation anddepreciation on control and affiliate investments for the years ended December 31, 2012 and December 31, 2011:
| (in thousands) | Year Ended December 31, 2012 |
|||||||||||||||||||||
| Portfolio Company |
Type | Fair Value at December 31, 2012 |
Investment Income |
Unrealized (Depreciation)/ Appreciation |
Reversal
of Unrealized (Depreciation)/ Appreciation |
Realized Gain/(Loss) |
||||||||||||||||
| E-Band Communications, Corp |
Non-Controlled Affiliate | $ | — | $ | 4 | $ | 18 | $ | — | $ | — | |||||||||||
| Gelesis, Inc |
Non-Controlled Affiliate | 1,665 | 712 | (672 | ) | $ | — | $ | — | |||||||||||||
| Optiscan BioMedical, Corp |
Non-Controlled Affiliate | 10,207 | 1,649 | 2,722 | — | — | ||||||||||||||||
|
|
|
|
|
|
|
|
|
|
|
|||||||||||||
| Total |
$ | 11,872 | $ | 2,365 | $ | 2,068 | $ | — | $ | — | ||||||||||||
|
|
|
|
|
|
|
|
|
|
|
|||||||||||||
| (in thousands) | Year Ended December 31, 2011 |
|||||||||||||||||||||
| Portfolio Company |
Type | Fair Value at December 31, 2011 |
Investment Income |
Unrealized (Depreciation)/ Appreciation |
Reversal
of Unrealized (Depreciation)/ Appreciation |
Realized Gain/(Loss) |
||||||||||||||||
| MaxVision Holding, LLC |
Control | $ | 1,027 | $ | 889 | $ | (5,158 | ) | $ | — | $ | — | ||||||||||
| E-Band Communications, Corp |
Non-Controlled Affiliate | — | 14 | (3,425 | ) | — | — | |||||||||||||||
|
|
|
|
|
|
|
|
|
|
|
|||||||||||||
| Total |
$ | 1,027 | $ | 903 | $ | (8,583 | ) | $ | — | $ | — | |||||||||||
|
|
|
|
|
|
|
|
|
|
|
|||||||||||||
At December 31, 2012, the Company did not hold any Control Investments. The Company’s investment in MaxVision Holding, L.L.C., a company that was a Control Investment as of December 31, 2011, was liquidated during the year ended December 31, 2012. On July 31, 2012, the Company received payment of $2.0 million for its total debt investments in Maxvision Holding, L.L.C. Approximately $8.7 million of realized losses and $10.5 million of net change in unrealized appreciation was recognized on this control debt and equity investment during the year ended December 31, 2012.
A summary of the composition of the Company’s investment portfolio as of December 31, 2012 and December 31, 2011 at fair value is shown as follows:
| December 31, 2012 | December 31, 2011 | |||||||||||||||
| (in thousands) |
Investments at Fair Value |
Percentage of Total Portfolio |
Investments at Fair Value |
Percentage of
Total Portfolio |
||||||||||||
| Senior secured debt with warrants |
$ | 652,041 | 72.0 | % | $ | 482,268 | 73.9 | % | ||||||||
| Senior secured debt |
205,049 | 22.6 | % | 133,544 | 20.4 | % | ||||||||||
| Preferred stock |
33,885 | 3.7 | % | 30,181 | 4.6 | % | ||||||||||
| Common Stock |
15,325 | 1.7 | % | 6,877 | 1.1 | % | ||||||||||
|
|
|
|
|
|
|
|
|
|||||||||
| $ | 906,300 | 100.0 | % | $ | 652,870 | 100.0 | % | |||||||||
|
|
|
|
|
|
|
|
|
|||||||||
A summary of the Company’s investment portfolio, at value, by geographic location as of December 31, 2012 and as of December 31, 2011 is shown as follows:
| December 31, 2012 | December 31, 2011 | |||||||||||||||
| (in thousands) |
Investments at Fair Value |
Percentage of Total Portfolio |
Investments at Fair Value |
Percentage of Total Portfolio |
||||||||||||
| United States |
$ | 901,041 | 99.4 | % | $ | 634,736 | 97.2 | % | ||||||||
| England |
5,259 | 0.6 | % | 8,266 | 1.3 | % | ||||||||||
| Iceland |
— | — | 4,970 | 0.7 | % | |||||||||||
| Ireland |
— | — | 3,842 | 0.6 | % | |||||||||||
| Canada |
— | — | 672 | 0.1 | % | |||||||||||
| Israel |
— | — | 384 | 0.1 | % | |||||||||||
|
|
|
|
|
|
|
|
|
|||||||||
| $ | 906,300 | 100.0 | % | $ | 652,870 | 100.0 | % | |||||||||
|
|
|
|
|
|
|
|
|
|||||||||
156
Table of Contents
The following table shows the fair value the Company’s portfolio by industry sector at December 31, 2012 and December 31, 2011:
| December 31, 2012 | December 31, 2011 | |||||||||||||||
| (in thousands) |
Investments at Fair Value |
Percentage of Total Portfolio |
Investments at Fair Value |
Percentage of Total Portfolio |
||||||||||||
| Drug Discovery & Development |
$ | 188,479 | 20.8 | % | $ | 131,428 | 20.1 | % | ||||||||
| Internet Consumer & Business Services |
136,149 | 15.0 | % | 117,542 | 18.0 | % | ||||||||||
| Clean Tech. |
126,600 | 14.0 | % | 64,587 | 9.9 | % | ||||||||||
| Drug Delivery |
74,218 | 8.2 | % | 62,665 | 9.6 | % | ||||||||||
| Software. |
70,838 | 7.8 | % | 27,850 | 4.3 | % | ||||||||||
| Medical Device & Equipment |
54,575 | 6.0 | % | — | 0.0 | % | ||||||||||
| Information Services |
53,523 | 5.9 | % | 45,850 | 7.0 | % | ||||||||||
| Media/Content/Info |
51,534 | 5.7 | % | 38,476 | 5.9 | % | ||||||||||
| Communications & Networking |
37,560 | 4.1 | % | 28,618 | 4.4 | % | ||||||||||
| Healthcare Services, Other. |
36,481 | 4.0 | % | — | 0.0 | % | ||||||||||
| Diagnostic. |
16,307 | 1.8 | % | 15,158 | 2.3 | % | ||||||||||
| Consumer & Business Products |
13,723 | 1.5 | % | 4,186 | 0.6 | % | ||||||||||
| Electronics & Computer Hardware |
12,715 | 1.4 | % | 1,223 | 0.2 | % | ||||||||||
| Specialty Pharma |
12,473 | 1.4 | % | 39,384 | 6.0 | % | ||||||||||
| Surgical Devices |
11,358 | 1.3 | % | 11,566 | 1.8 | % | ||||||||||
| Biotechnology Tools |
6,845 | 0.8 | % | 18,693 | 2.9 | % | ||||||||||
| Semiconductors |
2,922 | 0.3 | % | 9,733 | 1.5 | % | ||||||||||
| Therapeutic |
— | — | 35,911 | 5.5 | % | |||||||||||
|
|
|
|
|
|
|
|
|
|||||||||
| $ | 906,300 | 100.0 | % | $ | 652,870 | 100.0 | % | |||||||||
|
|
|
|
|
|
|
|
|
|||||||||
During the year ended December 31, 2012, the Company funded investments in debt securities and equity investments, totaling approximately $486.8 million and $9.7 million, respectively. During the year ended December 31 2012, the Company converted approximately $356,000 of debt to equity in one portfolio company.
In addition, in December 2011, Hercules entered into an agreement to acquire shares of Facebook, Inc. common stock for approximately $9.6 million through a secondary marketplace. The investments were subject to a Facebook, Inc. right of first refusal, which expired thirty days after the date of investment. At December 31, 2011 these assets were held as Other Assets. In February 2012, Hercules was notified that Facebook Inc. had not exercised its repurchase right with respect to any of the shares and had executed all documents necessary to fully transfer the ownership of the shares to Hercules. Accordingly, during the year ended December 31, 2012, the investment in Facebook, Inc. was transferred from Other Assets to Investments.
During the year ended December 31, 2011, the Company funded investments in debt securities and equity investments, totaling approximately $433.4 million and $2.1 million, respectively. During the year ended December 31, 2011, the Company converted approximately $4.4 million of debt to equity in two portfolio companies.
No single portfolio investment represents more than 10% of the fair value of the investments as of December 31, 2012 and 2011.
During the year ended December 31,2012, the Company recognized net realized gains of approximately $3.2 million on the portfolio. During the year ended December 31, 2012, we recorded realized gains of approximately $5.1 million, $3.1 million, $2.6 million $2.4 million and $2.4 million from the sale of NEXX Systems, Inc., BARRX Medical, DeCode Genetics, Aegerion Pharmaceuticals and Annie’s. These gains were offset by losses of approximately $8.7 million, $2.2 million, $672,000 and $463,000, respectively, from the liquidation of MaxVision Holding, L.L.C, Razorgator Interactive Group, Zeta Interactive Corporation and Magi.com (pka Hi5 Networks, Inc.).
157
Table of Contents
In 2011, we generated realized gains totaling approximately $11.1 million primarily due to the sale of warrants and equity investments in 3 portfolio companies. We recognized realized losses in 2011 of approximately $8.4 million on the disposition of investments in 13 portfolio companies.
Loan origination and commitment fees received in full at the inception of a loan are deferred and amortized into fee income as an enhancement to the related loan’s yield over the contractual life of the loan. Loan exit fees to be paid at the termination of the loan are accreted into interest income over the contractual life of the loan. The Company had approximately $2.0 million and $4.5 million of unamortized fees at December 31, 2012 and December 31, 2011, respectively, and approximately $6.8 million and $4.4 million in exit fees receivable at December 31, 2012 and December 31, 2011, respectively.
The Company has loans in its portfolio that contain a payment-in-kind (“PIK”) provision. The PIK interest, computed at the contractual rate specified in each loan agreement, is added to the principal balance of the loan and recorded as interest income. To maintain the Company’s status as a RIC, this non-cash source of income must be paid out to stockholders in the form of dividends even though the Company has not yet collected the cash. Amounts necessary to pay these dividends may come from available cash or the liquidation of certain investments. The Company recorded approximately $1.5 million and $1.7 million in PIK income during the years ended December 31, 2012 and December 31, 2011, respectively.
In certain investment transactions, the Company may provide advisory services. For services that are separately identifiable and external evidence exists to substantiate fair value, income is recognized as earned, which is generally when the investment transaction closes. The Company had no income from advisory services in the year ended December 31, 2012.
In some cases, the Company collateralizes its investments by obtaining a first priority security interest in a portfolio company’s assets, which may include their intellectual property. In other cases, the Company may obtain a negative pledge covering a company’s intellectual property. At December 31, 2012, approximately 62.4% of the Company’s portfolio company loans were secured by a first priority security in all of the assets of the portfolio company (including their intellectual property), 36.0% of portfolio company loans were to portfolio companies that were prohibited from pledging or encumbering their intellectual property and 1.6% of portfolio company loans had an equipment only lien.
Income Recognition
The Company records interest income on the accrual basis and we recognize it as earned in accordance with the contractual terms of the loan agreement to the extent that such amounts are expected to be collected. Original Issue Discount (“OID”) initially represents the value of detachable equity warrants obtained in conjunction with the acquisition of debt securities and is accreted into interest income over the term of the loan as a yield enhancement. When a loan becomes 90 days or more past due, or if management otherwise does not expect the portfolio company to be able to service its debt and other obligations, the Company will generally place the loan on non-accrual status and cease recognizing interest income on that loan until all principal has been paid. Any uncollected interest related to prior periods is reversed from income in the period that collection of the interest receivable is determined to be doubtful. However, we may make exceptions to this policy if the investment has sufficient collateral value and is in the process of collection. As of December 31, 2012, the Company had one portfolio company on non-accrual status with an approximate cost of $347,000 and no fair market value. There was one loan on non-accrual status with an aggregate cost of approximately $7.7 million and a fair value of approximately $1.0 million as of December 31, 2011. During the third quarter of 2012 the Company recognized a realized loss of approximately $5.1 million on our warrant, equity and debt investments in this company.
Fee Income.
Fee income, generally collected in advance, includes loan commitment and facility fees for due diligence and structuring, as well as fees for transaction services and management services rendered by us to portfolio companies and other third parties. Loan and commitment fees are amortized into income over the contractual life of the loan.
158
Table of Contents
Management fees are generally recognized as income when the services are rendered. Loan origination fees are capitalized and then amortized into interest income using the effective interest rate method. In certain loan arrangements, warrants or other equity interests are received from the borrower as additional origination fees.
We recognize nonrecurring fees amortized over the remaining term of the loan commencing in the quarter relating to specific loan modifications. Certain fees may still be recognized as one-time fees, including prepayment penalties, fees related to select covenant default waiver fees and acceleration of previously deferred loan fees and original issue discount (OID) related to early loan pay-off or material modification of the specific debt outstanding.
Financing costs
Debt financing costs are fees and other direct incremental costs incurred by the Company in obtaining debt financing and are recognized as prepaid expenses and amortized into the consolidated statement of operations as loan fees over the term of the related debt instrument. Prepaid financing costs, net of accumulated amortization, were as follows:
| As of December 31 |
||||||||
| (in thousands) |
2012 | 2011 | ||||||
| Wells Facility |
$ | 867 | $ | 906 | ||||
| SBA Debenture |
5,877 | 5,828 | ||||||
| Convertible Senior Notes |
1,900 | 2,477 | ||||||
| Asset-Backed Notes |
4,074 | — | ||||||
| 2019 Notes |
6,287 | — | ||||||
|
|
|
|
|
|||||
| $ | 19,005 | $ | 9,211 | |||||
|
|
|
|
|
|||||
Cash Equivalents
The Company considers money market funds and other highly liquid short-term investments with a maturity of less than 90 days to be cash equivalents.
Stock Based Compensation
Compensation expense associated with stock based compensation is measured at the grant date based on the fair value of the award and is recognized over the vesting period. Determining the appropriate fair value model and calculating the fair value of stock-based awards at the grant date requires judgment, including estimating stock price volatility, forfeiture rate and expected option life.
Earnings Per Share (EPS)
Basic EPS is calculated by dividing net earnings applicable to common shareholders by the weighted average number of common shares outstanding. Common shares outstanding includes common stock and restricted stock for which no future service is required as a condition to the delivery of the underlying common stock. Diluted EPS includes the determinants of basic EPS and, in addition, reflects the dilutive effect of the common stock deliverable pursuant to stock options and to restricted stock for which future service is required as a condition to the delivery of the underlying common stock.
Income Taxes
We operate to qualify to be taxed as a RIC under the Internal Revenue Code. Generally, a RIC is entitled to deduct dividends it pays to its shareholders from its income to determine “taxable income.” Taxable income includes our net taxable interest, dividend and fee income, as well as our net realized capital gains. Taxable
159
Table of Contents
income generally differs from net income for financial reporting purposes due to temporary and permanent differences in the recognition of income and expenses. In addition, taxable income generally excludes any unrealized appreciation or depreciation in our investments, because gains and losses are not included in taxable income until they are realized and required to be recognized. Taxable income includes certain income, such as contractual payment-in-kind interest and amortization of discounts and fees that is required to be accrued for tax purposes even though cash collections of such income are generally deferred until repayment of the loans or debt securities that gave rise to such income.
We have distributed and currently intend to distribute sufficient dividends to eliminate taxable income. We are subject to a nondeductible federal excise tax of 4% if we do not distribute at least 98% of our investment company taxable income in any calendar year and 98.2% of our capital gain net income for each one year period ending on October 31. We did not record an excise tax provision for the years ended December 31, 2012 and 2011. The maximum amount of excess taxable income that may be carried over for distribution in the next year under the Code is the total amount of dividends paid in the following year, subject to certain declaration and payment guidelines.
Comprehensive Income
The Company reports all changes in comprehensive income in the Consolidated Statement of Operations. Comprehensive income is equal to net increase in net assets resulting from operations.
Dividends
Dividends and distributions to common stockholders are approved by the Board of Directors on a quarterly basis and the dividend payable is recorded on the ex-dividend date.
We have adopted an “opt out” dividend reinvestment plan that provides for reinvestment of our distribution on behalf of our stockholders, unless a stockholder elects to receive cash. As a result, if our Board of Directors authorizes, and we declare a cash dividend, then our stockholders who have not “opted out” of our dividend reinvestment plan will have their cash dividend automatically reinvested in additional shares of our common stock, rather than receiving the cash dividends. During 2012, 2011 and 2010, the Company issued approximately 219,000, 167,000 and 199,000 shares, respectively, of common stock to shareholders in connection with the dividend reinvestment plan.
Segments
The Company lends to and invests in portfolio companies in various technology-related companies, including clean technology, life science, and lower middle market companies. The Company separately evaluates the performance of each of its lending and investment relationships. However, because each of these loan and investment relationships has similar business and economic characteristics, they have been aggregated into a single lending and investment segment.
Recent Accounting Pronouncements
In May 2011, the FASB issued Accounting Standards Update No. 2011-04—Fair Value Measurement: Amendments to Achieve Common Fair Value Measurement and Disclosure Requirements in U.S. GAAP and IFRSs, or ASU 2011-04. ASU 2011-04 clarifies the application of existing fair value measurement and disclosure requirements, changes the application of some requirements for measuring fair value and requires additional disclosure for fair value measurements. The highest and best use valuation premise is only applicable to non-financial assets. In addition, the disclosure requirements are expanded to include for fair value measurements categorized in Level 3 of the fair value hierarchy: (1) a quantitative disclosure of the unobservable inputs and assumptions used in the measurement; (2) a description of the valuation processes in place; and (3) a narrative description of the sensitivity of the fair value to changes in unobservable inputs and interrelationships between
160
Table of Contents
those inputs. ASU 2011-04 is effective for interim and annual periods beginning after December 15, 2011, for public entities and as such the Company has adopted this ASU beginning with the quarter ended March 31, 2012. The Company has increased the disclosures related to Level 3 fair value measurement, in addition to other required disclosures. There were no related impacts on our financial position or results of operations.
3. Fair Value of Financial Instruments
Fair value estimates are made at discrete points in time based on relevant information. These estimates may be subjective in nature and involve uncertainties and matters of significant judgment and, therefore, cannot be determined with precision. The Company believes that the carrying amounts of its financial instruments, consisting of cash and cash equivalents, receivables, accounts payable and accrued liabilities approximate the fair values of such items due to the short maturity of such instruments. The Convertible Senior Notes, 2019 Notes payable (the “April 2019 Notes” and the “September 2019 Notes”, together the “2019 Notes”), the Asset-Backed Notes and the SBA debentures as sources of liquidity remain a strategic advantage due to their flexible structure, long-term duration, and low fixed interest rates. At December 31, 2012, the April 2019 Notes were trading on the New York Stock Exchange for $0.986 per dollar at par value, and the September 2019 Notes were trading on the New York Stock Exchange for $1.003 per dollar at par value. Based on market quotations on or around December 31, 2012, the Convertible Senior Notes were trading for $1.0375 per dollar at par value and the Asset-Backed Notes were trading for $1.00 per dollar at par value. Calculated based on the net present value of payments over the term of the notes using estimated market rates for similar notes and remaining terms, the fair value of the SBA debentures would be approximately $242.3 million, compared to the carrying amount of $225.0 million as of December 31, 2012.
| (in thousands) Description |
12/31/2012 | Identical Assets (Level 1) |
Observable Inputs (Level 2) |
Unobservable Inputs (Level 3) |
||||||||||||
| Convertible Senior Notes |
$ | 77,813 | $ | — | $ | 77,813 | $ | — | ||||||||
| April 2019 Notes |
$ | 83,307 | $ | — | $ | 83,307 | $ | — | ||||||||
| September 2019 Notes |
$ | 86,150 | $ | — | $ | 86,150 | $ | — | ||||||||
| Asset-Backed Notes |
$ | 129,300 | $ | — | $ | — | $ | 129,300 | ||||||||
| SBA Debentures |
$ | 242,300 | $ | — | $ | — | $ | 242,300 | ||||||||
The liabilities of the Company below are recorded at amortized cost and not at fair value on the balance sheet. The following table provides additional information about the level in the fair value hierarchy of our liabilities:
See the accompanying Consolidated Schedule of Investments for the fair value of the Company’s investments. The methodology for the determination of the fair value of the Company’s investments is discussed in Note 1.
4. Borrowings
Long-term SBA Debentures
On September 27, 2006, HT II received a license to operate as a SBIC under the SBIC program and is able to borrow funds from the SBA against eligible investments and additional contributions to regulatory capital. With the Company’s net investment of $38.0 million in HT II as of December 31, 2012, HT II has the capacity to issue a total of $76.0 million of SBA guaranteed debentures, subject to SBA approval, of which $76.0 million was outstanding as of December 31, 2012. As of December 31, 2012, HT II has paid commitment fees of approximately $1.5 million. As of December 31, 2012, the Company held investments in HT II in 51 companies with a fair value of approximately $132.6 million, accounting for approximately 14.6% of the Company’s total portfolio.
On May 26, 2010, HT III received a license to operate as a SBIC under the SBIC program and is able to borrow funds from the SBA against eligible investments and additional contributions to regulatory capital. With the Company’s net investment of $74.5 million in HT III as of December 31, 2012, HT III has the capacity to issue a total of $149.0 million of SBA guaranteed debentures, subject to SBA approval, of which $149.0 million was outstanding as
161
Table of Contents
of December 31, 2012. As of December 31, 2012, HT III has paid commitment fees of approximately $1.5 million. As of December 31, 2012, the Company held investments in HT III in 35 companies with a fair value of approximately $223.6 million, accounting for approximately 24.7% of the Company’s total portfolio.
There is no assurance that HT II or HT III will be able to draw to the maximum limit available under the SBIC program.
SBICs are designed to stimulate the flow of private equity capital to eligible small businesses. Under present SBA regulations, eligible small businesses include businesses that have a tangible net worth not exceeding $18.0 million and have average annual fully taxed net income not exceeding $6.0 million for the two most recent fiscal years. In addition, SBICs must devote 25.0% of its investment activity to “smaller” concerns as defined by the SBA.
A smaller concern is one that has a tangible net worth not exceeding $6.0 million and has average annual fully taxed net income not exceeding $2.0 million for the two most recent fiscal years. SBA regulations also provide alternative size standard criteria to determine eligibility, which depend on the industry in which the business is engaged and are based on such factors as the number of employees and gross sales. According to SBA regulations, SBICs may make long-term loans to small businesses, invest in the equity securities of such businesses and provide them with consulting and advisory services. Through its wholly-owned subsidiaries HT II and HT III, the Company plans to provide long-term loans to qualifying small businesses, and in connection therewith, make equity investments.
HT II and HT III are periodically examined and audited by the SBA’s staff to determine their compliance with SBA regulations. If HT II or HT III fails to comply with applicable SBA regulations, the SBA could, depending on the severity of the violation, limit or prohibit HT II’s or HT III’s use of debentures, declare outstanding debentures immediately due and payable, and/or limit HT II or HT III from making new investments. In addition, HT II or HT III may also be limited in their ability to make distributions to the Company if they do not have sufficient capital in accordance with SBA regulations. Such actions by the SBA would, in turn, negatively affect the Company because HT II and III are the Company’s wholly owned subsidiaries. HT II and HT III were in compliance with the terms of the SBIC’s leverage as of December 31, 2012 as a result of having sufficient capital as defined under the SBA regulations.
The rates of borrowings under various draws from the SBA beginning in April 2007 are set semiannually in March and September and range from 2.25% to 5.73%. Interest payments on SBA debentures are payable semi-annually. There are no principal payments required on these issues prior to maturity and no prepayment penalties. Debentures under the SBA generally mature ten years after being borrowed. Based on the initial draw down date of April 2007, the initial maturity of SBA debentures will occur in April 2017. In addition, the SBA charges a fee that is set annually, depending on the Federal fiscal year the leverage commitment was delegated by the SBA, regardless of the date that the leverage was drawn by the SBIC. The annual fees related to HT II debentures that pooled on September 22, 2010 were 0.406% and 0.285%, depending upon the year in which the underlying commitment was closed. The annual fees related to HT III debentures that pooled on September 19, 2012 were 0.804%. The annual fees on other debentures have been set at 0.906%. The average amount of debentures outstanding for the year ended December 31, 2012 for HT II was approximately $95.2 million with an average interest rate of approximately 5.68%. The average amount of debentures outstanding for the quarter ended December 31, 2012 for HT III was approximately $112.0 million with an average interest rate of approximately 3.25%.
HT II and HT III hold approximately $154.4 million and $250.8 million in assets, respectively, and accounted for approximately 10.5% and 17.0% of the Company’s total assets prior to consolidation at December 31, 2012.
In January 2011, the Company repaid $25.0 million of SBA debentures under HT II, priced at approximately 6.63%, including annual fees. In April 2011, the SBA approved a $25.0 million dollar commitment for HT III.
162
Table of Contents
In February 2012, the Company repaid $24.25 million of SBA debentures under HT II, priced at 6.63%, including annual fees. In June 2012, the SBA approved a $24.25 million dollar commitment for HT III.
In August 2012, the Company repaid $24.75 million of SBA debentures under HT II, $12.0 million priced at 6.43%, including annual fees and $12.75 million priced at 6.38%, including annual fees.
As of December 31, 2012, the maximum statutory limit on the dollar amount of outstanding SBA guaranteed debentures issued by a single SBIC is $150.0 million, subject to periodic adjustments by the SBA, and a maximum amount of $225.0 million for funds under common control, subject to periodic adjustments by the SBA. In the aggregate, at December 31, 2012 there was $225.0 million principal amount of indebtedness outstanding incurred by our SBIC subsidiaries, the maximum statutory limit on the dollar amount of SBA guaranteed debentures under the SBIC program.
The Company reported the following SBA debentures outstanding on its Consolidated Statement of Assets and Liabilities as of December 31, 2102 and December 31, 2011:
| December 31, | ||||||||||||||
| (in thousands) Issuance/Pooling Date |
Maturity Date | Interest Rate(1) | 2012 | 2011 | ||||||||||
| SBA Debentures: |
||||||||||||||
| September 26, 2007 |
September 1, 2017 | 6.43 | % | $ | — | $ | 12,000 | |||||||
| March 26, 2008 |
March 1, 2018 | 6.38 | % | 34,800 | 58,050 | |||||||||
| September 24, 2008 |
September 1, 2018 | 6.63 | % | — | 13,750 | |||||||||
| March 25, 2009 |
March 1, 2019 | 5.53 | % | 18,400 | 18,400 | |||||||||
| September 23, 2009 |
September 1, 2019 | 4.64 | % | 3,400 | 3,400 | |||||||||
| September 22, 2010 |
September 1, 2020 | 3.62 | % | 6,500 | 6,500 | |||||||||
| September 22, 2010 |
September 1, 2020 | 3.50 | % | 22,900 | 22,900 | |||||||||
| March 29, 2011 |
March 1, 2021 | 4.37 | % | 28,750 | 28,750 | |||||||||
| September 21, 2011 |
September 1, 2021 | 3.16 | % | 25,000 | 25,000 | |||||||||
| March 21, 2012 |
March 1, 2022 | 3.05 | % | 11,250 | 11,250 | |||||||||
| March 21, 2012 |
March 1, 2022 | 3.28 | % | 25,000 | 25,000 | |||||||||
| September 19, 2012 |
September 1, 2022 | 3.05 | % | 24,250 | — | |||||||||
| November 14, 2012 |
November 1, 2022 | 3.05 | %(2) | 24,750 | — | |||||||||
|
|
|
|
|
|||||||||||
| Total SBA Debentures |
$ | 225,000 | $ | 225,000 | ||||||||||
|
|
|
|
|
|||||||||||
| (1) | Interest rate includes annual charge |
| (2) | Interim interest on the November 14, 2012 borrowing is expected to pool in March 2013 at which date the principal interest rate will be set. |
Wells Facility
In August 2008, the Company entered into a $50.0 million two-year revolving senior secured credit facility with Wells Fargo Capital Finance (the “Wells Facility”). On June 20, 2011, the Company renewed the Wells Facility. Under this three-year senior secured facility, Wells Fargo Capital Finance has made commitments of $75.0 million. The facility contains an accordion feature, in which the Company can increase the credit line up to an aggregate of $300.0 million, funded by additional lenders and with the agreement of Wells Fargo Capital Finance and subject to other customary conditions. The Company expects to continue discussions with various other potential lenders to join the new facility; however, there can be no assurances that additional lenders will join the Wells Facility.
On August 1, 2012, the Company entered into an amendment to the Wells Facility. The amendment reduces the interest rate floor by 75 basis points to 4.25% and extends the maturity date by one year to August 2015. Additionally, an amortization period of 12 months was added to pay down the principal balance as of the maturity date, and the unused line fee was reduced.
163
Table of Contents
Borrowings under the Wells Facility will generally bear interest at a rate per annum equal to LIBOR plus 3.50%, with a floor of 4.25% and an advance rate of 50% against eligible loans. The Wells Facility is secured by loans in the borrowing base. The Wells Facility requires payment of a non-use fee on a scale of 0.0% to 0.50% of the average monthly outstanding balance. The monthly payment of a non-use fee thereafter shall depend on the average balance that was outstanding on a scale between 0.0% and 0.50%. For the three-month period ended December 31, 2012, this non-use fee was approximately $96,000. On June 20, 2011 the Company paid an additional $1.1 million in structuring fees in connection with the Wells Facility which is being amortized through the end of the term. At December 31, 2012, there were no borrowings outstanding on this facility.
The Wells Facility includes various financial and operating covenants applicable to us and our subsidiaries, in addition to those applicable to Hercules Funding II, LLC. These covenants require the Company to maintain certain financial ratios and a minimum tangible net worth in an amount, when added to outstanding subordinated indebtedness, that is in excess of $362.0 million plus 90% of the cumulative amount of equity raised after June 30, 2012. In addition, the tangible net worth covenant will increase by 90 cents on the dollar for every dollar of equity capital that we subsequently raise. As of December 31, 2012, the minimum tangible net worth covenant has increased to $392.3 million as a result of the October 2012 follow-on public offering of 3.1 million shares of common stock for proceeds of approximately $33.6 million. The Wells Facility provides for customary events of default, including, but not limited to, payment defaults, breach of representations or covenants, bankruptcy events and change of control. The Company was in compliance with all covenants at December 31, 2012.
Union Bank Facility
On February 10, 2010, the Company entered a $20.0 million one-year revolving senior secured credit facility with Union Bank (the “Union Bank Facility”). On November 2, 2011, the Company renewed and amended the Union Bank Facility and added a new lender under the Union Bank Facility. Union Bank and RBC Capital Markets (“RBC”) have made commitments of $30.0 million and $25.0 million, respectively. The Union Bank Facility contains an accordion feature, in which the Company can increase the credit line up to an aggregate of $150.0 million, funded by additional lenders and with the agreement of Union Bank and subject to other customary conditions. The Company expects to continue discussions with various other potential lenders to join the new facility; however, there can be no assurances that additional lenders will join the Union Bank Facility.
On March 30, 2012, the Company entered into an amendment to the Union Bank Facility which permitted the Company to issue additional senior notes relating to the offer and sale of our 2019 Notes. On September 17, 2012, the Company entered into an amendment to the Union Bank Facility. Pursuant to the terms of the amendment, the Company is permitted to increase its unsecured indebtedness by an aggregate original principal amount not to exceed $200.0 million incurred after March 30, 2012 in one or more issuances, provided certain conditions are satisfied for each issuance.
On December 17, 2012, we further amended the Union Bank Facility to remove RBC from the Union Bank
Facility. Following the removal of RBC, the Union Bank Facility consists solely of Union Bank’s commitment of
$30.0 million. In connection with the amendment, the maximum availability under the Union Bank Facility,
subject to a borrowing base, was reduced from $55.0 million to $30.0 million. The Union Bank Facility contains
an accordion feature, in which we could increase the credit line by up to $95.0 million in the aggregate, funded
by commitments from additional lenders and with the agreement of Union Bank and subject to other customary conditions. There can be no assurances that additional lenders will join the Union Bank Facility.
Borrowings under the Union Bank Facility will generally bear interest at a rate per annum equal to LIBOR plus 2.25% with a floor of 4.0%. The Union Bank Facility requires the payment of a non-use fee of 0.50% annually. For the three-month period ended December 31, 2012, this nonuse fee was approximately $65,000. The Union Bank Facility is collateralized by debt investments in our portfolio companies, and includes an advance rate equal to 50.0% of eligible loans placed in the collateral pool. The Union Bank Facility generally requires payment of interest on a monthly basis. All outstanding principal is due upon maturity. At December 31, 2012, there were no borrowings outstanding on this facility.
164
Table of Contents
The Union Bank Facility requires various financial and operating covenants. These covenants require the Company to maintain certain financial ratios and a minimum tangible net worth in an amount, when added to outstanding subordinated indebtedness, that is in excess of $314.0 million plus 90% of the amount of net cash proceeds received from the sale of common stock after March 31, 2011. As of December 31, 2012, the minimum tangible net worth covenant has increased to $386.8 million as a result of the January and October 2012 follow-on public offerings of 5.0 and 3.1 million shares of common stock, respectively, for total net proceeds of approximately $80.9 million. The Union Bank Facility will mature on November 1, 2014, approximately three years from the date of issuance, revolving through the first 24 months with a term out provision for the remaining 12 months. Union Bank Facility also provides for customary events of default, including, but not limited to, payment defaults, breach of representations or covenants, bankruptcy events and change of control. The Company was in compliance with all covenants at December 31, 2012.
Citibank Credit Facility
The Company, through Hercules Funding Trust I, an affiliated statutory trust, had a securitized credit facility (the “Citibank Credit Facility”) with Citigroup Global Markets Realty Corp. which expired under normal terms. During the first quarter of 2009, the Company paid off all principal and interest owed under the Citibank Credit Facility. Citigroup has an equity participation right through a warrant participation agreement on the pool of loans and warrants collateralized under the Citibank Credit Facility. Pursuant to the warrant participation agreement, the Company granted to Citigroup a 10% participation in all warrants held as collateral. However, no additional warrants were included in collateral subsequent to the facility amendment on May 2, 2007. As a result, Citigroup is entitled to 10% of the realized gains on the warrants until the realized gains paid to Citigroup pursuant to the agreement equal $3,750,000 (the “Maximum Participation Limit”). The obligations under the warrant participation agreement continue even after the Citibank Credit Facility is terminated until the Maximum Participation Limit has been reached.
During the year ended December 31, 2012, the Company reduced its realized gain by approximately $270,000 for Citigroup’s participation in the gain on sale of equity securities and recorded a decrease on participation liability and increased its unrealized gains by a net amount of approximately $386,000 for Citigroup’s participation. The value of their participation right on unrealized gains in the related equity investments was approximately $313,000 as of December 31, 2012 and is included in accrued liabilities. There can be no assurances that the unrealized appreciation of the warrants will not be higher or lower in future periods due to fluctuations in the value of the warrants, thereby increasing or reducing the effect on the cost of borrowing. Since inception of the agreement, the Company has paid Citigroup approximately $1.4 million under the warrant participation agreement thereby reducing the Company’s realized gains by this amount. The Company will continue to pay Citigroup under the warrant participation agreement until the Maximum Participation Limit is reached or the warrants expire. Warrants subject to the Citigroup participation agreement are set to expire between January 2013 and January 2017.
Convertible Senior Notes
In April 2011, the Company issued $75.0 million in aggregate principal amount of its 6.00% convertible senior notes (the “Convertible Senior Notes”) due 2016.
The Convertible Senior Notes mature on April 15, 2016 (the “Maturity Date”), unless previously converted or repurchased in accordance with their terms. The Convertible Senior Notes bear interest at a rate of 6.00% per year payable semiannually in arrears on April 15 and October 15 of each year, commencing on October 15, 2011. The Convertible Senior Notes are the Company’s senior unsecured obligations and rank senior in right of payment to the Company’s existing and future indebtedness that is expressly subordinated in right of payment to the Convertible Senior Notes; equal in right of payment to the Company’s existing and future unsecured indebtedness that is not so subordinated; effectively junior in right of payment to any of the Company’s secured indebtedness (including unsecured indebtedness that the Company later secures) to the extent of the value of the assets securing such indebtedness; and structurally junior to all existing and future indebtedness (including trade payables) incurred by the Company’s subsidiaries, financing vehicles or similar facilities.
165
Table of Contents
Prior to the close of business on the business day immediately preceding October 15, 2015, holders may convert their Convertible Senior Notes only under certain circumstances set forth in the Indenture. On or after October 15, 2015 until the close of business on the scheduled trading day immediately preceding the Maturity Date, holders may convert their Convertible Senior Notes at any time. Upon conversion, the Company will pay or deliver, as the case may be, at its election, cash, shares of its common stock or a combination of cash and shares of its common stock. The conversion rate will initially be 84.0972 shares of common stock per $1,000 principal amount of Convertible Senior Notes (equivalent to an initial conversion price of approximately $11.89 per share of common stock). The conversion rate will be subject to adjustment in some events but will not be adjusted for any accrued and unpaid interest. In addition, if certain corporate events occur prior to the Maturity Date, the conversion rate will be increased for converting holders.
The Company may not redeem the Convertible Senior Notes prior to maturity. No sinking fund is provided for the Convertible Senior Notes. In addition, if certain corporate events occur, holders of the Convertible Senior Notes may require the Company to repurchase for cash all or part of their Convertible Senior Notes at a repurchase price equal to 100% of the principal amount of the Convertible Senior Notes to be repurchased, plus accrued and unpaid interest through, but excluding, the required repurchase date.
The Convertible Senior Notes are accounted for in accordance with ASC 470-20 (previously FASB Staff Position No. APB 14- 1, “Accounting for Convertible Debt Instruments That May Be Settled in Cash upon Conversion (Including Partial Cash Settlement)”). In accounting for the Convertible Senior Notes, we estimated at the time of issuance that the values of the debt and the embedded conversion feature of the Convertible Senior Notes were approximately 92.8% and 7.2%, respectively. The original issue discount of 7.2% attributable to the conversion feature of the Convertible Senior Notes was recorded in “capital in excess of par value” in the accompanying consolidated statement of assets and liabilities. As a result, the Company records interest expense comprised of both stated interest expense as well as accretion of the original issue discount. Additionally, the issuance costs associated with the Convertible Senior Notes were allocated to the debt and equity components in proportion to the allocation of the proceeds and accounted for as debt issuance costs and equity issuance costs, respectively. At the time of issuance, the debt issuance costs and equity issuance costs were approximately $2.9 million and $224,000, respectively. At the time of issuance and as of December 31, 2012, the equity component, net of issuance costs, as recorded in the “capital in excess of par value” in the balance sheet was approximately $5.2 million.
As of December 31, 2012, the components of the carrying value of the Convertible Senior Notes were as follows:
| (in thousands) |
As of December 31, 2012 | |||
| Principal amount of debt |
$ | 75,000 | ||
| Original issue discount, net of accretion |
(3,564 | ) | ||
|
|
|
|||
| Carrying value of debt |
$ | 71,436 | ||
|
|
|
|||
For the years ended December 31, 2012 and 2011, the components of interest expense, fees and cash paid for interest expense for the Convertible Senior Notes were as follows:
| For the Years
Ended December 31, |
||||||||
| (in thousands) |
2012 | 2011 | ||||||
| Stated interest expense |
$ | 4,500 | $ | 3,187 | ||||
| Accretion of original issue discount |
1,083 | 767 | ||||||
| Amortization of debt issuance cost |
577 | 409 | ||||||
|
|
|
|
|
|||||
| Total interest expense |
$ | 6,160 | $ | 4,363 | ||||
|
|
|
|
|
|||||
| Cash paid for interest expense |
$ | 4,500 | $ | 2,250 | ||||
166
Table of Contents
The estimated effective interest rate of the debt component of the Convertible Senior Notes, equal to the stated interest of 6.0% plus the accretion of the original issue discount, was approximately 8.1 % and 8.2% for the three and twelve-months ended December 31, 2012, respectively. As of December 31, 2012, the Company is in compliance with the terms of the indentures governing the Convertible Senior Notes.
2019 Notes
On March 6, 2012, the Company and the Trustee entered into the Base Indenture. On April 17, 2012, the Company and the Trustee entered into the First Supplemental Indenture to the Base Indenture, dated April 17, 2012, relating to the Company’s issuance, offer and sale of $43.0 million aggregate principal amount of 7.00% senior notes due 2019 (the “April 2019 Notes”). The sale of the April 2019 Notes generated net proceeds, before expenses, of approximately $41.7 million.
On September 24, 2012, the Company and the Trustee, entered into the Second Supplemental Indenture to the Base Indenture, dated as of September 24, 2012, relating to the Company’s issuance, offer and sale of $75.0 million aggregate principal amount of 7.00% senior notes due 2019 (the “September 2019 Notes”). The sale of the September 2019 Notes generated net proceeds, before expenses, of approximately $72.75 million.
2019 Notes payable is compromised of:
| As of | ||||||||
| (in thousands) |
December 31, 2012 | December 31, 2011 | ||||||
| April 2019 Notes |
$ | 84,490 | $ | — | ||||
| September 2019 Notes |
85,875 | — | ||||||
|
|
|
|
|
|||||
| Carrying value of debt |
$ | 170,365 | $ | — | ||||
|
|
|
|
|
|||||
April 2019 Notes
The April 2019 Notes will mature on April 30, 2019 and may be redeemed in whole or in part at the Company’s option at any time or from time to time on or after April 30, 2015, upon not less than 30 days nor more than 60 days written notice by mail prior to the date fixed for redemption thereof, at a redemption price of 100% of the outstanding principal amount thereof plus accrued and unpaid interest payments otherwise payable for the then-current quarterly interest period accrued to but not including the date fixed for redemption. The April 2019 Notes bear interest at a rate of 7.00% per year payable quarterly on January 30, April 30, July 30 and October 30 of each year, commencing on July 30, 2012, and trade on the New York Stock Exchange under the trading symbol “HTGZ.”
The April 2019 Notes will be the Company’s direct unsecured obligations and will rank: (i) pari passu with our other outstanding and future senior unsecured indebtedness, including without limitation, the $75 million in aggregate principal amount of the Convertible Senior Notes; (ii) senior to any of the Company’s future indebtedness that expressly provides it is subordinated to the April 2019 Notes; (iii) effectively subordinated to all the Company’s existing and future secured indebtedness (including indebtedness that is initially unsecured to which the Company subsequently grants security), to the extent of the value of the assets securing such indebtedness, including without limitation, borrowings under the Company’s credit facilities; (iv) structurally subordinated to all existing and future indebtedness and other obligations of any of the Company’s subsidiaries, including without limitation, the indebtedness of Hercules Technology II, L.P. and Hercules Technology III, L.P. and borrowings under the Company’s revolving senior secured credit facility with Wells Fargo Capital Finance.
The Indenture, as supplemented by the First Supplemental Indenture, contains certain covenants including covenants requiring the Company to comply with (regardless of whether it is subject to) the asset coverage requirements set forth in Section 18(a)(1)(A) as modified by Section 61(a)(1) of the 1940 Act to comply with the restrictions on dividends, distributions and purchase of capital stock set forth in Section 18(a)(1)(B) as modified by Section 61(a)(1) of the 1940 Act and to provide financial information to the holders of the April 2019 Notes
167
Table of Contents
and the Trustee if the Company should no longer be subject to the reporting requirements under the Securities Exchange Act of 1934. These covenants are subject to important limitations and exceptions that are described in the Indenture, as supplemented by the First Supplemental Indenture. The Indenture provides for customary events of default and further provides that the Trustee or the holders of 25% in aggregate principal amount of the outstanding April 2019 Notes in a series may declare such April 2019 Notes immediately due and payable upon the occurrence of any event of default after expiration of any applicable grace period.
The April 2019 Notes were sold pursuant to an underwriting agreement dated April 11, 2012 among the Company and Stifel, Nicolaus & Company, Incorporated, as representative of the several underwriters named in the underwriting agreement.
In July 2012, we re-opened our April 2019 Notes and issued an additional amount of approximately $41.5 million in aggregate principal amount of April 2019 Notes, which includes exercise of an over-allotment option, bringing the total amount of the April 2019 Notes issued to approximately $84.5 million in aggregate principal amount.
September 2019 Notes
The September 2019 Notes will mature on September 30, 2019 and may be redeemed in whole or in part at the Company’s option at any time or from time to time on or after September 30, 2015, upon not less than 30 days nor more than 60 days written notice by mail prior to the date fixed for redemption thereof, at a redemption price of 100% of the outstanding principal amount thereof plus accrued and unpaid interest payments otherwise payable for the then-current quarterly interest period accrued to but not including the date fixed for redemption. The September 2019 Notes bear interest at a rate of 7.00% per year payable quarterly on March 30, June 30, September 30 and December 30 of each year, commencing on December 30, 2012, and trade on the New York Stock Exchange under the trading symbol “HTGY.”
The September 2019 Notes will be the Company’s direct unsecured obligations and will rank: (i) pari passu with our other outstanding and future senior unsecured indebtedness, including without limitation, the $75 million in aggregate principal amount of the Convertible Senior Notes; (ii) senior to any of the Company’s future indebtedness that expressly provides it is subordinated to the September 2019 Notes; (iii) effectively subordinated to all the Company’s existing and future secured indebtedness (including indebtedness that is initially unsecured to which the Company subsequently grant security), to the extent of the value of the assets securing such indebtedness, including without limitation, borrowings under the Company’s credit facilities; (iv) structurally subordinated to all existing and future indebtedness and other obligations of any of our subsidiaries, including without limitation, the indebtedness of Hercules Technology II, L.P. and Hercules Technology III, L.P. and borrowings under the Company’s revolving senior secured credit facility with Wells Fargo Capital Finance.
The Base Indenture, as supplemented by the Second Supplemental Indenture, contains certain covenants including covenants requiring the Company to comply with (regardless of whether it is subject to) the asset coverage requirements set forth in Section 18(a) (1)(A) as modified by Section 61(a)(1) of the 1940 Act to comply with the restrictions on dividends, distributions and purchase of capital stock set forth in Section 18(a)(1)(B) as modified by Section 61(a)(1) of the 1940 Act and to provide financial information to the holders of the September 2019 Notes and the Trustee if the Company should no longer be subject to the reporting requirements under the Securities Exchange Act of 1934. These covenants are subject to important limitations and exceptions that are described in the Indenture, as supplemented by the Second Supplemental Indenture. The Indenture provides for customary events of default and further provides that the Trustee or the holders of 25% in aggregate principal amount of the outstanding September 2019 Notes in a series may declare such September 2019 Notes immediately due and payable upon the occurrence of any event of default after expiration of any applicable grace period.
The September 2019 Notes were sold pursuant to an underwriting agreement dated September 19, 2012 (the “Underwriting Agreement”) among the Company and Stifel, Nicolaus & Company, Incorporated, as representative of the several underwriters named in the underwriting agreement.
168
Table of Contents
In October 2012, the underwriters exercised their over-allotment option for an additional $10.9 million of the September 2019 Notes, bringing the total amount of the September 2019 Notes issued to approximately $85.9 million in aggregate principal amount.
For the years ended December 31, 2012 and 2011, the components of interest expense and related fees and cash paid for interest expense and fees for the April 2019 and September 2019 Notes are as follows:
| For the Years
Ended December 31, |
||||||||
| (in thousands) |
2012 | 2011 | ||||||
| Stated interest expense |
$ | 5,139 | $ | — | ||||
| Amortization of debt issuance cost |
423 | — | ||||||
|
|
|
|
|
|||||
| Total interest expense and fees |
$ | 5,562 | $ | — | ||||
|
|
|
|
|
|||||
| Cash paid for interest expense and fees |
$ | 4,790 | $ | — | ||||
As of December 31, 2012, the Company is in compliance with the terms of the indenture governing the April 2019 Notes and the September 2019 Notes.
Asset-Backed Notes
On December 19, 2012, the Company completed a $230.7 million term debt securitization in connection with which an affiliate of the Company made an offering of $129.3 million in aggregate principal amount of fixed-rate asset-backed notes (the “Asset-Backed Notes”), which Asset-Backed Notes were rated A2(sf) by Moody’s Investors Service, Inc. The Asset-Backed Notes were issued by Hercules Capital Funding Trust 2012-1 pursuant to a note purchase agreement, dated as of December 12, 2012, by and among us, Hercules Capital Funding 2012-1 LLC, as Trust Depositor (the “Trust Depositor”), Hercules Capital Funding Trust 2012-1, as Issuer (the “Issuer”), and Guggenheim Securities, LLC, as Initial Purchaser, and are backed by a pool of senior loans made to certain of our portfolio companies and secured by certain assets of those portfolio companies and are to be serviced by the Company. Interest on the Asset-Backed Notes will be paid, to the extent of funds available, at a fixed rate of 3.32% per annum. The Asset-Backed Notes have a stated maturity of December 16, 2017.
As part of this transaction, the Company entered into a sale and contribution agreement with the Trust Depositor under which the Company has agreed to sell or have contributed to the Trust Depositor certain senior loans made to certain of our portfolio companies (the “Loans”). The Company has made customary representations, warranties and covenants in the sale and contribution agreement with respect to the Loans as of the date of their transfer to the Trust Depositor.
In connection with the issuance and sale of the Asset-Backed Notes, the Company has made customary representations, warranties and covenants in the note purchase agreement. The Asset-Backed Notes are secured obligations of the Issuer and are non-recourse to the Company. The Issuer also entered into an indenture governing the Asset-Backed Notes, which indenture includes customary representations, warranties and covenants. The Asset-Backed Notes were sold without being registered under the Securities Act of 1933, as amended (the “Securities Act”), to “qualified institutional buyers” in compliance with the exemption from registration provided by Rule 144A under the Securities Act and to institutional “accredited investors” (as defined in Rule 501(a)(1), (2), (3) or (7) under the Securities Act) who in each case, are “qualified purchasers” for purposes of Section 3(c)(7) under the 1940 Act. In addition, the Trust Depositor entered into an amended and restated trust agreement, which includes customary representation, warranties and covenants.
169
Table of Contents
The Loans will be serviced by the Company pursuant to a sale and servicing agreement, which contains customary representations, warranties and covenants. The Company will perform certain servicing and administrative functions with respect to the Loans. The Company will be entitled to receive a monthly fee from the Issuer for servicing the Loans. This servicing fee will equal the product of one-twelfth (or in the case of the first payment date, a fraction equal to the number of days from and including December 5, 2012 through and including January 15, 2013 over 360) of 2.00% and the aggregate outstanding principal balance of the Loans, excluding all defaulted Loans and all purchased Loans, as of the first day of the related collection period (the period from the 5th day of the immediately preceding calendar month through the 4th day of the calendar month in which a payment date occurs, and for the first payment date, the period from and including December 5, 2012, to the close of business on January 4, 2013).
The Company will also serve as administrator to the Issuer under an administration agreement, which includes customary representations, warranties and covenants.
Outstanding Borrowings
At December 31, 2012 and December 31, 2011, the Company had the following borrowing capacity and outstanding borrowings:
| December 31, 2012 | December 31, 2011 | |||||||||||||||
| (in thousands) |
Total Available |
Carrying Value(1) |
Total Available |
Carrying Value(1) |
||||||||||||
| Union Bank Facility |
$ | 30,000 | $ | — | $ | 55,000 | $ | — | ||||||||
| Wells Facility |
75,000 | — | 75,000 | 10,187 | ||||||||||||
| Convertible Senior Notes(2) |
75,000 | 71,436 | 75,000 | 70,353 | ||||||||||||
| 2019 Notes |
170,364 | 170,364 | — | — | ||||||||||||
| Asset-Backed Notes |
129,300 | 129,300 | — | — | ||||||||||||
| SBA Debentures(3) |
225,000 | 225,000 | 225,000 | 225,000 | ||||||||||||
|
|
|
|
|
|
|
|
|
|||||||||
| Total |
$ | 704,664 | $ | 596,100 | $ | 430,000 | $ | 305,540 | ||||||||
|
|
|
|
|
|
|
|
|
|||||||||
| (1) | Except for the Convertible Senior Notes (as defined below), all carrying values are the same as the principal amount outstanding. |
| (2) | Represents the aggregate principal amount outstanding of the Convertible Senior Notes (as defined below) less the unaccreted discount initially recorded upon issuance of the Convertible Senior Notes. The total unaccreted discount for the Convertible Senior Notes was $3.6 million at December 31, 2012. |
| (3) | In January 2012, we repaid $25.0 million of SBA debentures under HT II, priced at approximately 6.63%, including annual fees. In April 2012, the SBA approved a $25.0 million dollar commitment for HT III bringing the total available borrowings to $225.0 million, of which $125.0 million was available in HT II and $100.0 million was available in HT III. |
| In February 2012, we repaid $24.25 million of SBA debentures under HT II, priced at approximately 6.63%, including annual fees. In June 2012, the SBA approved a $24.25 million dollar commitment for HT III. |
| In August 2012, the Company repaid $24.75 million of SBA debentures under HT II, $12.0 million priced at 6.43%, including annual fees, and $12.75 million priced at 6.38%, including annual fees. In September 2012, the SBA approved a $24.75 million dollar commitment for HT III bringing the total available borrowings to $225.0 million, of which $76.0 million was available in HT II and $149.0 million was available in HT III. |
5. Income Taxes
The Company intends to operate so as to qualify to be taxed as a RIC under Subchapter M of the Code and, as such, will not be subject to federal income tax on the portion of taxable income and gains distributed to stockholders.
To qualify as a RIC, the Company is required to meet certain income and asset diversification tests in addition to distributing at least 90% of its investment company taxable income, as defined by the Code. Because federal income tax regulations differ from accounting principles generally accepted in the United States, distributions in accordance with tax regulations may differ from net investment income and realized gains
170
Table of Contents
recognized for financial reporting purposes. Differences may be permanent or temporary in nature. Permanent differences are reclassified among capital accounts in the financial statements to reflect their tax character. Differences in classification may also result from the treatment of short-term gains as ordinary income for tax purposes. During the year ended December 31, 2012 and 2011, the Company reclassified for book purposes amounts arising from permanent book/tax differences primarily related to accelerated revenue recognition for income tax purposes, respectively, as follows:
| December 31, | ||||||||
| (in thousands) |
2012 | 2011 | ||||||
| Distributions in excess of investment income |
$ | 2,920 | $ | (1,882 | ) | |||
| Accumulated realized gains (losses) |
2,958 | 5,250 | ||||||
| Additional paid-in capital |
(5,878 | ) | (3,368 | ) | ||||
For income tax purposes, distributions paid to shareholders are reported as ordinary income, return of capital, long term capital gains or a combination thereof. The tax character of distributions paid for the years ended December 31, 2012 and 2011 was ordinary income in the amounts of $48.0 million and $38.5 million, respectively.
The aggregate gross unrealized appreciation of our investments over cost for federal income tax purposes was $19.9 million and $34.5 million as of December 31, 2012 and 2011, respectively. The aggregate gross unrealized depreciation of our investments under cost for federal income tax purposes was $27.6 million and $39.4 million as of December 31, 2012 and 2011, respectively. The net unrealized depreciation over cost for federal income tax purposes was $7.8 million as of December 31, 2012 and net unrealized depreciation over cost for federal income tax purposes was $4.9 million as of December 31, 2011. The aggregate cost of securities for federal income tax purposes was $916.9 million and $658.0 million as of December 31, 2012 and 2011, respectively.
At December 31, 2012 and 2011, the components of distributable earnings on a tax basis detailed below differ from the amounts reflected in the Company’s Statement of Net Assets and Liabilities by temporary book/ tax differences primarily arising from the treatment of loan related yield enhancements.
| December 31, | ||||||||||||
| (in thousands) |
2012 |
|
2011 | |||||||||
| Accumulated Capital Gains (Losses) |
$ | (35,940 | ) | $ | (48,567 | ) | ||||||
| Other Temporary Differences |
(3,726 | ) | (16 | ) | ||||||||
| Undistributed Ordinary Income |
1,552 | 236 | ||||||||||
| Unrealized Appreciation (Depreciation) |
(10,480 | ) |
|
(4,901 | ) | |||||||
|
|
|
|
|
|
|
|||||||
| Components of Distributable Earnings |
$ | (48,594 | ) | $ | (53,248 | ) | ||||||
|
|
|
|
|
|
||||||||
The Company will classify interest and penalties, if any, related to unrecognized tax benefits as a component of provision for income taxes.
Based on an analysis of our tax position, there are no uncertain tax positions that met the recognition or measurement criteria. The Company is currently not undergoing any tax examinations. The Company does not anticipate any significant increase or decrease in unrecognized tax benefits for the next twelve months. The 2009, 2010 and 2011 federal tax years for the Company remain subject to examination by the IRS. The 2008, 2009, 2010 and 2011 state tax years for the Company remain subject to examination by the California Franchise Tax Board.
6. Shareholders’ Equity
On January 20, 2012, the Company raised approximately $47.7 million, net of issuance costs, in a public offering of 5,000,000 shares of its common stock.
171
Table of Contents
On July 25, 2012, the Company’s Board of Directors approved the extension of the stock repurchase plan under the same terms and conditions that allowed the Company to repurchase up to $35.0 million of its common stock. The stock repurchase plan expired on February 26, 2013. During the year ended December 31, 2012, the Company did not repurchase any common stock.
On October 3, 2012, the Company raised approximately $33.2 million, net of issuance costs, in a public offering of 3,100,000 shares of its common stock.
At December 31, 2012, the Company was authorized to issue 100,000,000 shares of common stock with a par value of $0.001. Each share of common stock entitles the holder to one vote.
The Company has issued stock options for common stock subject to future issuance, of which 2,574,749 and 4,231,444 were outstanding at December 31, 2012 and 2011, respectively.
7. Equity Incentive Plan
The Company and its stockholders have authorized and adopted the 2004 Equity Incentive Plan (the “2004 Plan”) for purposes of attracting and retaining the services of its executive officers and key employees. Under the 2004 Plan, the Company is authorized to issue 7,000,000 shares of common stock. On June 1, 2011, stockholders approved an increase of 1,000,000 shares, authorizing the Company to issue 8,000,000 shares of common stock under the 2004 Plan. Unless terminated earlier by the Company’s Board of Directors, the 2004 Plan will terminate on June 9, 2014, and no additional awards may be made under the 2004 Plan after that date.
The Company and its stockholders have authorized and adopted the 2006 Non-Employee Director Plan (the “2006 Plan” and, together with the 2004 Plan, the “Plans”) for purposes of attracting and retaining the services of its Board of Directors. Under the 2006 Plan, the Company is authorized to issue 1,000,000 shares of common stock. Unless terminated earlier by the Company’s Board of Directors, the 2006 Plan will terminate on May 29, 2016 and no additional awards may be made under the 2006 Plan after that date. The Company filed an exemptive relief request with the Securities and Exchange Commission (“SEC”) to allow options to be issued under the 2006 Plan which was approved on October 10, 2007.
On June 21, 2007, the stockholders approved amendments to the 2004 Plan and the 2006 Plan allowing for the grant of restricted stock. The amended Plans limit the combined maximum amount of restricted stock that may be issued under both Plans to 10% of the outstanding shares of the Company’s stock on the effective date of the Plans plus 10% of the number of shares of stock issued or delivered by the Company during the terms of the Plans. The amendments further specify that no one person shall be granted awards of restricted stock relating to more than 25% of the shares available for issuance under the 2004 Plan. Further, the amount of voting securities that would result from the exercise of all of the Company’s outstanding warrants, options and rights, together with any restricted stock issued pursuant to the Plans, at the time of issuance shall not exceed 25% of its outstanding voting securities, except that if the amount of voting securities that would result from such exercise of all of the Company’s outstanding warrants, options and rights issued to the Company’s directors, officers and employees, together with any restricted stock issued pursuant to the Plans, would exceed 15% of the Company’s outstanding voting securities, then the total amount of voting securities that would result from the exercise of all outstanding warrants, options and rights, together with any restricted stock issued pursuant to the Plans, at the time of issuance shall not exceed 20% of our outstanding voting securities.
In conjunction with the amendment and in accordance with the exemptive order, on June 21, 2007 the Company made an automatic grant of shares of restricted common stock to Messrs. Badavas, Chow and Woodward, the independent members of its Board of Directors, in the amounts of 1,667, 1,667 and 3,334 shares, respectively. In May 2008, the Company issued restricted shares to Messrs. Badavas and Chow in the amount of 5,000 shares each. In June 2009, the Company issued 5,000 restricted stock shares to Mr. Woodward. The shares were issued pursuant to the 2006 Plan and vested 33% on an annual basis from the date of grant. Deferred compensation cost was recognized ratably over the three year vesting period.
172
Table of Contents
A summary of restricted stock activity under the Company’s 2006 and 2004 Plans for each of the three periods ended December 31 2012, 2011 and 2010 is as follows:
| 2006 Plan | 2004 Plan |
|||||||
| Outstanding at December 31, 2009 |
21,668 | 530,475 | ||||||
| Granted |
— | 491,500 | ||||||
| Cancelled |
— | (3,872 | ) | |||||
|
|
|
|
|
|||||
| Outstanding at December 31, 2010 |
21,668 | 1,018,103 | ||||||
| Granted |
10,000 | 296,600 | ||||||
| Cancelled |
— | (123,502 | ) | |||||
|
|
|
|
|
|||||
| Outstanding at December 31, 2011 |
31,668 | 1,191,201 | ||||||
| Granted |
5,000 | 686,859 | ||||||
| Cancelled |
— | (59,019 | ) | |||||
|
|
|
|
|
|||||
| Outstanding at December 31, 2012 |
36,668 | 1,819,041 | ||||||
|
|
|
|
|
|||||
A summary of common stock options activity under the Company’s 2006 and 2004 Plans for each of the three periods ended December 31 2012, 2011 and 2010 is as follows:
|
|
Common Stock Options |
|
|
Weighted |
| |||
| Shares Outstanding at January 1, 2010 |
4,924,405 | $ | 10.72 | |||||
| Granted |
575,250 | $ | 10.16 | |||||
| Exercised |
(520,666 | ) | $ | 4.91 | ||||
| Cancelled/Forfeited |
(249,140 | ) | $ | 10.14 | ||||
|
|
|
|||||||
| Shares Outstanding at December 31, 2010 |
4,729,849 | $ | 11.33 | |||||
| Granted |
599,860 | $ | 10.59 | |||||
| Exercised |
(178,101 | ) | $ | 4.93 | ||||
| Cancelled/Forfeited |
(938,004 | ) | $ | 11.73 | ||||
|
|
|
|||||||
| Shares Outstanding at December 31, 2011 |
4,213,604 | $ | 11.40 | |||||
| Granted |
189,000 | $ | 10.71 | |||||
| Exercised |
(564,196 | ) | $ | 5.56 | ||||
| Cancelled/Forfeited |
(1,263,659 | ) | $ | 12.70 | ||||
|
|
|
|||||||
| Shares Outstanding at December 31, 2012 |
2,574,749 | $ | 12.00 | |||||
|
|
|
|||||||
| Shares Expected to Vest at December 31, 2012 |
424,676 | $ | 12.00 |
Options generally vest 33% one year after the date of grant and ratably over the succeeding 24 months. All options may be exercised for a period ending seven years after the date of grant. At December 31, 2012, options for approximately 2.2 million shares were exercisable at a weighted average exercise price of approximately $12.31 per share with weighted average of remaining contractual term of 2.06 years. The Company determined that the fair value of options granted under the 2006 and 2004 Plans during the years ended December 31, 2012, 2011 and 2010 was approximately $326,000, $1.3 million and $1.0 million, respectively. During the years ended December 31, 2012, 2011 and 2010, approximately $416,000, $557,000, and $719,000 of share-based cost due to stock option grants was expensed, respectively. As of December 31, 2012, there was $640,000 of total unrecognized compensation costs related to stock options. These costs are expected to be recognized over a weighted average period of 2.07 years. The fair value of options granted is based upon a Black Scholes option pricing model using the assumptions in the following table for each of the three periods ended December 31, 2012, 2011 and 2010 is as follows:
| 2012 | 2011 | 2010 | ||||||||||
| Expected Volatility |
46.39 | % | 46.39 | % | 46.39 | % | ||||||
| Expected Dividends |
10 | % | 10 | % | 10 | % | ||||||
| Expected term (in years) |
4.5 | 4.5 | 4.5 | |||||||||
| Risk-free rate |
0.49%-1.07 | % | 0.68%-2.15 | % | 0.89%-2.51 | % | ||||||
173
Table of Contents
The following table summarizes stock options outstanding and exercisable at December 31, 2012;
| (Dollars in thousands, except exercise price) |
Options Outstanding | Options Exercisable | ||||||||||||||||||||||||||||||
| Range of exercise prices |
Number of shares |
Weighted average remaining contractual life |
Aggregate intrinsic value |
Weighted average exercise price |
Number of shares |
Weighted average remaining contractual life |
Aggregate intrinsic value |
Weighted average exercise price |
||||||||||||||||||||||||
| $4.21-$8.49 |
46,248 | 4.25 | $ | 255,836 | $ | 5.60 | 46,248 | 4.25 | $ | 255,836 | $ | 5.60 | ||||||||||||||||||||
| $8.67-$13.40 |
1,889,501 | 3.28 | 600,811 | $ | 11.46 | 1,464,825 | 2.41 | 293,179 | $ | 11.76 | ||||||||||||||||||||||
| $13.87-$15.00 |
668,500 | 1.06 | — | $ | 14.02 | 668,500 | 1.06 | — | $ | 14.02 | ||||||||||||||||||||||
|
|
|
|
|
|
|
|
|
|||||||||||||||||||||||||
| $4.21-$15.00 |
2,604,249 | 2.73 | $ | 856,647 | $ | 12.01 | 2,179,573 | 2.03 | $ | 549,015 | $ | 12.32 | ||||||||||||||||||||
|
|
|
|
|
|
|
|
|
|||||||||||||||||||||||||
In 2012, 2011 and 2010, the Company granted approximately 691,859 and 306,600 and 491,500 shares, respectively, of restricted stock pursuant to the Plans. Each restricted stock award granted in 2012, 2011 and 2010 is subject to lapse as to 25% of the award one year after the date of grant and ratably over the succeeding 36 months subject to a four year forfeiture schedule. Share based compensation cost will be recognized ratably over the four year vesting period. No restricted stock was granted pursuant to the 2004 Plan prior to 2009.
The Company determined that the fair value of restricted stock granted under the 2006 and 2004 Plans during the years ended December 31, 2012, 2011 and 2010 was approximately $7.5 million, $3.4 million and $5.1 million, respectively. During the years ended December 31, 2012, 2011 and 2010, the Company expensed approximately $3.9 million, $2.6 million and $2.0 million of compensation expense related to restricted stock, respectively. As of December 31, 2012, there was approximately $8.2 million of total unrecognized compensation costs related to restricted stock. These costs are expected to be recognized over a weighted average period of 2.68 years.
The following table summarizes the activities for our unvested restricted stock for the years ended December 31, 2012, 2011 and 2010:
| Unvested Restricted Stock Units | ||||||||
| Number of Shares |
Weighted- Average Grant-Date Fair Value |
|||||||
| Unvested at January 1, 2010 |
487,527 | $ | 7.06 | |||||
| Granted |
491,500 | $ | 10.39 | |||||
| Vested |
(196,491 | ) | $ | 6.67 | ||||
| Forfeited |
(3,872 | ) | $ | 5.05 | ||||
| Unvested at December 31, 2010 |
778,664 | $ | 9.27 | |||||
| Granted |
306,600 | $ | 11.14 | |||||
| Vested |
(340,253 | ) | $ | 9.38 | ||||
| Forfeited |
(123,502 | ) | $ | 9.63 | ||||
| Unvested at December 31, 2011 |
621,509 | $ | 10.06 | |||||
| Granted |
691,859 | $ | 10.83 | |||||
| Vested |
(354,560 | ) | $ | 9.88 | ||||
| Forfeited |
(59,019 | ) | $ | 9.95 | ||||
| Unvested at December 31, 2012 |
899,789 | $ | 10.73 | |||||
The SEC, through an exemptive order granted on June 22, 2010, approved amendments to the Plans which allow participants to elect to have the Company withhold shares of the Company’s common stock to pay for the exercise price and applicable taxes with respect to an option exercise (“net issuance exercise”). The exemptive order also permits the holders of restricted stock to elect to have the Company withhold shares of Hercules stock to pay the applicable taxes due on restricted stock at the time of vesting. Each individual can make, and does not preclude the participant from electing to make, a cash payment at the time of option exercise or to pay taxes on restricted stock.
174
Table of Contents
8. Earnings per Share
Shares used in the computation of the Company’s basic and diluted earnings per share are as follows:
| Year Ended December 31, | ||||||||||||
| (in thousands, except per share data) |
2012 | 2011 | 2010 | |||||||||
| Numerator |
||||||||||||
| Net increase in net assets resulting from operations |
$ | 46,759 | $ | 46,936 | $ | 4,982 | ||||||
| Less: Dividends declared-common and restricted shares |
(47,983 | ) | (38,492 | ) | (28,816 | ) | ||||||
|
|
|
|
|
|
|
|||||||
| Undistributed earnings |
(1,224 | ) | 8,444 | (23,834 | ) | |||||||
|
|
|
|
|
|
|
|||||||
| Undistributed earnings-common shares |
(1,224 | ) | 8,444 | (23,834 | ) | |||||||
| Add: Dividend declared-common shares |
46,967 | 37,826 | 28,228 | |||||||||
|
|
|
|
|
|
|
|||||||
| Numerator for basic and diluted change in net assets per common share |
$ | 45,743 | $ | 46,270 | $ | 4,394 | ||||||
|
|
|
|
|
|
|
|||||||
| Denominator |
||||||||||||
| Basic weighted average common shares outstanding |
49,068 | 42,988 | 36,156 | |||||||||
| Common shares issuable |
88 | 311 | 714 | |||||||||
|
|
|
|
|
|
|
|||||||
| Weighted average common shares outstanding assuming dilution |
49,156 | 43,299 | 36,870 | |||||||||
|
|
|
|
|
|
|
|||||||
| Change in net assets per common share |
||||||||||||
| Basic |
$ | 0.93 | $ | 1.08 | $ | 0.12 | ||||||
| Diluted |
$ | 0.93 | $ | 1.07 | $ | 0.12 | ||||||
The calculation of change in net assets resulting from operations per common share—assuming dilution, excludes all anti-dilutive shares. For the years ended December 31, 2012, 2011 and 2010, the number of anti-dilutive shares, as calculated based on the weighted average closing price of the Company’s common stock for the periods, was approximately 2,574,749, 2,583,707 and 5,168,022; shares, respectively.
9. Commitments and Contingencies
The Company’s commitments and contingencies consist primarily of unused commitments to extend credit, in the form of loans to the Company’s portfolio companies. The balance of unfunded commitments to extend credit at December 31, 2012 totaled approximately $61.9 million. Since a portion of these commitments may expire without being drawn, unfunded commitments do not necessarily represent future cash requirements. In addition, the Company had approximately $70.0 million of non-binding term sheets outstanding at December 31, 2012. Non-binding outstanding term sheets are subject to completion of the Company’s due diligence and final approval process, as well as the negotiation of definitive documentation with the prospective portfolio companies. Not all non-binding term sheets are expected to close and do not necessarily represent future cash requirements.
Certain premises are leased under agreements which expire at various dates through December 2020. Total rent expense amounted to approximately $1.2 million, $1.1 million and $1.0 million during the years ended December 31, 2012, 2011 and 2010, respectively.
Future commitments under the credit facility and operating leases were as follows at December 31, 2012:
| Payments due by period (in thousands) |
||||||||||||||||||||
| Contractual Obligations(1)(2) |
Total | Less than 1 year |
1 - 3 years |
3 - 5 years |
After 5 years |
|||||||||||||||
| Borrowings(3)(4) |
$ | 596,100 | $ | — | $ | 129,300 | $ | 71,436 | $ | 395,364 | ||||||||||
| Operating Lease Obligations(5) |
8,819 | 1,245 | 2,881 | 3,044 | 1,649 | |||||||||||||||
|
|
|
|
|
|
|
|
|
|
|
|||||||||||
| Total |
$ | 604,919 | $ | 1,245 | $ | 132,181 | $ | 74,480 | $ | 397,013 | ||||||||||
|
|
|
|
|
|
|
|
|
|
|
|||||||||||
| (1) | Excludes commitments to extend credit to our portfolio companies. |
| (2) | The Company also has a warrant participation agreement with Citigroup. See Note 4. |
175
Table of Contents
| (3) | Includes $225.0 million in borrowings under the SBA debentures, $170.4 million of the 2019 Notes, $129.3 million in aggregate principal amount of the Asset-Backed Notes and $71.4 million of the Convertible Senior Notes. |
| (4) | Except for the Convertible Senior Notes, all carrying values are the same as the principal amount outstanding. The aggregate principal amount outstanding of the Convertible Senior Notes less the unaccreted discount initially recorded upon issuance of the Convertible Senior Notes was $3.6 million at December 31, 2012. |
| (5) | Long-term facility leases. |
The Company may, from time to time, be involved in litigation arising out of its operations in the normal course of business or otherwise. Furthermore, third parties may try to seek to impose liability on the Company in connection with the activities of its portfolio companies. While the outcome of any current legal proceedings cannot at this time be predicted with certainty, the Company does not expect any current matters will materially affect the Company’s financial condition or results of operations; however, there can be no assurance whether any pending legal proceedings will have a material adverse effect on the Company’s financial condition or results of operations in any future reporting period.
10. Indemnification
The Company and its executives are covered by Directors and Officers Insurance, with the directors and officers being indemnified by the Company to the maximum extent permitted by Maryland law subject to the restrictions in the 1940 Act.
11. Concentrations of Credit Risk
The Company’s customers are primarily small and medium sized companies in the biotechnology, drug discovery, drug delivery, specialty pharmaceuticals, therapeutics, clean technology, communications and networking, consumer and business products, electronics and computers, information services, internet consumer and business services and products, medical devices, semiconductor and software industry sectors. These sectors are characterized by high margins, high growth rates, consolidation and product and market extension opportunities. Value is often vested in intangible assets and intellectual property.
The largest portfolio companies vary from year to year as new loans are recorded and loans pay off. Loan revenue, consisting of interest, fees, and recognition of gains on equity interests, can fluctuate dramatically when a loan is paid off or a related equity interest is sold. Revenue recognition in any given year can be highly concentrated among several portfolio companies.
For years ended December 31, 2012 and 2011, the Company’s ten largest portfolio companies represented approximately 35.2% and 37.9% of the total fair value of the Company’s investments in portfolio companies, respectively. At December 31, 2012 and 2011, the Company had eight and seven investments, respectively, that represented 5% or more of the Company’s net assets. At December 31, 2012, the Company had six equity investments representing approximately 70.9% of the total fair value of the Company’s equity investments, and each represented 5% or more of the total fair value of the Company’s equity investments. At December 31, 2011, the Company had seven equity investments which represented approximately 63.8% of the total fair value of the Company’s equity investments, and each represented 5% or more of the total fair value of such investments.
176
Table of Contents
12. Financial Highlights
Following is a schedule of financial highlights for five years ended December 31, 2012.
HERCULES TECHNOLOGY GROWTH CAPITAL, INC.
FINANCIAL HIGHLIGHTS
(in thousands, except per share data)
| Years Ended December 31, | ||||||||||||
| 2012 | 2011 | 2010 | ||||||||||
| Per share data: |
||||||||||||
| Net asset value at beginning of period |
$ | 9.83 | $ | 9.50 | $ | 10.29 | ||||||
| Net investment income(1) |
0.98 | 0.92 | 0.81 | |||||||||
| Net realized gain (loss) on investments |
0.06 | 0.06 | (0.73 | ) | ||||||||
| Net unrealized appreciation (depreciation) on investments |
(0.09 | ) | 0.11 | 0.06 | ||||||||
|
|
|
|
|
|
|
|||||||
| Total from investment operations |
0.95 | 1.09 | 0.14 | |||||||||
| Net increase/(decrease) in net assets from capital share transactions |
(0.14 | ) | 0.07 | (0.21 | ) | |||||||
| Distributions |
(0.98 | ) | (0.90 | ) | (0.80 | ) | ||||||
| Stock-based compensation expense included in investment income(2) |
0.09 | 0.07 | 0.08 | |||||||||
|
|
|
|
|
|
|
|||||||
| Net asset value at end of period |
$ | 9.75 | $ | 9.83 | $ | 9.50 | ||||||
|
|
|
|
|
|
|
|||||||
| Ratios and supplemental data: |
||||||||||||
| Per share market value at end of period |
$ | 11.13 | $ | 9.44 | $ | 10.36 | ||||||
| Total return(3) |
28.28 | % | -0.83 | % | 7.70 | % | ||||||
| Shares outstanding at end of period.……………………… |
52,925 | 43,853 | 43,444 | |||||||||
| Weighted average number of common shares outstanding |
49,068 | 42,988 | 36,156 | |||||||||
| Net assets at end of period |
$ | 515,968 | $ | 431,041 | $ | 412,531 | ||||||
| Ratio of operating expense to average net assets |
10.28 | % | 9.61 | % | 8.25 | % | ||||||
| Ratio of net investment income to average net assets |
10.01 | % | 9.45 | % | 8.05 | % | ||||||
| Average debt outstanding |
$ | 360,857 | $ | 238,873 | $ | 142,410 | ||||||
| Weighted average debt per common share |
$ | 7.35 | $ | 5.56 | $ | 3.94 | ||||||
| (1) | For 2012, 2011 and 2010, net investment income per share is calculated as net investment income divided by the weighted average shares outstanding. |
| (2) | Stock option expense is a non-cash expense that has no effect on net asset value. Pursuant to ASC 718, net investment loss includes the expense associated with the granting of stock options which is offset by a corresponding increase in paid-in capital. |
| (3) | The total return for the period ended December 31, 2012, 2011 and 2010 equals the change in the ending market value over the beginning of period price per share plus dividends paid per share during the period, divided by the beginning price. |
177
Table of Contents
13. Senior Securities
Information about our senior securities is shown in the following table for the periods as of December 31, 2012, 2011, 2010, 2009, 2008, 2007, 2006, 2005 and 2004.
| Class and Year |
Total Amount Outstanding Exclusive of Treasury Securities(1) |
Asset Coverage per Unit(2) |
Average Market Value per Unit(3) |
|||||||||
| Bridge Loan Credit Facility with Alcmene Funding L.L.C. |
||||||||||||
| December 31, 2004 |
— | — | N/A | |||||||||
| December 31, 2005 |
$ | 25,000,000 | $ | 2,505 | N/A | |||||||
| December 31, 2006 |
— | — | N/A | |||||||||
| December 31, 2007 |
— | — | N/A | |||||||||
| December 31, 2008 |
— | — | N/A | |||||||||
| December 31, 2009 |
— | — | N/A | |||||||||
| December 31, 2010 |
— | — | N/A | |||||||||
| December 31, 2011 |
— | — | N/A | |||||||||
| December 31, 2012 |
— | — | N/A | |||||||||
| Securitized Credit Facility with Wells Fargo Capital Finance |
||||||||||||
| December 31, 2004 |
— | — | N/A | |||||||||
| December 31, 2005 |
$ | 51,000,000 | $ | 2,505 | N/A | |||||||
| December 31, 2006 |
$ | 41,000,000 | $ | 7,230 | N/A | |||||||
| December 31, 2007 |
$ | 79,200,000 | $ | 6,755 | N/A | |||||||
| December 31, 2008 |
$ | 89,582,000 | $ | 6,689 | N/A | |||||||
| December 31, 2009(6) |
— | — | N/A | |||||||||
| December 31, 2010(6) |
— | — | N/A | |||||||||
| December 31, 2011 |
$ | 10,186,830 | 73,369 | N/A | ||||||||
| December 31, 2012 |
— | — | N/A | |||||||||
| Securitized Credit Facility with Union Bank, NA |
||||||||||||
| December 31, 2004 |
— | — | N/A | |||||||||
| December 31, 2005 |
— | — | N/A | |||||||||
| December 31, 2006 |
— | — | N/A | |||||||||
| December 31, 2007 |
— | — | N/A | |||||||||
| December 31, 2008 |
— | — | N/A | |||||||||
| December 31, 2009(6) |
— | — | N/A | |||||||||
| December 31, 2010(6) |
— | — | N/A | |||||||||
| December 31, 2011(6) |
— | — | N/A | |||||||||
| December 31, 2012 |
— | — | N/A | |||||||||
| Small Business Administration Debentures (HT II)(4) |
||||||||||||
| December 31, 2004 |
— | — | N/A | |||||||||
| December 31, 2005 |
— | — | N/A | |||||||||
| December 31, 2006 |
— | — | N/A | |||||||||
| December 31, 2007 |
$ | 55,050,000 | $ | 9,718 | N/A | |||||||
| December 31, 2008 |
$ | 127,200,000 | $ | 4,711 | N/A | |||||||
| December 31, 2009 |
$ | 130,600,000 | $ | 3,806 | N/A | |||||||
| December 31, 2010 |
$ | 150,000,000 | $ | 3,942 | N/A | |||||||
| December 31, 2011 |
$ | 125,000,000 | $ | 5,979 | N/A | |||||||
| December 31, 2012 |
$ | 76,000,000 | $ | 14,786 | N/A | |||||||
| Small Business Administration Debentures (HT III)(5) |
||||||||||||
| December 31, 2004 |
— | — | N/A | |||||||||
| December 31, 2005 |
— | — | N/A | |||||||||
| December 31, 2006 |
— | — | N/A | |||||||||
| December 31, 2007 |
— | — | N/A | |||||||||
| December 31, 2008 |
— | — | N/A | |||||||||
| December 31, 2009 |
— | — | N/A | |||||||||
| December 31, 2010 |
$ | 20,000,000 | $ | 29,564 | N/A | |||||||
| December 31, 2011 |
$ | 100,000,000 | $ | 7,474 | N/A | |||||||
| December 31, 2012 |
$ | 149,000,000 | $ | 7,542 | N/A | |||||||
178
Table of Contents
| Class and Year |
Total Amount Outstanding Exclusive of Treasury Securities(1) |
Asset Coverage per Unit(2) |
Average Market Value per Unit(3) |
|||||||||
| Senior Convertible Notes |
||||||||||||
| December 31, 2011 |
$ | 70,352,983 | $ | 10,623 | $ | 885 | ||||||
| December 31, 2012 |
$ | 71,435,783 | $ | 15,731 | $ | 1,038 | ||||||
| April 2019 Notes Payable |
||||||||||||
| December 31, 2012 |
$ | 84,489,500 | $ | 13,300 | $ | 986 | ||||||
| September 2019 Notes Payable |
||||||||||||
| December 31, 2012 |
$ | 85,875,000 | $ | 13,086 | $ | 1,003 | ||||||
| Asset-Backed Notes |
||||||||||||
| December 31, 2012 |
$ | 129,300,000 | $ | 8,691 | $ | 1,000 | ||||||
| (1) | Total amount of each class of senior securities outstanding at the end of the period presented, rounded to nearest thousand. |
| (2) | The asset coverage ratio for a class of senior securities representing indebtedness is calculated as our consolidated total assets, less all liabilities and indebtedness not represented by senior securities, divided by senior securities representing indebtedness. This asset coverage ratio is multiplied by $1,000 to determine the Asset Coverage per Unit. |
| (3) | Not applicable because senior securities are not registered for public trading. |
| (4) | Issued by HT II, one of our SBIC subsidiaries, to the SBA. These categories of senior securities were not subject to the asset coverage requirements of the 1940 Act. |
| (5) | Issued by HT III, one of our SBIC subsidiaries, to the SBA. These categories of senior securities were not subject to the asset coverage requirements of the 1940 Act. |
| (6) | The Company’s Wells Facility and Union Bank Facility had no borrowings outstanding during the periods noted above. |
14. Selected Quarterly Data (Unaudited)
The following tables set forth certain quarterly financial information for each of the last eight quarters ended December 31, 2012. This information was derived from the Company’s unaudited consolidated financial statements. Results for any quarter are not necessarily indicative of results for the full year or for any further quarter.
| Quarter Ended | ||||||||||||||||
| (in thousands, except per share data) |
3/31/2012 | 6/30/2012 | 9/30/2012 | 12/31/2012 | ||||||||||||
| Total investment income |
$ | 22,367 | $ | 23,858 | $ | 23,901 | $ | 27,395 | ||||||||
| Net investment income before provision for income taxes and investment gains and losses |
11,375 | 12,310 | 11,351 | 13,071 | ||||||||||||
| Net increase (decrease) in net assets resulting from operations |
17,105 | 48 | 4,745 | 24,861 | ||||||||||||
| Change in net assets per common share (basic) |
0.36 | — | 0.09 | 0.47 | ||||||||||||
| Quarter Ended | ||||||||||||||||
| 3/31/2011 | 6/30/2011 | 9/30/2011 | 12/31/2011 | |||||||||||||
| Total investment income |
$ | 19,152 | $ | 20,820 | $ | 18,684 | $ | 21,200 | ||||||||
| Net investment income before provision for income taxes and investment gains and losses |
9,804 | 10,360 | 8,593 | 10,831 | ||||||||||||
| Net increase (decrease) in net assets resulting from operations |
(1,177 | ) | 24,317 | 6,223 | 17,574 | |||||||||||
| Change in net assets per common share (basic) |
0.23 | 0.56 | 0.14 | 0.25 | ||||||||||||
15. Subsequent Events
Dividend Declaration
On February 26, 2013 the Board of Directors increased the quarterly dividend by $0.01, or approximately 4.02%, and declared a cash dividend of $0.25 per share to be paid on March 19, 2013 to shareholders of record as of March 11, 2013. This dividend will represent the Company’s thirtieth consecutive dividend declaration since its initial public offering, bringing the total cumulative dividend declared to date to $7.89 per share.
179
Table of Contents
| Item 9. | Changes in and Disagreements with Accountants on Accounting and Financial Disclosure |
Not Applicable.
| Item 9a. | Controls and Procedures |
1. Disclosure Controls and Procedures
The management of Hercules Technology Growth Capital, Inc. (the “Company”) has established disclosure controls and procedures to ensure that the information required to be disclosed by the Company in the reports that it files or submits under the Exchange Act is recorded, processed, summarized and reported within the time periods specified in SEC rules and forms and that such information is accumulated and communicated to management of the Company, with the participation of its Chief Executive Officer and Chief Financial Officer, as appropriate, to allow timely decisions regarding required disclosure.
As of the end of the period covered by this report, we carried out an evaluation, under the supervision and with the participation of our management, including our Chief Executive Officer, Chief Financial and Accounting Officer, of the effectiveness of the design and operation of our disclosure controls and procedures (as defined in Rule 13a-15(e) of the Securities Exchange Act of 1934). Based on that evaluation, our Chief Executive Officer and Chief Financial Officer have concluded that our disclosure controls and procedures are effective.
2. Internal Control Over Financial Reporting
a. Management’s Annual Report on Internal Control Over Financial Reporting
The Company is responsible for establishing and maintaining adequate internal control over financial reporting and for the assessment of the effectiveness of internal control over financial reporting. As defined by the SEC, internal control over financial reporting is a process designed under the supervision of the Company’s principal executive and principal financial and accounting officer, approved and monitored by the Company’s Board of Directors, and implemented by management and other personnel, to provide reasonable assurance regarding the reliability of financial reporting and the preparation of financial statements in accordance with U.S. generally accepted accounting principles.
The Company’s internal control over financial reporting is supported by written policies and procedures, that (1) pertain to the maintenance of records that, in reasonable detail, accurately and fairly reflect the transactions and dispositions of the Company’s assets; (2) provide reasonable assurance that transactions are recorded as necessary to permit preparation of financial statements in accordance with generally accepted accounting principles, and that receipts and expenditures of the Company are being made only in accordance with authorizations of the Company’s management and directors; and (3) provide reasonable assurance regarding prevention or timely detection of unauthorized acquisition, use or disposition of the Company’s assets that could have a material effect on the financial statements.
Because of its inherent limitations, internal control over financial reporting may not prevent or detect misstatements. Also, projections of any evaluation of effectiveness to future periods are subject to the risk that controls may become inadequate because of changes in conditions, or that the degree of compliance with the policies or procedures may deteriorate.
Management of the Company conducted an assessment of the effectiveness of the Company’s internal control over financial reporting as of December 31, 2012 based on criteria established in Internal Control— Integrated Framework issued by the Committee of Sponsoring Organizations of the Treadway Commission (“the COSO Framework”). Based on this assessment, management has concluded that the Company’s internal control over financial reporting was effective as of December 31, 2012.
180
Table of Contents
Report of the Independent Registered Public Accounting Firm
The effectiveness of the Company’s internal control over financial reporting as of December 31, 2012 has been audited by Pricewaterhousecoopers LLP, an independent registered public accounting firm who also audited the Company’s consolidated financial statements, as stated in their report, which is included in this Annual Report on Form 10-K.
Changes in Internal Control Over Financial Reporting in 2012
There have been no changes in our internal control over financing reporting, as defined in Rules 13a-15(f) and 15d-15(f) of the Securities Exchange Act of 1934, that occurred during the Company’s most recently completed fiscal quarter that has materially affected, or is reasonably likely to materially affect, the Company’s internal control over financial reporting.
| Item 9B. | Other Information |
None.
181
Table of Contents
| Item 10. | Directors, Executive Officers and Corporate Governance |
Information in response to this Item is incorporated herein by reference to the information provided in our definitive Proxy Statement for our 2013 Annual Meeting of Shareholders (the “2013 Proxy Statement”) to be filed with the Securities and Exchange Commission pursuant to Regulation 14A under the Securities Exchange Act of 1934 under the headings “Proposal I: Election Of Directors,” “Information About Executive Officers Who Are Not Directors” and “Certain Relationships And Transactions.”
We have adopted a code of business conduct and ethics that applies to directors, officers and employees. The code of business conduct and ethics is available on our website at http//www.htgc.com. We will report any amendments to or waivers of a required provision of the code of business conduct and ethics on our website or in a Form 8-K.
| Item 11. | Executive Compensation |
The information with respect to compensation of executives and directors is contained under the caption “Compensation of Executive Officers and Directors” in our 2013 Proxy Statement and is incorporated in this Annual Report by reference in response to this item.
| Item 12. | Security Ownership of Certain Beneficial Owners and Management and Related Stockholder Matters |
The information with respect to security ownership of certain beneficial owners and management is contained under the captions “Security Ownership of Certain Beneficial Owners and Management” and “Compensation of Executive Officers and Directors” in our 2013 Proxy Statement and is incorporated in this Annual Report by reference in response to this item.
| Item 13. | Certain Relationships and Related Transactions and Director Independence |
The information with respect to certain relationships and related transactions is contained under the caption “Certain Relationships and Transactions” and the caption “Proposal I: Election of Directors” in our 2013 Proxy Statement and is incorporated in this Annual Report by reference in response to this item.
| Item 14. | Principal Accountant Fees and Services |
The information with respect to principal accountant fees and services is contained under the captions “Principal Accountant Fees and Services” and “Proposal II: Ratification of Selection of Independent Registered Public Accountants” in our 2013 Proxy Statement and is incorporated in this Annual Report by reference to this item.
182
Table of Contents
| Item 15. | Exhibits and Financial Statement Schedules |
1. Financial Statements
The following financial statements of Hercules Technology Growth Capital, Inc. (the “Company” or the “Registrant”) are filed herewith:
2. The following financial statement schedule is filed herewith:
| Schedule 12-14 Investments In and Advances to Affiliates |
184 |
3. Exhibits required to be filed by Item 601 of Regulation S-K.
183
Table of Contents
HERCULES TECHNOLOGY GROWTH CAPITAL, INC.
SCHEDULE OF INVESTMENTS IN AND ADVANCES TO AFFILIATES
As of and for the year ended December 31, 2012
(in thousands)
| Portfolio Company |
Investment(1) | Amount of Interest Credited to Income(2) |
As of December 31, 2011 Fair Value |
Gross Additions(3) |
Gross Reductions(4) |
As of December 31, 2012 Fair Value |
||||||||||||||||
| Affiliate Investments |
||||||||||||||||||||||
| E-band Communications, Inc. |
Senior Debt | $ | 4 | $ | — | $ | 356 | $ | (356 | ) | $ | — | ||||||||||
| Preferred Stock | — | — | 374 | (374 | ) | — | ||||||||||||||||
| Gelesis |
Senior Debt | 712 | 3,254 | — | (3,254 | ) | — | |||||||||||||||
| Preferred Stock | — | 1,147 | 423 | — | 1,570 | |||||||||||||||||
| Preferred Warrants | — | 106 | — | (11 | ) | 95 | ||||||||||||||||
| Optiscan |
Senior Debt | 1,649 | 11,147 | — | (1,657 | ) | 9,490 | |||||||||||||||
| Preferred Stock | — | 2,468 | — | (1,903 | ) | 565 | ||||||||||||||||
| Preferred Warrants | — | 872 | — | (720 | ) | 152 | ||||||||||||||||
|
|
|
|
|
|
|
|
|
|
|
|||||||||||||
| Total Control and Affliate Investments |
$ | 2,365 | $ | 18,994 | $ | 1,153 | $ | (8,275 | ) | $ | 11,872 | |||||||||||
|
|
|
|
|
|
|
|
|
|
|
|||||||||||||
| (1) | Stock and warrants are generally non-income producing and restricted. The principal amount for debt is shown in the Consolidated Schedule of Investments as of December 31, 2012. |
| (2) | Represents the total amount of interest or dividends credited to income for the year an investment was an affiliate or control investment. |
| (3) | Gross additions include increases in the cost basis of investments resulting from new portfolio investments, paid-in-kind interest or dividends, the amortization of discounts and closing fees and the exchange of one or more existing securities for one or more new securities. Gross additions also include net increase in unrealized appreciation or net decreases in unrealized depreciation. |
| (4) | Gross reductions include decreases in the cost basis of investments resulting from principal repayments or sales and the exchange of one or more existing securities for one or more new securities. Gross reductions also include net increase in unrealized depreciation or net decreases in unrealized appreciation. |
184
Table of Contents
3. Exhibits
Please note that the agreements included as exhibits to this Form 10-K are included to provide information regarding their terms and are not intended to provide any other factual or disclosure information about us or the other parties to the agreements. The agreements contain representations and warranties by each of the parties to the applicable agreement that have been made solely for the benefit of the other parties to the applicable agreement and may not describe the actual state of affairs as of the date they were made or at any other time.
| Exhibit |
Description | |
| 3(a) | Articles of Amendment and Restatement.(8) | |
| 3(b) | Articles of Amendment, dated March 6, 2007.(7) | |
| 3(c) | Articles of Amendment, dated April 5, 2011.(22) | |
| 3(d) | Amended and Restated Bylaws.(8) | |
| 4(a) | Specimen certificate of the Company’s common stock, par value $.001 per share.(1) | |
| 4(b) | Form of Dividend Reinvestment Plan.(1) | |
| 4(c) | Indenture between Hercules Funding Trust I and U.S. Bank National Association, dated as of August 1, 2005.(2) | |
| 4(d) | Indenture between Hercules Technology Growth Capital, Inc. and U.S. Bank National Association, dated as of April 15, 2011.(23) | |
| 4(e) | Form of Note under the Indenture, dated as of April 15, 2011.(23) | |
| 4(f) | Indenture between the Registrant and U.S. Bank National Association, dated as of March 6, 2012.(26) | |
| 4(g) | First Supplemental Indenture between the Registrant and U.S. Bank National Association, dated as of April 17, 2012.(26) | |
| 4(h) | Second Supplemental Indenture between the Registrant and U.S. Bank National Association, dated as of September 24, 2012.(29) | |
| 4(i) | Form of 7.00% Senior Note due 2019, dated as of April 17, 2012 (Existing April 2019 Note) (included as part of Exhibit 4(g)).(26) | |
| 4(j) | Form of 7.00% Senior Note due 2019, dated as of July 6, 2012 (Additional April 2019 Note).(27) | |
| 4(k) | Form of 7.00% Senior Note due 2019, dated as of July 12, 2012 (Over-Allotment April 2019 Note).(28) | |
| 4(l) | Form of 7.00% Senior Note due 2019, dated as of September 24, 2012 (September 2019 Note) (included as part of Exhibit 4(h)).(29) | |
| 4(m) | Form of 7.00% Senior Note due 2019, dated as of October 2, 2012 (Over-Allotment September 2019 Note).(30) | |
| 4(n) | Form of 7.00% Senior Note due 2019, dated as of October 17, 2012 (Over-Allotment II September 2019 Note).(31) | |
| 10(a) | Credit Agreement between Hercules Technology Growth Capital, Inc. and Alcmene Funding, L.L.C., dated as of April 12, 2005.(8) | |
| 10(b) | Pledge and Security Agreement between Hercules Technology Growth Capital, Inc. and Alcmene Funding, L.L.C., dated as of April 12, 2005.(8) | |
| 10(c) | First Amendment to Credit and Pledge Security Agreement between Hercules Technology Growth Capital, Inc. and Alcmene Funding L.L.C., dated as of August 1, 2005.(2) | |
| 10(d) | Second Amendment to Credit and Pledge and Security Agreement by and among Hercules Technology Growth Capital, Inc. and Alcmene Funding, L.L.C., as lender and administrative agent for the lenders, dated as of March 6, 2006.(12) | |
185
Table of Contents
| Exhibit |
Description | |
| 10(e) | Loan Sale Agreement between Hercules Funding LLC and Hercules Technology Growth Capital, Inc., dated as of August 1, 2005.(2) | |
| 10(f) | Sale and Servicing Agreement among Hercules Funding Trust I, Hercules Funding LLC, Hercules Technology Growth Capital, Inc., U.S. Bank National Association and Lyon Financial Services, Inc., dated as of August 1, 2005.(2) | |
| 10(g) | Indenture between Hercules Funding Trust I & U.S. Bank National Association, dated as of August 1, 2005.(2) | |
| 10(h) | Note Purchase Agreement among Hercules Funding Trust I, Hercules Funding I LLC, Hercules Technology Growth Capital, Inc. and Citigroup Global Markets Realty Corp., dated as of August 1, 2005.(2) | |
| 10(i) | Hercules Technology Growth Capital, Inc. 2004 Equity Incentive Plan (2011 Amendment and Restatement).(10) | |
| 10(j) | Hercules Technology Growth Capital, Inc. 2006 Non-Employee Director Plan (2007 Amendment and Restatement).(11) | |
| 10(k) | Form of Custody Agreement between the Company and Union Bank of California.(8) | |
| 10(l) | Form of Restricted Stock Award under the 2004 Equity Incentive Plan.(19) | |
| 10(m) | Subscription Agreement by and among the Company and the subscribers named therein, dated as of March 2, 2006.(17) | |
| 10(n) | Form of Incentive Stock Option Award under the 2004 Equity Incentive Plan.(8) | |
| 10(o) | Form of No statutory Stock Option Award under the 2004 Equity Incentive Plan.(8) | |
| 10(p) | Form of Registrar Transfer Agency and Service Agreement between the Company and American Stock Transfer & Trust Company.(8) | |
| 10(q) | Warrant Agreement, dated as of June 22, 2004, between the Company and American Stock Transfer & Trust Company, as warrant agent.(9) | |
| 10(r) | Subscription Agreement, dated as of February 2, 2004, between the Company and the subscribers named therein.(8) | |
| 10(s) | Lease Agreement, dated as of June 13, 2006, between the Company and 400 Hamilton Associates.(4) | |
| 10(t) | Third Amendment to Sale and Servicing Agreement among Hercules Funding Trust I, Hercules Funding LLC, Hercules Technology Growth Capital, Inc., U.S. Bank National Association and Lyon Financial Services, Inc., dated as of July 28, 2006.(5) | |
| 10(u) | Second Omnibus Amendment by and among Hercules Funding Trust I, Hercules Funding I LLC, Hercules Technology Growth Capital, Inc., U.S. Bank National Association, Lyon Financial Services, Inc. and Citigroup Global Markets Realty Corp., dated as of December 6, 2006.(6) | |
| 10(v) | Fifth Amendment to Sale and Servicing Agreement by and among Hercules Funding Trust I, Hercules Funding I, LLC, Hercules Technology Growth Capital, Inc., U.S. Bank National Association, Lyon Financial Services, Inc. and Citigroup Global Markets Realty Corp., dated as of March 30, 2007.(13) | |
| 10(w) | Amended and Restated Sale and Servicing Agreement by and among Hercules Funding Trust I, Hercules Funding I LLC, the Company, U.S. Bank National Association, Lyon Financial Services, Inc., Citigroup Global Markets Inc., and Deutsche Bank AG, dated as of May 2, 2007.(14) | |
| 10(x) | Fourth Amendment to the Warrant Participation Agreement by and among Hercules Technology Growth Capital, Inc. and Citigroup Global Markets Realty Corp., dated as of May 2, 2007.(15) | |
| 10(y) | Amended and Restated Note Purchase Agreement by and among the Company, Hercules Funding Trust I, Hercules Funding I LLC, and Citigroup Global Markets, Inc., dated as of May 2, 2007.(15) | |
186
Table of Contents
| Exhibit |
Description | |
| 10(z) | First Amendment to Amended and Restated Note Purchase Agreement by and among the Company, Hercules Funding Trust I, Hercules Funding I LLC, and Citigroup Global Markets, Inc., dated as of May 7, 2008.(16) | |
| 10(aa) | Second Amendment to Amended and Restated Sale and Servicing Agreement by and among Hercules Funding Trust I, Hercules Funding I LLC, the Company, U.S. Bank National Association, Lyon Financial Services, Inc., Citigroup Global Markets Inc., and Deutsche Bank AG, dated as of May 7, 2008.(16) | |
| 10(bb) | Loan and Security Agreement by and among Hercules Funding II LLC and Wells Fargo Foothill, LLC, dated as of August 25, 2008.(18) | |
| 10(cc) | Sale and Servicing Agreement among Hercules Funding II LLC, the Company, Lyon Financial Services, Inc., and Wells Fargo Foothill, LLC, dated as of August 25, 2008.(18) | |
| 10(dd) | Form of SBA Debenture.(19) | |
| 10(ee) | First Amendment to Loan and Security Agreement by and among Hercules Funding II, LLC and Wells Fargo Foothill, LLC, dated as of April 30, 2009.(20) | |
| 10(ff) | Loan and Security Agreement by Hercules Technology Growth Capital, Inc. and Union Bank, N.A., dated as of February 10, 2010.(21) | |
| 10(gg) | Second Amendment to Loan and Security Agreement by and among Hercules Funding II LLC and Wells Fargo Capital Finance, LLC (f/k/a Wells Fargo Foothill, LLC), dated as of June 20, 2011.(24) | |
| 10(hh) | Amended and Restated Loan and Security Agreement between the Company and Union Bank, N.A., dated as of November 2, 2011.(25) | |
| 10(ii) | Second Amendment to Loan and Security Agreement by and among Hercules Funding II LLC and Wells Fargo Capital Finance, LLC (f/k/a Wells Fargo Foothill, LLC), dated as of June 20, 2011. (24) | |
| 10(jj) | First Amendment to Amended and Restated Loan and Security Agreement by and between Hercules Technology Growth Capital, Inc. and Union Bank, N.A., dated as of March 30, 2012.(32) | |
| 10(kk) | Third Amendment to Loan and Security Agreement by and among Hercules Funding II LLC and Wells Fargo Capital Finance, LLC (f/k/a Wells Fargo Foothill, LLC), dated as of August 1, 2012.(33) | |
| 10(ll) | Second Amendment to Amended and Restated Loan and Security Agreement by and between Hercules Technology Growth Capital, Inc. and Union Bank, N.A., dated as of September 17, 2012.(34) | |
| 10(mm) | Third Amendment to Amended and Restated Loan and Security Agreement by and between Hercules Technology Growth Capital, Inc. and Union Bank, N.A., dated as of December 17, 2012.(34) | |
| 10(nn) | First Omnibus Amendment by and among Hercules Funding Trust I, Hercules Funding I, LLC, Hercules Technology Growth Capital, Inc., U.S. Bank National Association, Lyon Financial Services, Inc. and Citigroup Global Markets Realty Corp., dated as of March 6, 2006. (12) | |
| 10(oo) | Intercreditor Agreement among Hercules Technology Growth Capital, Inc., Alcmene Funding, L.L.C. and Citigroup Global Markets Realty Corp., dated as of March 6, 2006.(12) | |
| 10(pp) | Warrant Participation Agreement between the Company and Citigroup Global Markets Realty Corp., dated as of August 1, 2005.(35) | |
| 10(qq) | Indenture by and between Hercules Capital Funding Trust 2012-1 and U.S. Bank National Association, dated as of December 19, 2012.(36) | |
| 10(rr) | Amended and Restated Trust Agreement by and between Hercules Capital Funding 2012-1 LLC and Wilmington Trust, National Association, dated as of December 19, 2012.(36) | |
187
Table of Contents
| Exhibit |
Description | |
| 10(ss) | Sale and Servicing Agreement by and Among Hercules Capital Funding 2012-1 LLC, Hercules Capital Funding Trust 2012-1 LLC, Hercules Technology Growth Capital, Inc. and U.S. Bank National Association, dated as of December 19, 2012.(36) | |
| 10(tt) | Sale and Contribution Agreement by and between Hercules Technology Growth Capital, Inc. and Hercules Capital Funding 2012-1 LLC, dated as of December 19, 2012. (36) | |
| 10(uu) | Note Purchase Agreement among the Hercules Technology Growth Capital, Inc., Hercules Capital Funding 2012-1 LLC, as Trust Depositor, Hercules Capital Funding Trust 2012-1, as Issuer, and Guggenheim Securities, LLC, as Initial Purchaser, dated as of December 12, 2012. (36) | |
| 10(vv) | Administration Agreement between Hercules Capital Funding Trust 2012-1LLC, Hercules Technology Growth Capital, Inc, Wilmington Trust, National Association, and U.S. Bank National Association, dated as of December 19, 2012.(36) | |
| 10(ww) | Third Amendment to Amended and Restated Loan and Security Agreement by and between Hercules Technology Growth Capital, Inc. and Union Bank N.A., dated as of December 19, 2012.(36) | |
| 14 | Code of Ethics.(8) | |
| 21.1* | List of Subsidiaries. | |
| 23.1* | Consent of PricewaterhouseCoopers LLP, independent registered public accounting firm. | |
| 31(a)* | Certification of Chief Executive Officer Pursuant to Rule 13a-14(a) under the Securities Exchange Act of 1934 | |
| 31(b)* | Certification of Chief Financial Officer Pursuant to Rule 13a-14(a) under the Securities Exchange Act of 1934 | |
| 32(a)* | Certification of Chief Executive Officer Pursuant to 18 U.S.C. Section 1350, as Adopted Pursuant to Section 906 of the Sarbanes-Oxley Act of 2002 (18 U.S.C. 1350). | |
| 32(b)* | Certification of Chief Financial Officer Pursuant to 18 U.S.C. Section 1350, as Adopted Pursuant to Section 906 of the Sarbanes-Oxley Act of 2002 (18 U.S.C. 1350). | |
| (1) | Previously filed as part of Pre-Effective Amendment No. 2, as filed on June 8, 2005 (Registration No. 333-122950), to the Registration Statement on Form N-2 of the Company. |
| (2) | Previously filed as part of the Current Report on Form 8-K of the Company, as filed on August 5, 2005. |
| (3) | Previously filed as part of the Current Report on Form 8-K of the Company, as filed on March 2, 2006. |
| (4) | Previously filed as part of the Current Report on Form 8-K of the Company, as filed on June 13, 2006. |
| (5) | Previously filed as part of the Current Report on Form 8-K of the Company, as filed on July 28, 2006. |
| (6) | Previously filed as part of the Current Report on Form 8-K of the Company, as filed on December 6, 2006. |
| (7) | Previously filed as part of the Current Report on Form 8-K of the Company, as filed on March 9, 2007. |
| (8) | Previously filed as part of a Pre-Effective Amendment No. 1, as filed on May 17, 2005 (File No. 333-122950), to the Registration Statement on Form N-2 of the Company. |
| (9) | Previously filed as part of the Registration Statement on Form N-2 of the Company (File No. 333-122950), as filed on February 22, 2005. |
| (10) | Previously filed as part of the Securities to be Offered to Employees in Employee Benefit Plans on Form S-8, as filed on June 22, 2007 and the Definitive Proxy Statement of the Company, as filed on April 29, 2011. |
| (11) | Previously filed as part of the Securities to be Offered to Employees in Employee Benefit Plans on Form S-8, as filed on October 10, 2007. |
| (12) | Previously filed as part of the Post-Effective Amendment No. 3, as filed on March 9, 2006 (File No. 333-126604), to the Registration Statement on Form N-2 of the Company. |
| (13) | Previously filed as part of the Current Report on Form 8-K of the Company, as filed on April 3, 2007. |
| (14) | Previously filed as part of the Current Report on Form 8-K of the Company, as filed on May 5, 2007. |
| (15) | Previously filed as part of the Pre-Effective Amendment No. 1, as filed on May 15, 2007 (File No. 333-141828), to the Registration Statement on Form N-2 of the Company. |
| (16) | Previously filed as part of Pre-Effective Amendment No. 2, as filed on June 5, 2008 (File No. 333-150403 ), to the Registration Statement on Form N-2 of the Company. |
188
Table of Contents
| (17) | Previously filed as part of the Post-Effective Amendment No. 3, as filed on March 9, 2006 (File No. 333-126604), to the Registration Statement on Form N-2 of the Company. |
| (18) | Previously filed as part of the Current Report on Form 8-K of the Company, as filed on August 27, 2008. |
| (19) | Previously filed as part of the Annual Report on Form 10-K of the Company, as filed on March 16, 2009. |
| (20) | Previously filed as part of the Quarterly Report on Form 10-Q of the Company, as filed on May 11, 2009. |
| (21) | Previously filed as part of the Current Report on Form 8-K of the Company, as filed on February 17, 2010. |
| (22) | Previously filed as part of the Current Report on Form 8-K of the Company, as filed on April 11, 2011. |
| (23) | Previously filed as part of the Current Report on Form 8-K of the Company, as filed on April 18, 2011. |
| (24) | Previously filed as part of the Current Report on Form 8-K of the Company, as filed on June 24, 2011. |
| (25) | Previously filed as part of the Current Report on Form 8-K of the Company, as filed on November 11, 2011. |
| (26) | Previously filed as part of Post-Effective Amendment No. 1, as filed on April 17, 2012 (File No. 333-179431), to the Registration Statement on Form N-2 of the Company. |
| (27) | Previously filed as part of Post-Effective Amendment No. 2, as filed on July 6, 2012 (File No. 333-179431), to the Registration Statement on Form N-2 of the Company. |
| (28) | Previously filed as part of Post-Effective Amendment No. 3, as filed on July 12, 2012 (File No. 333-179431), to the Registration Statement on Form N-2 of the Company. |
| (29) | Previously filed as part of Post-Effective Amendment No. 5, as filed on September 24, 2012 (File No. 333-179431), to the Registration Statement on Form N-2 of the Company. |
| (30) | Previously filed as part of Post-Effective Amendment No. 7, as filed on October 2, 2012 (File No. 333-179431), to the Registration Statement on Form N-2 of the Company. |
| (31) | Previously filed as part of Post-Effective Amendment No. 8, as filed on October 17, 2012 (File No. 333-179431), to the Registration Statement on Form N-2 of the Company. |
| (32) | Previously filed as part of the Quarterly Report on Form 10-Q of the Company, as filed on May 8, 2012. |
| (33) | Previously filed as part of the Current Report on Form 8-K of the Company, as filed on August 2, 2012. |
| (34) | Previously filed as part of Post-Effective Amendment No. 4, as filed on September 17, 2012 (File No. 333-179431), to the Registration Statement on Form N-2 of the Company. |
| (35) | Previously filed as part of the Pre-Effective Amendment No. 1, as filed on October 17, 2006 (File No. 333-136918), to the Registration Statement on Form N-2 of the Company. |
| (36) | Previously filed as part of the Current Report on Form 8-K of the Company, as filed on December 17, 2012. |
| * | Filed herewith |
189
Table of Contents
Pursuant to the requirements of Section 13 or 15(d) of the Securities Exchange Act of 1934, the registrant has duly caused this report to be signed on its behalf by the undersigned, thereunto duly authorized.
| HERCULES TECHNOLOGY GROWTH CAPITAL, INC. | ||||
| Date: February 28, 2013 | By: | /S/ MANUEL A. HENRIQUEZ | ||
| Manuel A. Henriquez | ||||
| Chief Executive Officer | ||||
In accordance with the Securities Exchange Act of 1934, this report has been signed below by the following persons on behalf of the registrant and in the following capacities on February 28, 2013.
| Signature |
Title |
Date | ||
| /S/ MANUEL A. HENRIQUEZ Manuel A. Henriquez |
Chairman of the Board, President and Chief Executive Officer (principal executive officer) | February 28, 2013 | ||
| /S/ JESSICA BARON Jessica Baron |
Vice President Finance and Chief Financial Officer (principal accounting officer) |
February 28, 2013 | ||
| /S/ ALLYN C. WOODWARD, JR Allyn C. Woodward, Jr. |
Director | February 28, 2013 | ||
| /S/ JOSEPH W. CHOW Joseph W. Chow |
Director | February 28, 2013 | ||
| /S/ ROBERT P. BADAVAS Robert P. Badavas |
Director | February 28, 2013 | ||
190
Table of Contents
EXHIBIT INDEX
| Exhibit Number |
Descriptions | |
| 21.1 | List of Subsidiaries | |
| 23.1 | Consent of PricewaterhouseCoopers LLP, independent registered public accounting firm. | |
| 31.1 | Certification of Chief Executive Officer pursuant to Rules 13a-14(a) and 15d-14(a) under the Securities Exchange Act of 1934, as amended, as adopted pursuant to Section 302 of Sarbanes-Oxley Act of 2002* | |
| 31.2 | Certification of Chief Financial Officer pursuant to Rules 13a-14(a) and 15d-14(a) under the Securities Exchange Act of 1934, as amended, as adopted pursuant to Section 302 of Sarbanes-Oxley Act of 2002* | |
| 32.1 | Certification of Chief Executive Officer pursuant to 18 U.S.C. Section 1350, as adopted pursuant to Section 906 of Sarbanes-Oxley Act of 2002† | |
| 32.2 | Certification of Chief Financial Officer pursuant to 18 U.S.C. Section 1350, as adopted pursuant to Section 906 of Sarbanes-Oxley Act of 2002† | |