Attached files
| file | filename |
|---|---|
| 8-K - CURRENT REPORT OF MATERIAL EVENTS OR CORPORATE CHANGES - Helmerich & Payne, Inc. | a13-6237_18k.htm |
Exhibit 99.1
|
|
Helmerich & Payne, Inc. Meetings with Investors March 1, 2013 |
|
|
Statements within this presentation are “forward-looking statements” within the meaning of the Securities Act of 1933 and the Securities Exchange Act of 1934, and are based on current expectations and assumptions that are subject to risks and uncertainties. All statements other than statements of historical facts included in this release, including, without limitation, statements regarding the registrant’s future financial position, business strategy, budgets, projected costs and plans and objectives of management for future operations, are forward looking statements. For information regarding risks and uncertainties associated with the Company’s business, please refer to the “Risk Factors” and “Management’s Discussion & Analysis of Financial Condition and Results of Operations” sections of the Company’s SEC filings, including but not limited to, its annual report on Form 10-K and quarterly reports on Form 10-Q. As a result of these factors, Helmerich & Payne, Inc.’s actual results may differ materially from those indicated or implied by such forward-looking statements. We undertake no duty to update or revise our forward-looking statements based on changes in internal estimates, expectations or otherwise, except as required by law. Forward-looking Statements |
|
|
H&P’s Global Rig Fleet * Estimates include existing rigs and announced new build commitments. |
|
|
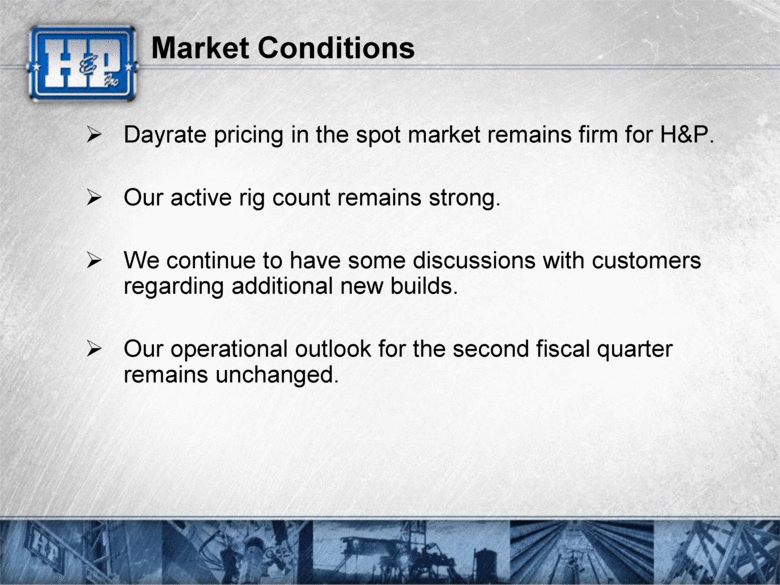
Market Conditions Dayrate pricing in the spot market remains firm for H&P. Our active rig count remains strong. We continue to have some discussions with customers regarding additional new builds. Our operational outlook for the second fiscal quarter remains unchanged. |
|
|
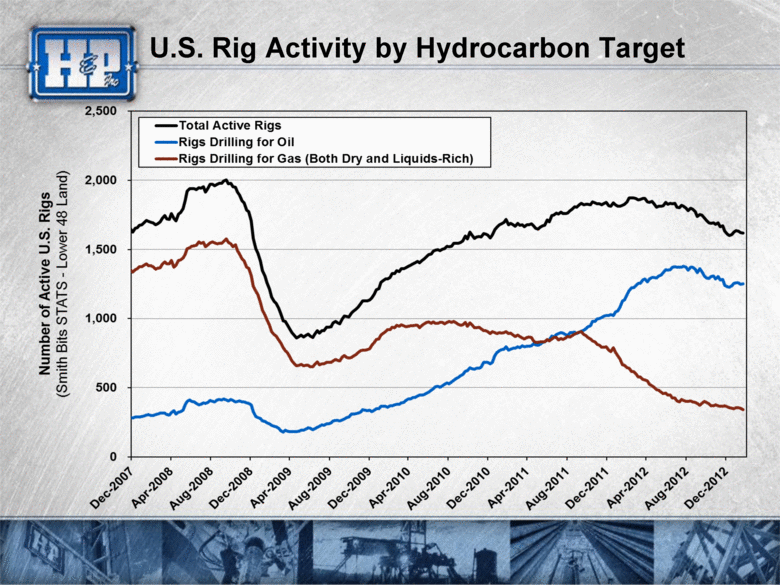
U.S. Rig Activity by Hydrocarbon Target |
|
|
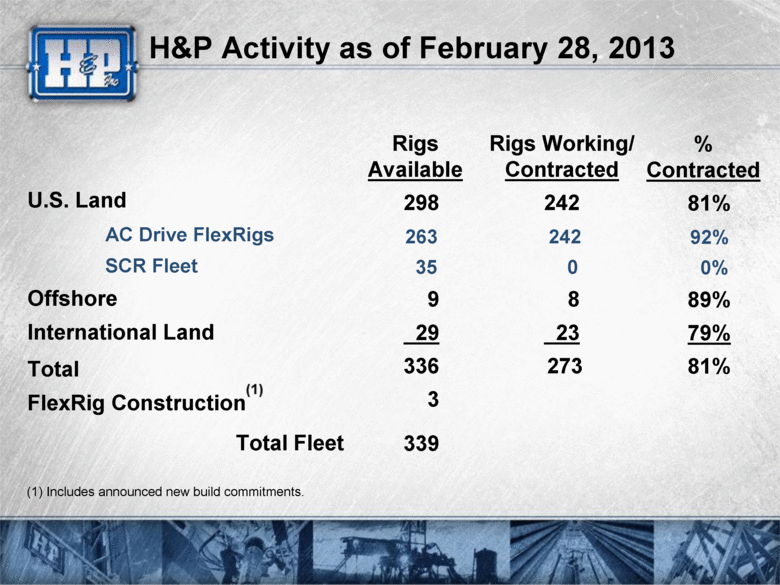
H&P Activity as of February 28, 2013 Rigs Working/ Contracted 242 242 0 8 23 273 Rigs Available 298 263 35 9 29 336 3 339 % Contracted 81% 92% 0% 89% 79% 81% U.S. Land AC Drive FlexRigs SCR Fleet Offshore International Land Total FlexRig Construction Total Fleet Includes announced new build commitments. |
|
|
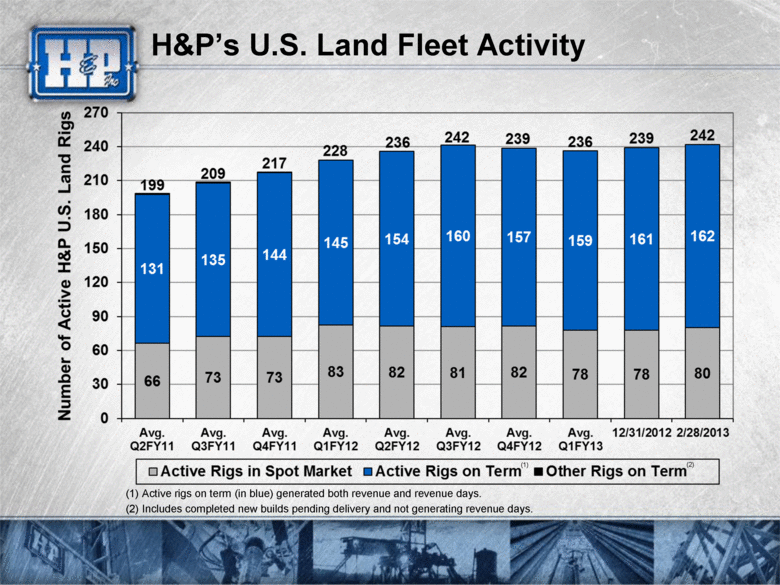
H&P’s U.S. Land Fleet Activity (1) (2) (1) Active rigs on term (in blue) generated both revenue and revenue days. (2) Includes completed new builds pending delivery and not generating revenue days. |
|
|
(H&P Contracted Land Rigs as of 2/28/13*) Leading U.S. Unconventional Driller * Includes announced new FlexRigs with customer commitments scheduled for delivery in fiscal 2013. |
|
|
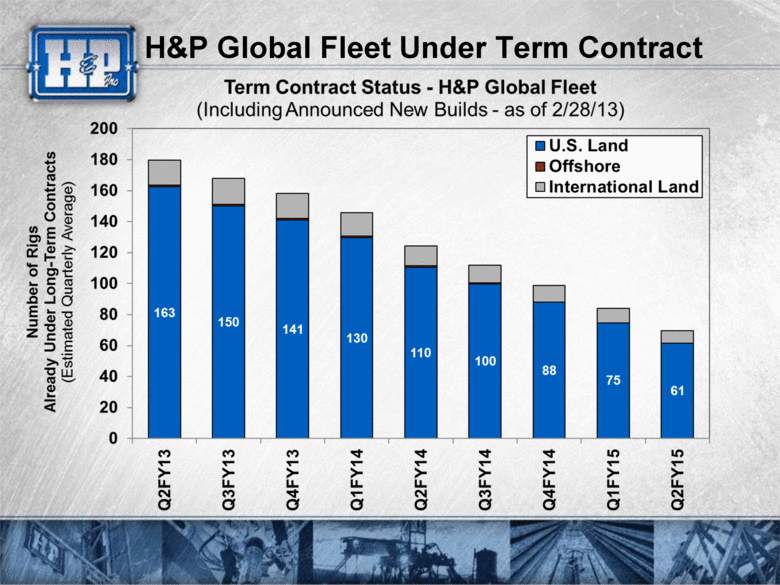
H&P Global Fleet Under Term Contract |
|
|
Active Idle Total Long-term Contracts Argentina 6 3 9 5 Bahrain 3 1 4 3 Colombia 5 2 7 2 Ecuador 5 5 1 Tunisia 2 2 2 U.A.E. 2 2 2 Total 23 6 29 15 H&P’s International Land Operations Rig Fleet Status (as of February 28, 2013) (1) 14 of 16 FlexRigs, included in the international fleet of 29 rigs, are under long-term contracts. (1) |
|
|
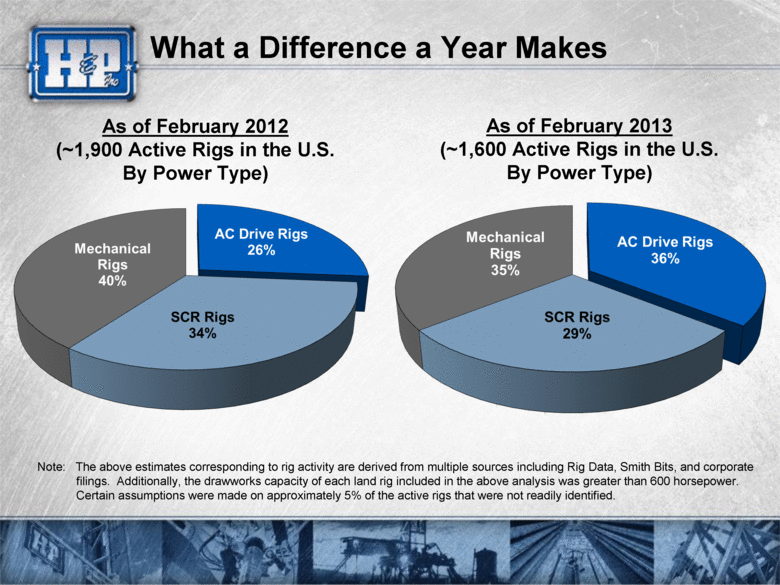
What a Difference a Year Makes As of February 2012 (~1,900 Active Rigs in the U.S. By Power Type) As of February 2013 (~1,600 Active Rigs in the U.S. By Power Type) Note: The above estimates corresponding to rig activity are derived from multiple sources including Rig Data, Smith Bits, and corporate filings. Additionally, the drawworks capacity of each land rig included in the above analysis was greater than 600 horsepower. Certain assumptions were made on approximately 5% of the active rigs that were not readily identified. |
|
|
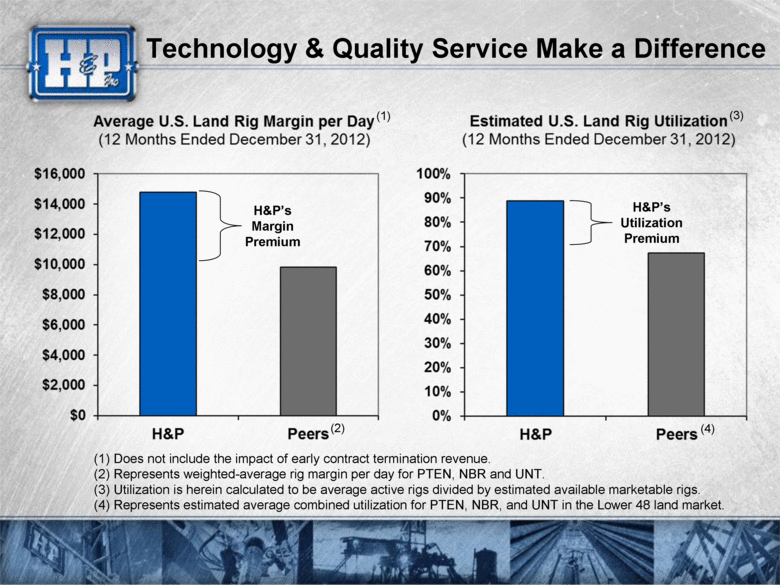
Technology & Quality Service Make a Difference (1) Does not include the impact of early contract termination revenue. (2) Represents weighted-average rig margin per day for PTEN, NBR and UNT. (3) Utilization is herein calculated to be average active rigs divided by estimated available marketable rigs. (4) Represents estimated average combined utilization for PTEN, NBR, and UNT in the Lower 48 land market. H&P’s Margin Premium H&P’s Utilization Premium (1) (2) (3) (4) |
|
|
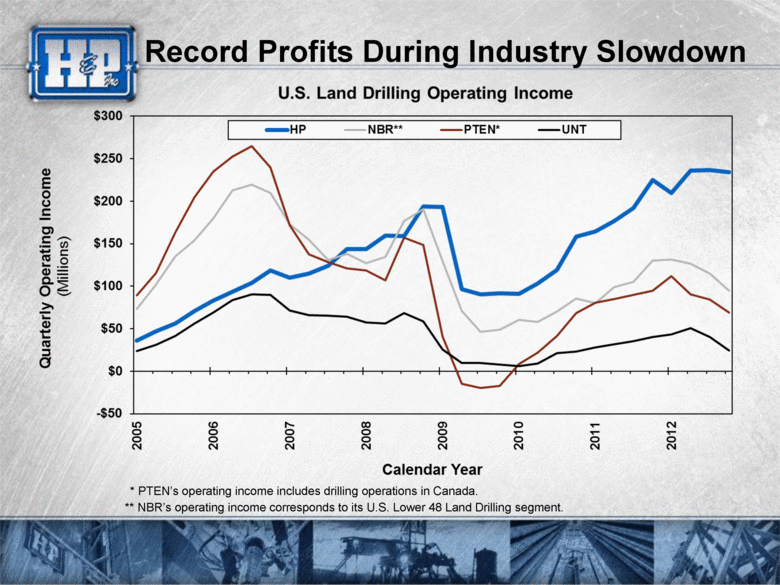
Record Profits During Industry Slowdown * PTEN’s operating income includes drilling operations in Canada. ** NBR’s operating income corresponds to its U.S. Lower 48 Land Drilling segment. |
|
|
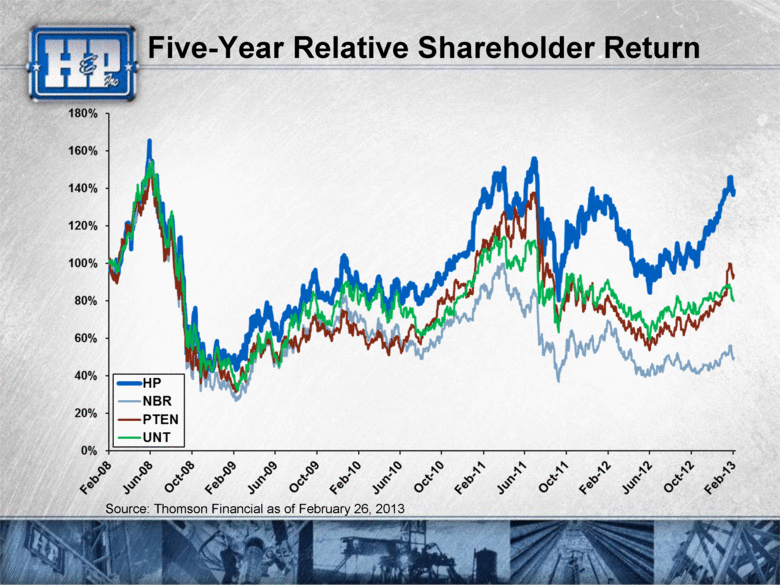
Five-Year Relative Shareholder Return Source: Thomson Financial as of February 26, 2013 |
|
|
End of Document |

