Attached files
| file | filename |
|---|---|
| 8-K - 8-K - STIFEL FINANCIAL CORP | d491831d8k.htm |
Exhibit 99.1

Exhibit 99.1
Stifel Investor Presentation
February 2013
STIFEL
Disclaimer
Forward-Looking Statements
This presentation may contain “forward looking statements” within the meaning of the Private Securities Litigation Reform Act of 1995 that involve significant risks assumptions and uncertainties including statements relating to the market opportunity and future business prospects of Stifel Financial Corp., as well as Stifel, Nicolaus & Company, Incorporated and its subsidiaries (collectively, “SF” or the “Company”). These statements can be identified by the use of the words “may,” “will,” “should,” “could,” “would,” “plan,” “potential,” “estimate,” “project,” “believe, e “ “intend,” “anticipate,” “expect,” and similar expressions. In particular, these statements may refer to our goals intentions and expectations our business plans and growth strategies our ability to integrate and manage our acquired businesses estimates of our risks and future costs and benefits and forecasted demographic and economic trends relating to our industry.
You should not place undue reliance on any forward-looking statements, which speak only as of the date they were made. We will not update these forward looking statements even though our situation may change in the future unless we are obligated to do so under federal securities laws Actual results may differ materially and reported results should not be considered as an indication of future performance. Factors that could cause actual results to differ are included in the Company’s annual and quarterly reports and from time to time in other reports filed by the Company with the Securities and Exchange Commission and include, among other things, changes in general economic and business conditions actions of competitors regulatory and legal actions changes in legislation and technology changes
Note Regarding the Use of Non-GAAP Financial Measures
The Company utilized non GAAP calculations of presented net revenues compensation and benefits non compensation operating expenses income before income taxes provision for income taxes net income compensation and non-compensation operating expense ratios, pre-tax margin and diluted earnings per share as an additional measure to aid in understanding and analyzing the Company’s financial results. Specifically, the Company believes that the non-GAAP measures provide useful information by excluding certain items that may not be indicative of the Company’s core operating results and business outlook. The Company believes that these non-GAAP measures will allow for a better evaluation of the operating performance of the business and facilitate a meaningful comparison of the Company’s results in the current period to those in prior periods and future periods Reference to these non-GAAP measures should not be considered as a substitute for results that are presented in a manner consistent with GAAP These non-GAAP measures are provided to enhance the overall understanding of the Company’s current financial performance.
| 1 |
|
Stifel Overview
| 2 |
|
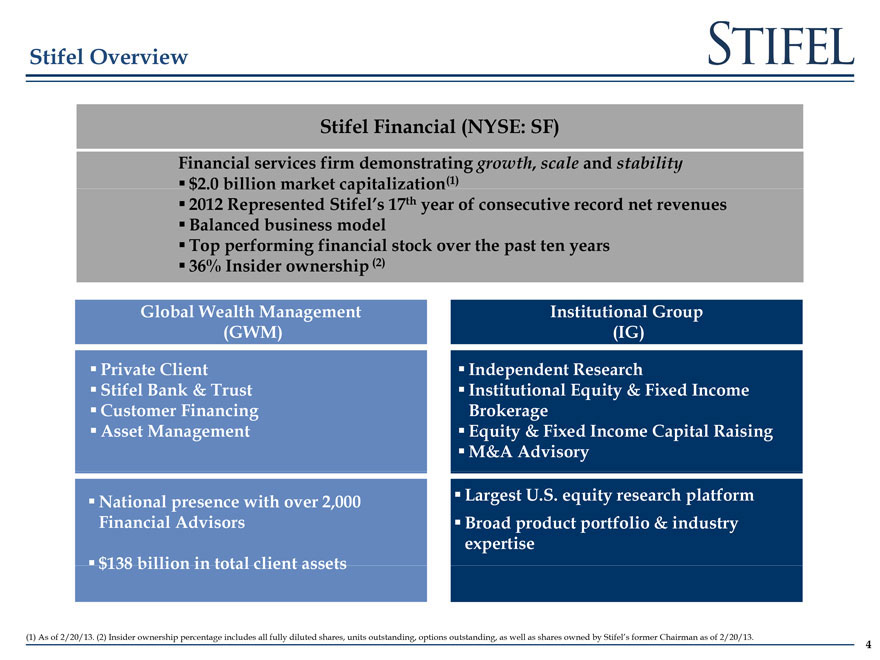
Stifel Financial (NYSE: SF)
Financial services firm demonstrating growth scale and stability
$2.0 billion market capitalization(1)
2012 Represented Stifel’s 17th year of consecutive record net revenues
Balanced business modelodel
Top performing financial stock over the past ten years
36% Insider ownership (2)
Global Wealth Management Institutional Group
(GWM) (IG)
Private Client Independent Research
Stifel Bank & Trust Institutional Equity & Fixed Income
Customer Financing Brokerage
Asset Management Equity & Fixed Income Capital Raising
M&A Advisory
National presence with over 2 000 Largest U S equity research platform
Financial Advisors Broad product portfolio & industry
expertise
$138 billion in total client assets
(1) As of 2/20/13. (2) Insider ownership percentage includes all fully diluted shares, units outstanding, options outstanding, as well as shares owned by Stifel’s former Chairman as of 2/20/13.
| 4 |
|
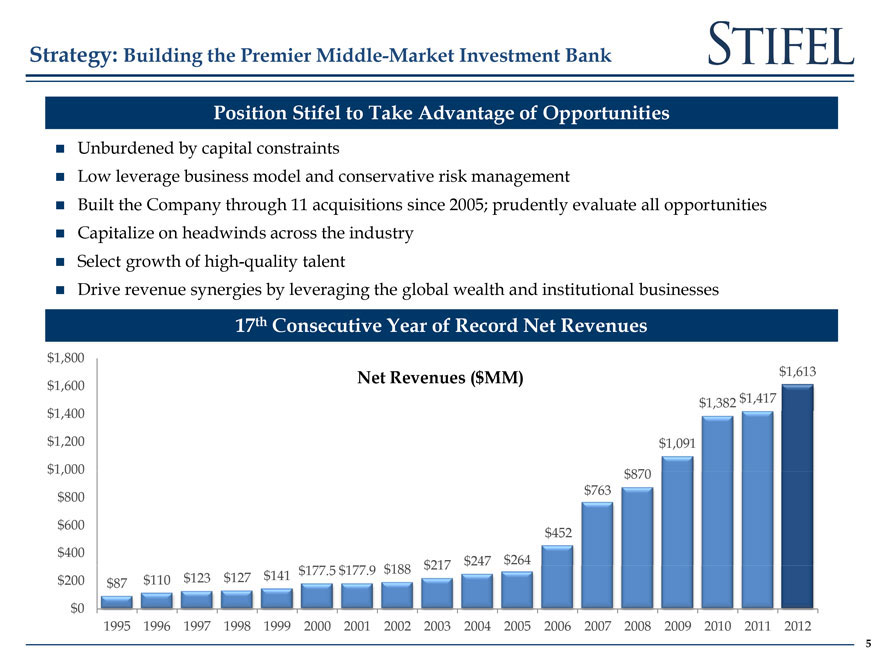
Position Stifel to Take Advantage of Opportunities
„ Unburdened by capital apital constraints
„ Low leverage business model and conservative risk management
„ Built the Company through 11 acquisitions since 2005; prudently evaluate all opportunities
„ Capitalize on headwinds across the industry
„ Select growth of high-quality talent
„ Drive revenue synergies by leveraging the global wealth and institutional businesses
17th Consecutive Year of Record Net Revenues
$1 800
Net Revenues ($MM) $1,613
$1 600
$1 382 $1,417
$1,400
$1,200 $1 091
$1 000 $870
$800 $763
$600 $452
$400
$200 $87 $110 $123 $127 $141 $177 5 $177 9 $188 $217 $247 $264
$0
1995 1996 1997 1998 1999 2000 2001 2002 2003 2004 2005 2006 2007 2008 2009 2010 2011 2012
| 5 |
|
| 5 |
|
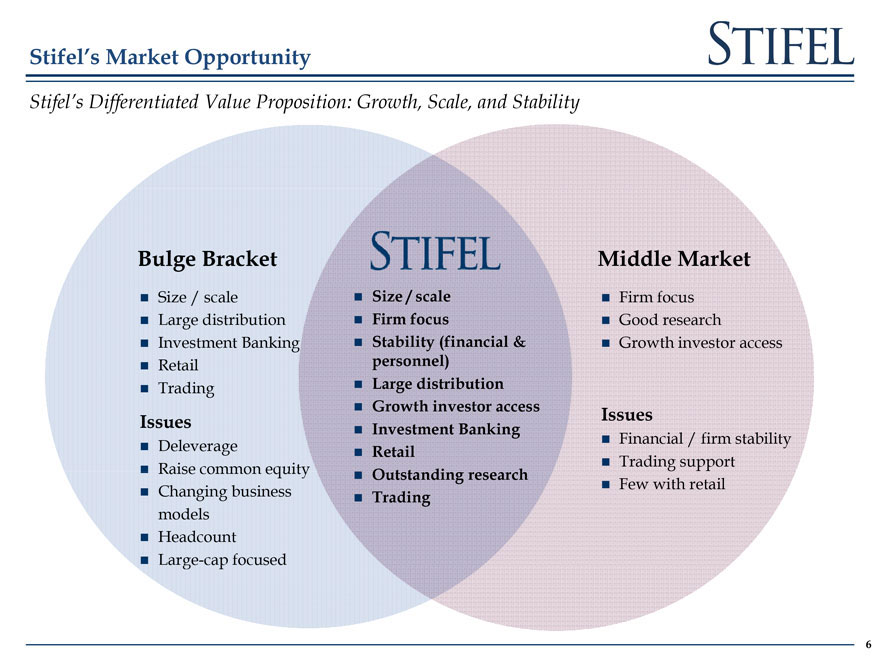
Stifel’s Differentiated Value Proposition: Growth Scale and Stability
„ Size / scale „ Size / scale „ Firm focus
„ Large distribution „ Firm focus „ Good research
„ Investment Banking „ Stability (financial & „ Growth investor access
„ Retail personnel)
„ Trading „ Large distribution
„ Growth investor access
Issues „ Investment Banking Issues
„ Financial / firm stability
„ Deleverage „ Retail
„ Raise common equity „ Outstanding research „ Trading support
„ Few with retail
„ Changing business „ Trading
models
„ Headcount
„ Large-cap focused
| 6 |
|
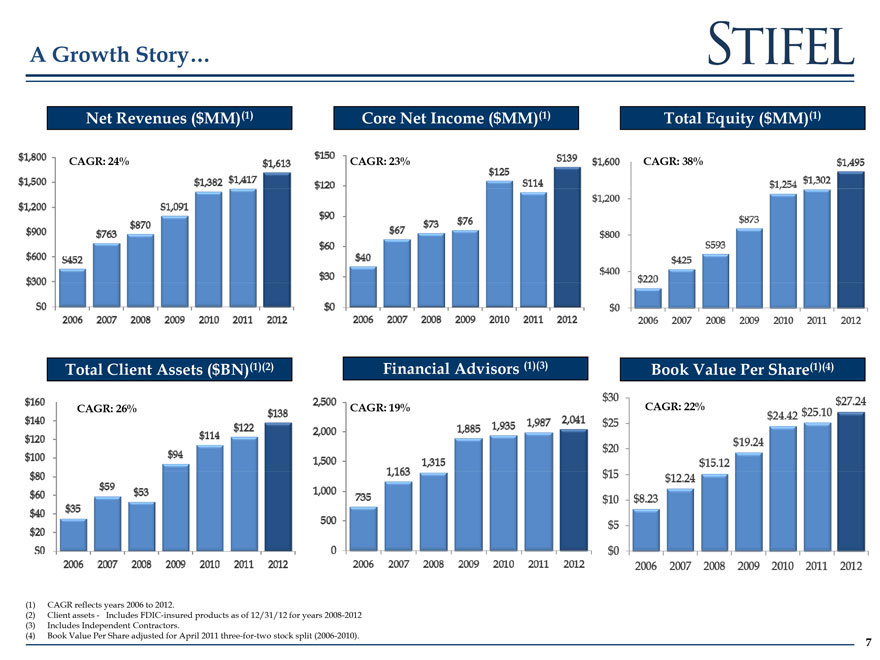
Net Revenues ($MM)(1) Core Net Income ($MM)(1) Total Equity ($MM)(1)
CAGR: 24% CAGR: 38%
Total Client Assets ($BN)(1)(2) Financial Advisors (1)(3) Book Value Per Share(1)(4)
CAGR: 26% CAGR: 19%
| (1) |
|
CAGR reflects years 2006 to 2012. |
(2) Client assets—Includes FDIC-insured products as of 12/31/12 for years 2008-2012 (3) Includes Independent Contractors (4) Book Value Per Share adjusted for April 2011 three-for-two stock split (2006-2010).
| 7 |
|
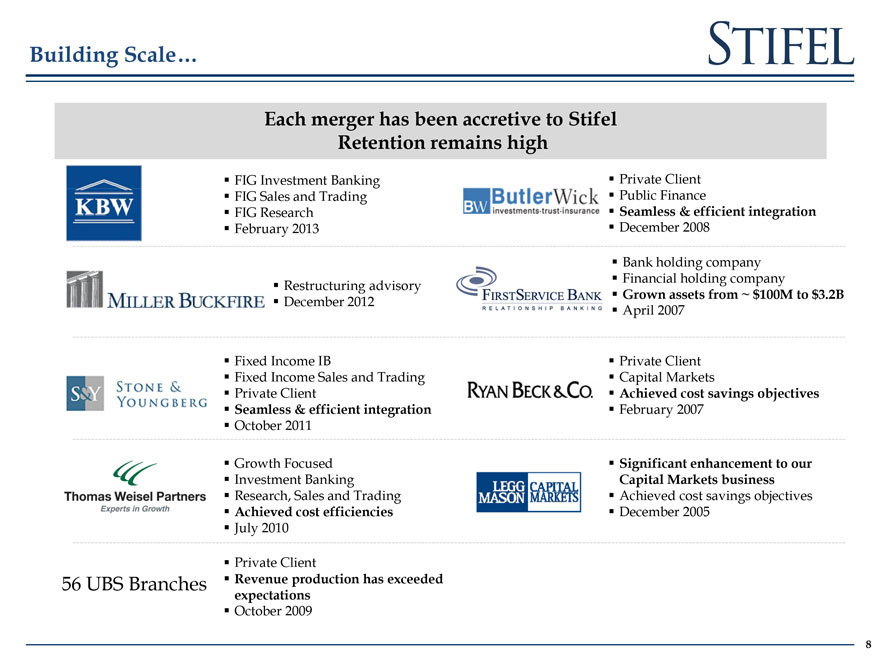
Each merger has been accretive to Stifel
Retention remains high
FIG Investment Banking Private Client
FIG Sales and Trading Public Finance
FIG Research Seamless & efficient integration
February 2013 December 2008
Bank holding company
Restructuring advisory Financial holding company
December 2012 Grown assets from ~ $100M to $3.2B
April 2007
Fixed Income IB Private Client
Fixed Income Sales and Trading Capital Markets
Private Client Achieved cost savings objectives
Seamless & efficient integration February 2007
October 2011
Growth Focused Significant enhancement to our
Investment Banking Capital Markets business
Research Sales and Trading Achieved cost savings objectives
Achieved cost efficiencies December 2005
July 2010
Private Client
56 UBS Branches Revenue production has exceeded
expectations
October 2009
| 8 |
|
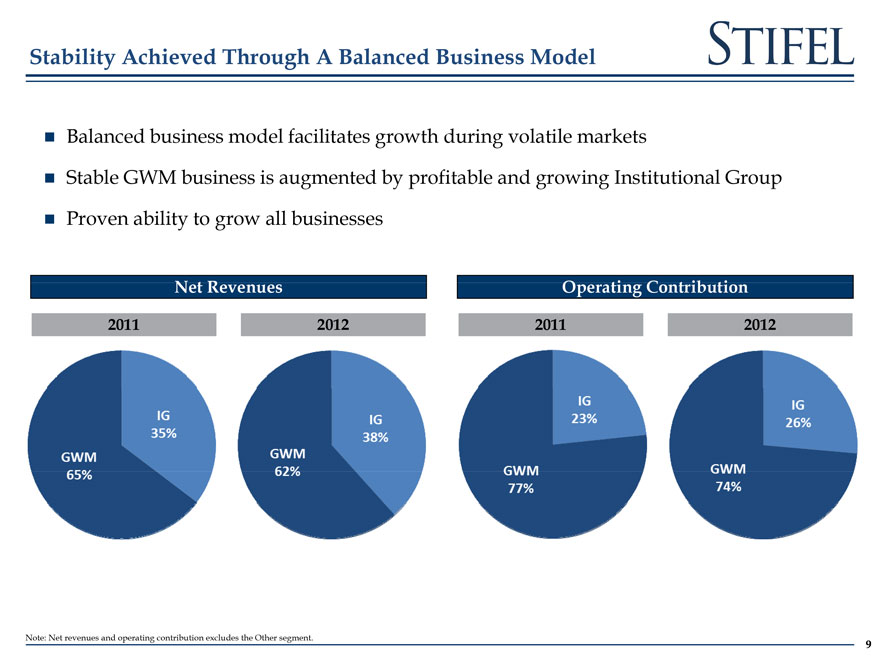
Balanced business model facilitates growth during volatile markets
Stable GWM business is augmented by profitable and growing Institutional Group
Proven ability to grow all businesses
Net Revenues Operating Contribution
2011 2012 2011 2012
Note: Net revenues and operating contribution excludes the Other segment.
9
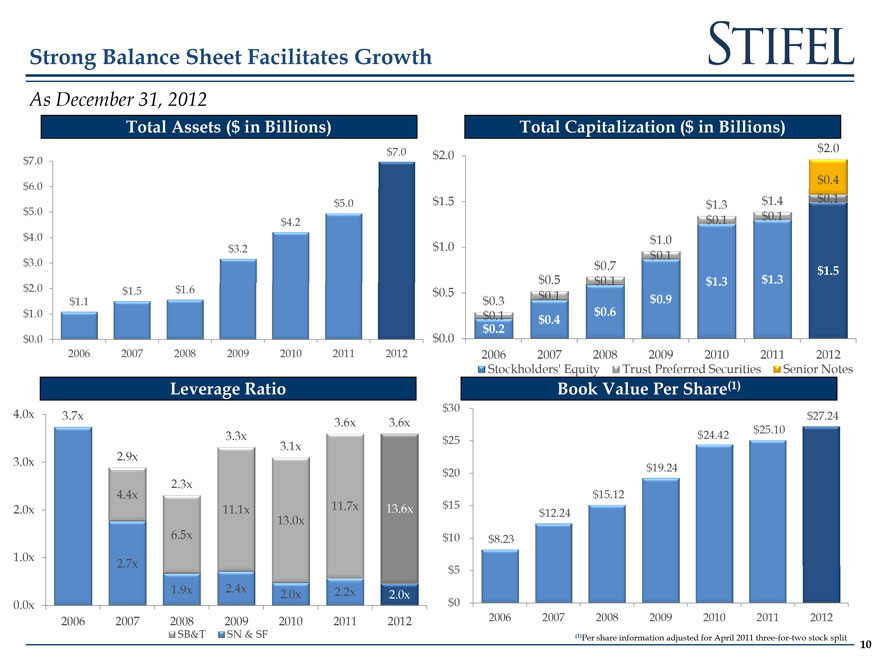
As December 31 2012
Total Assets ($ in Billions) Total Capitalization ($ in Billions)
$7 0 $2 0 $2.0
$ 7 0
$ 6 0 $0 4
$5 0 $1.5 $1 3 $1.4 $0.1
$ 5.0
$4 2 $0 1 $0.1
$ 4.0 $1 0
$3 2 $1 0 $0 1
$ 3.0 $0 7 $1.5
$0.5 $0 1 $1 3 $1.3
$ 2.0 $ 1.1 $1 5 $1 6 $0 5 $0 3 $0.1 $0 9
$ 1.0 $0 1 $0.4 $0.6
$0.2
$ 0.0 $0.0
2006 2007 2008 2009 2010 2011 2012 2006 2007 2008 2009 2010 2011 2012
Stockholders’ Equity Trust Preferred Securities Senior Notes
Leverage Ratio Book Value Per Share(1)
$30
4.0x 3.7x $27.24
3.6x 3.6x
33x $25 $24 42 $25.10
31x
30x 2.9x
$20 $19.24
2.3x
44x $15 12
2.0x 11.1x 11 7x 13.6x $15 $12 24
13 0x
6.5x $10 $8 23
10x 27x
$5
19x 24x 2.0x 2.2x 2.0x
0.0x $0
2006 2007 2008 2009 2010 2011 2012 2006 2007 2008 2009 2010 2011 2012
SB&T SN & SF (1)Per share information adjusted for April 2011 three-for-two stock split
10
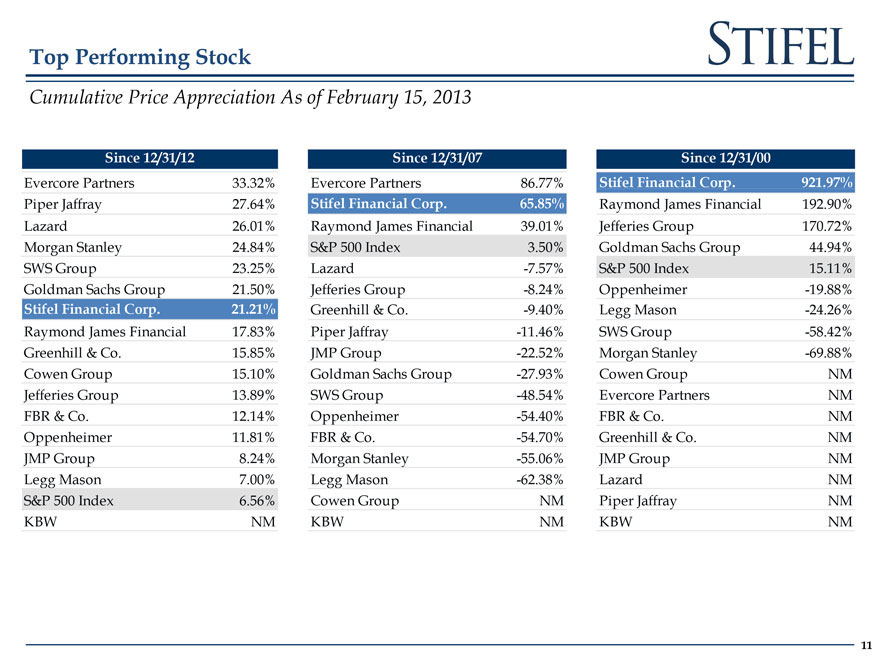
Cumulative Price Appreciation As of February 15, 2013
Since 12/31/12 Since 12/31/07 Since 12/31/00
Evercore Partners 33.32% Evercore Partners 86.77% Stifel Financial Corp. 921.97%
Piper Jaffray 27 64% Stifel Financial Corp 65 85% Raymond James Financial 192 90%
Lazard 26.01% Raymond James Financial 39.01% Jefferies Group 170.72%
Morgan Stanley 24 84% S&P 500 Index 3 50% Goldman Sachs Group 44 94%
SWS Group 23.25% Lazard -7.57% S&P 500 Index 15.11%
Goldman Sachs Group 21 50% Jefferies Group -8 24% Oppenheimer -19 88%
Stifel Financial Corp 21 21% Greenhill & Co 9 40% Legg Mason 24 26%
Raymond James Financial 17 83% Piper Jaffray -11 46% SWS Group -58 42%
Greenhill & Co. 15.85% JMP Groupro -22.52% Morgan Stanley -69.88%
Cowen Group 15 10% Goldman Sachs Group -27 93% Cowen Group NM
Jefferies Group 13 89% SWS Group 48 54% Evercore Partners NM
FBR & Co. 12.14% Oppenheimer -54.40% FBR & Co. NM
Oppenheimer 11 81% FBR & Co 54 70% Greenhill & Co NM
JMP Group 8.24% Morgan Stanley -55.06% JMP Group NM
Legg Mason 7 00% Legg Mason 62 38% Lazard NM
S&P 500 Index 6.56% Cowen Group NM Piper Jaffray NM
KBW NM KBW NM KBW NM
11
Initiatives
Attract and retain high-quality talent
Continue to expand our private client footprint in the U S Continue to expand fixed income businesses Continue to expand investment banking capabilities Focus on quality asset generation within Stifel Bank Expand traditional asset management capabilities Approach acquisition opportunities with discipline
12

Merger with KBW
13
Integration Update
Closed the merger February 15, 2013
Tom Michaud and Michael Zimmerman joined Stifel’s Board of Directors
Key employees remain with the firm
Report core vs non-core going forward as contracts roll off until the integration is complete
14
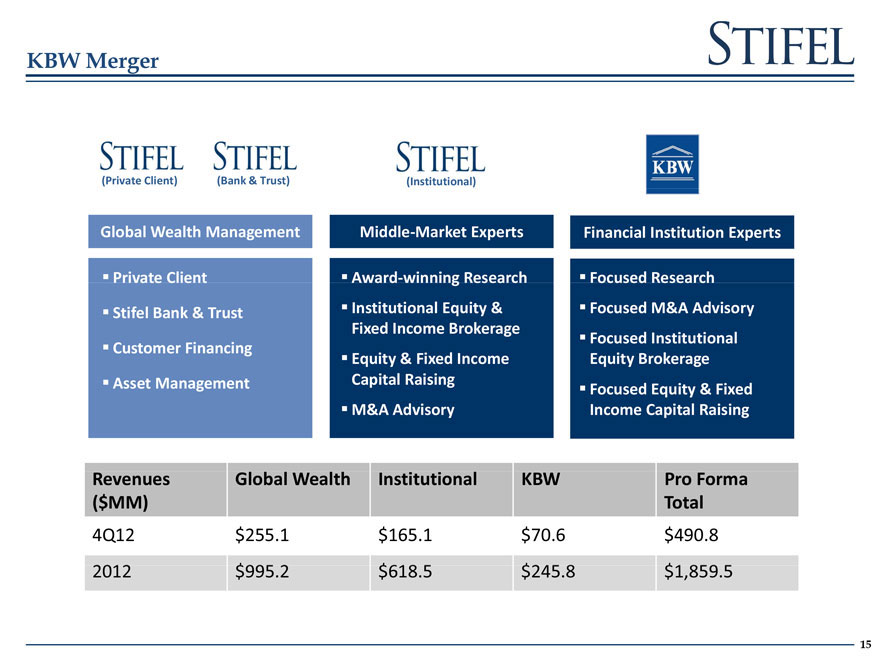
Global Wealth management middle-market experts financial institution experts
Revenues Global Wealth Institutional KBW Pro Forma
($MM) Total
4Q12 $ 255.1 $ 165.1 $ 70.6 $ 490.8
2012 $ 995 2 $ 618 5 $ 245 8 $ 1 859 5
15
global wealth management
16
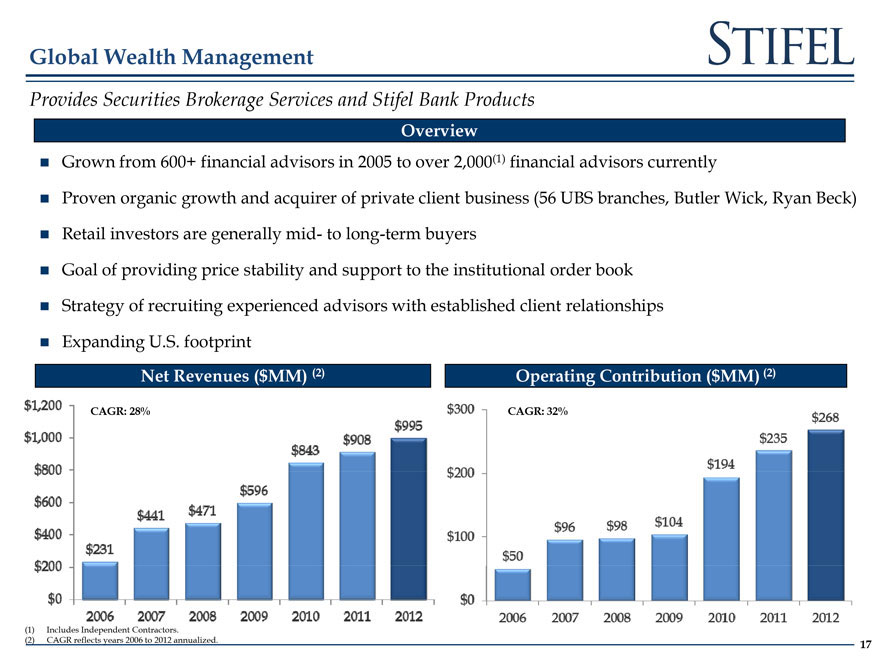
Provides Securities Brokerage Services and Stifel Bank Products
Grown from 600+ financial advisors in 2005 to over 2 000(1) financial advisors currently
Proven organic growth and acquirer of private client business (56 UBS branches Butler Wick Ryan Beck)
Retail tail investors t r are generally n rall mid d- to long ng-term m buyers r
Goal of providing price stability and support to the institutional order book Strategy of recruiting experienced advisors with established client relationships Expanding U S footprint
CAGR: 28%
CAGR: 32%
| (1) |
|
Includes Independent Contractors. |
| (2) |
|
CAGR reflects years 2006 to 2012 annualized |
17
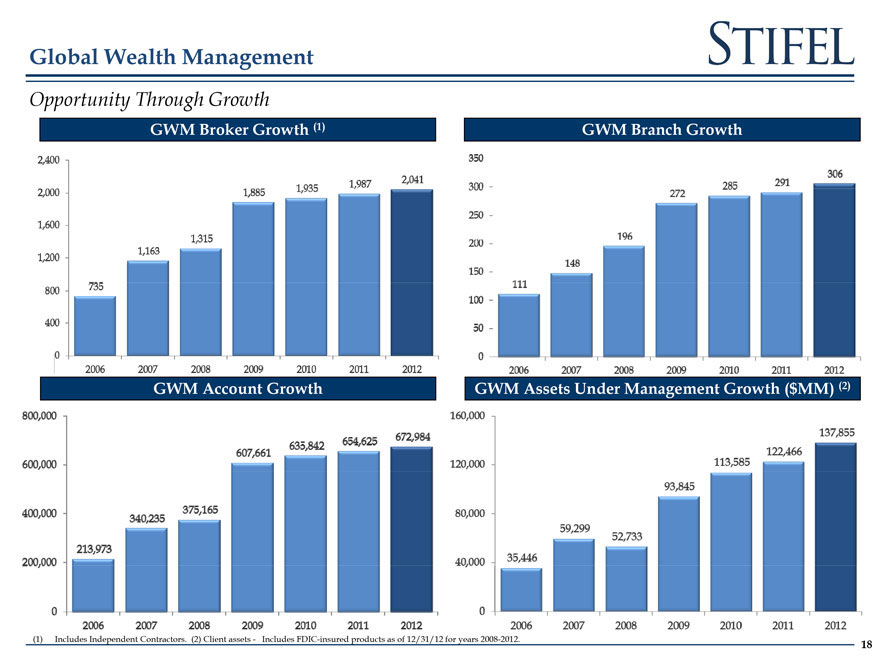
Opportunity Through Growth
(1) Includes Independent Contractors. (2) Client assets—Includes FDIC-insured products as of 12/31/12 for years 2008-2012.
18
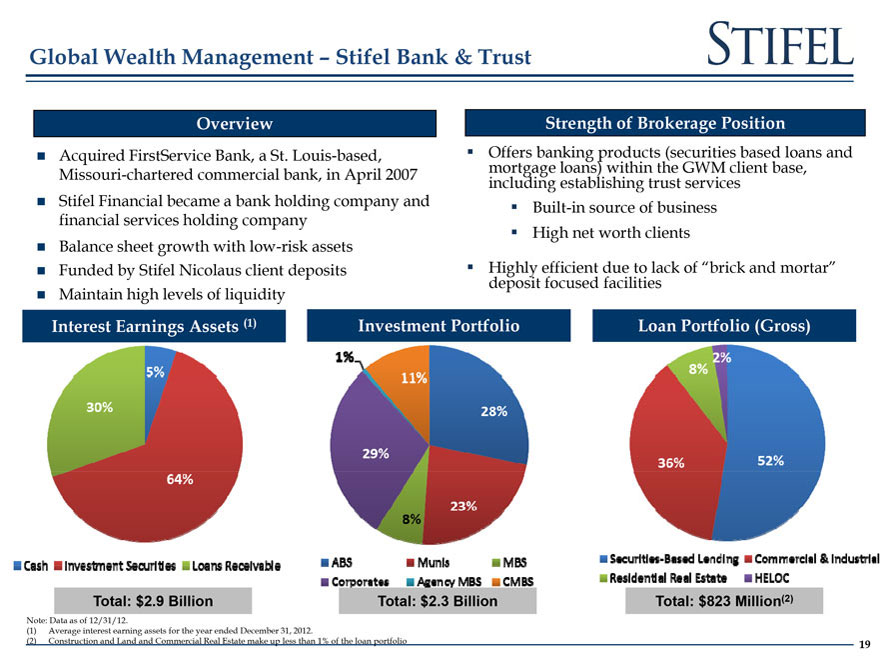
Overview
Acquired FirstService Bank aSt Louis based Missouri-chartered commercial bank, in April 2007 Stifel Financial became a bank holding company and financial services holding company Balance sheet growth with low-risk assets Funded by Stifel Nicolaus client deposits Maintain high levels of liquidity
Strength of Brokerage Position
Offers mortgage banking loans) products within the (securities GWM client based base, loans and including establishing trust services
Built in source of business
High net worth clients
Highly deposit efficient focused due facilities ue to lack of “brick brick and mortar ortar”
Interest Earnings Assets (1)
Investment Portfolio
Loan Portfolio (Gross)
Total: $2.9 Billion
Total: $2.3 Billion
Total: $823 Million(2)
Note: Data as of 12/31/12.
| (1) |
|
Average interest earning assets for the year ended December 31, 2012. |
| (2) |
|
Construction and Land and Commercial Real Estate make up less than 1% of the loan portfolio |
19

Institutional group
20
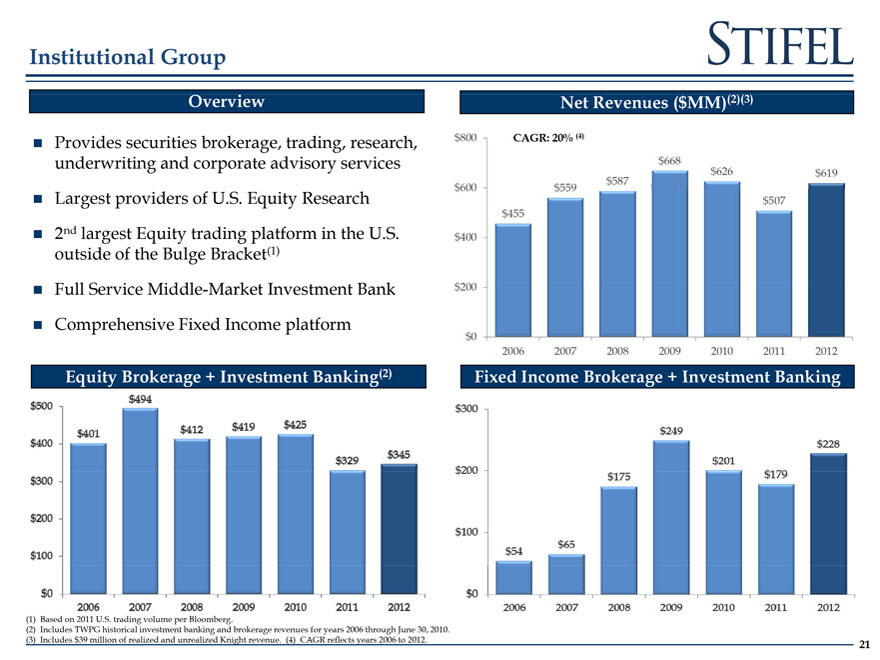
Overview
Net Revenues ($MM)(2)(3)
Provides securities brokerage trading research underwriting and corporate advisory services Largest providers of U S Equity Research 2nd largest Equity quity trading platform in the U.S. outside of the Bulge Bracket(1) Full Service Middle-Market Investment Bank Comprehensive Fixed Income platform
CAGR: 20% (4)
Equity Brokerage + Investment Banking(2)
Fixed Income Brokerage + Investment Banking
| (1) |
|
Based on 2011 U.S. trading volume per Bloomberg. |
(2) Includes TWPG historical investment banking and brokerage revenues for years 2006 through June 30, 2010. (3) Includes $39 million of realized and unrealized Knight revenue. (4) CAGR reflects years 2006 to 2012.
21
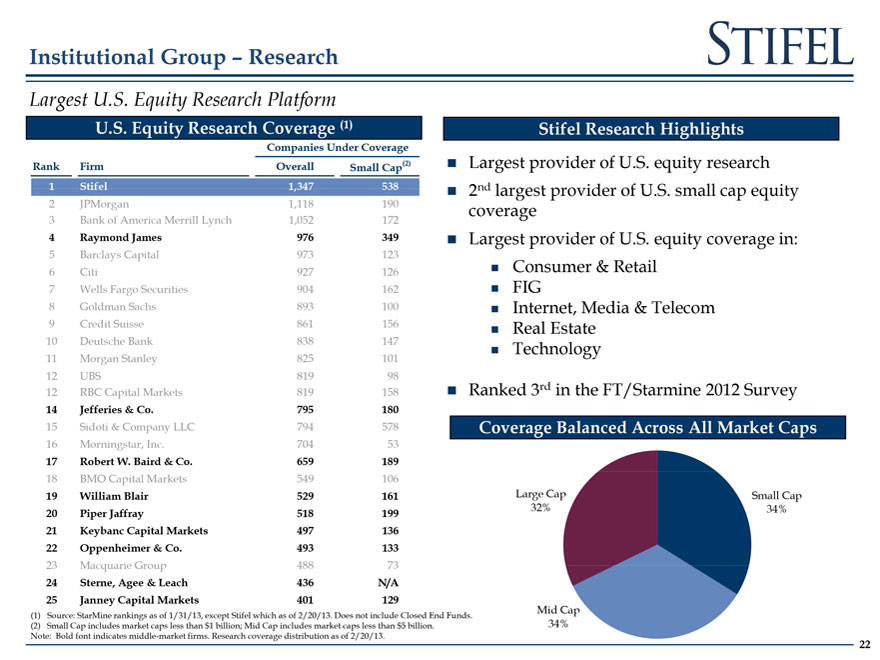
Largest U S Equity Research Platform
U S Equity Research Coverage (1)
CiCompanies Under Coverage
Rank Firm Overall Small Cap(2)
| 1 |
|
Stifel 1 347 538 |
| 2 |
|
JPMorgan 1118 190 |
| 3 |
|
Bank of America Merrill Lynch 1,052 172 |
| 4 |
|
Raymond James 976 349 |
| 5 |
|
Barclays Capital 973 123 |
| 6 |
|
Citi 927 126 |
| 7 |
|
Wells Fargo Securities 904 162 |
| 8 |
|
Goldman Sachs 893 100 |
9 Credit Suisse 861 156
10 Deutsche Bank 838 147
11 Morgan Stanley 825 101
12 UBS 819 98
12 RBC Capital Markets 819 158
14 Jefferies & Co 795 180
15 Sidoti & Company LLC 794 578
16 Morningstar Inc 704 53
17 Robert W Baird & Co 659 189
18 BMO Capital Markets 549 106
19 William Blair 529 161
20 Piper Jaffray 518 199
21 Keybanc Capital Markets 497 136
22 Oppenheimer & Co 493 133
23 Macquarie Group 488 73
24 Sterne Agee & Leach 436 N/A
25 Janney Capital Markets 401 129
(1) Source: StarMine rankings as of 1/31/13 except Stifel which as of 2/20/13 Does not include Closed End Funds (2) Small Cap includes market caps less than $1 billion; Mid Cap includes market caps less than $5 billion Note: Bold font indicates middle-market firms. Research coverage distribution as of 2/20/13.
Stifel Research Highlights
Largest provider of U S equity research 2nd largest provider of U S small cap equity coverage Largest provider of U S equity coverage in:
„ Consumer & Retail
„ FIG
„ Internet Media & Telecom
„ Real l Estate t t
„ Technology
Ranked 3rd in the FT/Starmine 2012 Survey
Coverage Balanced Across All Market Caps
Large Cap 32%
Small Cap 34%
Mid Cap 34%
22
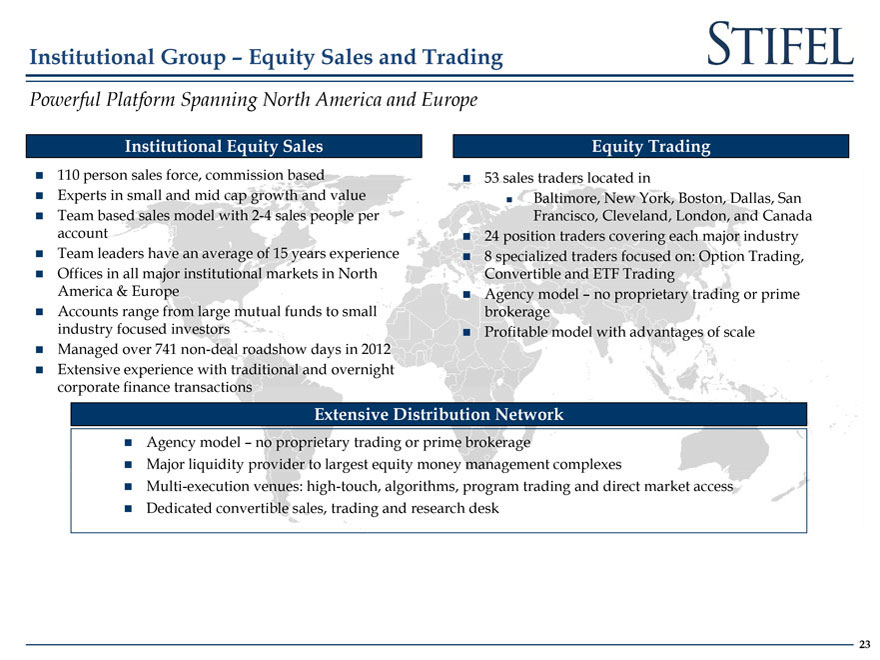
Powerful Platform Spanning North America and Europe
Institutional Equity Sales
110 person sales force, commission based Experts in small and mid cap growth and value Team based sales model with 2 4 sales people per account Team leaders have an average of 15 years experience Offices in all major institutional markets in North America & Europe Accounts range from large mutual funds to small industry focused investors Managed over 741 non-deal roadshow days in 2012 Extensive experience with traditional and overnight corporate finance transactions
Equity Trading
53 sales traders located in
„ Baltimore New York Boston Dallas San
Francisco, Cleveland, leveland London, and Canada anada 24 position traders covering each major industry 8 specialized traders focused on: Option Trading Convertible and ETF Trading Agency model – no proprietary trading or prime brokerage Profitable model with advantages of scale
Extensive Distribution Network
Agency model – no proprietary trading or prime brokerage
Major liquidity provider to largest equity money management complexes
Multi-execution venues: high-touch algorithms program trading and direct market access Dedicated convertible sales, trading and research desk
23
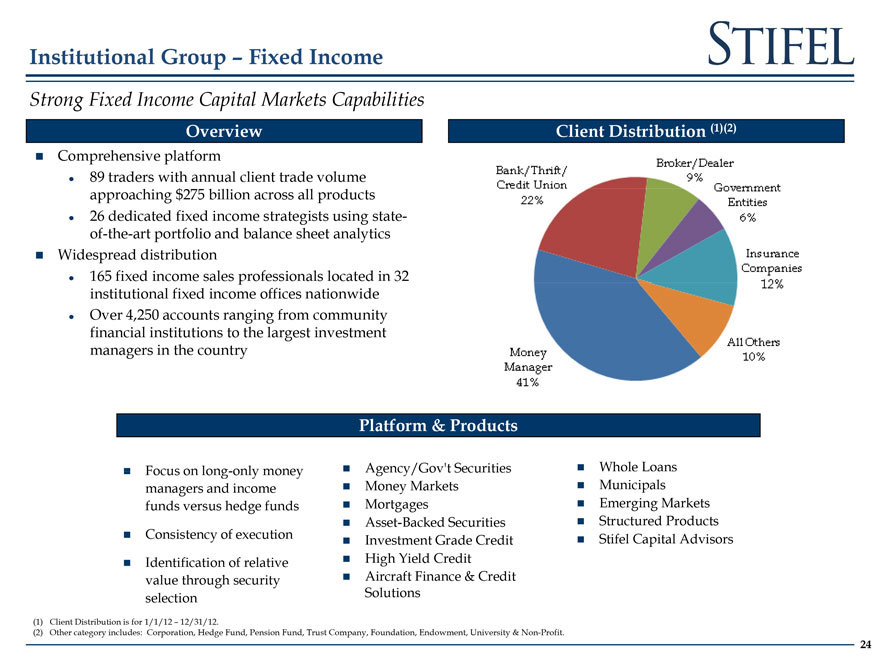
Strong Fixed Income Capital Markets Capabilities
Oi Overview
Comprehensive platform z 89 traders with annual client trade volume approaching $275 billion across all products z 26 dedicated fixed income strategists using state of-the-art portfolio rtf li and d balance l n sheet t analytics l ti Widespread distribution z 165 fixed income sales professionals rofessionals located in 32 institutional fixed income offices nationwide z Over 4 250 accounts ranging from community financial institutions to the largest investment managers in the country
Client t Distribution t ib ti (1)(2)
Platform & Products
Focus on long only money managers and income funds versus hedge funds
Consistency of execution
Identification of relative value through security selection
Agency/Gov’t Securities Money Markets Mortgages Asset Backed Securities Investment Grade Credit
High Yield Credit redit Aircraft Finance & Credit Solutions
Whole Loans Municipals Emerging Markets Structured Products Stifel Capital Advisors
| (1) |
|
Client Distribution is for 1/1/12 – 12/31/12. |
(2) Other category includes: Corporation Hedge Fund Pension Fund Trust Company Foundation Endowment University & Non-Profit
24
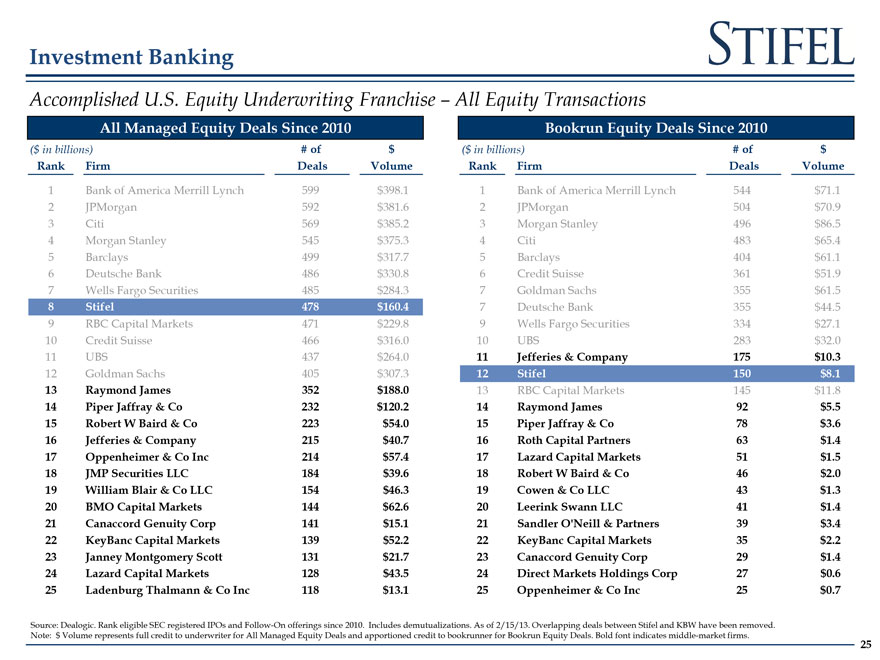
Accomplished U S Equity Underwriting Franchise – All Equity Transactions
All Managed Equity Deals Since 2010
($ in billions) # of $
Rank Firm Deals Volume
| 1 |
|
Bank of America Merrill Lynch 599 $398.1 |
| 2 |
|
JPMorgan 592 $381.6 |
| 3 |
|
Citi 569 $385 2 |
| 4 |
|
Morgan Stanley 545 $375 3 |
| 5 |
|
Barclays 499 $317 7 |
| 6 |
|
Deutsche Bank 486 $330 8 |
| 7 |
|
Wells Fargo Securities 485 $284 3 |
| 8 |
|
Stifel 478 $160 4 |
9 RBC Capital Markets 471 $229 8
10 Credit Suisse 466 $316 0
11 UBS 437 $264 0
12 Goldman Sachs 405 $307.3
13 Raymond James 352 $188.0
14 Piper Jaffray & Co 232 $120.2
15 Robert W Baird & Co 223 $54.0
16 Jefferies & Company 215 $40.7
17 Oppenheimer & Co Inc 214 $57.4
18 JMP Securities LLC 184 $39.6
19 William Blair & Co LLC 154 $46.3
20 BMOMO Capitalapi al MarketsMarkets 144 $62.6
21 Canaccord Genuity Corp 141 $15 1
22 KeyBanc Capital Markets 139 $52 2
23 Janney Montgomery Scott 131 $21 7
24 Lazard Capital Markets 128 $43 5
25 Ladenburg Thalmann & Co Inc 118 $13 1
Bookrun Equity Deals Since 2010
($ in billions) # of $
Rank Firm Deals Volume
| 1 |
|
Bank of America Merrill Lynch 544 $71.1 |
| 2 |
|
JPMorgan 504 $70.9 |
| 3 |
|
Morgan Stanley 496 $86 5 |
| 4 |
|
Citi 483 $65 4 |
| 5 |
|
Barclays 404 $61 1 |
| 6 |
|
Credit Suisse 361 $51 9 |
| 7 |
|
Goldman Sachs 355 $61 5 |
| 7 |
|
Deutsche Bank 355 $44 5 |
9 Wells Fargo Securities 334 $27 1
10 UBS 283 $32 0
11 Jefferies & Company 175 $10.3
12 Stifel 150 $8.1
13 RBC Capital Markets 145 $11.8
14 Raymond James 92 $5.5
15 Piper Jaffray & Co 78 $3.6
16 Roth Capital Partners 63 $1.4
17 Lazard Capital Markets 51 $1.5
18 Robert W Baird & Co 46 $2.0
19 Cowen & Co LLC 43 $1.3
20 Leerink Swannwann LLC 41 $1.4
21 Sandler O’Neill & Partners 39 $3 4
22 KeyBanc Capital Markets 35 $2 2
23 Canaccord Genuity Corp 29 $1 4
24 Direct Markets Holdings Corp 27 $0 6
25 Oppenheimer & Co Inc 25 $0 7
Source: Dealogic Rank eligible SEC registered IPOs and Follow On offerings since 2010 Includes demutualizations As of 2/15/13 Overlapping deals between Stifel and KBW have been removed Note: $ Volume represents full credit to underwriter for All Managed Equity Deals and apportioned credit to bookrunner for Bookrun Equity Deals. Bold font indicates middle-market firms.
25
financial results
26
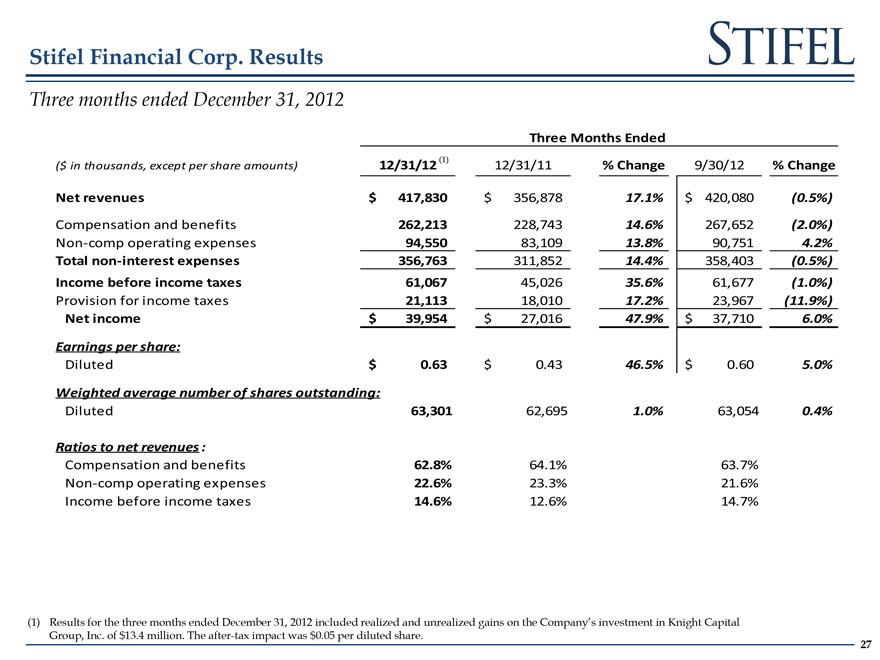
Three months ended December 31 2012
ThThree Monthsont Ended
($ in thousands, except per share amounts) 12/31/12 (1) 12/31/11 % Change 9/30/12 % Change
Net revenueseven e $ 417,830 $ 356,878 17.1%1% $ 420,080 (0.5%)
Compensation and benefits 262,213 228,743 14.6% 267,652 (2.0%)
Non-comp operating expenses 94,550 83,109 13.8% 90,751 4.2%
Total non-interest expenses 356,763 311,852 14.4% 358,403 (0.5%)
Income before income taxes 61 067 45 026 35 6% 61 677 (1 0%)
Provision for income taxes 21,113113 18,010 17.2%2% 23,967967 (1(11.9%)
Net income $ 39,954 $ 27,016 47.9% $ 37,710 6.0%
Earnings per share:
Diluted $ 0.63 $ 0.43 46.5% $ 0.60 5.0%
Weighted average number of shares outstanding:
Diluted 63 301 62 695 1 0% 63 054 0 4%
Ratios to net revenues :
Compensation and benefits 62.8% 64.1% 63.7%
Non-comp operating expenses 22.6% 23.3% 21.6%
Income before income taxes 14.6% 12.6% 14.7%
(1) Results for the three months ended December 31, 2012 included realized and unrealized gains on the Company’s investment in Knight Capital Group, Inc. of $13.4 million. The after-tax impact was $0.05 per diluted share.
27
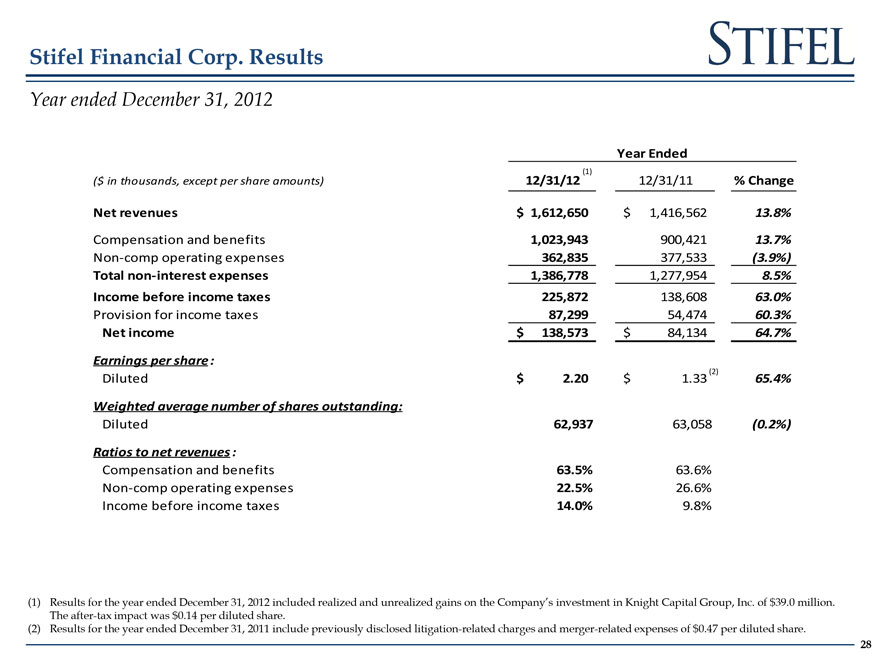
Year ended December 31 2012
Year Ended
| (1) |
|
($ in thousands, except per share amounts) 12/31/12 12/31/11 % Change
Net revenues $ 1 612 650 $ 1 416 562 13 8%
Compensation and benefits 1 023 943 900 421 13 7%
Non-compom operatingpe ng expensespense 362,835 377,533 (3.9%)
Total non-interest expenses 1,386,778 1,277,954 8.5%
Income before income taxes 225,872 138,608 63.0%
Provision for income taxes 87 299 54 474 60 3%
Net income $ 138 573 $ 84 134 64 7%
Earnings per share:re
Diluted $ 2.20 $ 1.33 (2) 65.4%
Weighted average number of shares outstanding:
Diluted 62,937 63,058 (0.2%)
Ratios to net revenues :
Compensation and benefits 63 5% 63 6%
Non comp operating expenses 22 5% 26 6%
Income before income taxes 14.0% 9.8%
(1) Results for the year ended December 31, 2012 included realized and unrealized gains on the Company’s investment in Knight Capital Group, Inc. of $39.0 million. The after-tax impact was $0 14 per diluted share (2) Results for the year ended December 31, 2011 include previously disclosed litigation-related charges and merger-related expenses of $0.47 per diluted share.
28
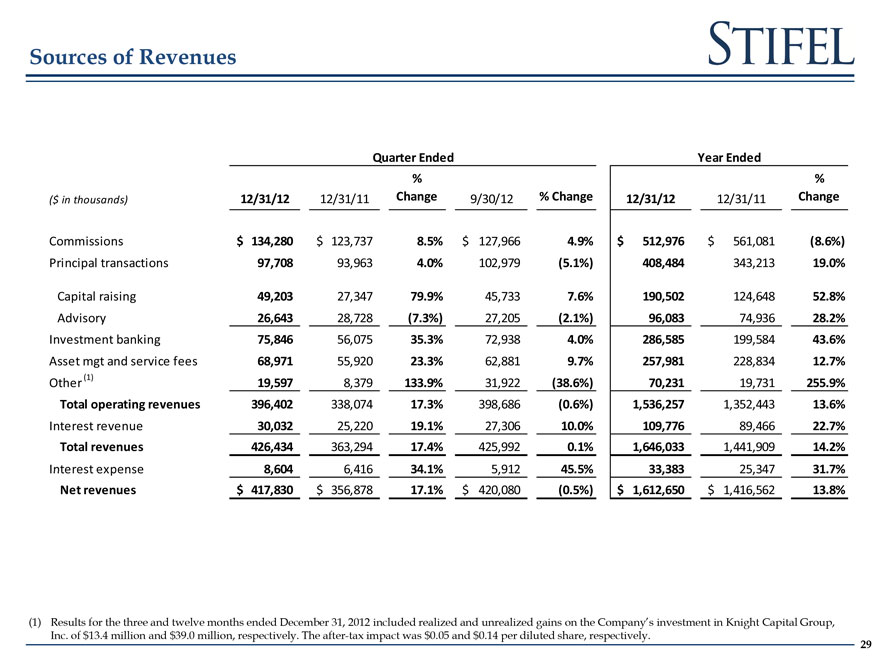
Quarter Ended Year Ended
% %
($ in thousands) 12/31/12 12/31/11 Change 9/30/12 % Change 12/31/12 12/31/11 Change
Commissions $ 134,280 $ 123,737 8.5% $ 127,966 4.9% $ 512,976 $ 561,081 (8.6%)
Principal transactions 97,708 93 963 4.0% 102 979 (5.1%) 408,484 343 213 19.0%
Capital raising 49,203 27,347 79.9% 45,733 7.6% 190,502 124,648 52.8%
Advisory 26,643 28,728 (7.3%) 27,205 (2.1%) 96,083 74,936 28.2%
Investment banking 75,846 56,075 35.3% 72,938 4.0% 286,585 199,584 43.6%
Asset mgt and service fees 68,971 55,920 23.3% 62,881 9.7% 257,981 228,834 12.7%
Other (1) 19,597 8 379 133.9% 31 922 (38.6%) 70,231 19 731 255.9%
Total operating revenues 396,402 338,074 17.3% 398,686 (0.6%) 1,536,257 1,352,443 13.6%
Interest revenue 30 032 25 220 19 1% 27 306 10 0% 109 776 89 466 22 7%
Total revenues 426,434 363,294 17.4% 425,992 0.1% 1,646,033 1,441,909 14.2%
Interest expense 8 604 6 416 34 1% 5 912 45 5% 33 383 25 347 31 7%
Net revenues $ 417,830 $ 356,878 17.1% $ 420,080 (0.5%) $ 1,612,650 $ 1,416,562 13.8%
(1) Results for the three and twelve months ended December 31, 2012 included realized and unrealized gains on the Company’s investment in Knight Capital Group, Inc. of $13.4 million and $39.0 million, respectively. The after-tax impact was $0.05 and $0.14 per diluted share, respectively.
29
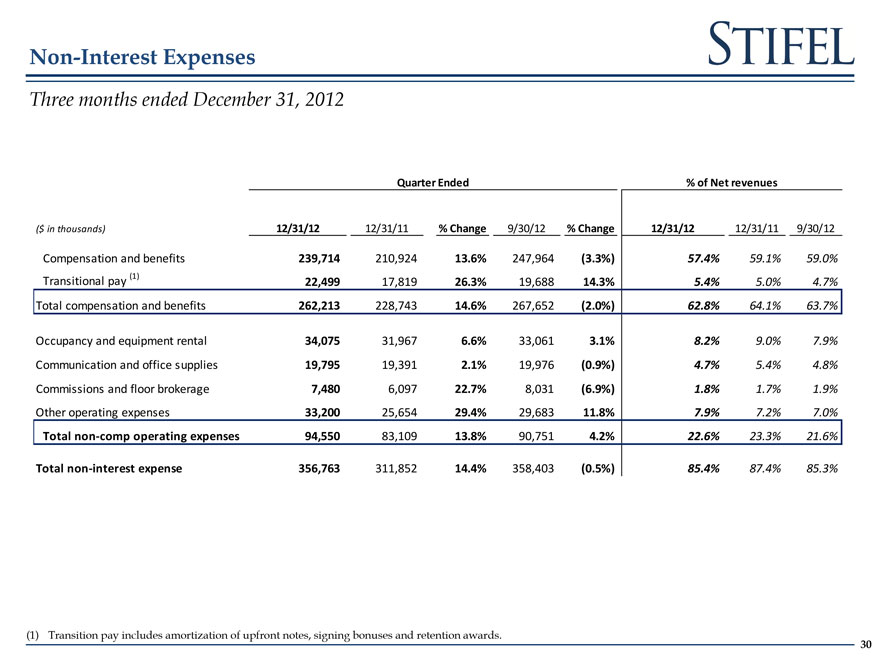
Three months ended December 31 2012
Quarter Ended % of Net revenues
($ in thousands) 12/31/12 12/31/11 % Change 9/30/12 % Change 12/31/12 12/31/11 9/30/12
Compensation and benefits 239,714 210,924 13.6% 247,964 (3.3%) 57.4% 59.1% 59.0%
Transitional pay (1) 22 499 17 819 26 3% 19 688 14 3% 54% 50% 47%
Total compensation and benefits 262,213 228 743 14.6% 267 652 (2.0%) 62.8% 64 1% 63 7%
Occupancy and equipment rental 34 075 31 967 66% 33 061 31% 82% 90% 79%
Communication and office supplies 19,795 19,391 2.1% 19,976 (0.9%) 4.7% 5.4% 4.8%
Commissions and floor brokerage 7,480 6,097 22.7% 8,031 (6.9%) 1.8% 1.7% 1.9%
Other operating expenses 33,200 25,654 29.4% 29,683 11.8% 7.9% 7.2% 7.0%
Total non-comp operating expenses 94 550 83 109 13 8% 90 751 42% 22 6% 23 3% 21 6%
Total non-interest expense 356,763 311 852 14.4% 358 403 (0.5%) 85.4% 87 4% 85 3%
(1) Transition Titi pay includes l d amortization ti ti of upfro f nt notes, t signing i bonuses and d retention awards d .
30
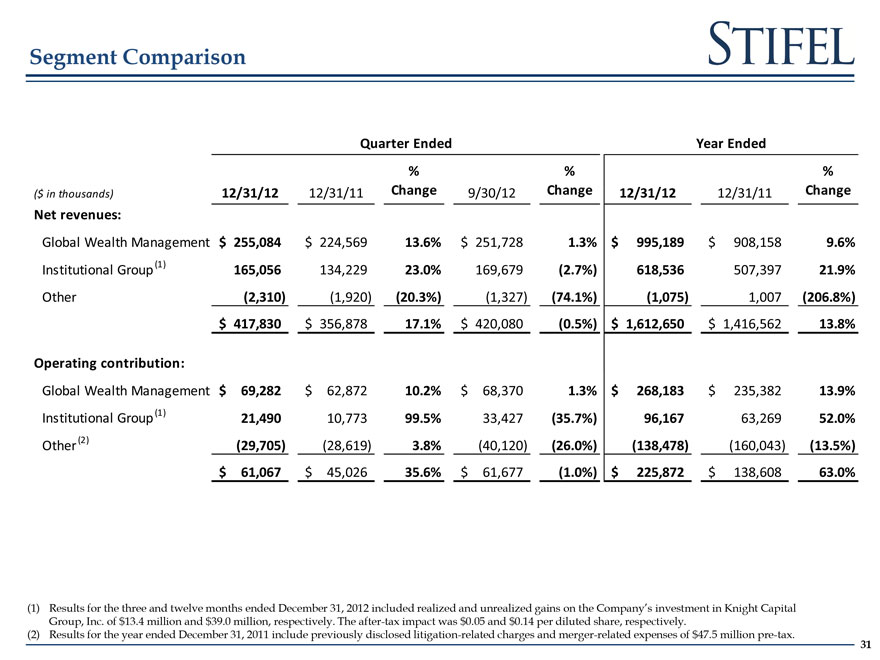
Quarter Ended Year Ended
% % %
($ in thousands) 12/31/12 12/31/11 Change 9/30/12 Change 12/31/12 12/31/11 Change
Net revenueseven e :
Global Wealth Management $ 255,084 $ 224,569 13.6% $ 251,728 1.3% $ 995,189 $ 908,158 9.6%
Institutional Group (1) 165,056 134,229 23.0% 169,679 (2.7%) 618,536 507,397 21.9%
Other (2 310) (1 920) (20 3%) (1 327) (74 1%) (1 075) 1 007 (206 8%)
$ 417 830 $ 356 878 17 1% $ 420 080 (0 5%) $ 1 612 650 $ 1 416 562 13 8%
Operating contribution:
Global Wealth Management $ 69,282 $ 62,872 10.2% $ 68,370 1.3% $ 268,183 $ 235,382 13.9%
Institutional Group (1) 21 490 10 773 99 5% 33 427 (35 7%) 96 167 63 269 52 0%
Other (2) (29 705) (28 619) 38% (40 120) (26 0%) (138 478) (160 043) (13 5%)
$ 61,067 $ 45,026 35.6% $ 61,677 (1.0%) $ 225,872 $ 138,608 63.0%
(1) Results for the three and twelve months ended December 31 2012 included realized and unrealized gains on the Company’s investment in Knight Capital Group, Inc. of $13.4 million and $39.0 million, respectively. The after-tax impact was $0.05 and $0.14 per diluted share, respectively.
(2) Results for the year ended December 31 2011 include previously disclosed litigation related charges and merger related expenses of $47 5 million pre tax
31
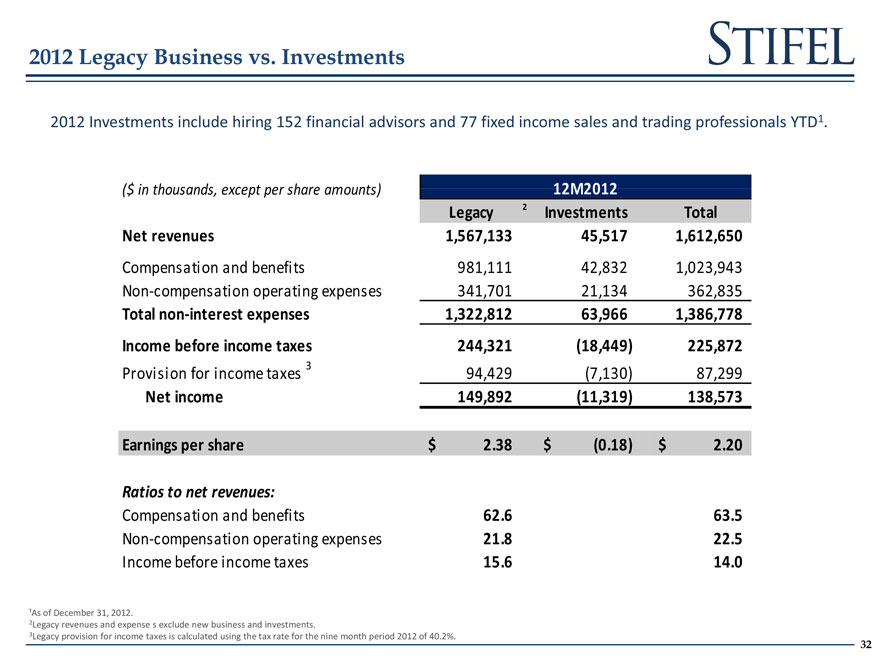
2012 Investments include hiring 152 financial advisors and 77 fixed income sales and trading professionals YTD1.
($ in thousands, exceptxc per share amounts)unt 12M2012
Legacy 2 Investments Total
Net revenues 1,567,133 45,517 1,612,650
Compensation and benefits 981,111 42,832 1,023,943
Non compensation operating expenses 341 701 21 134 362 835
Total non-interest expenses 1 322 812 63 966 1 386 778
Income before income taxes 244,321 (18,449) 225,872
Provision for income taxes 3 94 429 (7 130) 87 299
Net income 149,892 (11,319) 138,573
Earnings per share $ 2 38 $ (0 18) $ 2 20
Ratios to net revenues:
Compensation and benefits 62.6 63.5
Non-compensation operating expenses 21 8 22 5
Income before income taxes 15 6 14 0
¹As of December 31, 2012.
2Legacy revenues and expense s exclude new business and investments
3Legacy provision for income taxes is calculated using the tax rate for the nine month period 2012 of 40.2%.
32