Attached files
| file | filename |
|---|---|
| 8-K - 8-K - FIRSTMERIT CORP /OH/ | a8k_kbwinvpresentationdocx.htm |

Boston Bank Conference February 27-28, 2013 FIRSTMERIT Corporation

This presentation contains forward-looking statements relating to present or future trends or factors affecting the banking industry, and specifically the financial condition and results of operations, including without limitation, statements relating to the earnings outlook of the Corporation, as well as its operations, markets and products. Actual results could differ materially from those indicated. Among the important factors that could cause results to differ materially are interest rate changes, continued softening in the economy, which could materially impact credit quality trends and the ability to generate loans, changes in the mix of the Corporation's business, competitive pressures, changes in accounting, tax or regulatory practices or requirements and those risk factors detailed in the Corporation's periodic reports and registration statements filed with the Securities and Exchange Commission. The Corporation undertakes no obligation to release revisions to these forward-looking statements or reflect events or circumstances after the date of this release. Forward-looking Statement Disclosure 2

FirstMerit Overview (1) • Headquarters: Akron, Ohio • Employees (FTE): 2,724 • Founded: 1845 • Assets: $14.9 Billion 4th largest Ohio bank 41st largest US bank • Market Capitalization: $1.7 Billion • S&P / Moody’s Hold Co. Ratings: BBB+ / A2 • Ticker: FMER (NASDAQ) 3 Source: SNL Financial. (1) Total assets at 12/31/12 and market capitalization as of 1/18/13.

The First Merit Opportunity III. Strong organic growth • Strong loan and core deposit growth through cycle in throughout footprint • Lines of business support profitable growth I. Stable earnings base • 55 consecutive quarters of profitability • Stable NIM historically and throughout the cycle IV. Experienced integrator • Successfully integrated 3 bank M&A transactions in 2010 • Robust planning, identified risks and detailed integration plan V. CRBC Deal – strategically compelling and financially attractive • Creates a premier Midwest banking franchise with $24.5 bn. in assets • EPS accretive, IRR of 18%+, with short TBV earn-back period 4 • Robust pro forma capital and capital generation capacity • Outstanding asset quality, exceptional liquidity profile, and strong core deposit base II. Robust credit, capital, and liquidity
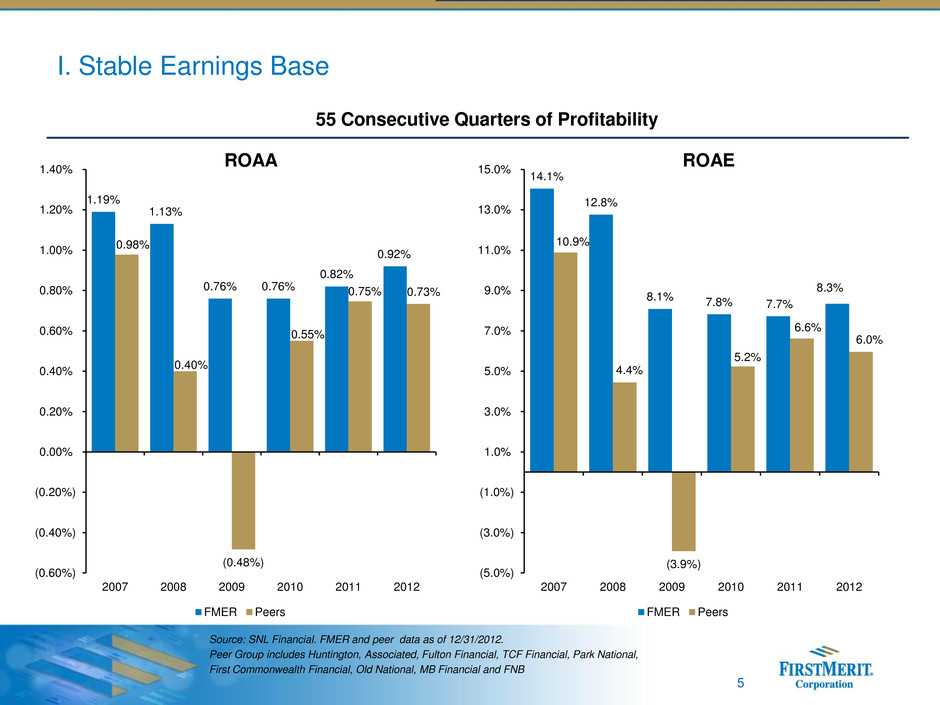
I. Stable Earnings Base Source: SNL Financial. FMER and peer data as of 12/31/2012. Peer Group includes Huntington, Associated, Fulton Financial, TCF Financial, Park National, First Commonwealth Financial, Old National, MB Financial and FNB 5 55 Consecutive Quarters of Profitability ROAA ROAE 1.19% 1.13% 0.76% 0.76% 0.82% 0.92% 0.98% 0.40% (0.48%) 0.55% 0.75% 0.73% (0.60%) (0.40%) (0.20%) 0.00% 0.20% 0.40% 0.60% 0.80% 1.00% 1.20% 1.40% 2007 2008 2009 2010 2011 2012 FMER Peers 14.1% 12.8% 8.1% 7.8% 7.7% 8.3% 10.9% 4.4% (3.9%) 5.2% 6.6% 6.0% (5.0%) (3.0%) (1.0%) 1.0% 3.0% 5.0% 7.0% 9.0% 11.0% 13.0% 15.0% 2007 2008 2009 2010 2011 2012 FMER Peers

3.74% 3.66% 3.71% 3.76% 3.73% 3.74% 3.70% 3.73% 3.80% 3.78% 3.68% 3.58% 3.58% 3.62% 3.61% 3.66% 3.60% 3.69% 3.78% 3.82% 3.53% 3.56% 3.61% 3.64% 3.72% 4.02% 3.96% 4.14% 4.00% 3.77% 3.75% 3.85% 3.78% 3.77% 3.66% 3.58% 0% 1% 2% 3% 4% 5% NIM Fed Funds* Margin Stability Source: Bloomberg *FTE 6 Margin Historical Performance • Net interest margin* stability throughout volatile interest rate cycle
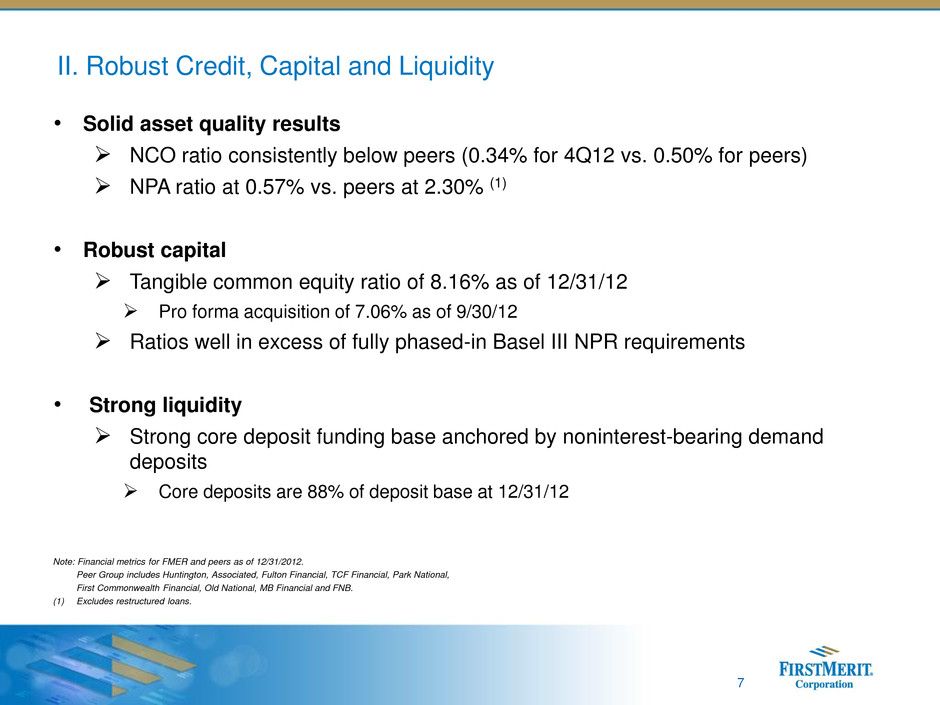
7 • Solid asset quality results NCO ratio consistently below peers (0.34% for 4Q12 vs. 0.50% for peers) NPA ratio at 0.57% vs. peers at 2.30% (1) • Robust capital Tangible common equity ratio of 8.16% as of 12/31/12 Pro forma acquisition of 7.06% as of 9/30/12 Ratios well in excess of fully phased-in Basel III NPR requirements • Strong liquidity Strong core deposit funding base anchored by noninterest-bearing demand deposits Core deposits are 88% of deposit base at 12/31/12 II. Robust Credit, Capital and Liquidity Note: Financial metrics for FMER and peers as of 12/31/2012. Peer Group includes Huntington, Associated, Fulton Financial, TCF Financial, Park National, First Commonwealth Financial, Old National, MB Financial and FNB. (1) Excludes restructured loans.

8 • Primary focus of entire management team and organization • Aligned incentives • Hired Chief Credit Officer and added other key personnel • Active internal focus on credit quality • Ongoing comprehensive internal and external review of portfolio • Implementing initiatives for ongoing credit improvement Actions to Sustain Improved Performance Source: SNL Financial. Note: Data as of 12/31/2012. Peer Group includes Huntington, Associated, Fulton Financial, TCF Financial, Park National, First Commonwealth Financial, Old National, MB Financial and FNB. Figures shown are simple averages. Credit Quality Initiatives Leads to Superior Credit Quality 0.40% 0.68% 1.22% 1.23% 0.85% 0.53% 0.43% 0.87% 1.91% 1.87% 1.52% 0.66% 0.00% 0.50% 1.00% 1.50% 2.00% 2.50% 2007 2008 2009 2010 2011 2012 N e t C h a rg e -o ff s FMER Peers

$14.6 $13.8 $12.0 $8.8 $14.9 $7.1 0.79% 0.73% 0.63% 0.45% 0.59% 0.34% 0.00% 0.50% 1.00% 1.50% $0.0 $5.0 $10.0 $15.0 $20.0 3Q11 4Q11 1Q12 2Q12 3Q12 4Q12 Net charge-of fs NCO ratio 9 Credit Results-Excluding Covered Loans (1) (1) Gray bar represents $10.6 million of accruing consumer post chapter 7 bankruptcy loans reclassified to non performing based on guidance from the Office of the Comptroller of the Currency. NCO ratio excludes reclassification impact. Net c h a rg e -of fs $ m m N C O R a ti o 176.5% 205.0% 234.3% 208.1% 284.5% 1.06% 0.87% 0.75% 0.77% 0.57% 0.00% 1.00% 2.00% 3.00% 0.0% 60.0% 120.0% 180.0% 240.0% 300.0% 4Q11 1Q12 2Q12 3Q12 4Q12 Reserves/NPLs NPA Ratio Re s e rv e s / NPL s NP A Rat io (1)

10 (dollars in thousands) December 31, 2012 September 30, 2012 December 31, 2011 Consolidated Total Equity $1,645,202 11.03% $1,624,704 11.11% $1,565,953 10.84% Common Equity 1,645,202 11.03% 1,624,704 11.11% 1,565,953 10.84% Tangible common equity (a) 1,178,785 8.16% 1,157,843 8.18% 1,097,670 7.86% Tier 1 capital (b) 1,193,188 11.25% 1,170,095 11.37% 1,119,892 11.48% Total risk-based capital (c) 1,325,971 12.50% 1,298,944 12.63% 1,242,177 12.73% Leverage (d) 1,193,188 8.43% 1,170,095 8.25% 1,119,892 7.95% (a) Common equity less all intangibles; computed as a ratio to total assets less intangible assets. (b) Shareholders’ equity less goodwill; computed as a ratio to risk adjusted assets, as defined in the 1992 risk based capital guidelines. (c) Tier 1 capital plus qualifying loan less allowance, computed as a ratio to risk adjusted assets as defined in the 1992 risk based capital guidelines. (d) Tier 1 capital computed as a ratio to the latest quarter’s average assets less goodwill. Solid Capital Levels

11 (*) Excluding covered loans, both portfolios represent total end of period at 12/31/12 III. Strong Organic Growth Commercial Loans* Consumer Loans
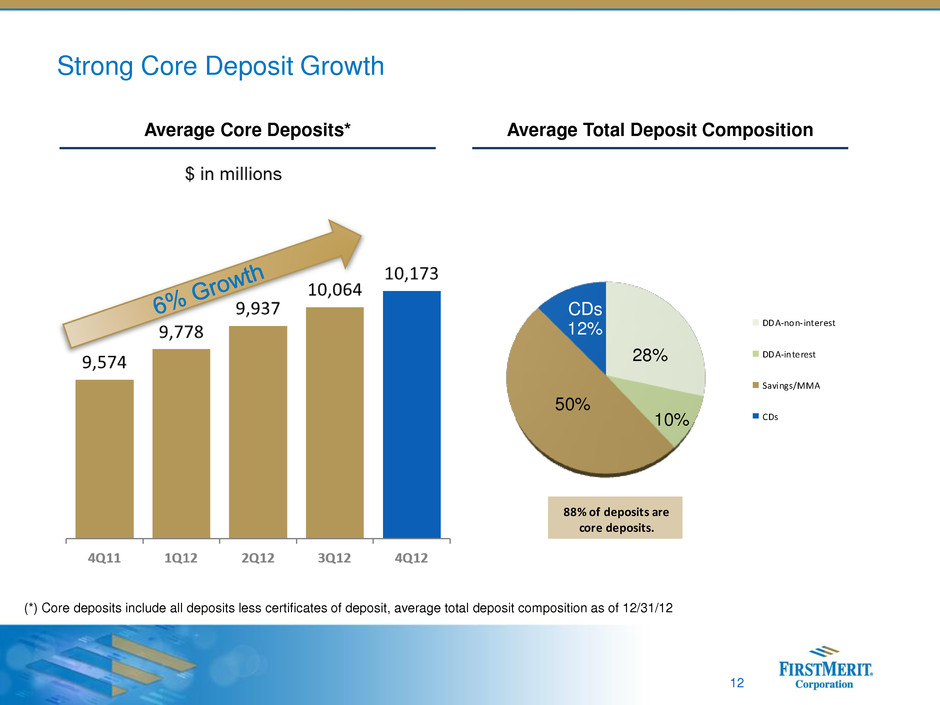
28% 10% 50% CDs 12% DDA-non-interest DDA-interest Savings/MMA CDs 88% of deposits are core deposits. 12 (*) Core deposits include all deposits less certificates of deposit, average total deposit composition as of 12/31/12 Strong Core Deposit Growth Average Core Deposits* Average Total Deposit Composition

13 • Strong management experience (avg. 25 years) • Diverse customer base • Strong customer service model • Strong deposit gathering abilities • $6.8 billion loan portfolio • High ROE small business banking unit • Middle market, business banking, CRE, asset based lending, public funds, card services- merchant, capital markets, treasury management, skilled care, dealer services, SBA Commercial Banking: Superior Service Model Overview • Awarded “Outstanding” rating for performance under the Community Reinvestment Act Service Awards and Ratings • 12 Greenwich Associates awards in 2012: Including national and regional recognition for middle market and small business banking (1) as of 12/31/12

14 (*) Excluding covered loans, average commercial loan composition at 12/31/12 Commercial Loan Portfolio* Average Commercial Loans* Commercial Loan Composition

15 • Concentrated branch network 196 branches in Ohio, Western Pa. and Chicago #1 Market Share in Akron #2 Market Share in Canton • Customer Service Culture • Full Suite of Traditional Retail Banking Products Profitable Merchant, Debit and Credit Card Businesses Consumer Banking: Broad Services and Customer Satisfaction • Awarded highest customer satisfaction in Ohio by JD Power & Associates in 2012 6th consecutive year • Providing Strong Results 7.8% increase in retail average core deposits in 2012 #1 in Ohio Overview Committed to Superior Service

16 • Strong Complement with Owner-Managed Business • High ROE Business • Assets under management and administration: $6.3bn • Loans: $224mm • Deposits: $774mm • Expansive Product Suite Investment management Estate and succession planning Private banking (credit/deposit services) Trust services Financial and tax planning Insurance services Brokerage services Employee benefits (401-k, Pension) Wealth Management: Comprehensive Array of Services • Cross-Selling Initiatives with Commercial / Consumer Banking Strong customer retention tool Focused on capturing customer liquidity events 29.0% 31.7% 41.0% 43.5% 47.2% 2Q08 4Q08 4Q10 4Q11 4Q12 % of commercial customers using wealth management services Overview Wealth Penetration (1) As of 12/31/12

Chicago franchise Chicago MSA franchise demographics * Chicago Enhances FirstMerit’s Franchise for Organic Growth • Branch network conveniently located across greater Chicago MSA • Market provides organic growth opportunities $486 mm in commercial loan origination in 2012 $394 mm in commercial loan origination in 2011 $179 mm in commercial loan origination in 2010 Population (2010) 9,739,919 Households (2010) 3,500,698 Projected population growth (’10-’15) 1.86% Median household income (2010) $65,796 Projected household income growth (’10-’15) 16.57% 17 Source: SNL Financial

Assets: $415 million Branches: 24 February 2010 Assets: $420 million Branches: 4 February 2010 Assets: $3.0 billion Branches: 26 May 2010 • Successful integration in a new market – Seamless conversions of three franchises in 2010, within very compressed, overlapping timelines – Smooth transition from announcement to conversion – Experienced project management team executing integration process • Chicago commercial lending initiative began in February 2010 with a commercial staff of 5, which has significantly exceeded expectations – FirstMerit’s commercial team today has grown to 56 relationship managers – Commercial calling effort has developed over $1billion in loans outstanding with total commitments of $2.2 billion in just 2 ½ years • Total Chicago loan portfolio at $2 billion of outstanding loans – Balanced portfolio – approximately $1 billion of new production and $1 billion of acquired loans IV. Experienced Integrator 18
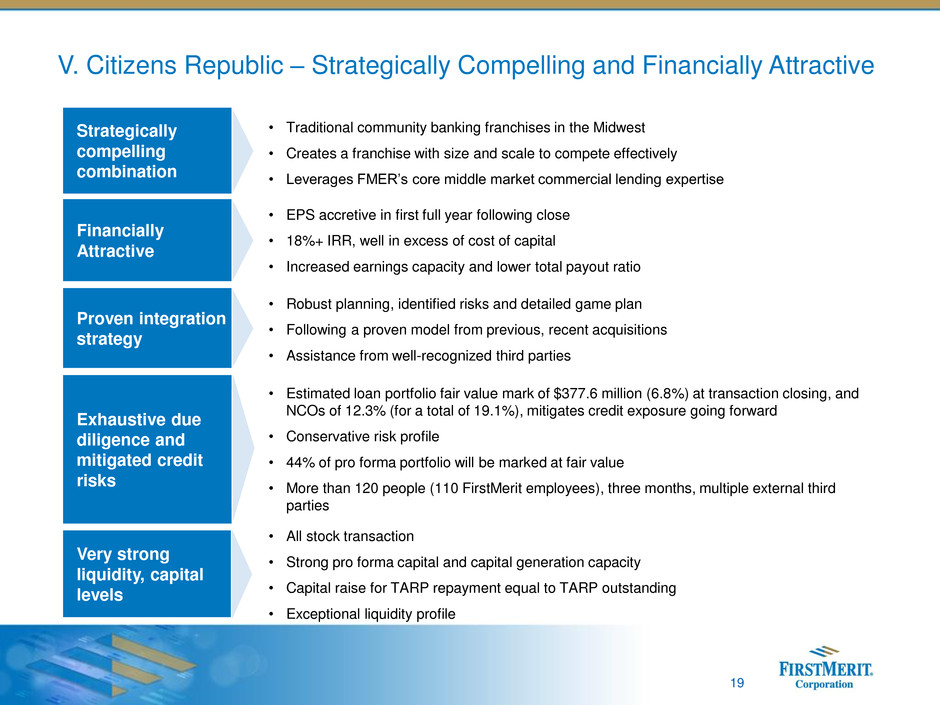
V. Citizens Republic – Strategically Compelling and Financially Attractive Strategically compelling combination • Traditional community banking franchises in the Midwest • Creates a franchise with size and scale to compete effectively • Leverages FMER’s core middle market commercial lending expertise Proven integration strategy • Robust planning, identified risks and detailed game plan • Following a proven model from previous, recent acquisitions • Assistance from well-recognized third parties Exhaustive due diligence and mitigated credit risks • Estimated loan portfolio fair value mark of $377.6 million (6.8%) at transaction closing, and NCOs of 12.3% (for a total of 19.1%), mitigates credit exposure going forward • Conservative risk profile • 44% of pro forma portfolio will be marked at fair value • More than 120 people (110 FirstMerit employees), three months, multiple external third parties Very strong liquidity, capital levels • All stock transaction • Strong pro forma capital and capital generation capacity • Capital raise for TARP repayment equal to TARP outstanding • Exceptional liquidity profile 19 • EPS accretive in first full year following close • 18%+ IRR, well in excess of cost of capital • Increased earnings capacity and lower total payout ratio Financially Attractive
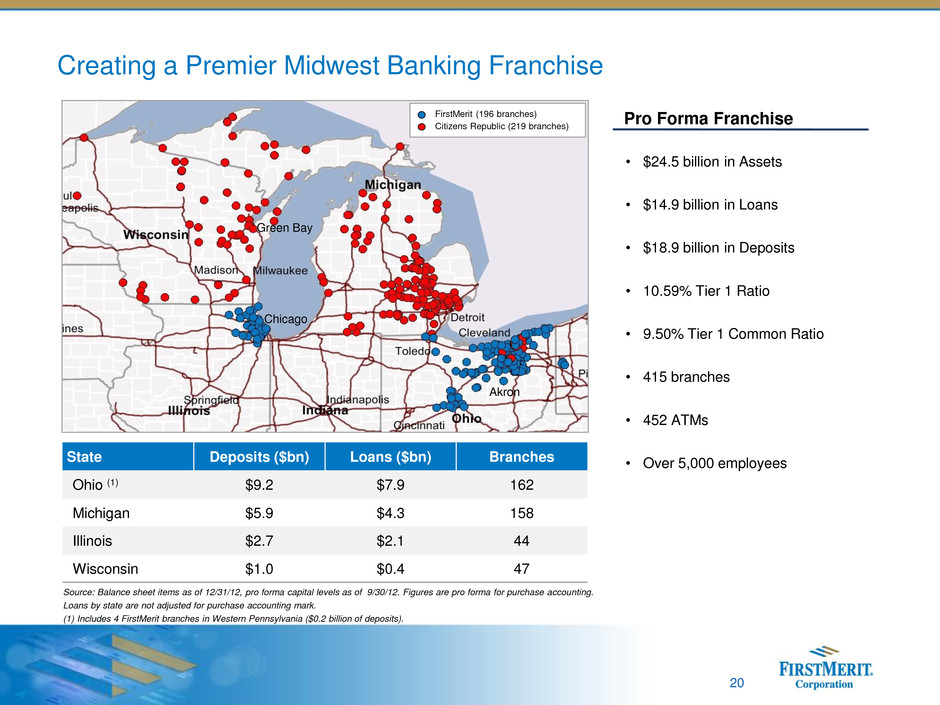
Creating a Premier Midwest Banking Franchise Source: Balance sheet items as of 12/31/12, pro forma capital levels as of 9/30/12. Figures are pro forma for purchase accounting. Loans by state are not adjusted for purchase accounting mark. (1) Includes 4 FirstMerit branches in Western Pennsylvania ($0.2 billion of deposits). • $24.5 billion in Assets • $14.9 billion in Loans • $18.9 billion in Deposits • 10.59% Tier 1 Ratio • 9.50% Tier 1 Common Ratio • 415 branches • 452 ATMs • Over 5,000 employees State Deposits ($bn) Loans ($bn) Branches Ohio (1) $9.2 $7.9 162 Michigan $5.9 $4.3 158 Illinois $2.7 $2.1 44 Wisconsin $1.0 $0.4 47 FirstMerit (196 branches) Citizens Republic (219 branches) Green Bay Chicago Akron Pro Forma Franchise 20

$118 $112 $87 $57 $25 $22 $21 $18 $17 $15 $14 $13 $13 $10 $10 $0 $25 $50 $75 $100 $125 $150 $175 USB FITB BMO / Harri s KEY HBAN ASBC CBSH TC B WTF C FBC UMB F PVTB CBC YB 21 A Stronger Regional Presence Top Banks Headquartered in the Midwest by Assets (1) Source: SNL Financial as of 1/18/13. (1) Excludes mutual holding companies and NTRS. ($ in billions) Top Banks Headquartered in the Midwest by Market Capitalization (1) ($ in billions) $14.4 $8.7 $5.9 $3.4 $2.5 $2.3 $2.1 $1.9 $1.8 $1.7 $1.4 $1.4 $1.4 $1.3 $1.3 $1.2 $1.0 $1.0 $1.0 $0.9 $0.8 $0.0 $5.0 $10.0 $15.0 $20.0 $25. USB FITB KEY HBAN CBSH ASBC TCB UMBF CFFN CBCY B WTFC FINN ONB PVTB MBF I PRK FMBI FBC FFBC $60.0 $65.0 $61.4 $353 $350 $375

22 Compelling Financial Rationale Summary of Key Deal Terms Superior Returns • First full-year EPS accretion of 7.5% (3) • 18%+ IRR (3) • TBV dilution of 6.9%, inclusive of balance sheet restructuring charge • Earn-back of TBV dilution of under 2.5 years (3) Conservative Synergies • 22% ($59 million) cost savings net of investments (3) • Future synergies accruing to combined shareholders • Further opportunity to leverage FirstMerit’s efficiency discipline Mitigated Credit Risk • Extensive credit review involving both FirstMerit’s credit team and third party valuation consultants • 6.8% loan mark ($378 million) and implied 19.1% credit cycle losses FMER – CRBC (1) Recent Transactions – Median (2) Price / Book Value: 0.87x 1.49x Price / Tangible Book Value: 1.26x 1.75x Core Deposit Premium: 2.8% 10.4% (1) At announcement. (2) Based on the following transactions (Buyer / Target): Union Bank / Pacific Capital, Prosperity / American State, Susquehanna / Tower, Valley National / State, Brookline / Bancorp Rhode Island, Susquehanna / Abington, People’s United / Danvers, Comerica / Sterling, Hancock / Whitney, BMO / Marshall & Ilsley, M&T / Wilmington, and First Niagara / New Alliance. (3) Estimated. Attractive Pricing • Fixed Exchange Ratio: 1.37 shares of FEMR for each share of CRBC • TARP Repayment at closing, subject to regulatory authorization and Treasury approval • $88 million pre-tax merger-related charges

23 FMER 12/31/12 FMER Pro Forma Well-Capitalized Minimums TCE / TA 8.16% 7.06% N/A Leverage Ratio 8.43% 7.30% 5.00% Tier 1 Common Ratio 11.25% 9.50% N/A Tier 1 Ratio 11.25% 10.59% 6.00% Total Risk-Based Capital 12.50% 13.06% 10.00% Strong Balance Sheet • Preliminary estimates based on Basel III NPR show capital ratios in excess of fully phased in requirements • Successful capital actions – Raised $250 million of Tier 2 debt and $100 million of Tier 1 preferred in 1Q13 • Expect to quickly accumulate capital – Recover TCE / TA in under 2 years • Excellent prospects to reinvest in business Capital Ratios Pro forma capital levels as of 9/30/12. (1) (1)

Lending Presence and Product Offerings Source: SNL Financial based on regulatory data as of 12/31/12. Note: CRBC and FMER loan compositions do not reflect estimated loan mark. + • Leverage FirstMerit’s lending expertise across the Citizens Republic footprint – Commercial banking: middle market, business banking and asset-based lending – Indirect auto and dealer services – Mortgage banking and credit card • Expand Citizens Republic’s specialized indirect consumer lending experience – Extensive experience in indirect consumer lending with over 750 dealer relationships across the Midwest – Superior credit – NPLs were ~35bps of total loans throughout the cycle ($ in millions) Pro Forma 24 Gross Loans: $9,660.7 Gross Loans: $5,269.7 Gross Loans: $14,930.4

Strong Core Deposit Funding Source: SNL Financial based on GAAP data as of 12/31/12. (*) Core deposits include all deposits less certificates of deposit. + • Deposit product offering very similar to FirstMerit’s • Strong core deposit funding base anchored by noninterest-bearing demand deposits • Opportunity for additional core deposit growth driven by growing middle market commercial relationships 25 Pro Forma Deposits: $11,759.4 MRQ Cost: 0.27% Core Deposits: 88%* Deposits: $18,920.2 MRQ Cost: 0.34% Core Deposits: 84%* Deposits: $7,160.8 MRQ Cost: 0.46% Core Deposits: 76%* ($ in millions)

26 Disciplined Execution Strategy • FirstMerit will leverage its extensive, best-practice integration experience from its recent Chicago expansion – FDIC deals were significantly more complex – Limited involvement from target institutions • Disciplined FirstMerit project management approach to integration has begun – Every line of business and functional area is participating and communicating daily – Third party experts utilized as necessary, especially in IT area • Similar product sets and product features across all business lines facilitate a smooth integration and transition for customers and staff – Core operating systems both provided by Fidelity Information Services (FIS) • Hiring of Sandra Pierce establishes strong, local leadership in that market – Enhancing customer and employee experience during transition

The First Merit Opportunity III. Strong organic growth • Strong loan and core deposit growth through cycle in throughout footprint • Lines of business support profitable growth I. Stable earnings base • 55 consecutive quarters of profitability • Stable NIM historically and throughout the cycle IV. Experienced integrator • Successfully integrated 3 bank M&A transactions in 2010 • Robust planning, identified risks and detailed integration plan V. CRBC Deal – strategically compelling and financially attractive • Creates a premier Midwest banking franchise with $24.5 bn. in assets • EPS accretive, IRR of 18%+, with short TBV earn-back period 27 • Robust pro forma capital and capital generation capacity • Outstanding asset quality, exceptional liquidity profile, and strong core deposit base II. Robust credit, capital, and liquidity
