Attached files
| file | filename |
|---|---|
| 8-K - 8-K - FIRST BANCORP /PR/ | d491704d8k.htm |
 Investor
Presentation Investor Presentation
February 2013
February 2013
Exhibit 99.1 |
 Disclaimer
2
This presentation contains “forward-looking statements” concerning First
BanCorp’s (the “Corporation”) future economic performance. The words or phrases “would be,”
“will allow,” “intends to,” “will likely result,” “are
expected to,” “expect,” “anticipate,” “look forward,” “should,” “believes” and similar expressions are meant to identify
“forward-looking statements” within the meaning of Section 27A of the Private
Securities Litigation Reform Act of 1995, and are subject to the safe harbor created by such
section. The Corporation wishes to caution readers not to place undue reliance on any such
“forward-looking statements,” which speak only as of the date made, and to
advise readers that various factors, including, but not limited to, uncertainty about whether
the Corporation and FirstBank Puerto Rico (“FirstBank” or “the Bank”) will be able
to fully comply with the written agreement dated June 3, 2010 that the Corporation entered
into with the Federal Reserve Bank of New York (the “FED”) and the order dated
June 2, 2010 (the “Order”)that FirstBank entered into with the FDIC and the
Office of the Commissioner of Financial Institutions of Puerto Rico that, among other things,
require FirstBank to maintain certain capital levels and reduce its special mention,
classified, delinquent and non-performing assets; the risk of being subject to possible
additional regulatory actions; uncertainty as to the availability of certain funding sources,
such as retail brokered CDs; the Corporation’s reliance on brokered CDs and its
ability to obtain, on a periodic basis, approval from the FDIC to issue brokered CDs to fund
operations and provide liquidity in accordance with the terms of the Order; the risk of
not being able to fulfill the Corporation’s cash obligations or resume paying dividends to the Corporation’s stockholders in the future due to the Corporation’s inability to
receive approval from the FED to receive dividends from FirstBank or FirstBank’s failure
to generate sufficient cash flow to make a dividend payment to the Corporation; the
strength or weakness of the real estate markets and of the consumer and commercial credit
sectors and their impact on the credit quality of the Corporation’s loans and other
assets, including the Corporation’s construction and commercial real estate loan
portfolios, which have contributed and may continue to contribute to, among other things,
the high levels of non-performing assets, charge-offs and the provision expense and
may subject the Corporation to further risk from loan defaults and foreclosures; adverse
changes in general economic conditions in the United States and in Puerto Rico, including the
interest rate scenario, market liquidity, housing absorption rates, real estate prices
and disruptions in the U.S. capital markets, which may reduce interest margins, impact funding sources and affect demand for all of the Corporation’s products and
services and the value of the Corporation’s assets; an adverse change in the
Corporation’s ability to attract new clients and retain existing ones; a decrease in demand for the
Corporation’s products and services and lower revenues and earnings because of the
continued recession in Puerto Rico and the current fiscal problems and budget deficit of
the Puerto Rico government; uncertainty about regulatory and legislative changes for financial
services companies in Puerto Rico, the United States and the U.S. and British Virgin
Islands, which could affect the Corporation’s financial performance and could cause the Corporation’s actual results for future periods to differ materially from prior
results and anticipated or projected results; uncertainty about the effectiveness of the
various actions undertaken to stimulate the United States economy and stabilize the
United States’ financial markets, and the impact such actions may have on the
Corporation’s business, financial condition and results of operations; changes in the fiscal and
monetary policies and regulations of the federal government, including those determined by the
Federal Reserve System, the FDIC, government-sponsored housing agencies and
regulators in Puerto Rico and the U.S. and British Virgin Islands; the risk of possible failure or circumvention of controls and procedures and the risk that the Corporation’s
risk management policies may not be adequate; the risk that the FDIC may further increase the
deposit insurance premium and/or require special assessments to replenish its insurance
fund, causing an additional increase in the Corporation’s non-interest expense; risks of not being able to recover the assets pledged to Lehman Brothers Special
Financing, Inc.; the impact on the Corporation’s results of operations and financial
condition associated with acquisitions and dispositions; a need to recognize additional
impairments on financial instruments or goodwill relating to acquisitions; risks that
downgrades in the credit ratings of the Corporation’s long-term senior debt will adversely
affect the Corporation’s ability to access necessary external funds; the impact of the
Dodd-Frank Wall Street Reform and Consumer Protection Act on the Corporation’s
businesses, business practices and cost of operations; and general competitive factors and
industry consolidation. The Corporation does not undertake, and specifically
disclaims any obligation, to update any “forward-looking statements” to reflect
occurrences or unanticipated events or circumstances after the date of such statements
except as required by the federal securities laws. Investors should refer to the
Corporation’s Annual Report on Form 10-K for the year ended December 31, 2011 for a
discussion of such factors and certain risks and uncertainties to which the Corporation is
subject. |
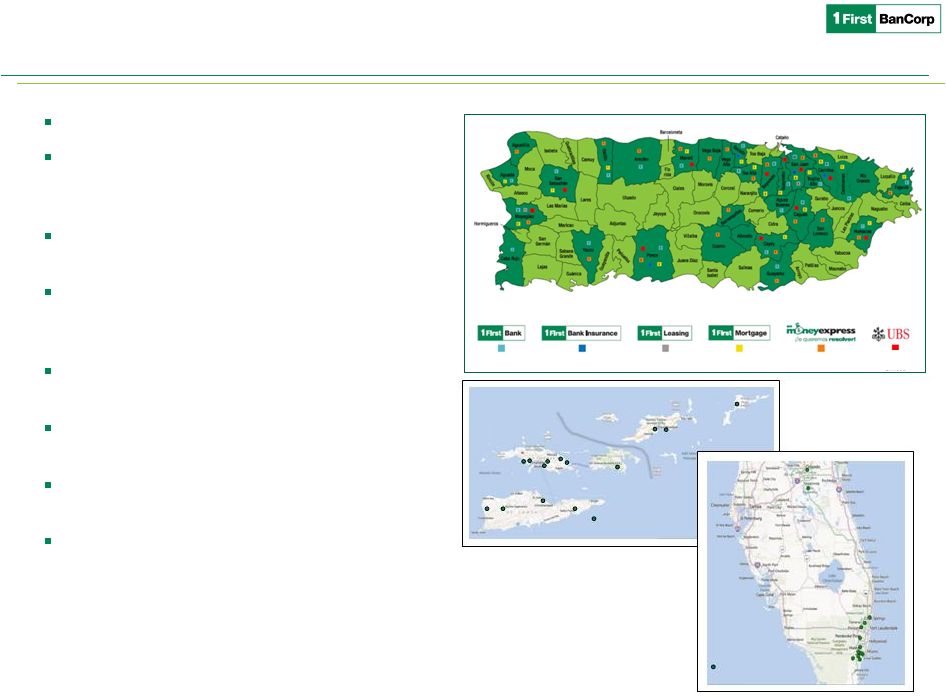 Franchise
Overview Founded in 1948 (65 years)
Headquartered in San Juan, Puerto Rico
with operations in PR, Eastern Caribbean
(Virgin Islands) and Florida
A well diversified operation with over
650,000 retail & commercial customers
2nd largest financial holding company in
Puerto Rico with attractive business mix
and substantial loan market share
The largest bank in the Virgin Islands with
over 40% market share
Small presence in Florida serving south
Florida region
151 ATM machines and largest ATM
network in the Eastern Caribbean Region
~2,500 FTE employees
As of December 31, 2012
Eastern Caribbean Region or ECR includes United States and British Virgin Islands
FTE = Full Time Equivalent
Well diversified with significant competitive strengths
3
Total Assets -
$13.1B
Total Loans -
$10.1B
Total Deposits -
$9.9B
Eastern Caribbean:
7% of Assets
14 bank branches
3 First Express branches
13 bank branches
1 Loan Production Office
Florida:
7% of Assets
Puerto Rico: 86% of Assets
48 branches
5 branches
2 branches
38 branches
26 branches
8 In-branch
offices |
 Franchise
Overview Strong and uniquely positioned market franchise
in densely populated operating footprints
Strong market share in loan portfolios facilitates
customer relationship expansion and cross sell
to increase deposit share
Unique challenger to Puerto Rico’s largest player
4
Puerto
Rico
Total
Assets
1
Puerto
Rico
Total
Loans
1
Puerto
Rico
Deposits,
Net
of
Brokered
1
($ in millions)
Portfolio
Balance
Market
Share
Portfolio
Balance
Market
Share
Portfolio
Balance
Market
Share
1
Banco Popular
$24,799
35.9%
1
Banco Popular
$18,848
36.8%
1
Banco Popular
$17,253
43.7%
2
FirstBank
10,637
15.4%
2
FirstBank
8,681
17.0%
2
Banco Santander
5,340
13.5%
3
Scotiabank
7,532
10.9%
3
Scotiabank
5,481
10.7%
3
FirstBank
4,276
10.8%
4
Banco Santander
7,084
10.3%
4
Banco Santander
5,159
10.1%
4
Scotiabank
3,481
8.8%
5
Oriental Bank
5,937
8.6%
5
Doral Bank
4,095
8.0%
5
BBVA
2,783
7.1%
6
Doral Bank
5,718
8.3%
6
BBVA
3,701
7.2%
6
Oriental Bank
2,080
5.3%
7
BBVA
4,962
7.2%
7
Other
2,586
5.0%
7
Citibank
1,927
4.9%
8
Citibank
1,928
2.8%
8
Oriental Bank
1,687
3.3%
8
Doral Bank
1,879
4.8%
9
Banco Cooperativo
498
0.7%
9
Citibank
814
1.6%
9
Banco Cooperativo
423
1.1%
10
BBU
8
0.0%
10
Banco Cooperativo
160
0.3%
10
BBU
23
0.1%
Total
$69,102
100%
Total
$51,213
100%
Total
$39,466
100%
Institutions
Institutions
Institutions
Puerto Rico
ECR
Florida
Banking Branches
48
14
13
Wholesale Banking
Retail Banking
Consumer Lending
2
Mortgage Banking
Insurance
Retail Brokerage
3
Wholesale Brokerage
4
1 Puerto Rico only; 2 FirstBank acquired the FirstBank-branded credit card portfolio of
$391MM book balance as of June 30, 2012; 3 Provided through alliance with UBS; 4 Established primarily for
municipal financing
Source: PR Market Share Report prepared with data provided by the Commissioner of Financial
Institutions of Puerto Rico as of 9/30/2012 |
 5
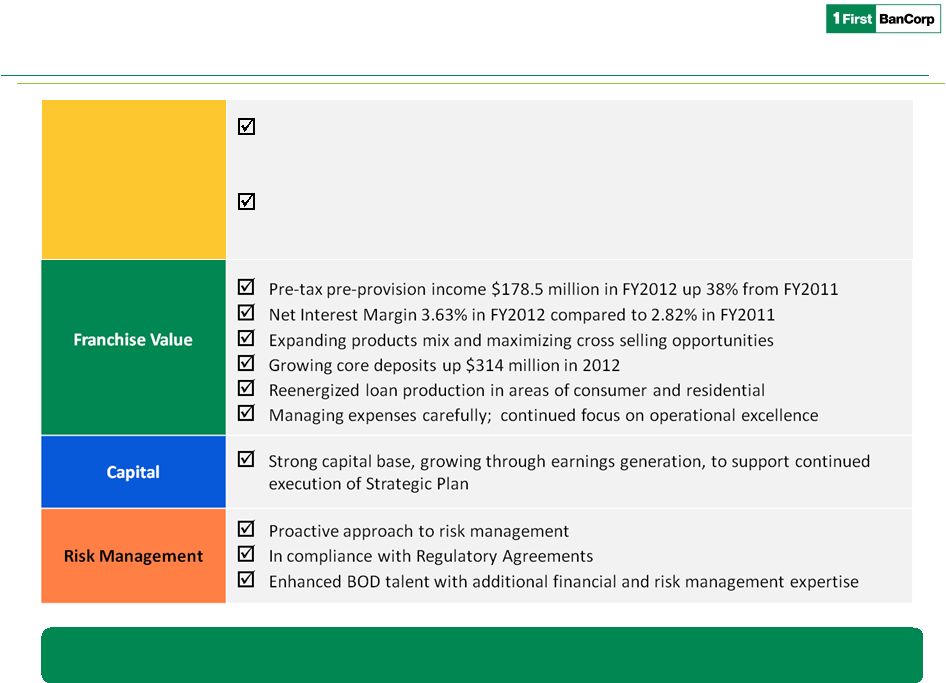
Core Franchise is Strong
Executing Strategic Plan Toward Goal to Return to Profitability
Management focused on continued strengthening of the franchise and
solidifying its strong well-respected position in PR
Balance Sheet
Improving risk profile; focusing on reducing NPAs
Executing on opportunities to reduce cost of funds
•
NPAs
decreased
for
the
11
th
consecutive
quarter
•
NPLs down 14.5% year over year
•
$2.2 billion brokered CDs maturing in twelve months at average rate of 1.66%
|
 6
($ in millions; except per share data)
FY 2012
FY 2011
Variance
Select Financial Data
2012 vs. 2011 Financial Highlights
Net Income (Loss)
29.8
$
(82.2)
$
136.2%
Adjusted Pre-tax, Pre-provision Income
178.5
$
129.5
$
37.8%
Net Interest Margin (GAAP)
3.63%
2.82%
28.7%
Nonperforming Loans
978
$
1,143
$
(14.5%)
Nonperforming Assets
1,238
$
1,337
$
(7.4%)
Total Loans
10,139
$
10,575
$
(4.1%)
Total Assets
13,100
$
13,127
$
(0.2%)
Non-interest Bearing Deposits
837
$
706
$
18.6%
Interest-bearing Deposits, Net of Brokered CDs
5,653
$
5,470
$
3.3%
Brokered CDs
3,375
$
3,732
$
(9.6%)
Total Capital Ratio
17.8%
17.1%
4.1%
Tier 1 Capital Ratio
16.5%
15.8%
4.4%
Leverage Ratio
12.6%
11.9%
5.7%
Tier 1 Common Ratio
13.6%
13.0%
4.9%
Tangible Common Ratio
10.4%
10.3%
1.8%
Book Value per Share
6.89
$
6.73
$
2.4%
Tangible Book Value per Share
6.59
$
6.54
$
0.8%
Common Stock Price
4.58
$
3.96
$
15.7% |
 Focus on
Rebuilding Earnings 1 Non-GAAP financial measure; See reconciliation on page
16 2 Fair value adjustments on derivatives and financial liabilities measured at fair
value; See reconciliation on page 17 Third consecutive quarterly profit and first
profitable year since 2008 7
($ in millions, except per share results)
4Q 2012 Highlights
Net income of $14.5MM
PTPP Improvement of $3.1MM from Q3 2012 and $26.0 MM, or 91%, from Q4 2011.
Total non-performing assets decreased for the eleventh consecutive quarter, decreasing by
$21.1MM Capital remains strong with total capital ratio, tier 1 and leverage reaching
17.8%, 16.5% and 12.6%, respectively Income Statement
4Q 2011
1Q 2012
2Q 2012
3Q 2012
4Q 2012
Net interest income, excluding valuations
100.3
$
101.6
$
108.2
$
125.3
$
125.2
$
Valuations
(1.7)
0.3
0.5
0.2
0.4
GAAP Net Interest Income
98.6
101.9
108.7
125.5
125.6
Provision for loan and lease losses
42.0
36.2
24.9
29.0
30.5
Non-interest income
13.0
14.7
16.5
17.3
20.1
Equity in (losses) gains of unconsolidated
entities 1.7
(6.2)
(2.5)
(2.2)
(8.3)
Non-interest expense
85.9
85.2
86.9
91.8
90.9
Pre-tax net loss
(14.6)
(11.0)
10.9
19.8
16.0
Income tax (expense) benefit
(0.2)
(2.1)
(1.5)
(0.8)
(0.2)
Net income (loss)
(14.8)
$
(13.1)
$
9.4
$
19.1
$
14.5
$
Adjusted Pre-tax pre-provision (PTPP) earnings
28.5
$
34.8
$
37.9
$
51.4
$
54.5
$
Net Interest Margin, excluding valuations (%)
2.99%
3.20%
3.44%
3.98%
3.90%
Net (loss) income per common share-basic
1.36
$
(0.06)
$
0.05
$
0.09
$
0.07
$
(1)
(2) |
 2011
2012
Mkt Share
Rank
16%
2
7%
3
17%
2
14%
4
19%
2
16%
2
7%
4
17%
2
11%
4
5%
2
9%
4
5%
5
10%
3
11%
3
15%
8%
19%
15%
19%
17%
9%
19%
12%
9%
10%
6%
11%
12%
85%
92%
81%
86%
81%
83%
91%
81%
88%
91%
90%
94%
89%
89%
Assets
Personal Loans
Commercial Loans
Construction
Auto/Leasing
Small Personal Loans
Mortgage Originations
Credit Cards
ACH Transactions
POS Terminals
ATM Terminals
Debit Cards
Deposits
Branches
FirstBank
Building Franchise Value
Puerto Rico
Opportunities for ongoing market share gains on
selected products based on fair share of market
Largest opportunity on deposit products,
electronic banking & transaction services
Selected loan products growth for balanced
risk/return to manage risk concentration and
diversify income sources
Acquired FirstBank-branded credit card portfolio
from FIA Card Services, N.A.
Diversifies revenue stream and loan portfolio
composition
Opportunity to broaden and deepen relationships
Florida
Expansion prospects in Florida given long term
demographic trends
Continue focus in core deposit growth,
commercial and transaction banking and
conforming residential mortgages
Virgin Islands
Solidify leadership position by further increasing
customer share of wallet
Targeted strategies for growth
8
Market
Share
in
Main
Market
1
1 Puerto Rico only
Source: Office of the Commissioner of Financial Institutions of Puerto Rico as of 9/30/2012
and internal reports; commercial loans include loans collateralized by real estate |
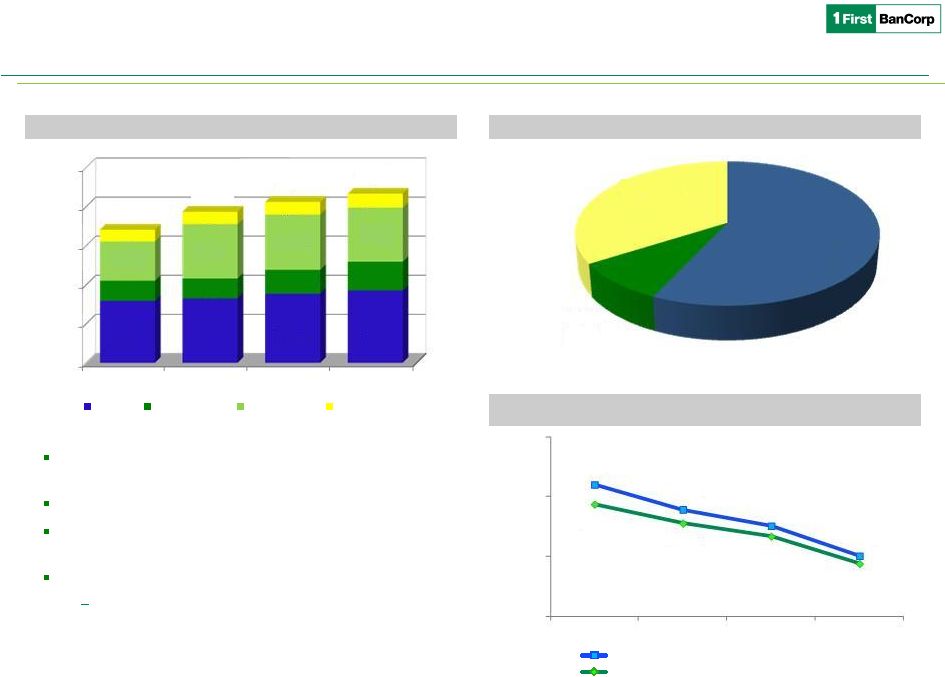 1 Net of
Brokered CDs Building Franchise Value
Successful deposits growth over recent years
9
($ in millions)
Deposits, Net of Brokered CDs
Total Deposit Composition
Cost
of
Deposits
1
Core deposit growth strategy continues providing
positive results; $1.4B since 2009
Focus remains on cross-selling opportunities
Cost of interest bearing deposits, net of brokered CDs,
decreased to 1.01% from 1.51% in 2011
Reduced reliance on brokered CDs
34% of deposits are brokered CDs, down from
60% in 2009
$-
$1,500
$3,000
$4,500
$6,000
$7,500
2009
2010
2011
2012
2,381
2,477
2,654
2,776
774
763
915
1,108
1,505
2,090
2,126
2,077
448
470
481
529
$5,108
$5,800
$6,176
$6,490
Retail
Commercial
CDs & IRAs
Public Funds
Interest
Bearing
57%
Non-interest
Bearing
9%
Brokered CDs
34%
2.20%
1.79%
1.51%
1.01%
1.87%
1.56%
1.34%
0.88%
0.00%
1.00%
2.00%
3.00%
2009
2010
2011
2012
Interest Bearing Deposits, Net of Brokered CDs
Total Deposits, Net of Brokered CDs |
 Well Diversified
Loan Portfolio Continued focus on originations that meet risk appetite
and pricing targets to optimize the portfolio:
Size of the portfolio should remain constant.
Continued focus on NPL reduction strategies
while selectively replacing with performing loans.
Reentered credit card business with the acquisition of
$400MM credit card portfolio of ~140K active
FirstBank-branded credit cards in May 2012
Expanding products mix in commercial and small &
middle market business
Strong Origination Capabilities
10
($ in millions)
Loan Portfolio
Asset Composition
Loan Originations
Loans Held for Sale
Commercial
Construction
Consumer & Finance Leases
Residential Mortgage
$691
$569
$838
$755
$914
$13,949
$11,957
$10,575
$10,139
$0
$5,000
$10,000
$15,000
$20,000
$25,000
2009
2010
2011
2012
13,421
11,403
10,081
9,704
4,867
3,369
2,244
2,011
1,340
821
802
1,385
$19,628
$15,593
$13,127
$13,100
Total loans, net of ALLL
Investments & Money Markets
Cash & Other
$0
$5,000
$10,000
$15,000
2009
2010
2011
2012
3,596
3,417
2,874
2,799
1,898
1,716
1,562
1,553
1,493
701
428
399
6,942
5,822
5,695
5,545
20
301
16
44
$
$250
$500
$750
$1,000
4Q 2011
1Q 2012
2Q 2012
3Q 2012
4Q 2012
160
162
194
187
214
163
160
237
304
305
14
10
16
12
39
354
237
391
252
357 |
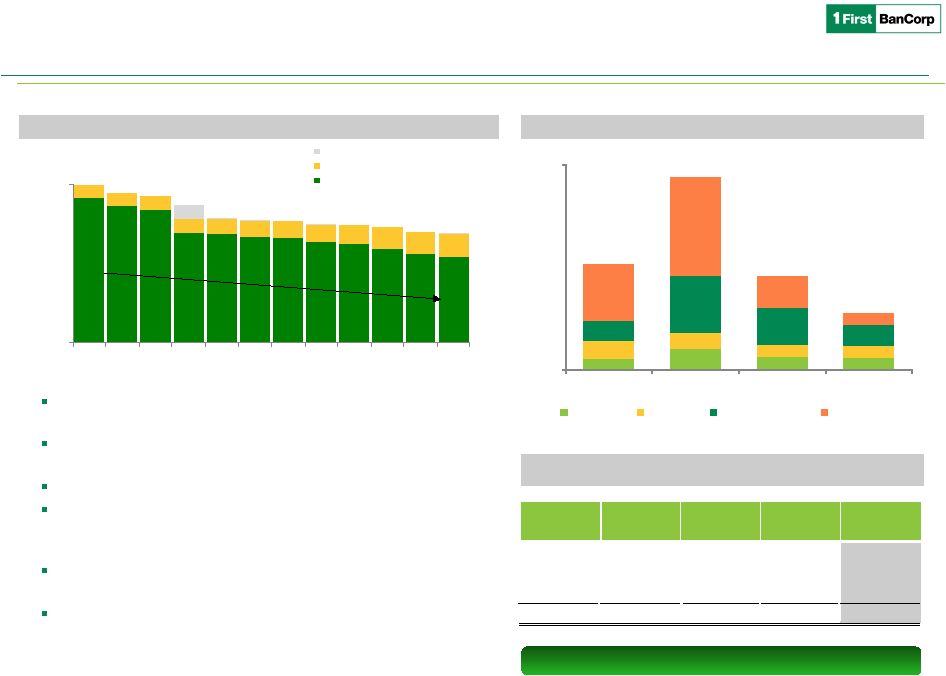 Improved Risk
Profile 11
($ in millions)
Net Charge-offs
Non-performing Assets
Reduced NPLs by 40% since peak in 1Q 2010 and stabilized
migration to NPL
Reduced
exposure
to
construction
loans
by
88%
since
peak
1
,
a major driver of losses
Decreasing charge-off trend
OREO increased $9MM in Q412 mainly due to foreclosed
commercial properties as a result of SAGs workout / legal
strategies
Commercial NPLs are being carried at 56% of unpaid principal
balance, net of specific reserves
Heightened focus on opportunistic loan sales, organic
workouts, and OREO disposition through Special Assets Group
1
From December 31, 2008 to December 31, 2012
³
Net Carrying Amount = % of carrying value net of reserves and accumulated
charge-offs 1,639
976
1,790
1,701
1,669
1,562
1,410
1,390
1,377
1,337
1,332
1,308
1,259
1,238
$-
$1,800
Q1 10
Q2 10
Q3 10
Q4 10
Q1 11
Q2 11
Q3 11
Q4 11
Q1 12
Q2 12
Q3 12
Q4 12
Loans Held for Sale
Repossessed Assets & Other
Non-performing Loans
Commercial
Non-performing
Loans
(2)
Allowance coverage ratio of 4.33%
29
63
39
37
61
54
37
35
60
180
118
67
183
313
101
41
$333
$610
$295
$179
$-
$650
2009
2010
2011
2012
Residential
Consumer
Commercial & CRE
Construction
Book Value
Accumulated
Charge-offs
Reserves
Net Carrying
Amount
2
C & I
$239.4
$84.9
$65.5
53.6%
Construction
178.2
130.2
34.4
46.6%
CRE
205.4
16.1
42.0
73.8%
Total
$623.1
$231.2
$141.9
56.3%
Proactively Managing Asset Quality |
 12
Strong capital position:
–
Total capital, Tier 1 capital and Leverage ratios of the Corporation of 17.8%,
16.5% and 12.6%, respectively.
Focus on execution of our Strategic Plan:
–
Asset Quality
remains our number one focus and our Special Assets team is
making progress. We will continue to closely manage our NPA book;
–
Profitability
$28 million of net income in 2012, first profitable year since
2008. Pre-tax pre-provision income for the year of $179 million up 38%
from 2011;
–
Loan Portfolio
focus on solid relationships with core balances;
–
Core Deposits
continue to grow, up $314 million from 2011, as we cross-sell
with new and enhanced product offering while reducing our reliance on
brokered CDs; and
–
Strengthened Management Team
with key additions.
We are confident that our core franchise is strong and will continue to improve.
Investment Opportunity
Core Franchise is Strong |
 Exhibits
Investor Presentation
Investor Presentation
February 2013
February 2013 |
 14
Stock Profile
Trading Symbol:
•
FBP
Exchange:
•
NYSE
Share Price
(2/19/13):
•
$5.77
Shares Outstanding:
•
206,674,221
Market Capitalization
(2/19/13):
•
$1.2 Billion
1 Yr. Average Daily Volume:
•
346,685
Price
(2/19/13)
to Tangible
Book
(12/31/2012):
•
0. 874x
Beneficial Owner
Amount
Percent of
Class
Entities affiliated with Thomas H. Lee
Partners, L.P.
50,684,485
24.59%
Entities affiliated with Oaktree Capital
Management, L.P.
50,684,485
24.59%
Wellington Management Company, LLP.
20,336,087
9.87%
United States Department of the
Treasury
1
34,227,696
16.50%
5% or more Beneficial Ownership
1 Includes the U.S. Treasury warrant that entitles it to purchase up to 1,285,899 shares of
Common Stock at an exercise price of $3.29 per share, as adjusted as a result of the issuance of shares of
Common Stock in the Corporation’s recently completed $525MMprivate placement of Common
Stock (the “Capital Raise”). The exercise price and the number of shares issuable upon exercise
of the warrant are subject to further adjustments under certain circumstances to prevent
dilution. The warrant has a 10-year term from its issue date and is exercisable in whole or in part at
any time.
|
 Non-performing Assets
1 Collateral pledged with Lehman Brothers Special Financing, Inc.
15
($ in millions)
Dec 2012
Sep 2012
Jun 2012
Mar 2012
Dec 2011
YoY % change
Non-performing loans
Residential mortgage
313.6
$
320.9
$
333.0
$
341.2
$
338.2
$
-7.3%
Commercial mortgage
205.4
231.2
239.9
244.4
240.4
-14.5%
Commercial & Industrial
239.4
230.5
255.3
263.6
270.2
-11.4%
Construction
178.2
189.5
202.1
231.1
250.0
-28.7%
Consumer Loans & Finance Leases
38.9
36.1
35.4
39.1
39.6
-1.8%
Non-performing loans held for sale
2.2
-
-
-
4.8
-52.9%
Total non-performing loans
977.8
1,008.0
1,065.7
1,119.4
1,143.2
-14.5%
REO
185.8
177.0
167.3
135.9
114.3
62.5%
Other repossessed property
10.1
9.8
10.6
12.5
15.4
-34.3%
Other assets
64.5
64.5
64.5
64.5
64.5
0.0%
Total non-performing assets
1,238
$
1,259
$
1,308
$
1,332
$
1,337
$
-7.4%
1 |
  16
Adjusted Pre-tax, Pre-provision Income Reconciliation
($ in thousands)
4Q 2012
3Q 2012
2Q 2012
1Q 2012
4Q 2011
Loss before income taxes
16,028
$
19,834
$
10,901
$
(11,049)
$
(14,600)
$
Add: Provision for loan and lease losses
30,466
28,952
24,884
36,197
41,987
Less: Net (gain) loss on sale and OTTI of investment
securities
69
547
143
1,207
1,014
Add: Unrealized loss (gain) on derivatives instruments
and liabilities measured at fair value
(432)
(170)
(506)
(283)
1,746
Add: Contingency adjustment - tax credits
-
-
-
2,489
-
Add: Loss on early
extinguishment of repurchase agreement
-
-
-
-
-
Add: Equity in losses (earnings)
of unconsolidated entities
8,330
2,199
2,491
6,236
(1,666)
Adjusted Pre-tax, pre-provision income
54,461
$
51,362
$
37,913
$
34,797
$
28,481
$
Quarter Ended |
 1 Includes a
non-cash adjustments of $0.2 MM for the quarter ended June 30, 2011 as an acceleration of the Series G preferred stock discount accretion pursuant to amendments to the exchange agreement with the
U.S. Treasury, the sole holder of the Series G Preferred Stock
2 Excess of carrying amount of the Series G Preferred Stock exchanged over the fair value of
new common shares issued in the fourth quarter of 2011 17
Reconciliation of the (Loss) Earnings per Common Share
($ in thousands, except per share information)
4Q 2012
3Q 2012
2Q 2012
1Q 2012
4Q 2011
Net income (loss)
14,535
$
19,073
$
9,356
$
(13,182)
$
(14,842)
$
Cumulative convertible preferred stock dividend (Series G)
-
-
-
-
(997)
Preferred
stock
discount
accretion
(Series
G)
1
-
-
-
-
(145)
Favorable impact from issuing common stock in exchange for
Series
G
preferred
stock,
net
of
issuance
costs
2
-
-
-
-
277,995
Net
(loss)
income
attributable
to
common
stockholders
14,535
$
19,073
$
9,356
$
(13,182)
$
262,011
$
Convertible preferred stock dividends and accretion
-
-
-
1,142
Net
(loss)
income
attributable
to
common
stockholders
14,535
$
19,073
$
9,356
$
(13,182)
$
263,153
$
Average common shares outstanding
205,416
205,415
205,415
205,217
192,546
Average potential common shares
804
508
537
-
2,195
Average common shares outstanding -
assuming dilution
206,220
205,923
205,952
205,217
194,741
Basic (loss) earnings per common share
0.07
$
0.09
$
0.05
$
(0.06)
$
1.36
$
Diluted (loss) earnings per common share
0.07
$
0.09
$
0.05
$
(0.06)
$
1.35
$
-
basic
-
diluted |