Attached files
| file | filename |
|---|---|
| 8-K - FORM 8-K - Vantage Drilling CO | d490899d8k.htm |
 Vantage Drilling Company
J.P. Morgan Global High Yield & Leveraged Finance
Conference
Miami, Florida
February 25, 2013
Exhibit 99.1 |
 Some of the statements in this presentation constitute forward-looking
statements. Forward-looking statements relate to
expectations,
beliefs,
projections,
future
plans
and
strategies,
anticipated
events
or
trends
and
similar
expressions
concerning matters that are not historical facts. The forward looking
statements contained in this presentation involve risks and uncertainties as
well as statements as to: •
our limited operating history;
•
availability of investment opportunities;
•
general volatility of the market price of our securities;
•
changes in our business strategy;
•
our ability to consummate an appropriate investment opportunity within given time
constraints; •
availability of qualified personnel;
•
changes in our industry, interest rates, the debt securities markets or the
general economy; •
changes in governmental, tax and environmental regulations and similar
matters; •
changes in generally accepted accounting principles by standard-setting
bodies; and •
the degree and nature of our competition.
The forward-looking statements are based on our beliefs, assumptions and
expectations of our future performance, taking into account all information
currently available to us. These beliefs, assumptions and expectations can change as a result
of many possible events or factors, not all of which are known to us or are within
our control. If a change occurs, our business, financial condition,
liquidity and results of operations may vary materially from those expressed in our forward-
looking statements.
Forward-Looking Statements
2 |
 Symbol:
VTG (NYSE AMEX)
Location:
HQ
–
Houston;
Operations
–
Singapore;
Marketing
–
Dubai
Market Cap:
$485 million ($1.62 per share)
Book Value:
$569 million ($1.90 per share)
Enterprise Value:
$2.7 billion
Employees:
> 1,000
Contract Backlog:
$3.1 billion
Owned Fleet:
4 Ultra-Premium Jackups (operating in SE Asia & West Africa)
2 Ultra-Deepwater Drillships (operating offshore India & GOM)
1 Ultra-Deepwater
Drillship
(under
construction
–
Q2
2013
delivery)
1
42%
owned
Ultra-Deepwater
Drillship
(under
construction
–
Q4
2015
delivery)
Managed Fleet:
1 Ultra-Deepwater
Drillship
(under
construction
–
Q2
2013
delivery)
1 Ultra-Premium Jackup (mobilizing)
3 Ultra-Premium Jackups (under construction)
Corporate Overview
3 |
 Recent
Developments 4
Awarded
2-year
contract
in
West
Africa
for
Tungsten
Explorer
commencing
in
the
2
quarter
2014,
plus
four
6-month
options;
approximately $468 million of backlog over the initial 2-year term. We
are in discussion with several oil companies and anticipate booking up to
one additional year of work following shipyard delivery. Acquisition of 42%
of Sigma Drilling Ltd for $31 million; Sigma is a new-created joint venture with Skeie Group and other
investors, formed to construct a BT-UDS dynamical positioned ultra deepwater
drillship at STX Offshore & Shipbuilding with an expected delivery date
of November 2015. We anticipate that we will achieve management fees in excess of $15 million once
the rig commences operations in 2016, in addition to our share of earnings.
Vantage
was
appointed
as
rig
manager
for
4
new
high-specification
jackups.
Vantage
will
oversee
the
final
stages
of
shipyard
construction and commissioning and then mobilize the jackups to Mexico where two
are expected to commence operations in 2013 and two are expected to commence
operations in 2014. Refinanced $1.0 billion of 11.5% senior notes at 7.5%
significantly reducing cash interest costs and rescheduled $1.0 billion of
debt
maturities
from
2015
to
2019.
The
new
Senior
Notes
are
now
trading
above
par
to
yield
approximately
7.0%
Raised $500 million 5-year term loan for remaining shipyard payments,
development costs and mobilization costs for the Tungsten Explorer
(scheduled delivery Q2 2013)
We have substantially added to the contract backlog for our jackups:
Topaz
Driller
awarded
a
1-year
drilling
program
in
Indonesia;
approximately
$57
million
of
backlog.
Emerald
Driller
awarded
a
2-year
contract
at
$156,000
per
day;
approximately
$114
million
of
backlog.
Aquamarine Driller
contract extended for an additional year at $153,400 per day; approximately $56
million of backlog. Sapphire Driller
awarded additional contracts at $165,000 per day net of taxes; approximately $34.5
million of backlog. nd |
 (1)
PVEP Phu Quy Petroleum Operating Co. Ltd. is a joint venture interest between
PetroVietnam Exploration Production Corp. and Total E&P Vietnam. Company
Highlights 5
Premium high-specification drilling units, including four jackup rigs and
three drillships Vantage’s modern rigs are capable of drilling to
deeper depths and possess enhanced operational efficiency and technical
capabilities, resulting in higher utilization, dayrates and margins
Total
costs
of
owned
fleet
of
four
jackups,
the
Platinum
Explorer
drillship
and
the
Titanium
Explorer
of
approximately $2.6 billion (
$3.2 billion upon delivery/completion of Tungsten Explorer)
Premium Fleet
Highly
successful
track
record
of
managing,
constructing,
marketing
and
operating
offshore
drilling
units
Deep
in-house
technical
team
of
engineers
and
construction
personnel
overseeing
complex
construction
projects
All newbuilds delivered on budget and on time
Jackup
fleet
has
experienced
approx.
99%
of
productive
time
for
Vantage’s
first
48
months
in
operation
Proven Operational
Track
Record
Significant long-term cash flow visibility
Contract backlog of approximately $3.1 billion with industry leading E&P
Companies. Work experience includes a strong customer mix including:
Significant
Contract Coverage
with
High Quality
Counterparties
–
Level of efficiency is “best in class”
–
Total, ENI, Petrobras, ONGC, Petronas Cargali, PTT Thailand, Pearl Energy,
Bowleven, Foxtrot International, Phu Quy
(1)
, and Salamander. |
 Successful construction management arrangements for ultra-deepwater
drillships, including completed
Aker
drillships
and
SeaDragon
semisubmersible
projects
and
ongoing
Dalian Developer
project.
Provided Vantage with significant engineering expertise and experience in Korean,
Chinese and Singaporean shipyards.
Management team with extensive experience; average of 29 years in the drilling
industry Includes international and domestic public company experience with
industry-leading peers involving numerous acquisitions and debt and
equity financings. Experienced
operating
and
technical
personnel
with
highest
level
of
expertise.
Construction
Supervision and
Management
Arrangements
Experienced
Management and
Operational Team
Company Highlights (Cont’d)
6 |
 Owned Assets
•
Delivered On-Time, On-
Budget -
December 2008
•
Hired by Financial Institution to
provide shipyard oversight
following bid process
•
Delivery Q2 2013
•
3 newbuild project at DSME
•
Leverages shipyard experience
•
Favorable costs and delivery
schedule
•
Delivery Q2 2013
Tungsten Explorer
Premium Owned Fleet with a Proven Operational
Track Record
7
•
2 Successful newbuild at
DSME
•
Delivery April 2012
•
On Contract by Q4 2012
Construction
Management
Projects
Dalian Developer
Newbuild Ultra-Premium Marine Pacific Class 375 Jackups
Emerald Driller
Sapphire Driller
Aquamarine Driller
Topaz Driller
Platinum Explorer
Ultra-Deepwater 12,000 ft Drillships
•
Delivered On-Time, On-
Budget -
November 2010
•
Delivered On-Time, On-
Budget -
July 2009
•
Delivered On-Time, On-
Budget -
December 2009
•
Delivered On-Time, On-
Budget -
September 2009
Titanium Explorer
Ultra-Deepwater Drillship
Palladium Explorer
•
Newbuild project at STX
Offshore
•
7 generation dual-BOP,
dual-derrick
•
Delivery Q4 2015
Mexican Operator
4 Ultra-Premium Jackups
•
Hired by newly formed
drilling company to
manage fleet
nd
rd
th |
 Business Strategy
8
Capitalize on Customer
Demand for High-
Specification Units
•
Customer demand for new high-specification units supported by:
–
Need for rigs well-suited for drilling through deep and complex formations and
drilling horizontally –
Enhanced efficiency providing faster drilling and moving times
–
Improved safety features and lower downtime for maintenance
Focus on Long-term
Contracts
•
Long-term
drillship
contracts
for
Platinum
Explorer
(5
years),
Titanium
Explorer
(8
years)
and
Tungsten
Explorer
(2 years)
•
Jackups operating on contracts with multi-year term
•
Agreed multi-year extension for Emerald Driller
•
$3.1 billion in contract backlog mitigates cyclical oil and gas industry
risk Expand Key Industry
Relationships
•
Focused on expanding relationships with national oil companies, major oil
companies, large independents and super-regionals (generally longer
contract duration) •
Strong
existing
relationships
have
contributed
to
large
existing
backlog
and
repeat
business
with
customers
Pursue Expansion
Opportunities
•
•
Growth through acquisitions of assets and other offshore drilling companies
•
Both deepwater and jackups attractive; however current conditions favor
ultra-deepwater Organic growth through attractive shipyard orders, joint ventures and asset
management agreements.
|
 Vantage Offices
Owned Rigs
Managed Rigs
Titanium Explorer
Contract: Petrobras
U.S. GOM
Contract: ONGC
Platinum Explorer
India
Houston
Singapore
Dubai
Contract: PTT
Emerald Driller
Thailand
Aquamarine Driller
Contract: Petronas
Carigaili
Malaysia
Topaz Driller
Contract: Total
Indonesia
Country of Operation
Sapphire Driller
Contract: Foxtrot
Ivory Coast
Worldwide Operations
9
Primus
Mobilizing
Mexico
3 Jackups
Under Construction
Singapore
1 Drillship
Under Construction
Korea
Tungsten Explorer
Contract: TBA
West Africa |
 Strong Customer Relationships
10
Key Customers |
 •
Faster drilling times
•
Faster moving times
•
Increased volumes of consumable liquids and
drilling fluids
•
Reduced boat runs and non-productive time
•
Improved pipe handling and offline capability
•
Fast preloading time for all tanks
•
75’
x 30’
cantilever reach substantially greater
than the industry average
•
Pipe decks allow increased storage capacity
•
Premium drilling package:
•
3 x 2200HP mud pumps
•
Integrated diverter system
•
18-¾’’
BOP system and 4 rams
•
High-capacity, high efficiency –
5 x CAT 3516 B
Diesel engines
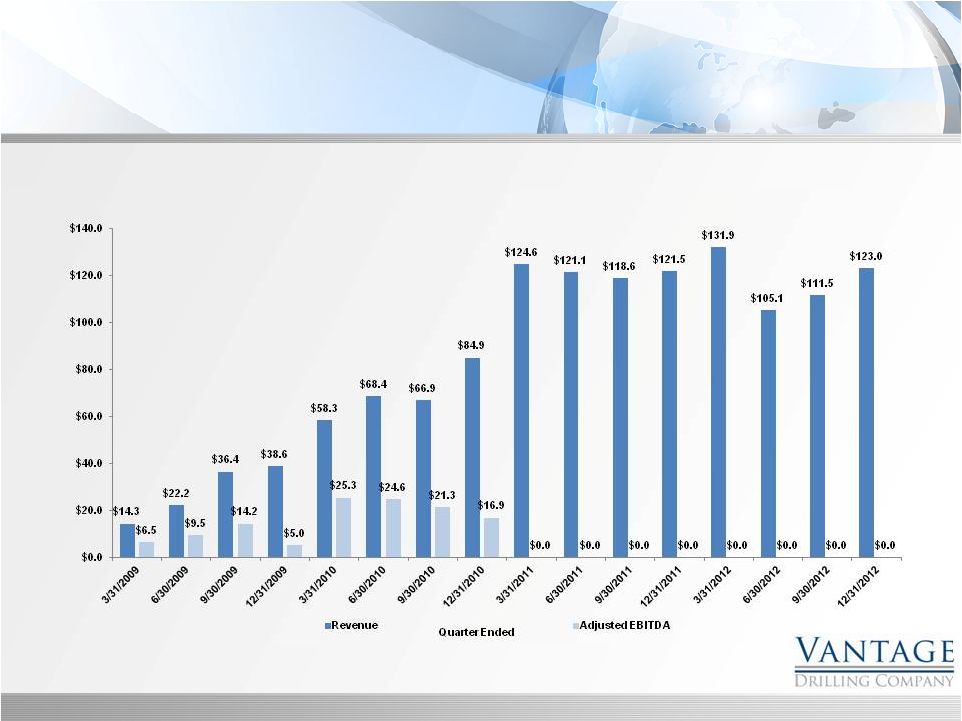
Quarterly Financial Performance
Ultra-Premium Jackup Fleet
11
World class assets achieving world class performance
Fleet productive time approximately 99% since inception
Emerald Driller
Sapphire Driller
Aquamarine Driller
Topaz Driller
Increased Operational Efficiency and Improved
Technical Capability: |
 (1)
Average
drilling
revenue
per
day
is
based
on
the
total
estimated
revenue
divided
by
the
minimum
number
of
days
committed
in
a
contract.
Unless
otherwise
noted,
the
total
revenue
includes
any
mobilization and demobilization fees and other contractual revenues associated with
the drilling services. (2)
The drilling revenue per day includes the achievement of the 12.5% bonus
opportunity, but excludes mobilization revenues and revenue escalations included in the contract.
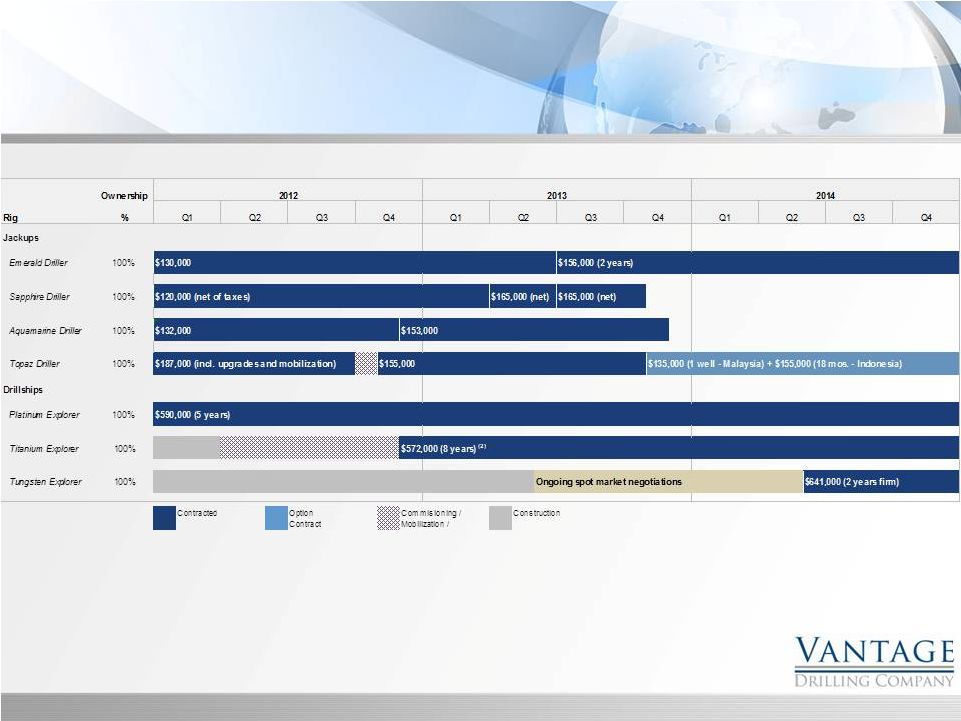
Fleet Status –
Average Drilling Revenue/Day
(1)
12 |
 Ultra-Deepwater Rig Supply is Increasing Significantly
Deepwater Exploration is a Young, Rapidly Growing Market
Demand is Likely to Exceed Rig Supply Despite Newbuilds
Source: ODS-Petrodata, DnB NOR
Global Deepwater Market
13 |
  Market
Overview - Global Oil Production vs. E&P
Spending
Source: EIA & Barclays Research
1997 -2012
2009-2012
CAGR Spending
9.9%
14.3%
CAGR Production
1.2%
1.8%
14 |
  Balance Sheet
($Millions)
Financial Overview
15
December 31,
December 31,
December 31,
December 31,
2009
2010
2011
2012
Cash and cash equivalents
16.0
$
120.4
$
110.0
$
502.7
$
Restricted cash
28.9
29.0
7.0
3.5
Trade receivables
17.5
50.2
100.9
119.5
Inventory
10.8
19.8
24.4
37.9
Prepaid expenses and other current assets
8.0
11.5
16.9
25.2
81.2
230.9
259.3
688.8
Property and equipment, net
888.2
1,718.1
1,805.1
2,717.5
Investment in joint venture
120.3
-
-
31.3
Other assets
29.4
54.2
58.2
92.5
1,119.2
$
2,003.2
$
2,122.5
$
3,530.2
$
Accounts payable and accrued liabilities
30.2
$
107.5
$
148.1
$
174.4
$
Short-term debt
17.8
8.6
-
-
Current maturities of
long-term debt 16.0
-
-
31.3
64.0
116.1
148.1
205.6
Long–term debt
378.1
1,103.5
1,246.4
2,710.6
Other long term liabilities
-
13.5
29.8
45.5
Shareholders' Equity
Paid-in capital
714.7
854.8
860.8
878.1
Retained Earnings
(37.1)
(84.7)
(162.6)
(310.0)
Accumulated other comprehensive loss
(0.5)
-
-
-
Total shareholders’
equity 677.1
770.2
698.2
568.5
1,119.2
$
2,003.2
$
2,122.5
$
3,530.2
$
Outstanding shares
187.3
289.7
291.2
299.6
Book value per share
3.62
$
2.66
$
2.40
$
1.90
$
|
 •
Contract for the Tungsten Explorer
for “gap”
period
•
Refinance $1 billion debt
•
Improving dayrate contract fixtures on jackups
•
Maintain high productive time on Platinum Explorer
Key Drivers Near Term
16 |
 Historical Financial Information
($ Millions)
Financial Overview
17 |
 Reconciliation of Net Income (Loss) to Adjusted EBITDA
($Millions)
Appendix
18
3/31/2009
6/30/2009
9/30/2009
12/31/2009
3/31/2010
6/30/2010
9/30/2010
12/31/2010
Net income (loss)
2.4
$
4.0
$
6.8
$
(4.3)
$
6.0
$
(7.0)
$
(33.6)
$
(13.0)
$
Interest expense, net
0.7
1.3
1.9
4.2
8.0
13.3
13.9
14.1
Income tax provision (benefit)
0.6
0.9
1.1
(0.6)
2.3
8.4
2.8
5.5
Depreciation
1.7
2.1
3.2
4.3
7.5
8.4
8.8
8.7
Loss on debt extinguishment
-
-
-
-
-
-
24.0
-
Loss on acquisition of subsidiary
-
-
-
-
-
-
3.8
-
EBITDA
5.4
$
8.3
$
13.0
$
3.6
$
23.8
$
23.1
$
19.7
$
15.3
$
Share-based compensation expense
1.1
1.2
1.2
1.4
1.5
1.5
1.6
1.5
Adjusted EBITDA
6.5
$
9.5
$
14.2
$
5.0
$
25.3
$
24.6
$
21.3
$
16.9
$
3/31/2011
6/30/2011
9/30/2011
12/31/2011
3/31/2012
6/30/2012
9/30/2012
12/31/2012
Net income (loss)
(18.7)
$
(40.1)
$
(11.9)
$
(9.3)
$
(1.2)
$
(10.0)
$
(0.5)
$
(133.6)
$
Interest expense, net
41.4
39.2
37.0
37.2
36.8
36.2
31.6
44.4
Income tax provision (benefit)
2.9
7.8
2.0
(1.3)
5.8
6.1
2.7
4.3
Depreciation
16.1
16.0
16.0
16.4
16.6
16.4
16.6
19.2
Loss on debt extinguishment
-
25.2
-
-
-
-
2.5
122.1
Loss on acquisition of subsidiary
-
-
-
-
-
-
-
-
EBITDA
41.8
$
48.1
$
43.1
$
43.0
$
58.0
$
48.7
$
52.9
$
56.4
$
Share-based compensation expense
0.9
1.5
1.6
1.9
2.3
2.2
1.4
1.3
Adjusted EBITDA
42.7
$
49.6
$
44.7
$
44.9
$
60.3
$
50.9
$
54.3
$
57.7
$
Fiscal Quarter Ended,
Fiscal Quarter Ended, |
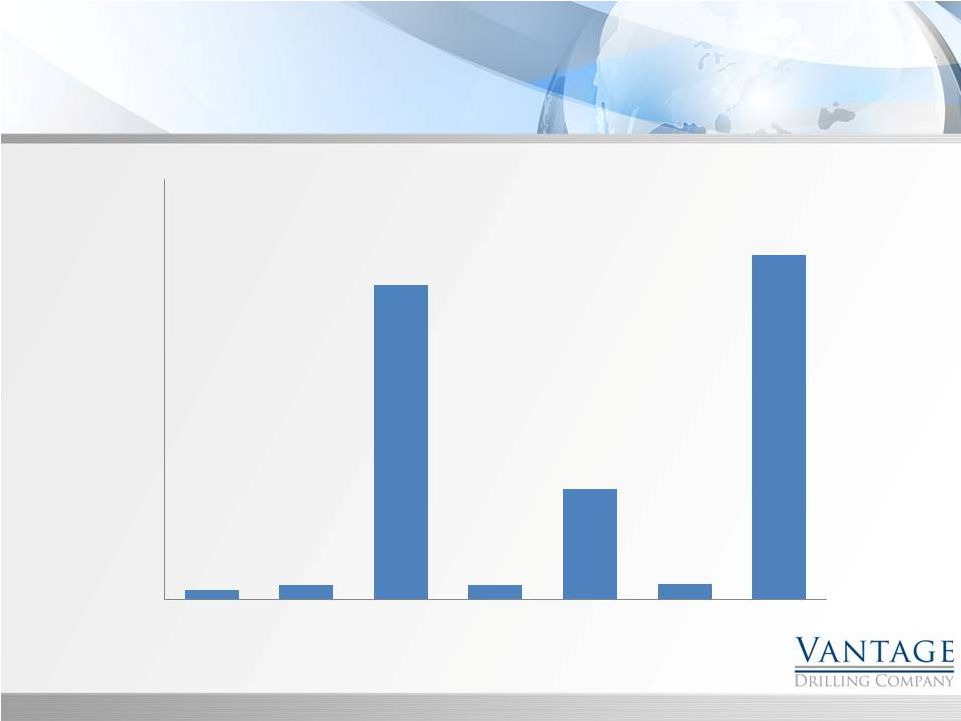 Debt
Maturities 19
$ millions
31.3
50.0
1,050.0
50.0
369.0
53.5
1,150.0
-
200.0
400.0
600.0
800.0
1,000.0
1,200.0
1,400.0
2013
2014
2015
2016
2017
2018
2019 |