Attached files
| file | filename |
|---|---|
| EX-99.1 - EXHIBIT 2012 Q4 EARNINGS RELEASE - HARLAND CLARKE HOLDINGS CORP | exhibit991.htm |
| 8-K - 8-K - HARLAND CLARKE HOLDINGS CORP | hchc-201212318k.htm |
Harland Clarke Holdings Corp. Q4 2012 Supplemental Financial Information February 25, 2013
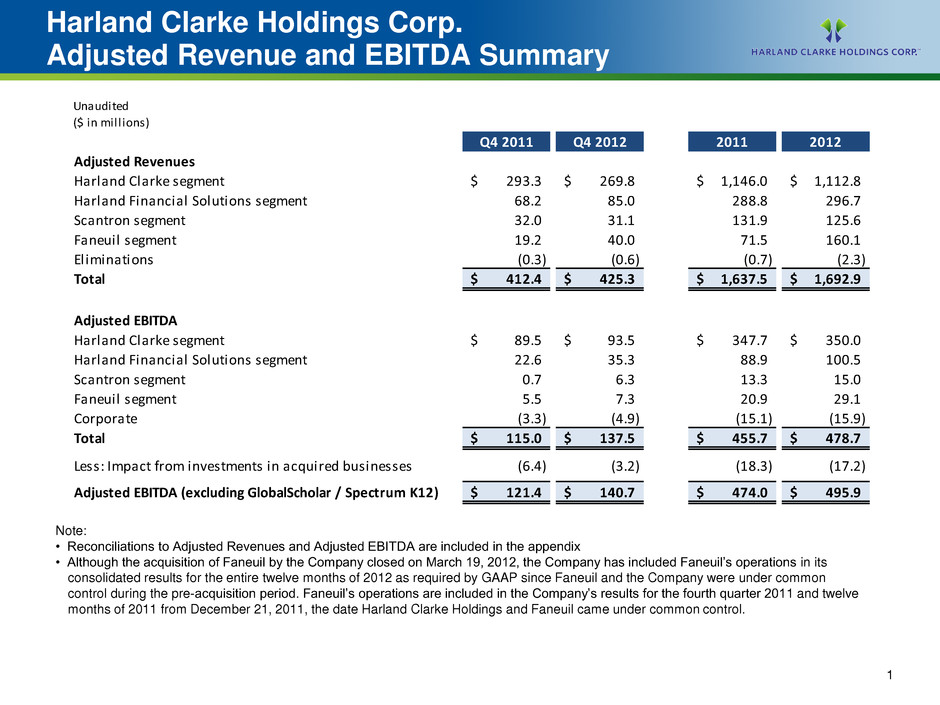
Harland Clarke Holdings Corp. Adjusted Revenue and EBITDA Summary 1 Unaudited ($ in millions) Note: • Reconciliations to Adjusted Revenues and Adjusted EBITDA are included in the appendix • Although the acquisition of Faneuil by the Company closed on March 19, 2012, the Company has included Faneuil’s operations in its consolidated results for the entire twelve months of 2012 as required by GAAP since Faneuil and the Company were under common control during the pre-acquisition period. Faneuil’s operations are included in the Company’s results for the fourth quarter 2011 and twelve months of 2011 from December 21, 2011, the date Harland Clarke Holdings and Faneuil came under common control. Q4 2011 Q4 2012 2011 2012 Adjusted Revenues Harland Clarke segment 293.3$ 269.8$ 1,146.0$ 1,112.8$ Harland Financial Solutions segment 68.2 85.0 288.8 296.7 Scantron segment 32.0 31.1 131.9 125.6 Faneuil segment 19.2 40.0 71.5 160.1 Eliminations (0.3) (0.6) (0.7) (2.3) Total 412.4$ 425.3$ 1,637.5$ 1,692.9$ Adjusted EBITDA Harland Clarke segment 89.5$ 93.5$ 347.7$ 350.0$ Harland Financial Solutions segment 22.6 35.3 88.9 100.5 Scantron segment 0.7 6.3 13.3 15.0 Faneuil segment 5.5 7.3 20.9 29.1 Corporate (3.3) (4.9) (15.1) (15.9) Total 115.0$ 137.5$ 455.7$ 478.7$ Less: Impact from investments in acquired businesses (6.4) (3.2) (18.3) (17.2) Adjusted EBITDA (excluding GlobalScholar / Spectrum K12) 121.4$ 140.7$ 474.0$ 495.9$

2 Appendix

Harland Clarke Holdings Corp. Adjusted Revenue and EBITDA Reconciliations 3 Unaudited ($ in millions) Q4 2011 Q4 2012 2011 2012 Net (loss) income (79.8) 14.6 23.3 (35.0) Interest expense, net 29.3 55.4 111.0 220.7 (Benefit) provision for income taxes (5.4) 11.6 37.4 (19.4) Depreciation and amortization 42.4 53.4 164.4 213.6 EBITDA (13.5) 135.0 336.1 379.9 Adjustments: Restructuring costs 4.3 2.3 12.6 18.9 Revaluation of contingent consideration 0.3 - (24.3) (0.6) Asset impairment charges 109.2 1.0 111.6 1.7 Loss on early extinguishment of debt 0.1 - 0.1 34.2 Gain on sale of marketable securities - - (13.2) - One-time, non-cash charge; change in revenue recognition 1.6 - 1.6 1.2 Impact of acquisition accounting adjustments 9.9 (4.3) 17.6 23.2 Transaction related expenses - 0.7 - 3.5 Customer bill ings in excess of recognized revenues 3.1 2.6 13.6 16.0 Unusual legal expenses - 0.1 - 0.6 Loss from equity method investment - 0.1 - 0.1 Adjusted EBITDA 115.0$ 137.5$ 455.7$ 478.7$ Less: Impact from investments in acquired businesses (6.4)$ (3.2)$ (18.3)$ (17.2)$ Adjusted EBITDA (excl. GlobalScholar / Spectrum K12) 121.4$ 140.7$ 474.0$ 495.9$ Q4 2011 Q4 2012 2011 2012 Revenues 406.4$ 426.6$ 1,623.7$ 1,668.9$ Impact of acquisition accounting adjustments .0 (1 3) 1 .8 24 0 Adjusted Revenues 412.4$ 425.$ 1,637.5$ 1,692.9$
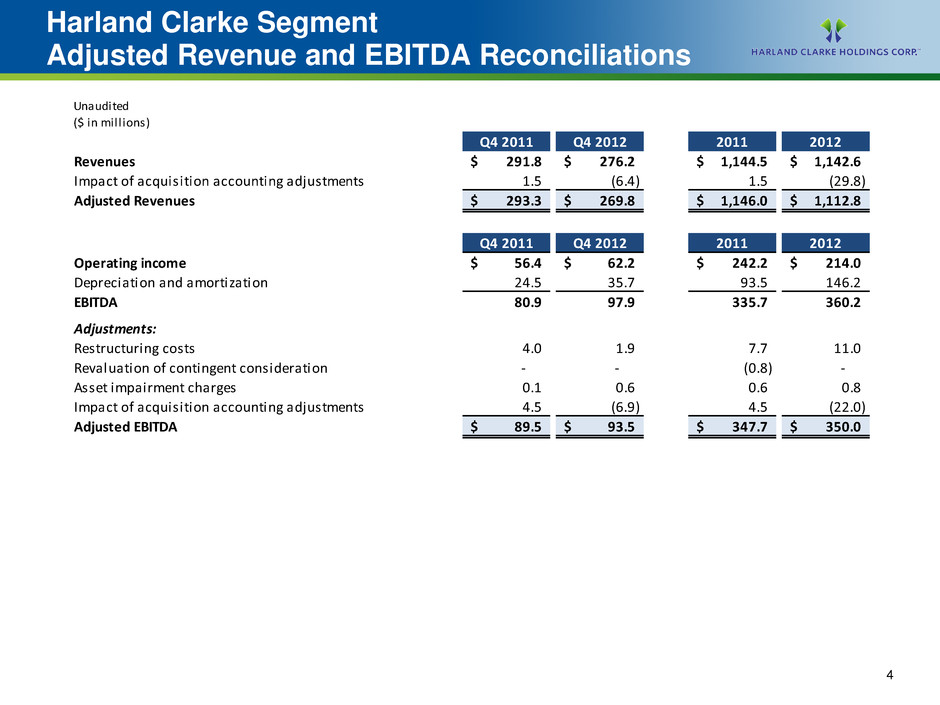
Harland Clarke Segment Adjusted Revenue and EBITDA Reconciliations 4 Q4 2011 Q4 2012 2011 2012 Revenues 291.8$ 276.2$ 1, 44.5$ 1, 42.6$ Impact of acquisition accounting adjustments .5 ( .4) 1. (29.8) Adjusted Revenues 293.3$ 269.8$ 1,146.0$ 1,112.$ Unaudited ($ in millions) Q4 2011 Q4 2012 2011 2012 Op rating ncome 56.4$ 62.2$ 242.2$ 214.0$ D preciation and amortization 24.5 35.7 93.5 146.2 EBITDA 80.9 97.9 335.7 360.2 ments: Restructuring costs 4.0 1.9 7.7 11.0 Revaluation of contingent consideration - - (0.8) - Asset impairment charges 0.1 0.6 0.6 0.8 Impact of acquisition accounting adjustments 4.5 (6.9) 4.5 (22.0) Adjusted EBITDA 89.5$ 93.5$ 347.7$ 350.0$

Harland Financial Solutions Segment Adjusted Revenue and EBITDA Reconciliations 5 Q4 2011 Q4 2012 2011 2012 Revenues 66.1$ 80.5$ 285.8$ 253.7$ Impact of acquisition accounting adjustments 2. 4. 3.0 4 .0 Adjusted Revenues 68.2$ 85.0$ 288.8$ 296.7$ Unaudited ($ in millions) Q4 2011 Q4 2012 2011 2012 Operating income 8.5$ 22.2$ 53.9$ 23.3$ Depreciation and amortization 7.2 9.8 27.1 38.4 EBITDA 15.7 32.0 81.0 61.7 Adjustments: Restructuring costs 0.1 - 0.4 0.4 Rev luation of conti gent consideration 0 3 - (0 7) (0 6) Asset impairment charges - 0.1 - 0.1 One-time, non-cash charge; change in revenue recognition 1.6 - 1.6 1.2 Impact of acquisition accounting adjustments 2.7 2.4 3.6 33.8 Customer bill ings in excess of recognized revenues 2.2 0.8 3.0 3.9 Adjusted EBITDA 22.6$ 35.3$ 88.9$ 100.5$

Scantron Segment Adjusted Revenue and EBITDA Reconciliations 6 Unaudited ($ in millions) Q4 2011 Q4 2012 2011 2012 Operating loss (118.0)$ (0.6)$ (132.0)$ (26.6)$ Depreciation and amortization 8.5 4.8 35.2 17.9 EBITDA (109.5) 4.2 (96.8) (8.7) Adjustments: Restructuring costs 0.2 0.5 4.5 5.8 Revaluation of contingent consideration - - (22.8) - Asset impairment charges 106.4 - 108.3 - Transaction related expenses - - - 0.2 Impact of acquisition accounting adjustments 2.7 (0.2) 9.5 5.6 Customer bill ings in excess of recognized revenues 0.9 1.8 10.6 12.1 Adjusted EBITDA 0.7$ 6.3$ 13.3$ 15.0$ Less: Impact from investments in acquired businesses (6.4) (3.2) (18.3) (17.2) Adjusted EBITDA (excl. GlobalScholar / Spectrum K12) 7.1$ 9.5$ 31.6$ 32.2$ Q4 2011 Q4 2012 2011 2012 Revenues 29.6$ 30.9$ 22.6$ 19.9$ I t f i iti ti j t t .4 . .3 .7 Adjusted Revenues 3 0$ 31 1$ 131 9$ 12$
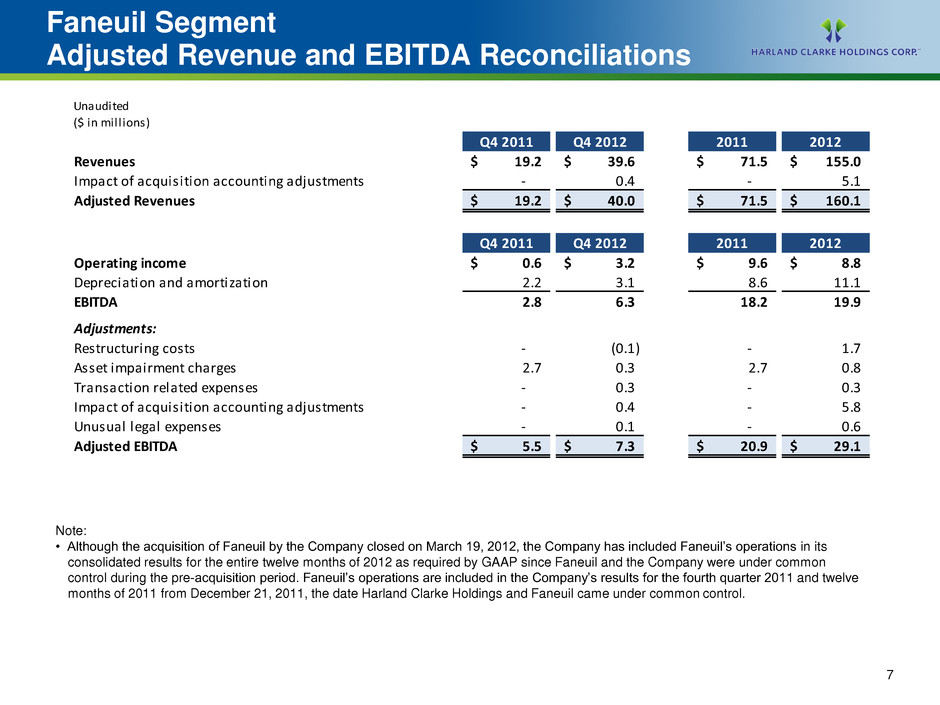
Faneuil Segment Adjusted Revenue and EBITDA Reconciliations 7 Note: • Although the acquisition of Faneuil by the Company closed on March 19, 2012, the Company has included Faneuil’s operations in its consolidated results for the entire twelve months of 2012 as required by GAAP since Faneuil and the Company were under common control during the pre-acquisition period. Faneuil’s operations are included in the Company’s results for the fourth quarter 2011 and twelve months of 2011 from December 21, 2011, the date Harland Clarke Holdings and Faneuil came under common control. Q4 2011 Q4 2012 2011 2012 Revenues 19.2$ 39.6$ 71.5$ 55.0$ Impact of acquisition accounting adjustments - 0.4 - .1 Adjusted Revenues 19.2$ 4 .0$ 71.5$ 160.$ Unaudited ($ in millions) Q4 2011 Q4 2012 2011 2012 Operating income 0.6$ 3.2$ 9.6$ 8.8$ Depreciation and amortization 2.2 3.1 8.6 11.1 EBITDA 2.8 6.3 18.2 19.9 Adjustments: Restructuring cos ( 1) 1 7 Asset impairment charges 2.7 0.3 2.7 0.8 Transaction related expenses - 0.3 - 0.3 Impact of acquisition accounting adjustments - 0.4 - 5.8 Unusual legal expenses - 0.1 - 0.6 Adjusted EBITDA 5.5$ 7.3$ 20.9$ 29.1$
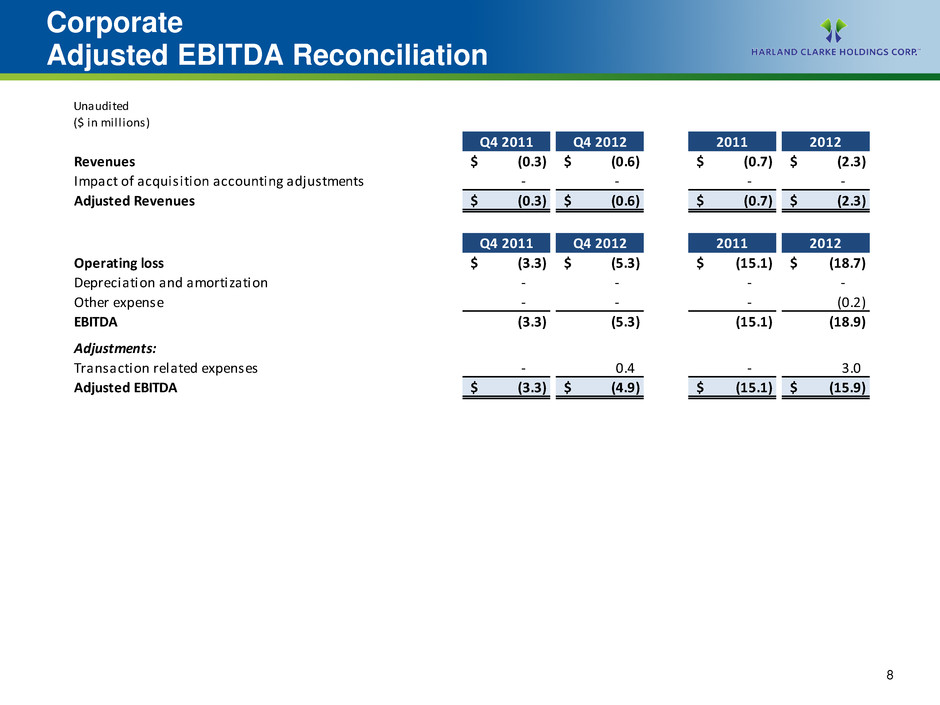
Corporate Adjusted EBITDA Reconciliation 8 Q4 2011 Q4 2012 2011 2012 Revenues (0.3)$ (0.6)$ (0.7)$ (2.3)$ Impact of acquisition accounting adjustments - - - - Adjusted Revenues (0.3)$ (0.6)$ (0.7)$ (2.3)$ 4 2011 4 2012 2011 2012 Operating loss 3 5 3 ( 5 1 (18 7 De reciation a d amortization Other expense - - - (0.2) EBITDA (3.3) (5.3) (15.1) (18.9) Adjustments: Transaction related expenses - 0.4 - 3.0 Adjusted EBITDA (3.3)$ (4.9)$ (15.1)$ (15.9)$ Unaudited ($ in millions)

9
