Attached files
| file | filename |
|---|---|
| EX-99.1 - EXHIBIT 99.1 - ZALE CORP | a50571422_ex991.htm |
| 8-K - ZALE CORPORATION 8-K - ZALE CORP | a50571422.htm |
Exhibit 99.2

Second Quarter Fiscal 2013 Earnings Call February 21, 2013 1
Forward‐Looking Statements and Use of Non‐GAAP Financial Measures • This presentation contains forward‐looking statements, including statements regarding future sales, expected operating performance, expenses, margins, profitability, earnings, interest expense, effective tax rate, merchandising and marketing initiatives and industry growth forecasts. Forward‐looking statements are not guarantees of future performance and a variety of factors could cause the Company's actual results to differ materially from the results expressed in the forwardlooking statements. These factors include, but are not limited to: if the general economy continues to perform poorly, discretionary spending on goods that are, or are perceived to be, “luxuries” may decrease; the concentration of a substantial portion of the Company’s sales in three, relatively brief selling seasons means that the Company’s performance is more susceptible to disruptions; if the Company does not achieve targeted sales growth its operating results and earnings will be adversely impacted; most of the Company’s sales are of products that include diamonds, precious metals and other commodities, and fluctuations in the availability and pricing of commodities could impact the Company’s ability to obtain and produce products at favorable prices; the Company’s sales are dependent upon mall traffic; the Company operates in a highly competitive industry; the financing market remains difficult, and if we are unable to meet the financial commitments in our current financing arrangements it will be difficult to replace or restructure these arrangements; and changes in regulatory requirements may increase the cost or adversely affect the Company’s operations and its ability to provide consumer credit and write credit insurance. For other factors, see the Company's filings with the Securities and Exchange Commission, including its Annual Report on Form 10K for the fiscal year ended July 31, 2012, and subsequent reports on Forms 10‐Q and 8‐K. The Company disclaims any obligation to update or revise publicly or otherwise any forward‐looking statements to reflect subsequent events, new information or future circumstances, except as required by law. • This presentation contains certain non‐GAAP measures as defined by SEC rules. One of these non‐GAAP measures is EBITDA, which is defined as earnings before interest, taxes, depreciation and amortization. A second non‐GAAP measure is adjusted EBITDA, which is further adjusted to exclude charges related to store closures. We use these measurements as part of our evaluation of the performance of the Company. In addition, we believe these measures provide useful information to investors. Please refer to the appendix at the back of this presentation for a reconciliation of these non‐GAAP measures to the most comparable GAAP financial measures. 2
Q2 Fiscal Year 2013…Continued Progress • Q2 financial performance – Comparable store sales up 2.8%...follows a 5.8% rise in Q2 FY12 (1) – Nine consecutive quarters of positive comps – Achieved operating margin of 7.6 percent, up 110 basis points – Net earnings of $1.02 per diluted share, up $0.25, or 32 percent • Solid performance driven by: – Exclusive, branded collections – Diverse marketing campaign across multiple channels – Improved store productivity • Extensive product, technical and sales training 3 (1) Comparable Store Sales exclude revenue recognized from warranties. The sales results of new stores are included beginning with the thirteenth full month of operations, and the sales results of closed stores are excluded from the calculation.
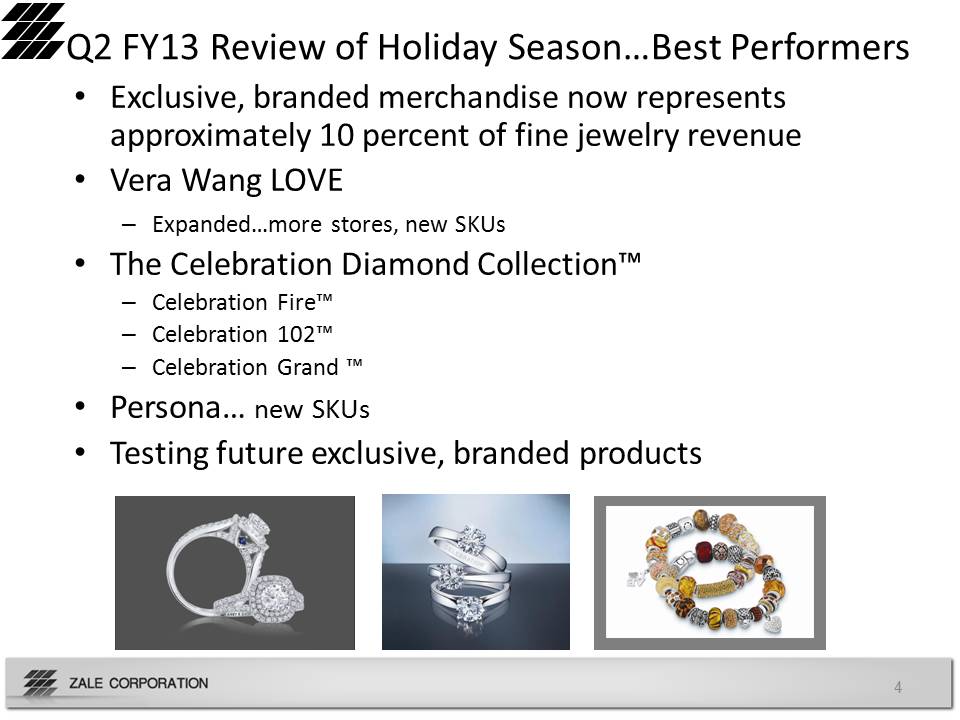
Q2 FY13 Review of Holiday Season…Best Performers • Exclusive, branded merchandise now represents approximately 10 percent of fine jewelry revenue • Vera Wang LOVE – Expanded…more stores, new SKUs • The Celebration Diamond Collection™ – Celebration Fire™ – Celebration 102™ – Celebration Grand ™ • Persona… new SKUs • Testing future exclusive, branded products 4
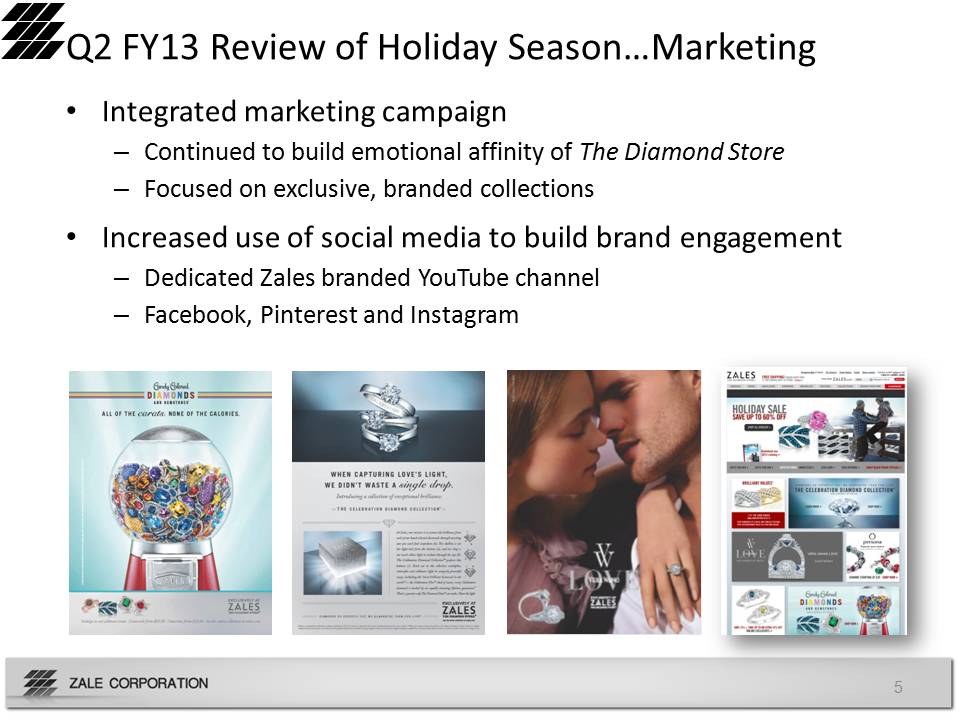
Q2 FY13 Review of Holiday Season…Marketing 5 • Integrated marketing campaign – Continued to build emotional affinity of The Diamond Store – Focused on exclusive, branded collections • Increased use of social media to build brand engagement – Dedicated Zales branded YouTube channel – Facebook, Pinterest and Instagram
Q2 Fiscal Year 2013 Financial Highlights • Revenues increased $7 million, or 1.1%, to $671 million – Comparable store sales up 2.8% – Partially offset by 64 net store closures as compared to prior year Period • Gross margin at $340 million, or 50.6%, compared to $336 million, or 50.5%, in Q2 FY12 • SG&A expense of $279 million, or 41.6% of revenues, compared to $282 million, or 42.5% of revenues, in Q2 FY12 • Operating earnings of $51 million, or 7.6% of revenues, compared to operating earnings of $43 million, or 6.5% of revenues, in Q2 FY12 • Interest expense of $6 million compared to $10 million in Q2 FY12 • Net earnings of $41 million, or $1.02 per diluted share, an increase of $0.25, or 32 percent 6
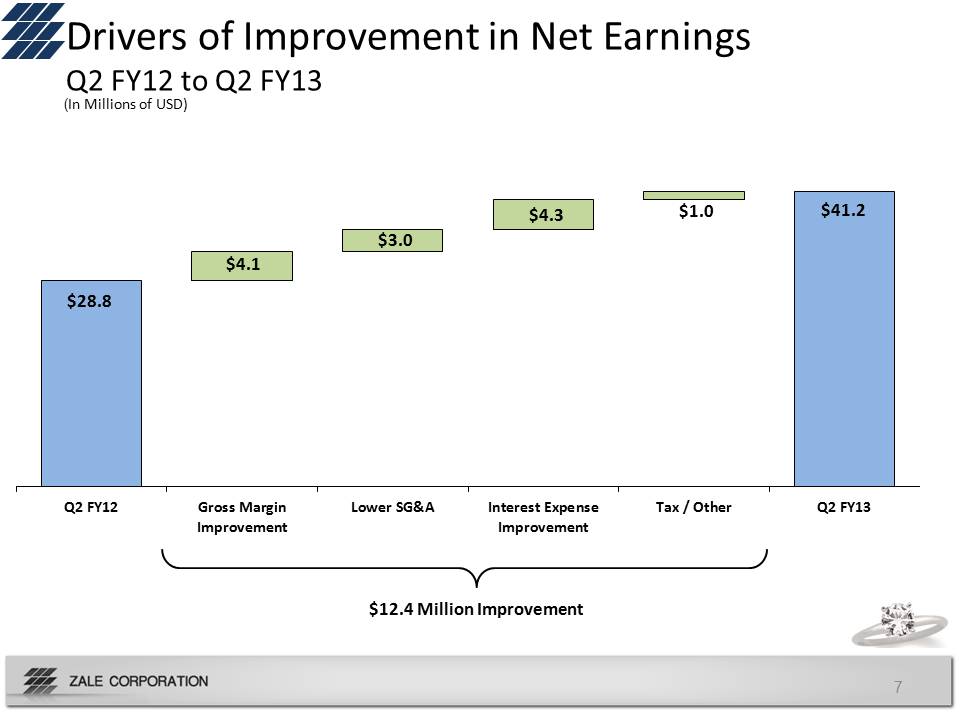
7 Drivers of Improvement in Net Earnings Q2 FY12 to Q2 FY13 $12.4 Million Improvement (In Millions of USD) Q2 FY12 Gross Margin Improvement Lower SG&A Interest Expense Improvement Tax / Other Q2 FY13 $28.8 $41.2 $3.0 $4.1 $1.0 $4.3
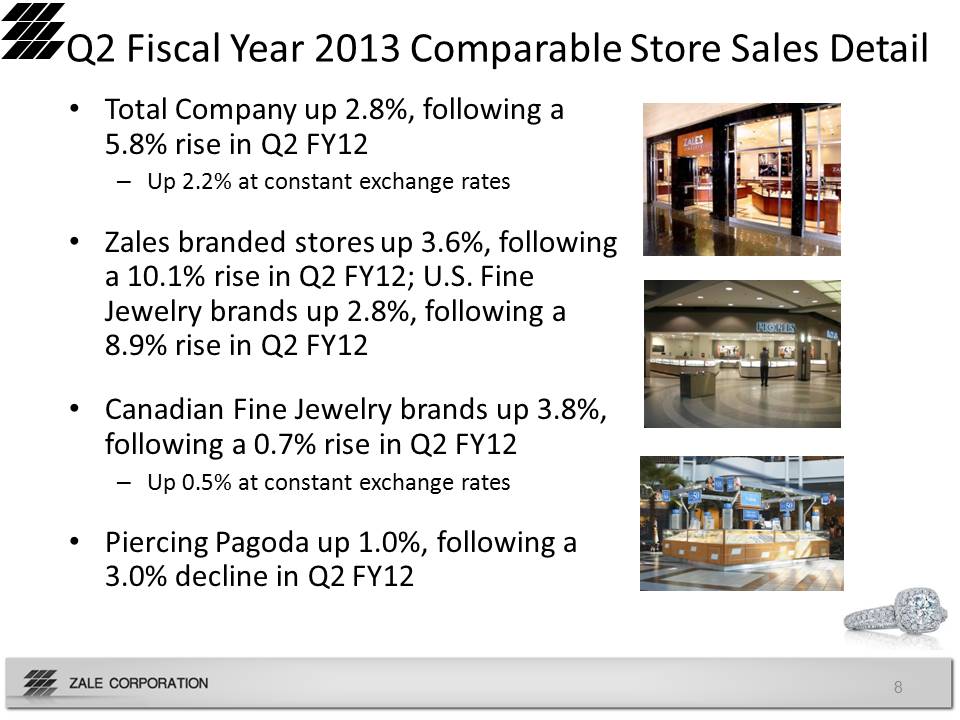
Q2 Fiscal Year 2013 Comparable Store Sales Detail • Total Company up 2.8%, following a 5.8% rise in Q2 FY12 – Up 2.2% at constant exchange rates • Zales branded stores up 3.6%, following a 10.1% rise in Q2 FY12; U.S. Fine Jewelry brands up 2.8%, following a 8.9% rise in Q2 FY12 • Canadian Fine Jewelry brands up 3.8%, following a 0.7% rise in Q2 FY12 – Up 0.5% at constant exchange rates • Piercing Pagoda up 1.0%, following a 3.0% decline in Q2 FY12 8
Q2 Fiscal Year 2013 Balance Sheet and Liquidity • Cash and cash equivalents of $18.5 million compared to $27.1 million at January 31, 2012 • Inventory stood at $837 million compared to $815 million at January 31, 2012 • Current net revolver availability at $207 million • Fixed charge coverage ratio at 2.0, above key threshold of 1.0 9
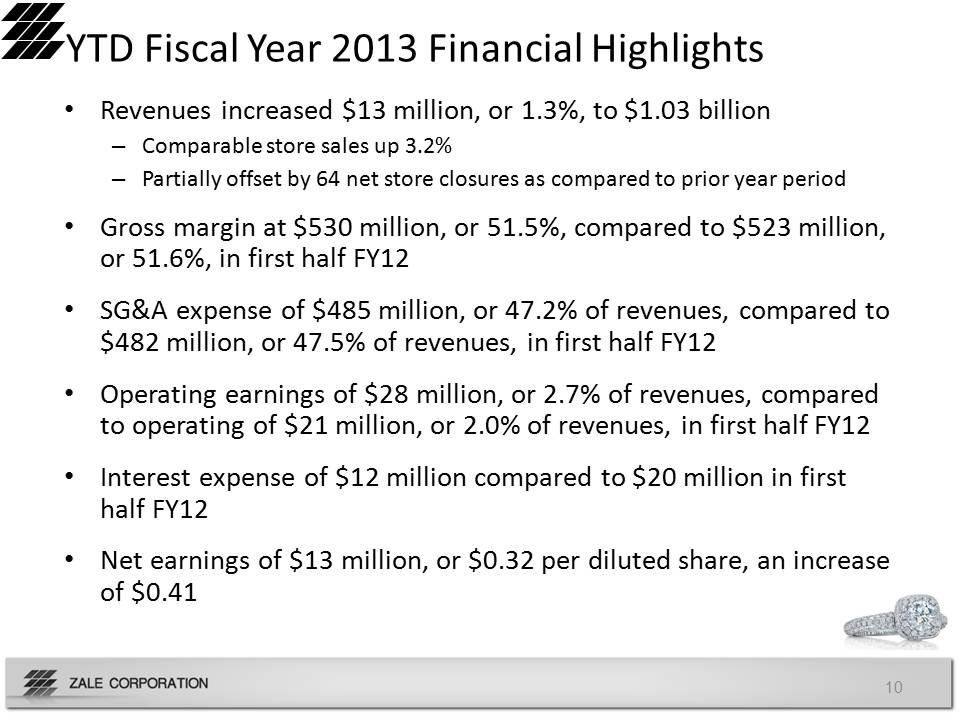
YTD Fiscal Year 2013 Financial Highlights • Revenues increased $13 million, or 1.3%, to $1.03 billion – Comparable store sales up 3.2% – Partially offset by 64 net store closures as compared to prior year period • Gross margin at $530 million, or 51.5%, compared to $523 million, or 51.6%, in first half FY12 • SG&A expense of $485 million, or 47.2% of revenues, compared to $482 million, or 47.5% of revenues, in first half FY12 • Operating earnings of $28 million, or 2.7% of revenues, compared to operating of $21 million, or 2.0% of revenues, in first half FY12 • Interest expense of $12 million compared to $20 million in first half FY12 • Net earnings of $13 million, or $0.32 per diluted share, an increase of $0.41 10
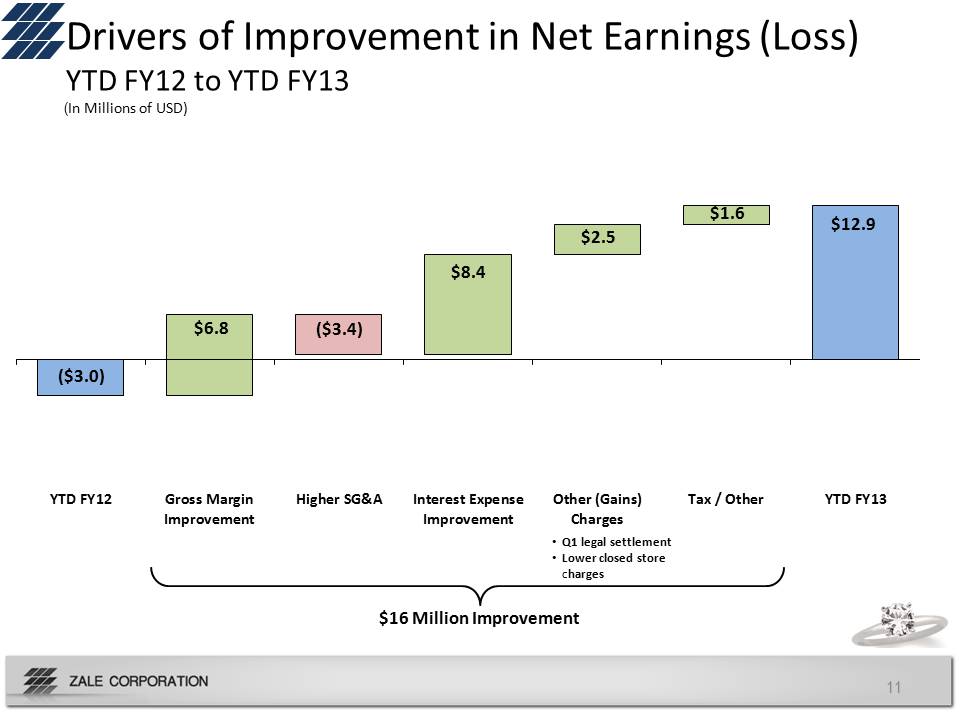
11 Drivers of Improvement in Net Earnings (Loss) YTD FY12 to YTD FY13 $16 Million Improvement (In Millions of USD) YTD FY12 Gross Margin Improvement Higher SG&A Interest Expense Improvement Other (Gains) Charges Tax / Other YTD FY13 ($3.0) $12.9 ($3.4) $6.8 $2.5 $8.4 $1.6 • Q1 legal settlement • Lower closed store charges
Appendix 12
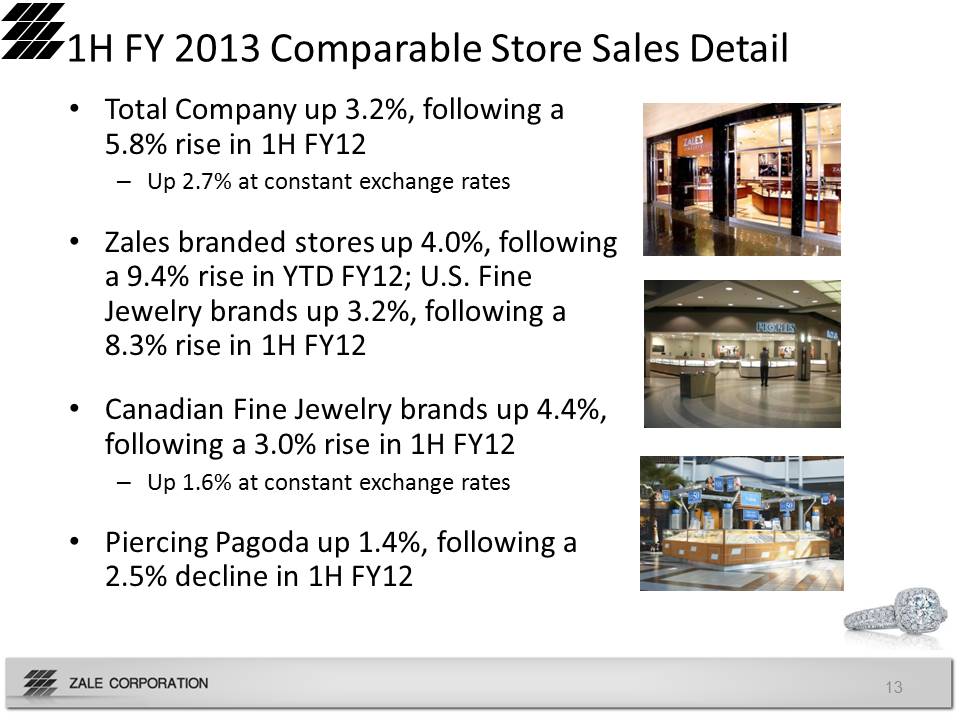
1H FY 2013 Comparable Store Sales Detail • Total Company up 3.2%, following a 5.8% rise in 1H FY12 – Up 2.7% at constant exchange rates • Zales branded stores up 4.0%, following a 9.4% rise in YTD FY12; U.S. Fine Jewelry brands up 3.2%, following a 8.3% rise in 1H FY12 • Canadian Fine Jewelry brands up 4.4%, following a 3.0% rise in 1H FY12 – Up 1.6% at constant exchange rates • Piercing Pagoda up 1.4%, following a 2.5% decline in 1H FY12 13
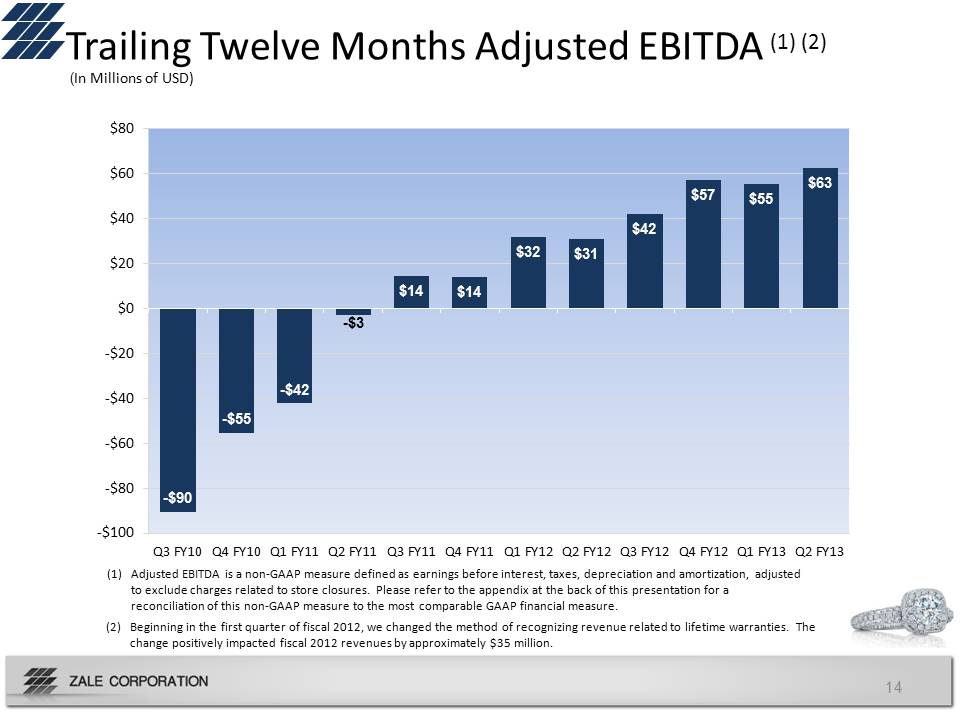
-$90 -$55 -$42 -$3 $14 $14 $32 $31 $42 $57 $55 $63 ‐$100 ‐$80 ‐$60 ‐$40 ‐$20 $0 $20 $40 $60 $80 Q3 FY10 Q4 FY10 Q1 FY11 Q2 FY11 Q3 FY11 Q4 FY11 Q1 FY12 Q2 FY12 Q3 FY12 Q4 FY12 Q1 FY13 Q2 FY13 Trailing Twelve Months Adjusted EBITDA (1) (2) ($ in Millions)(1) Adjusted EBITDA is a non‐GAAP measure defined as earnings before interest, taxes, depreciation and amortization, adjusted to exclude charges related to store closures. Please refer to the appendix at the back of this presentation for a reconciliation of this non‐GAAP measure to the most comparable GAAP financial measure. 14 (2) Beginning in the first quarter of fiscal 2012, we changed the method of recognizing revenue related to lifetime warranties. The change positively impacted fiscal 2012 revenues by approximately $35 million. (In Millions of USD)
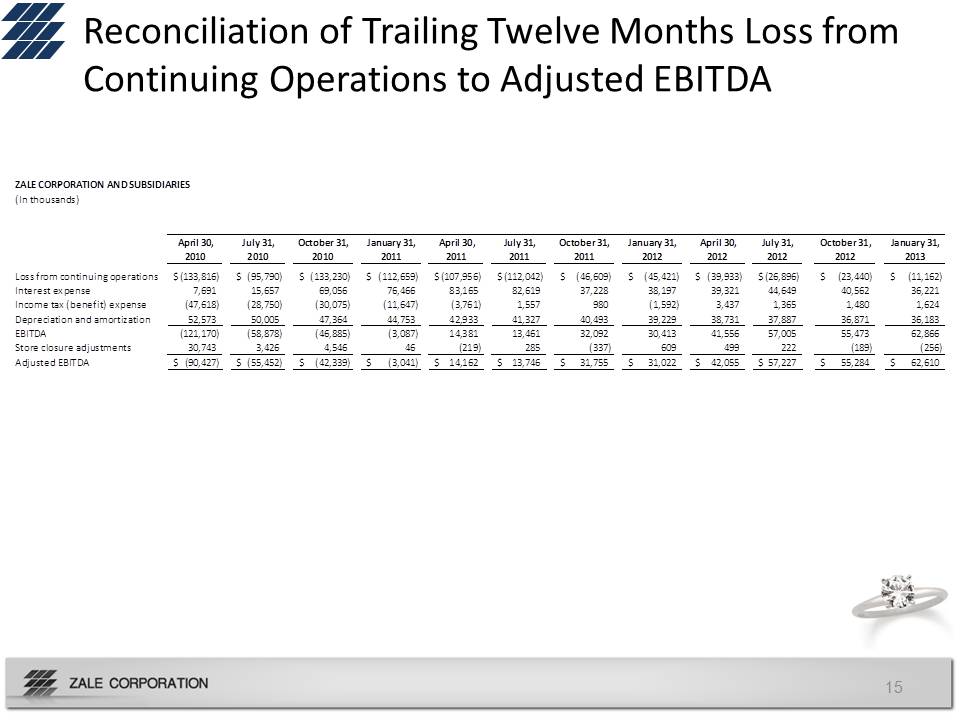
Reconciliation of Trailing Twelve Months Loss from Continuing Operations to Adjusted EBITDA ($ in Millions) 15 ZALE CORPORATION AND SUBSIDIARIES (In thousands) April 30, 2010 July 31, 2010 October 31, 2010 January 31, 2011 April 30, 2011 July 31, 2011 October 31, 2011 January 31, 2012 April 30, 2012 July 31, 2012 October 31, 2012 January 2013 Loss from continuing operations (133,816) $ (95,790) $ (133,230) $ (112,659) $ (107,956) $ (112,042) $ (46,609) $ (45,421) $ (39,933) $ (26,896) $ (23,440) $ (11,162) $ Interest expense 7,691 15,657 69,056 76,466 83,165 82,619 37,228 38,197 39,321 44,649 40,562 36,221 Income tax (benefit) expense (47,618) (28,750) (30,075) (11,647) (3,761) 1,557 980 (1,592) 3,437 1,365 1,480 1,624 Depreciation and amortization 52,573 50,005 47,364 44,753 42,933 41,327 40,493 39,229 38,731 37,887 36,871 36,183 EBITDA (121,170) (58,878) (46,885) (3,087) 14,381 13,461 32,092 30,413 41,556 57,005 55,473 62,866 Store closure adjustments 30,743 3,426 4,546 46 (219) 285 (337) 609 499 222 (189) ( Adjusted EBITDA (90,427) $ (55,452) $ (42,339) $ (3,041) $ 14,162 $ 13,746 $ 31,755 $ 31,022 $ 42,055 $ 57,227 $ 55,284 $ 62,610 $
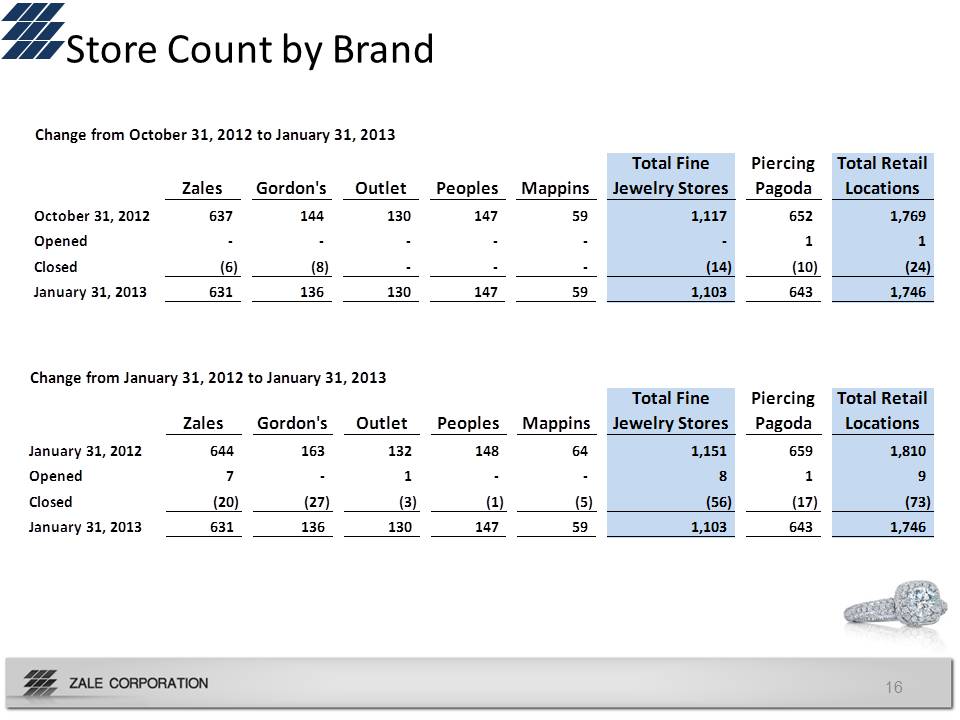
16 Store Count by Brand Change from October 31, 2012 to January 31, 2013 Zales Gordon's Outlet Peoples Mappins Total Fine Jewelry Stores Piercing Pagoda Total Retail Locations October 31, 2012 637 144 130 147 59 1,117 652 1,769 Opened ‐ ‐ ‐ ‐ ‐ ‐ 1 1 Closed (6) (8) ‐ ‐ ‐ (14) (10) (24) January 31, 2013 631 136 130 147 59 1,103 643 1,746 Change from January 31, 2012 to January 31, 2013 Zales Gordon's Outlet Peoples Mappins Total Fine Jewelry Stores Piercing Pagoda Total Retail Locations January 31, 2012 644 163 132 148 64 1,151 659 1,810 Opened 7 ‐ 1 ‐ ‐ 8 1 9 Closed (20) (27) (3) (1) (5) (56) (17) (73) January 31, 2013 631 136 130 147 59 1,103 643 1,746