Attached files
| file | filename |
|---|---|
| 8-K - FORM 8-K - Stagwell Inc | v335827_8k.htm |
| EX-99.1 - EXHIBIT 99.1 - Stagwell Inc | v335827_ex99-1.htm |

Management Presentation February 21, 2013 Fourth Quarter and Full Year Results

This presentation, including our “ 2013 Financial Outlook”, contains forward - looking statements . The Company’s representatives may also make forward - looking statements orally from time to time . Statements in this presentation that are not historical facts, including statements about the Company’s beliefs and expectations, earnings guidance, recent business and economic trends, potential acquisitions, estimates of amounts for deferred acquisition consideration and “put” option rights, constitute forward - looking statements . These statements are based on current plans, estimates and projections, and are subject to change based on a number of factors, including those outlined in this section . Forward - looking statements speak only as of the date they are made, and the Company undertakes no obligation to update publicly any of them in light of new information or future events, if any . Forward - looking statements involve inherent risks and uncertainties . A number of important factors could cause actual results to differ materially from those contained in any forward - looking statements . Such risk factors include, but are not limited to, the following : • risks associated with severe effects of international, national and regional economic downturn ; • the Company’s ability to attract new clients and retain existing clients; • the spending patterns and financial success of the Company’s clients; • the Company’s ability to remain in compliance with its debt agreements and the Company’s ability to finance its contingent pa yme nt obligations when due and payable, including but not limited to those relating to “put” option rights and deferred acquisition consideration; • the successful completion and integration of acquisitions which compliment and expand the Company’s business capabilities; an d • foreign currency fluctuations. The Company’s business strategy includes ongoing efforts to engage in material acquisitions of ownership interests in entities in the marketing communications services industry . The Company intends to finance these acquisitions by using available cash from operations and through incurrence of bridge or other debt financing, either of which may increase the Company’s leverage ratios, or by issuing equity, which may have a dilutive impact on existing shareholders proportionate ownership . At any given time the Company may be engaged in a number of discussions that may result in one or more material acquisitions . These opportunities require confidentiality and may involve negotiations that require quick responses by the Company . Although there is uncertainty that any of these discussions will result in definitive agreements or the completion of any transactions, the announcement of any such transaction may lead to increased volatility in the trading price of the Company’s securities . Investors should carefully consider these risk factors and the additional risk factors outlined in more detail in the Annual Report on Form 10 - K under the caption “Risk Factors” and in the Company’s other SEC filings . FORWARD LOOKING STATEMENTS & OTHER INFORMATION

SUMMARY • 2012 was a record year for MDC • Our strategy of creating a truly transformational business where the most talented people in the industry are dedicated to enhancing the sustainable profitable growth of their clients is working • We are winning incremental share of wallet and market share as our clients see the strong business results and trust more of their marketing and growth efforts to us • We have received exceptional industry recognition, including 2012 Agency of the Year for 72andSunny, Anomaly and kbs + were celebrated as two of only 10 ‘Standout Agencies,’ and TargetCast and Vitro were both named ‘Agencies to Watch’ • Our new business pipeline is at an all - time high • We are seeing larger opportunities across more agencies, and more disciplines as we continue to build our capabilities to help our clients drive profitable growth • As a result, we have an outstanding foundation for continued accelerated financial performance in 2013 and in the years to come •

Key Financial Highlights Material Acceleration of Financial Performance Across All Metrics: Revenue, EBITDA, EBITDA Margins, Free Cash Flow & Net Debt - to - EBITDA Ratio • Organic revenue growth of 11.9% for Q4 2012 and 8.4% for FY 2012 • Q4 2012 revenue increased 16.0% to $294.6 million • FY 2012 revenue increased 13.9% to $1.07 billion • Q4 2012 EBITDA increased 66.1% to $43.6 million • FY 2012 EBITDA increased 27.2% to $118.4 million • EBITDA margin expanded 450 basis points year over year to 14.8% in Q4 2012 • EBITDA margin expanded 120 basis points year over year to 11.1% for FY 2012 • Net new business wins of $33.7 million in Q4 2012, culminating in a total of $136.9 million for FY 2012 • Free Cash Flow increased 98.4% to $49.6 million for FY 2012 • Achieved goal of net debt - to - EBITDA ratio of 3.0x
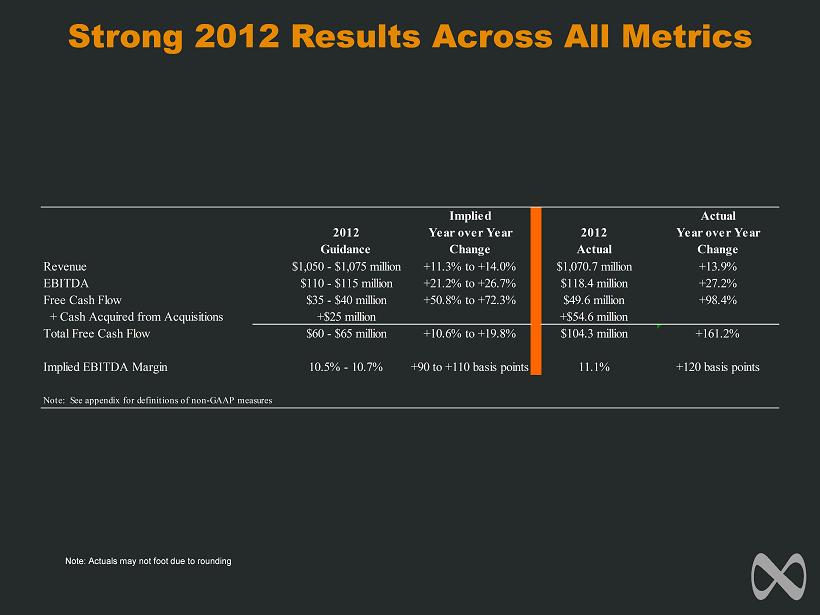
Strong 2012 Results Across All Metrics Implied Actual 2012 Year over Year 2012 Year over Year Guidance Change Actual Change Revenue $1,050 - $1,075 million +11.3% to +14.0% $1,070.7 million +13.9% EBITDA $110 - $115 million +21.2% to +26.7% $118.4 million +27.2% Free Cash Flow $35 - $40 million +50.8% to +72.3% $49.6 million +98.4% + Cash Acquired from Acquisitions +$25 million +$54.6 million Total Free Cash Flow $60 - $65 million +10.6% to +19.8% $104.3 million +161.2% Implied EBITDA Margin 10.5% - 10.7% +90 to +110 basis points 11.1% +120 basis points Note: See appendix for definitions of non-GAAP measures Note: Actuals may not foot due to rounding

CONSOLIDATED REVENUE AND EARNINGS Note: Actuals may not foot due to rounding (US$ in millions, except percentages) 2012 2011 2012 2011 Revenue 294.6$ 254.1$ 16.0 % 1,070.7$ 940.4$ 13.9 % Operating Expenses Cost of services sold 195.2 180.9 7.9 % 739.1 670.0 10.3 % Office and general expenses 96.3 66.4 45.0 % 303.1 218.5 38.7 % Depreciation and amortization 10.4 10.6 (1.9) % 46.4 40.2 15.4 % Operating profit (loss) (7.1) (3.8) (17.9) 11.7 Other income (expense), net (11.7) (10.0) (47.2) (43.3) Income tax expense 3.5 40.8 9.6 41.7 Equity in earnings of non-consolidated affiliates 0.2 (0.0) 0.6 0.2 Loss from Continuing Operations (22.1) (54.7) (74.0) (73.1) Loss from discontinued operations, net of taxes 0.9 (1.2) (5.4) (3.2) Net loss (23.0) (55.9) (79.4) (76.3) Net income attributable to the non- controlling interests (1.6) (1.9) (6.0) (8.4) Net loss attributable to MDC Partners Inc. (24.5)$ (57.7)$ (85.4)$ (84.7)$ % Change Three Months Ended December 31, Twelve Months Ended December 31, % Change

SUMMARY OF SEGMENT RESULTS - REVENUE • Strategic Marketing Services delivered 17.6% organic growth, an acceleration of 510 basis points from 3 Q 2012 • Strong new business wins in 2012 led to significant market share gains (US$ in millions, except percentages) 2012 2011 2012 2011 Revenue Strategic Marketing Services 200.7$ 165.4$ 21.3 % 721.2$ 608.0$ 18.6 % Performance Marketing Services 93.9 88.6 6.0 % 349.5 332.4 5.1 % Total Revenue 294.6$ 254.1$ 16.0 % 1,070.7$ 940.4$ 13.9 % % Change Three Months Ended December 31, Twelve Months Ended December 31, % Change Note: Actuals may not foot due to rounding

FOURTH QUARTER 2012 REVENUE GROWTH BY SEGMENT Strategic Performance Weighted Marketing Marketing Average Services Services Total Organic Growth 17.6% 1.2% 11.9% Acquisition Growth 3.3% 4.2% 3.6% Foreign Exchange Growth 0.4% 0.6% 0.5% Total 21.3% 6.0% 16.0%

FULL YEAR 2012 REVENUE GROWTH BY SEGMENT Strategic Performance Weighted Marketing Marketing Average Services Services Total Organic Growth 12.5% 0.7% 8.4% Acquisition Growth 6.4% 4.7% 5.8% Foreign Exchange Growth -0.3% -0.3% -0.3% Total 18.6% 5.1% 13.9%

Retail 18% Other 12% Auto 6% Technology 8% Consumer Products 32% Healthcare 5% Financials 8% Communications 11% Retail 12% Other 13% Auto 4% Technology 4% Consumer Products 39% Healthcare 4% Financials 10% Communications 14% FOURTH QUARTER REVENUE BY CLIENT SECTOR Note: Actuals may not foot due to rounding Q4 2012 Q4 2011 • Our Business Continues to Strengthen in Diversification Across Sectors As More Clients Turn To Us To Deliver Transformational Business Results for Them • We Continue To Expand Our Portfolio of Services and Our Industry Capabilities

Retail 14% Other 12% Auto 4% Technology 8% Consumer Products 35% Healthcare 4% Financials 10% Communications 13% Retail 17% Other 12% Auto 6% Technology 9% Consumer Products 31% Healthcare 5% Financials 8% Communications 12% FULL YEAR REVENUE BY CLIENT SECTOR Note: Actuals may not foot due to rounding FY 2012 FY 2011

-10.0% -5.0% 0.0% 5.0% 10.0% 15.0% 20.0% 25.0% MDC Partners vs. Peers Trailing 12 Month Organic Revenue MDC Peers Outperformance Despite More Difficult Comparisons Note: *Peers include Omnicom, Havas , and Publicis *Due to timing of earnings WPP and Interpublic are not included in 4 Q12 ORGANIC GROWTH 4 Q12 +11.9%

SUMMARY OF SEGMENT RESULTS - EBITDA Note: Actuals may not foot due to rounding (US$ in millions, except percentages) 2012 2011 2012 2011 EBITDA Strategic Marketing Services 38.9$ 19.6$ 98.6 % 108.0$ 74.6$ 44.9 % margin 19.4% 11.8% 15.0% 12.3% Performance Marketing Services 10.2 11.0 (6.8) % 31.2 36.2 (13.7) % margin 10.9% 12.4% 8.9% 10.9% Marketing Communications 49.2 30.6 60.8 % 139.2 110.7 25.7 % margin 16.7% 12.0% 13.0% 11.8% Corporate Expenses (6.3) (4.8) 30.4 % (22.1) (18.7) 18.1 % Profit Distributions from Affiliates 0.7 0.5 1.3 1.1 Total EBITDA 43.6$ 26.3$ 66.1 % 118.4$ 93.1$ 27.2 % margin 14.8% 10.3% 11.1% 9.9% % Change Three Months Ended December 31, Twelve Months Ended December 31, % Change • Our Focus on Building Operational Strength Across the Portfolio Has Resulted in Strong Total Margin Increases

FREE CASH FLOW Note: Actuals may not foot due to rounding (US$ in millions) 2012 2011 2012 2011 Cash Flow Provided by Continuing Operating Activities $60.1 $11.0 $78.2 $7.2 Distributions 0.7 0.5 1.3 1.1 Cash Taxes 0.3 0.1 1.2 0.2 Cash Interest, net 20.2 19.9 40.8 37.3 Changes in Working Capital (36.9) (0.4) (17.4) 37.9 Changes in Non-Current Assets & Liabilities 9.1 2.8 8.0 2.0 Other (11.5) (9.5) 0.2 (1.0) Net Income Attributable to Noncontrolling Interests 1.6 1.9 6.0 8.4 EBITDA $43.6 $26.3 $118.4 $93.1 Net Income Attibutable to Noncontrolling Interests (1.6) (1.9) (6.0) (8.4) Capital Expenditures, net (1) (5.6) (4.9) (19.2) (21.1) Cash Taxes (0.3) (0.1) (1.2) (0.2) Cash Interest, net & Other (2) (12.1) (10.2) (42.3) (38.3) Free Cash Flow (3) $24.0 $9.2 $49.6 $25.0 Cash Acquired from Acquisitions 0.0 14.9 54.6 14.9 Total Free Cash Flow (3) $24.0 $24.1 $104.3 $39.9 (3) Free Cash Flow and Total Free Cash Flow are non-GAAP measures. As shown above, Free Cash Flow represents EBITDA less net income attributable to noncontrolling interests, less capital expenditures, less cash taxes, less net cash interest (including interest paid and other). Three Months Ended December 31, Twelve Months Ended December 31, (1) Capital Expenditures, net represents capital expenditures net of landlord reimbursements. (2) Cash Interest, net & Other represents the quarterly accrual of cash interest under our Senior Notes.

LIQUIDITY *Note: At December 31, 2012, after giving effect to the limitations under the 11% Senior Notes indenture, approximately $85.0 million was available under the bank credit facility. (US$ in millions) Commitment Under Facility 150.0$ Drawn - Undrawn Letters of Credit 4.8 Funds Available Under Facility 145.2$ Total Cash 60.3 Liquidity 205.5$ Available Liquidity at December 31, 2012*

2013 FINANCIAL OUTLOOK Implied 2013 Year over Year Guidance Change Revenue $1,125 - $1,150 million +5.1% to +7.4% EBITDA $132 - $135 million +11.5% to +14.0% Free Cash Flow $55 - $60 million +10.8% to +20.9% Implied EBITDA Margin 11.7% +60 basis points Note: See appendix for definitions of non-GAAP measures • We Look For Continued Revenue Strength in 2013, Along With Continued Operational Excellence And Resulting Margin Increases

APPENDIX

TEMPORAL PUT OBLIGATIONS AND IMPACT ON EBITDA Note: Excludes put rights of $102.1 million exercisable pursuant to termination of employment or death. Incremental (US$ in millions) Cash Stock Total EBITDA in Period 2013 1.5 0.3 1.8 1.5 2014 1.4 0.5 1.9 0.2 2015 3.7 0.5 4.2 1.7 2016 2.6 0.1 2.7 0.0 Thereafter 5.3 0.0 5.3 0.6 Total $14.5 $1.4 $15.9 $4.0 Effective Multiple 4.0 Estimated Put Impact at December 31, 2012 Payment Consideration

SUMMARY OF CASH FLOW Note: Actuals may not foot due to rounding (US$ in millions) 2012 2011 Cash flows provided by (used in) continuing operating activities $78.2 $7.2 Discontinued operations (1.9) (2.7) Net cash provided by operating activities $76.3 $4.5 Cash flows provided by (used in) continuing investing activities $7.8 ($29.8) Discontinued operations (0.0) (0.7) Net cash provided by (used in) investing activities $7.8 ($30.4) Net cash provided by (used in) financing activities ($31.9) $23.3 Effect of exchange rate changes on cash and cash equivalents ($0.0) ($0.3) Net increase (decrease) in cash and cash equivalents $52.2 ($2.9) Twelve Months Ended December 31,

DEFINITION OF NON - GAAP MEASURES • EBITDA: EBITDA is a non - GAAP measure, that represents operating profit plus depreciation and amortization, stock - based compensation, acquisition deal costs, deferred acquisition consideration adjustments and profit distributions from affiliates . • Organic Growth: Organic revenue growth is a non - GAAP measure that refers to growth in revenues from sources other than acquisitions or foreign exchange impacts. • Free Cash Flow: Free cash flow is a non - GAAP measure that represents EBITDA less net income attributable to noncontrolling interests, less capital expenditures net of landlord reimbursements, less net cash interest (including interest paid and to be paid on the 11% Senior Notes), less cash taxes plus realized cash foreign exchange gains. • Total Free Cash Flow: Total free cash flow is a non - GAAP measure that represents free cash flow plus changes in working capital plus other changes in cash. • Net Bank Debt or Net Debt: Debt due pertaining to the revolving credit facility plus debt pertaining to the Senior Notes less total cash and cash equivalents. Note: A reconciliation of Non - GAAP to US GAAP reported results has been provided by the Company in the tables included in the earnings release issued on February 21, 2013.