Attached files
EXHIBIT 99.2

* Fourth Quarter 2012 Conference Call February 21, 2013

* Forward-Looking Statements This presentation contains forward-looking statements within the meaning of Section 27A of the Securities Act of 1933 and Section 21E of the Securities Exchange Act of 1934. All such statements, other than statements of historical fact, are “forward-looking statements” within the meaning of the Private Securities Litigation Reform Act of 1995, including, without limitation, any projections of financial items; the timing of the closing of our pipelay vessel sales; projections of contracting services activity; future operations expenditures; projections of utilization; any statements of the plans, strategies and objectives of management for future operations; any statements concerning developments; any statements regarding future economic conditions or performance; any statements of expectation or belief; and any statements of assumptions underlying any of the foregoing. These statements involve certain assumptions we made based on our experience and perception of historical trends, current conditions, expected future developments and other factors we believe are reasonable and appropriate under the circumstances. The forward-looking statements are subject to a number of known and unknown risks, uncertainties and other factors that could cause our actual results to differ materially. The risks, uncertainties and assumptions referred to above include the performance of contracts by suppliers, customers and partners; delays, costs and difficulties related to the pipelay vessel sale; actions by governmental and regulatory authorities; operating hazards and delays; employee management issues; local, national and worldwide economic conditions; uncertainties inherent in the exploration for and development of oil and gas; complexities of global political and economic developments; geologic risks, volatility of oil and gas prices and other risks described from time to time in our reports filed with the Securities and Exchange Commission (“SEC”), including the Company’s most recently filed Annual Report on Form 10-K and in the Company’s other filings with the SEC. Free copies of the reports can be found at the SEC’s website, www.SEC.gov. You should not place undue reliance on these forward-looking statements which speak only as of the date of this presentation and the associated press release. We assume no obligation or duty and do not intend to update these forward-looking statements except as required by the securities laws.

* Presentation Outline Executive Summary Summary of Q4 2012 Results (pg. 4) Operational Highlights by Segment Contracting Services (pg. 9) Oil & Gas (pg. 14) Key Balance Sheet Metrics (pg. 16) 2013 Outlook (pg. 19) Non-GAAP Reconciliations (pg. 23) Questions & Answers Helix CEO Owen Kratz initiating first steel cut for Q5000 newbuild at Jurong Shipyard in Singapore

* Executive Summary *

* Executive Summary ($ in millions, except per share data) Related to our non US (offshore UK) oil and gas property, Camelot, that was substantially abandoned as of December 31, 2012. See non-GAAP reconciliation on slide 24.

* Executive Summary Q4 2012 earnings (loss) per share of $(1.64) per diluted share compared with $0.14 per diluted share in Q3 2012 Impairment charge of $157.8 million ($102.5 million, $0.98 per share after-tax) related to the pending sale of the Caesar and related mobile pipelay equipment Impairment charge of $138.6 million ($90.1 million, $0.86 per share after-tax) related to the February 2013 sale of our oil and gas business (included in discontinued operations) Net realized loss of $3.3 million ($10.5 million loss in continuing operations and $7.2 million gain in discontinued operations) due to the discontinuance of hedge accounting on our commodity contracts as a result of the sale of our oil and gas business The above three items resulted in an after-tax impact of $(1.87) per diluted share - $(1.05) per diluted share continued operations and $(0.82) per diluted share discontinued operations. Contracting Services and Production Facilities 94% utilization of Well Intervention vessels with the Well Enhancer returning to service after 52-day regulatory dry dock; Q4000 100% utilized during the fourth quarter Robotics operated 10 chartered vessels during the fourth quarter, 87% utilization
* Executive Summary Oil and Gas Fourth quarter average production rate of 15.6 thousand barrels of oil equivalent per day (Mboe/d) – 70% oil Oil and gas production totaled 1.4 MMboe in Q4 2012 versus 1.5 MMboe in Q3 2012 Avg realized price for oil of $99.32 / Bbl ($98.57 / Bbl in Q3 2012), inclusive of hedges Avg realized price for gas of $3.38 / Mcfe ($5.69 / Mcfe in Q3 2012), inclusive of hedges Lower gas price realizations due to the discontinuance of hedge accounting on our commodity contracts in December as a result of the sale of our oil and gas business NGL production of 0.12 MMboe in Q4 2012 and 0.11 MMboe in Q3 2012 Balance sheet Cash decreased to $437 million at 12/31/2012 from $584 million at 9/30/2012 $154 million utilized to redeem convertible senior notes on 12/15/2012 Liquidity* at $925 million at 12/31/2012 Net debt decreased to $582 million at 12/31/2012 from $589 million at 9/30/2012 See updated debt maturity profile on slide 17 Liquidity as we define it is equal to cash and cash equivalents ($437 million), plus available capacity under our revolving credit facility ($488 million).

* Operational Highlights *

* ($ in millions, except percentages) See non-GAAP reconciliation on slide 25. Amounts are prior to intercompany eliminations. Before gross profit impact of asset impairment charges: $157.8 million for the Caesar in Q4, $4.4 million for well intervention assets at our former operations in Australia in Q3. 94% utilization for the Well Intervention fleet; Q4000 100% utilized for the fourth quarter Two additional ROVs added to Robotics fleet Robotics operated 10 chartered vessels (4 under long term charter) during the fourth quarter Pipelay vessels remain fully booked until the close of the sale transactions Contracting Services

* GOM Q4000 100% utilized during Q4 Full backlog thru 2014, plus pending commitments beyond Helix 534 expected to be placed in service in Q3 with full backlog the remainder of 2013 Full backlog in 2014 Backlog in 2015 and 2016 North Sea Seawell and Well Enhancer 91% utilized during Q4 on a variety of well intervention projects Both vessels fully booked in 2013 with commitments in 2014/2015 Charter agreement for the Skandi Constructor expected to commence Q2 2013 with an initial backlog of 75+ days Q4000 at work in the Gulf of Mexico Well Enhancer in transit Contracting Services – Well Ops

* 87% chartered vessel utilization, 62% utilization for ROVs, trenchers, ROVDrills Two work class ROVs placed into service in Q4 Grand Canyon commenced work in both ROV and trenching services in Q4 Commenced 150 day windfarm contract utilizing Grand Canyon and T1200 for London Array project in December FY2012 renewable energy services revenue of $54 million Extended ROV services contract in support of Murphy in APAC through 2013 T1200 mobilizing for operation in the North Sea Contracting Services – Robotics
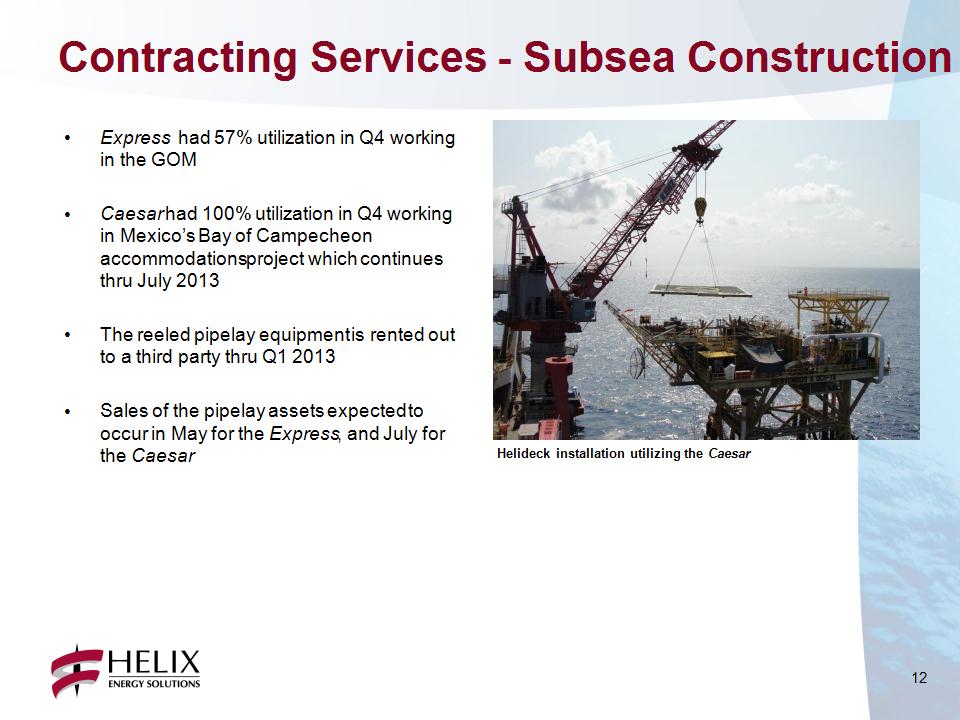
* Express had 57% utilization in Q4 working in the GOM Caesar had 100% utilization in Q4 working in Mexico’s Bay of Campeche on accommodations project which continues thru July 2013 The reeled pipelay equipment is rented out to a third party thru Q1 2013 Sales of the pipelay assets expected to occur in May for the Express, and July for the Caesar Helideck installation utilizing the Caesar Contracting Services – Subsea Construction

* Intrepid (1) Express Caesar Olympic Canyon (2) Deep Cygnus (2) Olympic Triton (2) Grand Canyon (2) (6) spot vessels (2) Seawell Well Enhancer Q4000 49 ROVs 2 ROVDrill Units 4 Trenchers (1) Intrepid was cold stacked in Q3 2012 until it was sold in September. Vessel excluded from Q3 & Q4 2012 utilization statistics. (2) Chartered vessels. Contracting Services Utilization

* Financial Highlights ($ in millions, except production and price data) Fourth quarter 2012 impairment charge of $138.6 million taken to reduce the book value of the domestic Oil and Gas business to its estimated fair value as a result of its sale in February 2013. Fourth quarter 2011 impairments primarily associated with the reduction in carrying values of certain oil and gas properties due to year-end revisions in reserves. Fourth quarter 2011 and third quarter 2012 decommissioning overruns (ARO increases) related to our GOM properties. Including effect of settled hedges and mark-to-market derivative contracts. Natural gas per Mcf prices inclusive of sales of NGLs. Lower gas realizations in the fourth quarter due to the discontinuance of hedge accounting on our commodity contracts in December as a result of the announced sale of our oil and gas business. Oil & Gas

* Oil & Gas Included accretion expense. Excluded exploration expense and net hurricane-related costs (reimbursements). Included $2.0, $2.0, and $8.4 million related to a weather derivative contract (catastrophic bond) for the quarters ended December 31, 2012, December 31, 2011, and September 30,2012 respectively. Operating Costs ($ in millions, except per Boe data)

* Key Balance Sheet Metrics *

* Total funded debt of $1.1 billion at end of Q4 2012 consisting of: $204 million Convertible Senior Notes – 3.25% (A) ($172 million net of unamortized debt discount) $367 million Term Loan (B) - LIBOR + 3.50% on $271 million, and LIBOR + 2.75% on $96 million $100 million Revolver borrowings (C) – LIBOR + 2.75% $488 million of availability (including ~$12 million of LCs in place as of December 31, 2012) $275 million Senior Unsecured Notes – 9.5% $105 million MARAD Debt – 4.93% Convertible Notes Term Loans / Revolver Senior Unsecured Notes MARAD Debt $154 million of convertible senior notes issued in 2005 redeemed in December 2012 and remaining $4 million of 2005 notes in February 2013. $294 million of Term Loans repaid in February 2013 with proceeds from the sale of our oil and gas business. $24 million of our Revolver repaid in February 2013 with proceeds from the sale of our oil and gas business. Debt Maturity Profile

* Liquidity of approximately $925 million at 12/31/2012 ($ amounts in millions) Includes impact of unamortized debt discount under our convertible senior notes. Liquidity, as we define it, is equal to cash and cash equivalents ($437 million), plus available capacity under our revolving credit facility ($488 million). Proforma 2012 balance reflects cash proceeds and debt retirements as a result of the divestiture of our oil and gas business in February and our pipelay assets mid-2013. Debt and Liquidity Profile

* 2013 Outlook *

* 2013 Outlook ($ in millions) 2013 Outlook and 2012 Actual includes $27 million and $367 million from Oil and Gas discontinued operations. 2013 Outlook excluding Subsea Construction and Oil and Gas, plus expected annualized contribution from Helix 534 and charted Skandi Constructor.

* 2013 Outlook Contracting Services Backlog totaling $800 million at the end of 2012 (~$530 million expected to be completed in 2013) Strong utilization expected for the well intervention fleet Q4000 full backlog thru 2014, plus pending commitments beyond Helix 534 expected in service in Q3, full backlog for remainder of 2013 Full backlog in 2014 Backlog in 2015 and 2016 Seawell and Well Enhancer fully booked in 2013 with strong interest in 2014/2015 Skandi Constructor to commence work Q2 2013 with initial backlog of 75+ days Continuing to add ROV systems in 2013 to support commercial growth in our Robotics business Awarded geotechnical drilling campaign in APAC utilizing ROVDrill in Q1 2013 The sale of the Express and Caesar to close in May and July, respectively Oil and gas sale closed on February 6, 2013 $624 million in proceeds received (approximately $550 million in after-tax proceeds) $318 million of term loans ($294 million) and revolver ($24 million) repaid as a result of the sale

* 2013 Outlook - Capex Capital Expenditures Contracting Services (~$350 million) Q5000 new build (approximately $140 million of capex in 2013) On schedule for delivery in 2015 Newly acquired Helix 534 continues conversion in Singapore into a well intervention vessel Estimated $180 million for vessel, conversion and intervention riser system (approximately $70 million remaining be incurred in 2013) Expect to deploy vessel to Gulf of Mexico in Q3 2013 Approximately $45 million for intervention riser system and deck modifications for the Skandi Constructor (approximately $35 million remaining to be incurred in 2013) Continued incremental investment in Robotics business Maintenance capital for Seawell life extension and Helix Producer I dry dock

* Non-GAAP Reconciliations *

* Non-GAAP Reconciliations We calculate Adjusted EBITDAX as earnings before net interest expense, taxes, depreciation and amortization and exploration expense. These non-GAAP measures are useful to investors and other internal and external users of our financial statements in evaluating our operating performance; they are widely used by investors in our industry to measure a company’s operating performance without regard to items which can vary substantially from company to company, and help investors meaningfully compare our results from period to period. Adjusted EBITDAX should not be considered in isolation or as a substitute for, but instead is supplemental to, income from operations, net income and other income data prepared in accordance with GAAP. Non-GAAP financial measures should be viewed in addition to, and not as an alternative to our reported results prepared in accordance with GAAP. Users of this financial information should consider the types of events and transactions which are excluded from this measure. ($ in millions)

* Non-GAAP Reconciliations ($ in millions)

* * Follow Helix ESG on Twitter: www.twitter.com/Helix_ESG Join the discussion on LinkedIn: www.linkedin.com/company/helix