Attached files
| file | filename |
|---|---|
| 8-K - FORM 8-K - CONSUMERS ENERGY CO | d490589d8k.htm |
Exhibit 99.1

[GRAPHIC]
DSEDATA:[ECR][99999][rrdSource][3][08][STYLEFILE,0c0750000a6a622d-b00750000a6a622e,99,d00750000a6a621c-d00750000a6a621c,54]
This presentation is made as of the date hereof and contains “forward-looking statements” as defined in Rule 3b-6 of the Securities Exchange Act of 1934, as amended, Rule 175 of the Securities Act of 1933, as amended, and relevant legal decisions. The forward-l
ooking statements are subject to risks and uncertainties. They should be read i n conjunction with “FORWARD-LOOKING STATEMENTS AND INFORMATION” and “RISK FACTORS” sections of CMS Energy’s and Consumers Energy’s Form 10-K for the year ended December 31 and as updated in subsequent 10-Qs. CMS Energy’s and Consumers Energy’s “FORWARD-LOOKING STATEMENTS AND INFORMATION” and “RISK FACTORS” sections are incorporated herein by reference and discuss im portant factors that could cause CMS Energy’s and Consumers Energy’s results to differ materially from those anticipated in such statements.
CMS Energy and Consumers Energy undertake no obligation to update any of the information presented herein to reflect facts, events or circu
mstances after the date hereof.
The presentation also includes non-GAAP measures when describing CMS Energy’s results of operations and financial
performance. A reconciliation of each of these measures to the most directly comparable GAAP measure is
included in the appendix and posted on our website at www.cmsenergy.com.
CMS Energy provides financial results on both a reported (Generally Accepted Accounting Principles) and adjusted (non-GAAP) basis. Management views adjusted earnings as a key measure of the company’s present operating financial performance,
unaffected by discontinued operations, asset sales, impairments, regulatory items from prior years, or othe r items. Certain of these items have the potential to impact, favorably or unfavorably, the company’s reported earnings in 2013. The company is not able to estimate the impact of these matters and is not providing reported earnings guidance.
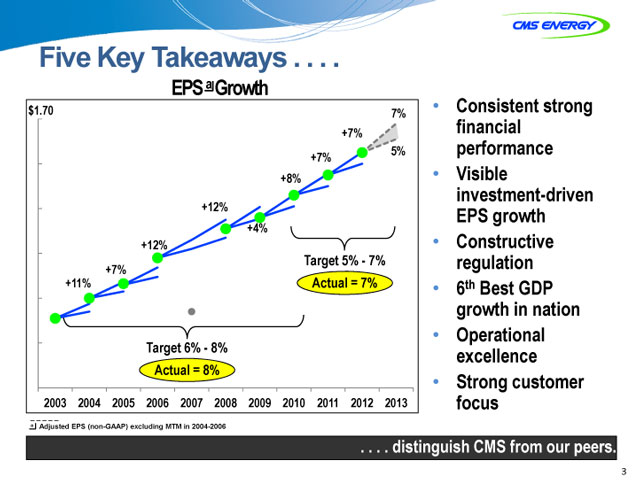
Five Key Takeaways . . . .
EPS a Growth
Consistent strong financial performance
Visible investment-driven EPS growth
Constructive regulation
6th Best GDP growth in nation
Operational excellence
Strong customer focus
a Adjusted EPS (non-GAAP) excluding MTM in 2004-2006
. . . . distinguishistinguish CMS from our peers.
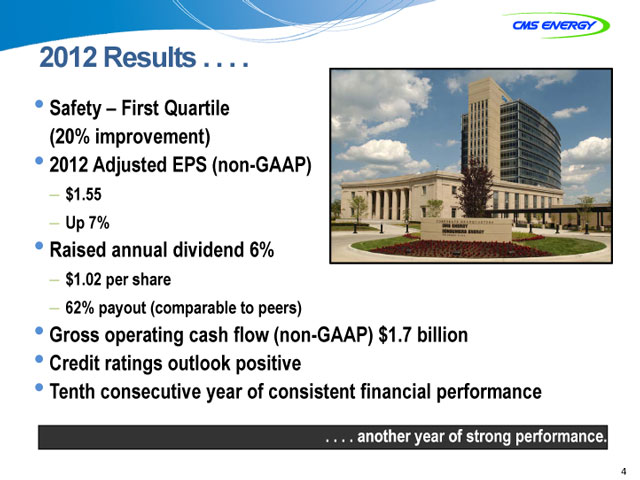
2012 Results . . . .
Safety – First Quartile (20% improvement)
2012 Adjusted EPS (non-GAAP)
– $1.55
– Up 7%
Raised annual dividend 6%
– $1.02 per share
– 62% payout (comparable to peers)
Gross operating cash flow (non-GAAP) $1.7 billion
Credit ratings outlook positive
Tenth consecutive year of consistent financial performance
. . . . anothernother year of strong performance.
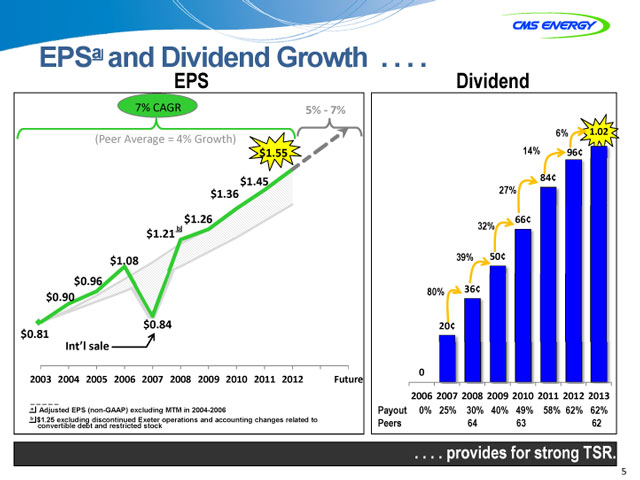
EPSa and Dividend Growth . . . .
EPS Dividend
(Peer Average = 4% Growth)
$1.55
$1.45
$1.36
$1.26
b
$1.21
$1.08
$0.96
$0.90
$0.81 $0.84 Int’l sale
2003 2004 2005 2006 2007 2008 2009 2010 2011 2012 Future
a Adjusted EPS (non-GAAP) excluding MTM in 2004-2006 b $1.25 excluding discontinued Exeter operations and accounting changes related to convertible debt and restricted stock
6% 1.02
14% 96¢
84¢
27%
66¢
32% 39% 50¢ 80% 36¢ 20¢
0
2006 2007 2008 2009 2010 2011 2012 2013
Payout 0% 25% 30% 40% 49% 58% 62% 62% Peers 64 63 62
. . . . provides for strong TSR.
5
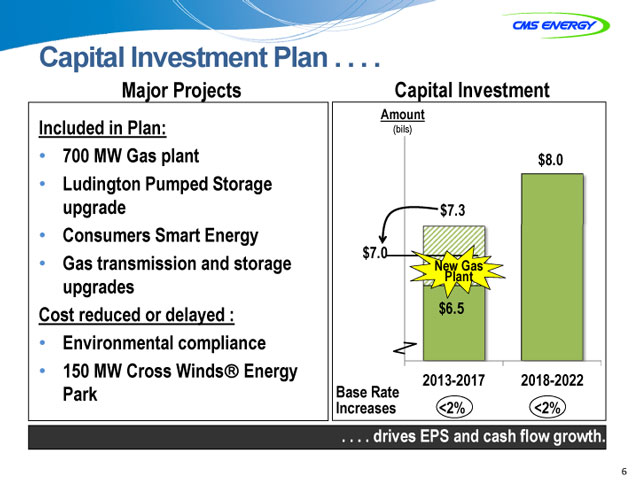
Capital Investment Plan . . . .
Major Projects Capital Investment
Included in Plan:
700 MW Gas plant
Ludington Pumped Storage upgrade
Consumers Smart Energy
Gas transmission and storage upgrades Cost reduced or delayed :
Environmental compliance
150 MW Cross Winds®Energy Park
Amount
(bils)
$8.0
$7.3
$7.0
New Gas Plant
$6.5
2013-2017 2018-2022 Base Rate Increases <2% <2%
. . . . drivesrives EPS and cash flow growth.
6
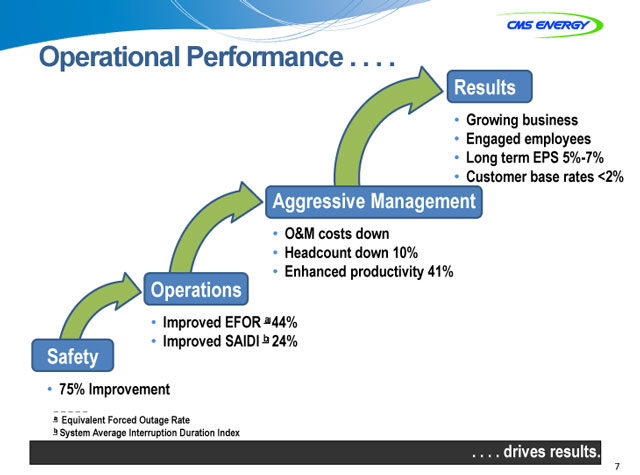
Operational Performance . . . .
Results
Growing business
Engaged employees
Long term EPS 5%-7%
Customer base rates <2%
Aggressive Management
O&M costs down
Headcount down 10%
Enhanced productivity 41%
Enhanced
Operations
Improved EFOR a 44%
Improved SAIDI b 24%
11 Safety
75% Improvement
a Equivalent Forced Outage Rate b System Average Interruption Duration Index
. . . . drivesrives results.
7
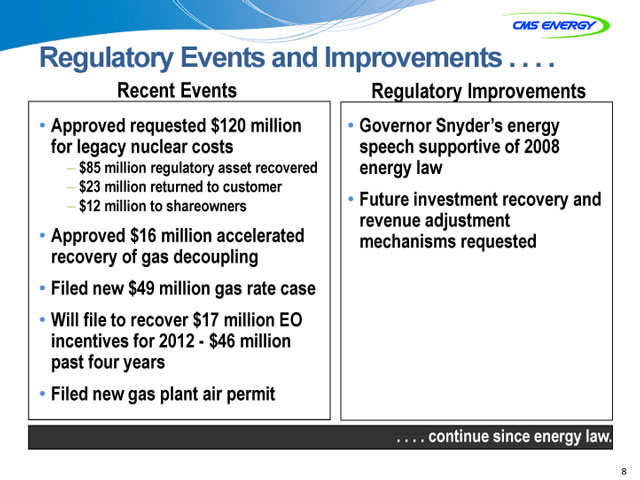
Regulatory Events and Improvementst
Recent Events Regulatory Improvements
Approved requested $120 million Governor Snyder’s energy
for legacy nuclear costs speech supportive of 2008
– $85 million regulatory asset recovered energy law
– $23 million returned to customer
$12 million to shareowners Future investment recovery and
revenue adjustment
Approved $16 million accelerated mechanisms requested
recovery of gas decoupling
Filed new $49 million gas rate case
Will file to recover $17 million EO
incentives for 2012 - $46 million
past four years
Filed new gas plant air permit
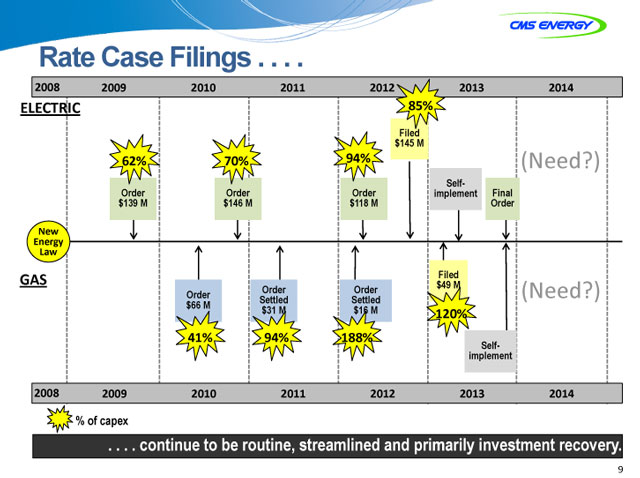
Rate Case Filings . . . .
2008 2009 2010 2011 2012 2013 2014
ELECTRIC 85%
$Filed 145 M
62% 70% 94% (Need?)
Order Order Order implement Self- Final $139 M $146 M $118 M Order
New Energy Law
GAS $ Filed 49 M
Order Order (Need?) Order Settled Settled
$66 M
$31 M $16 M 120%
41% 94% 188%
implement Self-
2008 2009 2010 2011 2012 2013 2014
% of capex
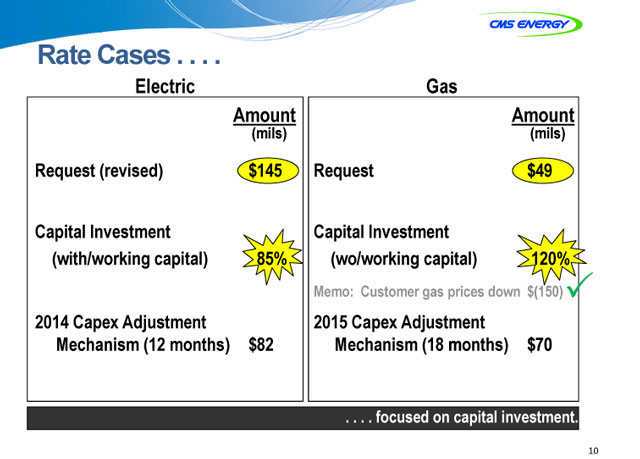
Rate Cases
Electric asGas
Amount Amount
(mils) (mils)
Request (revised) $ 145 Request $49
Capital Investment Capital Investment
(with/working capital) 85% (wo/working capital) 120%
Memo: Customer gas prices down $(150)
2014 Capex Adjustment 2015 Capex Adjustment
Mechanism (12 months) $ 82 Mechanism (18 months) $70
. . . focusedocused on capital investment.
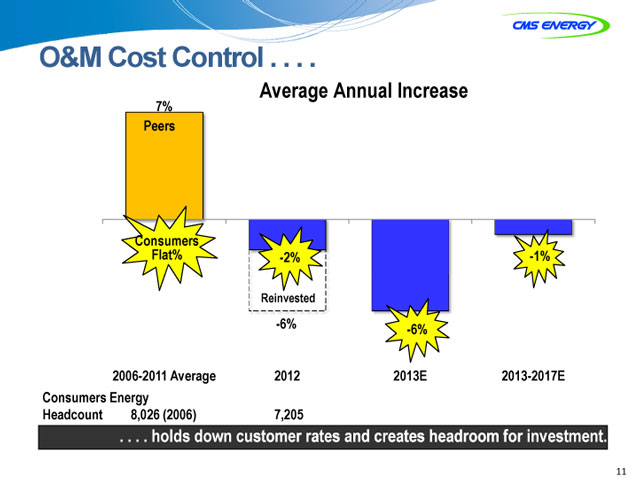
O&M Cost Control . . . .
7% Average Annual Increase
2006-2011 Average 2012 2013E 2013-2017E Consumers Energy Headcount 8,026 (2006) 7,205
. . . . holdsolds down customer rates and creates headroom for investment.
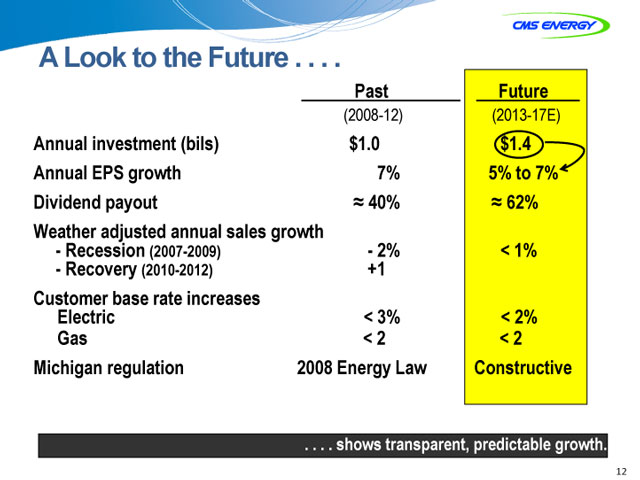
A Look to the Future
Past Future
(2008-12) (2013-17E)
Annual investment (bils) $1.0 $1.4
Annual EPS growth 7% 5% to 7%
Dividend payout ~ 40% ~ 62%
Weather adjusted annual sales growth
- Recession (2007-2009) - 2% < 1%
- Recovery (2010-2012) +1
Customer base rate increases
Electric < 3% < 2%
Gas < 2 < 2
Michigan regulation 2008 Energy Law Constructive
. . . . shows transparent, predictable growth.
12
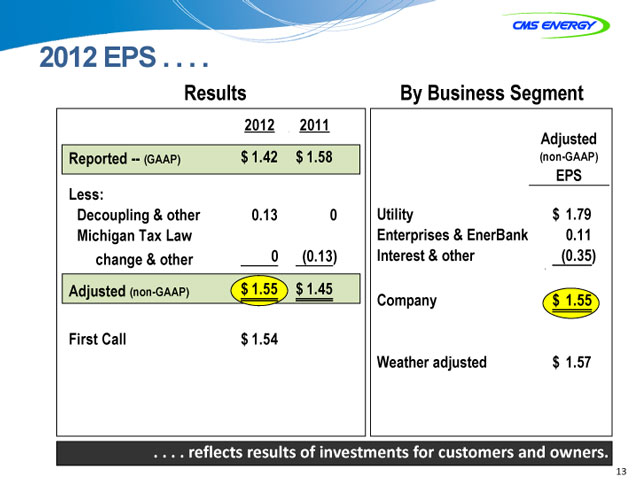
2012 EPS
Results By Business Segment
2012 2011
Adjusted
Reported -- (GAAP) $ 1.42 $ 1.58 (non-GAAP)
EPS
Less:
Decoupling & other 0.13 0 Utility $ 1.79
Michigan Tax Law Enterprises & EnerBank 0.11
change & other 0 (0.13) Interest & other (0.35)
Adjusted (non-GAAP) $ 1.55 $ 1.45 Company $ 1.55
First Call $ 1.54
Weather adjusted $ 1.57
. . . . reflects results of investments for customers and owners.
13
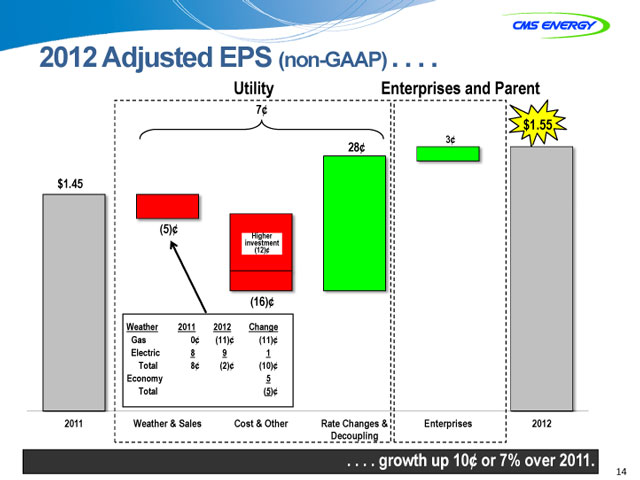
2012 Adjusted EPS (non-GAAP) . . . .
Utility Enterprises and Parent
7¢
$1.55
3¢
28¢
$1.45
(5)¢
investment Higher (12)¢
(16)¢
Weather 2011 2012 Change Gas 0¢ (11)¢ (11)¢ Electric 8 9 1 Total 8¢ (2)¢ (10)¢ Economy 5 Total (5)¢
2011 Weather & Sales Cost & Other Rate Changes & Enterprises 2012 Decoupling
. . . . growthrowth up 10¢ or 7% over 2011.
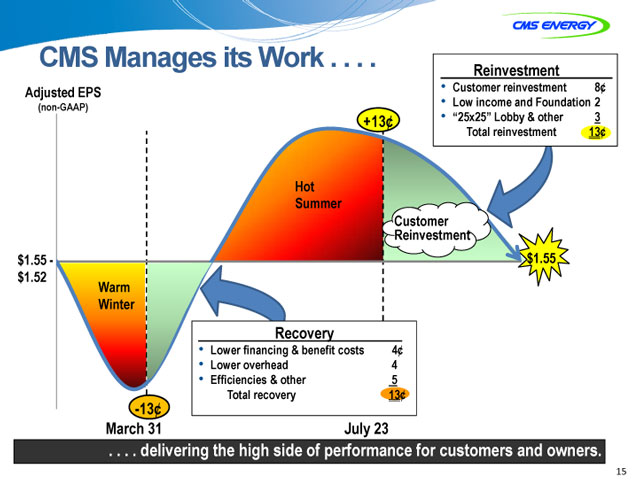
CMS Manages its Work . . . .
Reinvestment
Adjusted EPS Customer reinvestment 8¢ (non-GAAP) Low income and Foundation 2 +13¢ “25x25” Lobby & other 3 Total reinvestment 13¢
Hot Summer
Customer Reinvestment $1.55 - $1.55 $1.52 Warm Winter
Recovery
Lower financing & benefit costs 4¢
Lower overhead 4
Efficiencies & other 5 Total recovery 13¢
-13¢
March 31 July 23
. . . . deliveringelivering the high side of performance for customers and owners.

Our Top Priorities for 2013 . . . .
Safety
Operational excellence
Execute investment plan
Gas Plant Certificate of Need
Constructive electric and gas rate case outcomes
Achieve 11th year of consistent financial performance
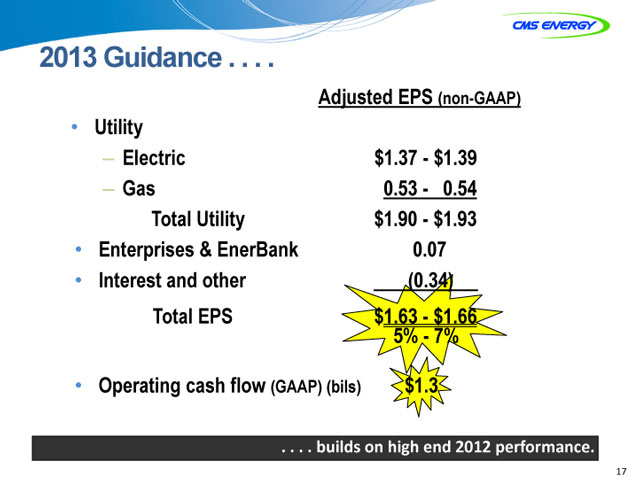
2013 Guidance . . . .
Adjusted EPS (non-GAAP)
Utility
– Electric $1.37 - $1.39
– Gas 0.53 - 0.54 Total Utility $1.90 - $1.93
Enterprises & EnerBank 0.07
Interest and other (0.34) Total EPS $1.63 5% - - $ 7% 1.66
Operating cash flow (GAAP) (bils) $1.3
. . . . buildsuilds on high end 2012 performance.
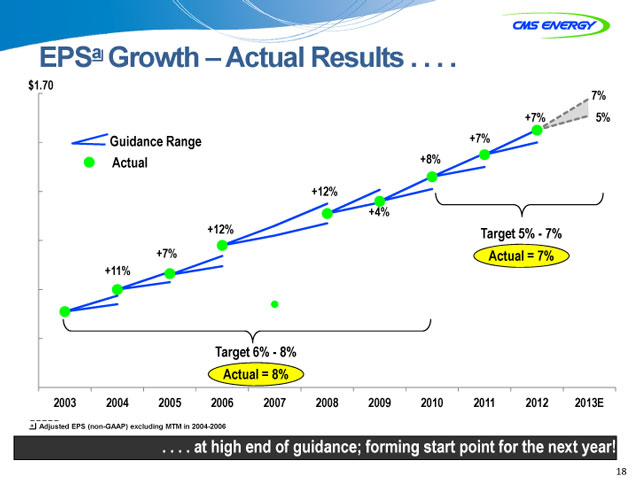
EPSa Growth – Actual Results . . . .
$1.70
7%
+7% 5%
Guidance Range +7%
Actual +8%
+12%
+4%
+12% Target 5% - 7%
+7% Actual = 7%
+11%
Target 6% - 8%
Actual = 8%
2003 2004 2005 2006 2007 2008 2009 2010 2011 2012 2013E
a Adjusted EPS (non-GAAP) excluding MTM in 2004-2006
. . . . at high end of guidance; forming start point for the next year!
18
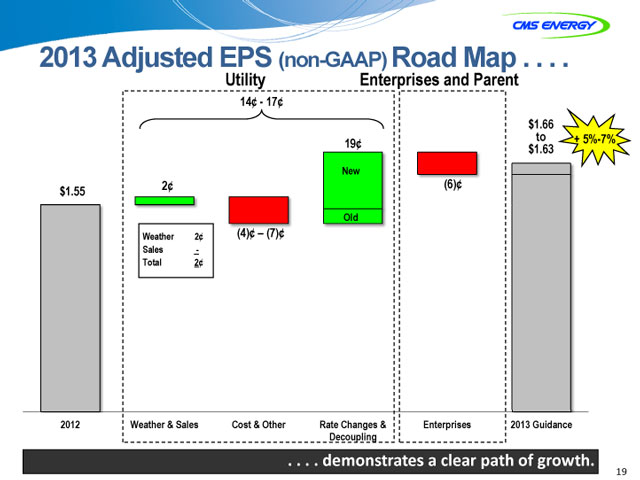
2013 Adjusted EPS (non-GAAP) Road Map . . . .
Utility Enterprises and Parent
14¢ - 17¢ $1.66 to + 5%-7%
19¢ $1.63
New
2¢ (6)¢ $1.55
Old
Weather 2¢ (4)¢ – (7)¢
Sales -Total 2¢
2012 Weather & Sales Cost & Other Rate Changes & Enterprises 2013 Guidance Decoupling
. . . . demonstr emonstrates es a clear path of growth.
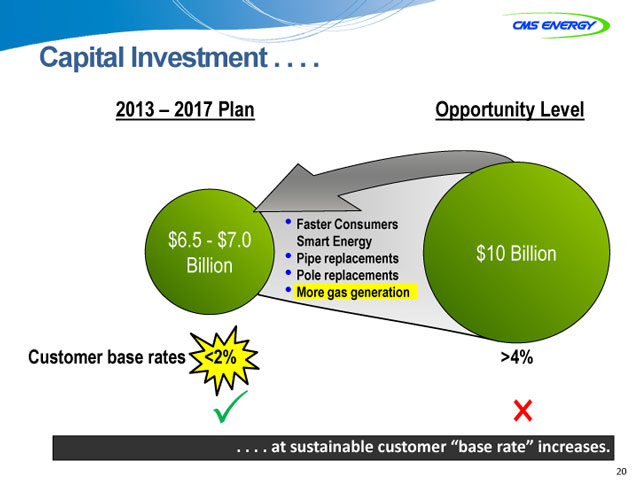
Capital Investment . . . .
2013 – 2017 Plan Opportunity Level
Faster Consumers $6.5 - $7.0 Smart Energy
Pipe replacements $10 Billion
Billion
More gas generation
Customer base rates <2%2% >4%4%
3 ×
. . . . at sustainable customer “base rate” increases.
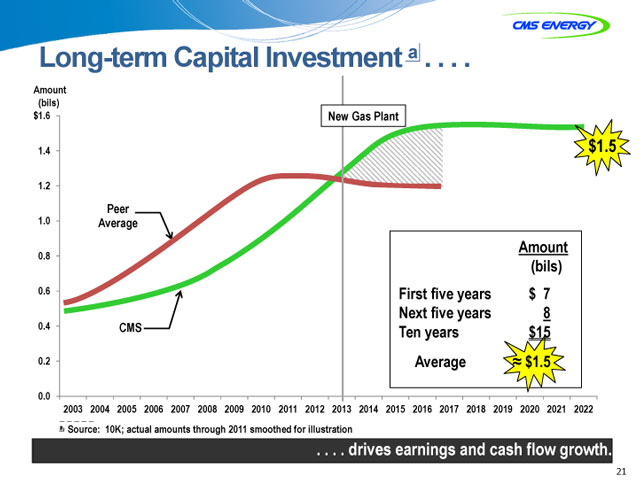
Long-term Capital Investment a . . . .
Amount (bils) $1.6 New Gas Plant
1.4 $1.5
1.2
Peer 1.0 Average
Amount
0.8
(bils) 0.6 First five years $ 7 Next five years 8 0.4 CMS Ten years $15 0.2 Average ~ $1.5
0.0
2003 2004 2005 2006 2007 2008 2009 2010 2011 2012 2013 2014 2015 2016 2017 2018 2019 2020 2021 2022
a Source: 10K; actual amounts through 2011 smoothed for illustration
. . . . drives earnings and cash flow growth.
| Utility |
|
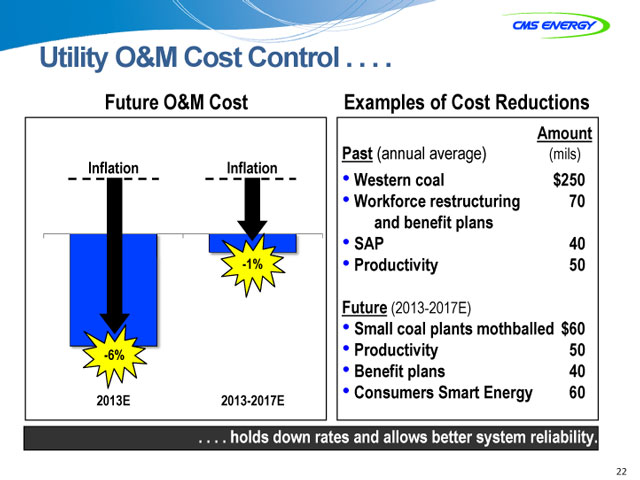
O&M Cost Control . . . . |
Future O&M Cost Examples of Cost Reductions
Amount
Past (annual average) (mils)
Inflation Inflation
Western coal $250
Workforce restructuring 70
and benefit plans
SAP 40
-1% Productivity 50
Future (2013-2017E)
Small coal plants mothballed $60
-6% Productivity 50
Benefit plans 40
Consumers Smart Energy 60
2013E 2013-2017E
. . . . holds down rates and allows better system reliability.
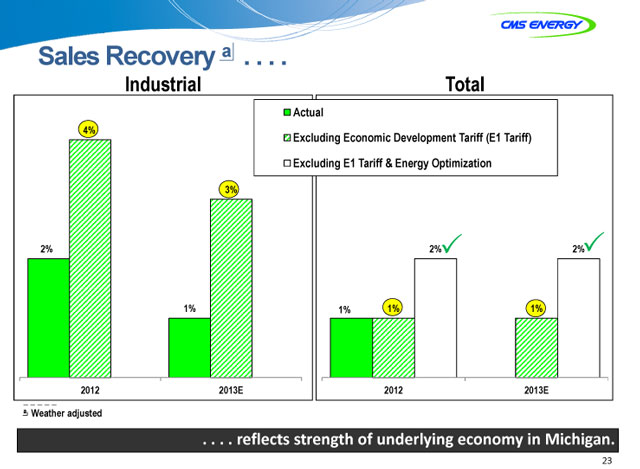
Sales Recovery a . . . .
Industrial Total otal
Actual
Excluding Economic Development Tariff (E1 Tariff) Excluding E1 Tariff & Energy Optimization
a Weather adjusted
. . . . reeflects strength of underlying economy in Michigan.
23
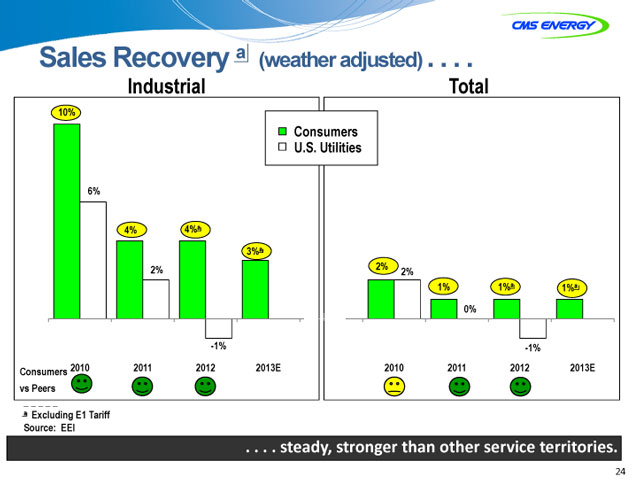
Sales Recovery a (weather adjusted) . . . .
Industrial Total otal
10%
Consumers U.S. Utilities
-1% -1%
Consumers 2010 2011 2012 2013E 2010 2011 2012 2013E vs Peers
a Excluding E1 Tariff Source: EEI
. . . . steady, stronger than other service territories.
24
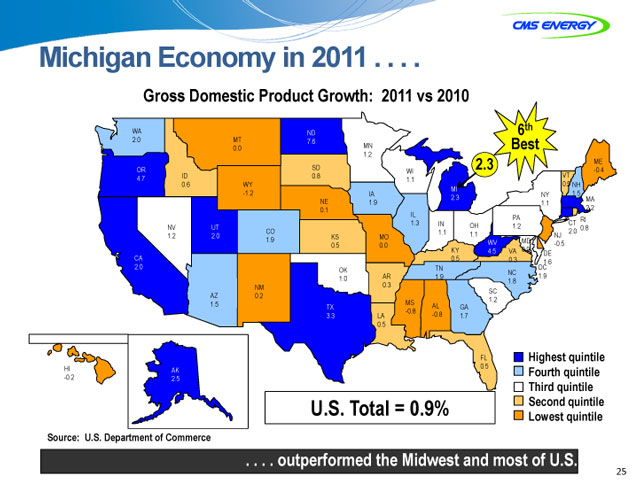
Michigan Economy in 2011 . . . .
Gross Domestic Product Growth: 2011 vs 2010
WA 6th 2.0 MT ND
7.6
0.0 MN Best 1.2
SD 2.3 ME OR WI -0.4 4.7 ID 0.8 VT
1.1
0.6 WY 0.5 NH MI
-1.2 IA NY 1.5 2.3 MA
NE 1.9 1.1
0.1 IL 2.2 PA RI
1.3 IN OH CT NV UT 1.2 0.8 CO 1.1 1.1 2.0 1.2 2.0 KS MO NJ
1.9 WV MD
0.5 0.0 -0.5 KY 4.5 VA 0.9 DE
CA 0.5 0.3
1.6 2.0 TN DC
OK NC
1.0 AR 1.9 1.9 1.8 NM 0.3 SC
AZ 0.2
MS 1.2 1.5 TX -0.8 AL GA
3.3 LA -0.8 1.7 0.5
FL Highest quintile
HI 0.5
AK Fourth quintile -0.2 2.5 Third quintile
U.S. Total = 0.9% Second quintile
Lowest quintile
Source: U.S. Department of Commerce
. . . . outperformed the Midwest and most of U.S.
25
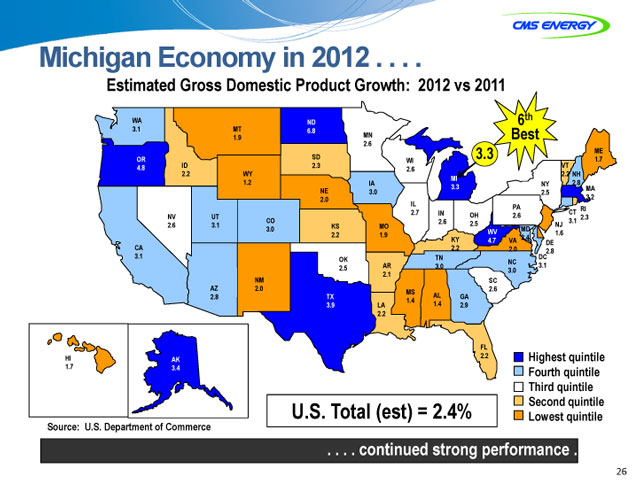
Michigan Economy in 2012 . . . .
Estimated Gross Domestic Product Growth: 2012 vs 2011
WA th
3.1 MT ND 6
6.8
19. MN Best
2.6
SD 3.3 ME
OR WI 1.7
4.8 ID 2.3 VT
2.6
2.2 WY 2.2 NH
MI
1.2 IA NY 2.8
3.3 MA
NE 3.0 2.5
2.0 IL 3.2
PA RI
2.7 IN OH CT
NV UT 2.6 2.3
CO 2.6 2.5 3.1
2.6 3.1 KS MO NJ
3.0 WV MD
2.2 1.9 1.6
KY 4.7 VA 2.4
DE
CA 2.2 2.0
2.8
3.1 TN DC
OK NC
2.5 AR 3.0 3.1
3.0
212.1
NM SC
AZ 2.0 2.6
MS AL
2.8 TX GA
1.4 1.4
3.9 LA 2.9
2.2
FL
HI 2.2 Highest quintile
AK
1.7 3.4 Fourth quintile
Third quintile
U.S. Total (est) = 2.4% Second quintile
Source: U.S. Department of Commerce Lowest quintile
. . . . continued strong
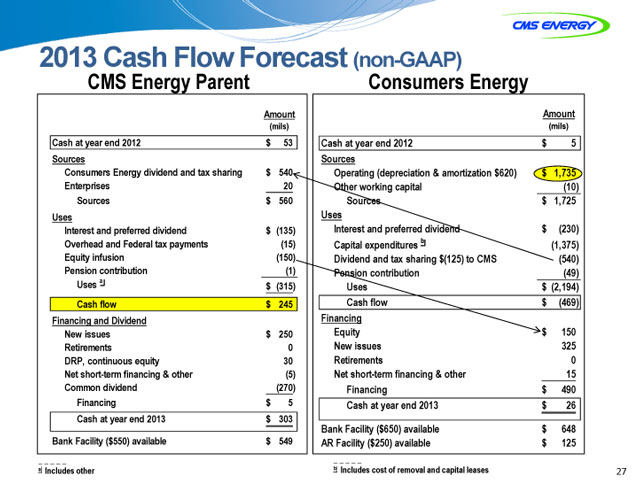
2013 Cash Flow Forecast (non-GAAP)
CMS Energy Parent Consumers Energy
Amount Amount
(mils) (mils)
Cash at year end 2012 $ 53 Cash at year end 2012 $ 5
Sources Sources
Consumers Energy dividend and tax sharing $ 540 Operating (depreciation & amortization $620) $ 1,735
Enterprises 20 Other working capital (10)
Sources $ 560 Sources $ 1,725
Uses Uses
Interest and preferred dividend $ (135) Interest and preferred dividend $ (230)
Overhead and Federal tax payments (15) Capital expenditures b (1,375)
Equity infusion (150) Dividend and tax sharing $(125) to CMS (540)
Pension contribution (1) Pension contribution (49)
Uses a $ (315) Uses $ (2,194)
Cash flow $ 245 Cash flow $ (469)
Financing and Dividend Financing
New issues $ 250 Equity $ 150
Retirements 0 New issues 325
DRP, continuous equity 30 Retirements 0
Net short-term financing & other (5) Net short-term financing & other 15
Common dividend (270) Financing $ 490
Financing $ 5 Cash at year end 2013 $ 26
Cash at year end 2013 $ 303
Bank Facility ($650) available $ 648
Bank _ Facility ($550) available $ 549 AR _ Facility _ _ _ _ ($250) available $ 125
a Includes other b Includes cost of removal and capital leases 27
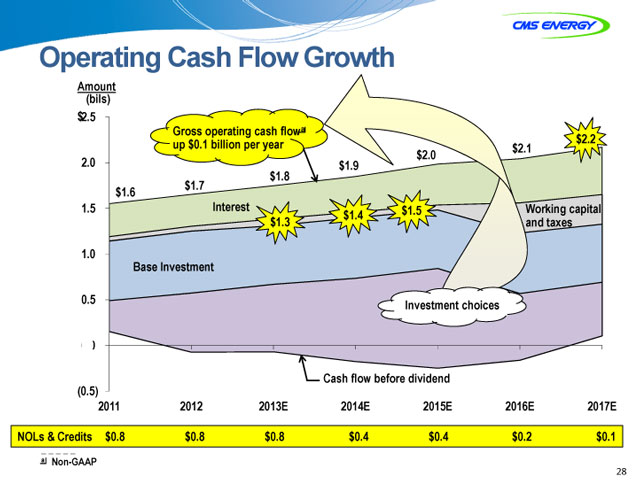
Operating Cash Flow Growth
Amount
(bils)
$2.5
Gross operating cash flowa $2.2
up $0.1 billion per year
2.0
$1.8
$1.7
$1.6
1.5 Interest $1.5 king capital
$1.4
$1.3 taxes
1.0
Base Investment
0.5 Investment choices
0
Cash flow before dividend
(0.5)
2011 2012 2013E 2014E 2015E 2016E 2017E
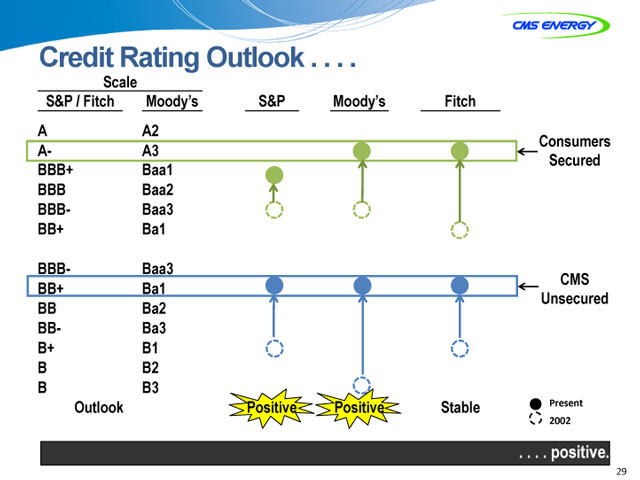
Credit Rating Outlook . . . .
Scale
S&P / Fitch Moody’s S&P Moody’s Fitch A A2
Consumers A- A3 Secured BBB+ Baa1 BBB Baa2 BBB- Baa3 BB+ Ba1
BBB- Baa3
CMS BB+ Ba1 Unsecured BB Ba2 BB- Ba3 B+ B1 B B2 B B3 Outlook Positive Positive Stable Present
2002
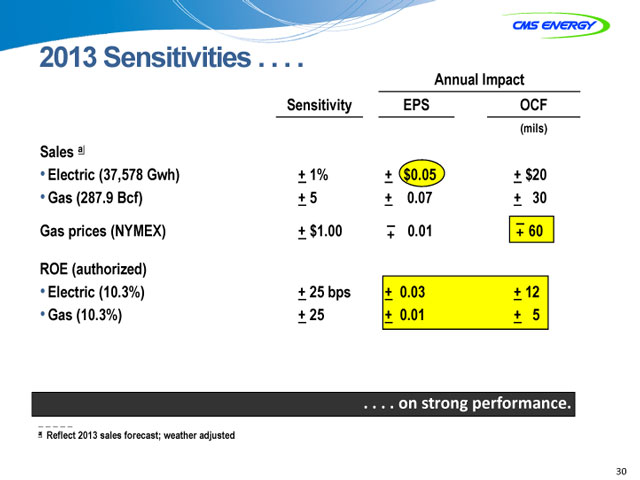
2013 Sensitivities
Annual Impact
Sensitivity EPS OCF
(mils)
Sales a
Electric (37,578 Gwh) + 1% + $0.05 + $20
Gas (287.9 Bcf) + 5 + 0.07 + 30
Gas prices (NYMEX) + $1.00 –+ 0.01 –+ 60
ROE (authorized)
Electric (10.3%) + 25 bps + 0.03 + 12
Gas (10.3%) + 25 + 0.01 + 5
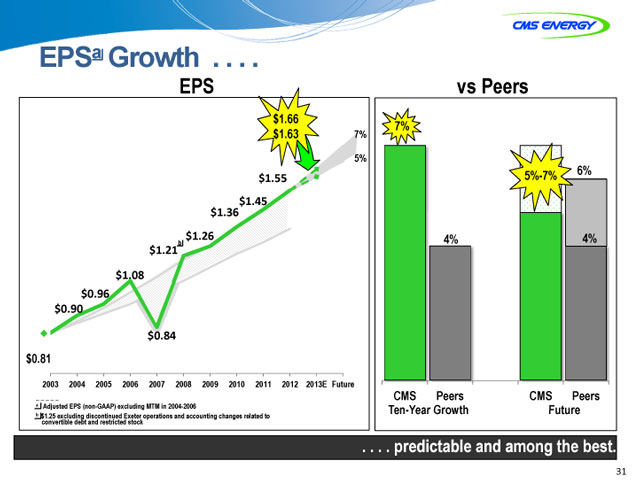
EPSa Growth . . . .
EPS vs Peers
$1.66
7%
$1.63 7%
5%
5%-7% 6%
$1.55 5%
$1.45
$1.36
$1.26 4% 4%
b
$1.21
$1.08
$0.96
$0.90
$0.84
$0.81
2003 2004 2005 2006 2007 2008 2009 2010 2011 2012 2013E Future
CMS Peers CMS Peers
a Adjusted EPS (non-GAAP) excluding MTM in 2004-2006 Ten-Year Growth Future
b $1.25 excluding discontinued Exeter operations and accounting changes related to
convertible debt and restricted stock
. . . . predictableredictable and among the best.
31
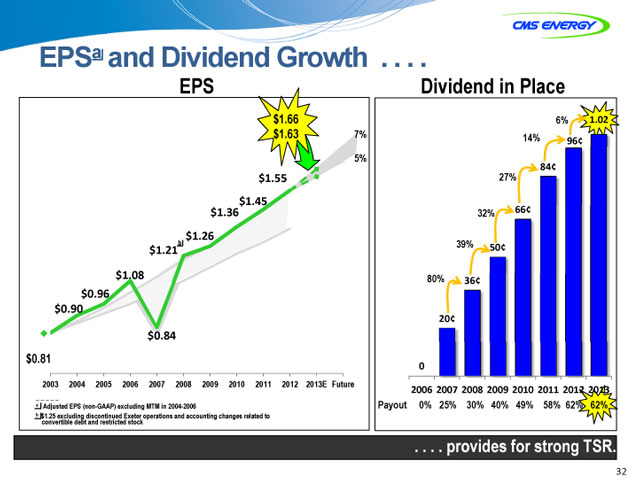
EPSa and Dividend Growth . . . .
EPS Dividend in Place
$1.66 6% 1.02 $1.63 7% 14%
96¢
5% 84¢
$1.55 27%
$1.45 66¢
$1.36 32%
$1.26 b 39%
$1.21 50¢
$1.08 80%
36¢
$0.96
$0.90
20¢
$0.84
.81
0
2003 2004 2005 2006 2007 2008 2009 2010 2011 2012 2013E Future
2006 2007 2008 2009 2010 2011 2012 2013
Adjusted EPS (non-GAAP) excluding MTM in 2004-2006 Payout 0% 25% 30% 40% 49% 58% 62% 62%
$1.25 excluding discontinued Exeter operations and accounting changes related to convertible debt and restricted stock
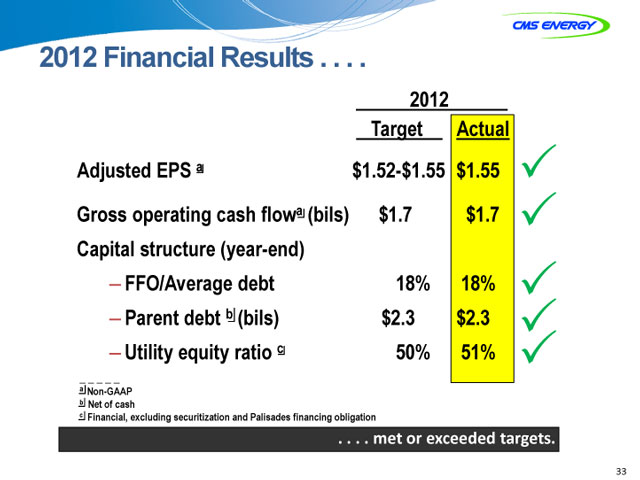
2012 Financial Results
2012
Target Actual
Adjusted EPS a $1.52-$1.55 $1.55 3
Gross operating cash flowa (bils) $1.7 $1.7 3
Capital structure (year-end)
– FFO/Average debt 18% 18%
– Parent debt b (bils) $2.3 $2.3 33
– Utility equity ratio c 50% 51% 3
a Non-GAAP
b Net of cash
c Financial, excluding securitization and Palisades financing obligation
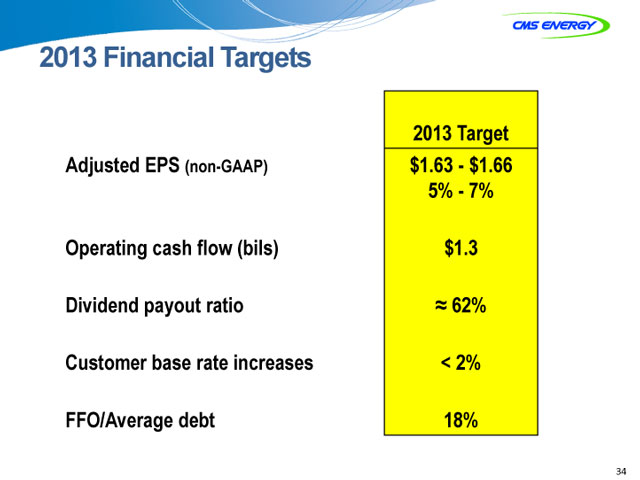
2013 Financial Targets
2013 Target
Adjusted EPS (non-GAAP) $1.63 - $1.66
5% - 7%
Operating cash flow (bils) $1.3
Dividend payout ratio ~ 62%
Customer base rate increases < 2%
FFO/Average debt 18%
Appendix
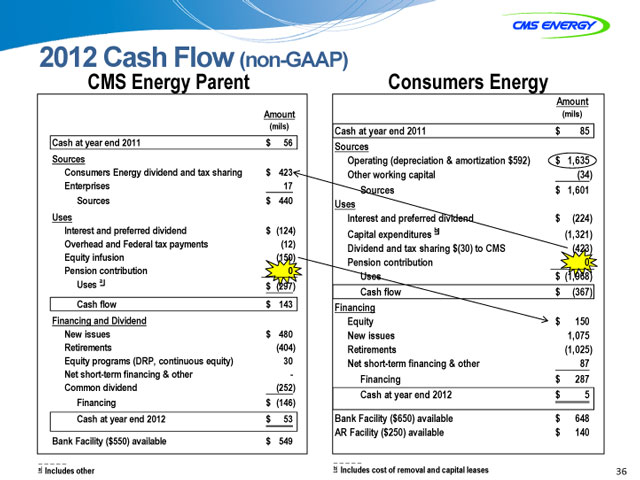
2012 Cash Flow (non-GAAP)
CMS Energy Parent Consumers Energy
Amount
Amount (mils)
(mils) Cash at year end 2011 $ 85
Cash at year end 2011 $ 56 Sources
Sources Operating (depreciation & amortization $592) $ 1,635
Consumers Energy dividend and tax sharing $ 423 Other working capital (34)
Enterprises 17 Sources $ 1,601
Sources $ 440 Uses
Uses Interest and preferred dividend $ (224)
Interest and preferred dividend $ (124) Capital expenditures b (1,321)
Overhead and Federal tax payments (12) Dividend and tax sharing $(30) to CMS (423)
Equity infusion (150) Pension contribution 0
Pension contribution 0 Uses $ (1,968)
Uses a $ (297) Cash flow $ (367)
Cash flow $ 143 Financing
Financing and Dividend Equity $ 150
New issues $ 480 New issues 1,075
Retirements (404) Retirements (1,025)
Equity programs (DRP, continuous equity) 30 Net short-term financing & other 87
Net short-term financing & other - Financing $ 287
Common dividend (252) Cash at year end 2012 $ 5
Financing $ (146)
Cash at year end 2012 $ 53 Bank Facility ($650) available $ 648
AR Facility ($250) available $ 140
Bank _ Facility ($550) available $ 549 _ _ _ _ _
a Includes other b Includes cost of removal and capital leases
GAAP Reconciliation
CMS ENERGY CORPORATION
Earnings Per Share By Year GAAP Reconciliation
(Unaudited)
| 2003 | 2004 | 2005 | 2006 | 2007 | 2008 | 2009 | 2010 | 2011 | 2012 | |||||||||||||||||||||||||||||||
| Reported earnings (loss) per share—GAAP |
$ | (0.30 | ) | $ | 0.64 | $ | (0.44 | ) | $ | (0.41 | ) | $ | (1.02 | ) | $ | 1.20 | $ | 0.91 | $ | 1.28 | $ | 1.58 | $ | 1.42 | ||||||||||||||||
|
|
|
|
|
|
|
|
|
|
|
|
|
|
|
|
|
|
|
|
|
|||||||||||||||||||||
| After-tax items: |
||||||||||||||||||||||||||||||||||||||||
| Electric and gas utility |
0.21 | (0.39 | ) | — | — | (0.07 | ) | 0.05 | 0.33 | 0.03 | 0.00 | 0.17 | ||||||||||||||||||||||||||||
| Enterprises |
0.74 | 0.62 | 0.04 | (0.02 | ) | 1.25 | (0.02 | ) | 0.09 | (0.03 | ) | (0.11 | ) | (0.01 | ) | |||||||||||||||||||||||||
| Corporate interest and other |
0.16 | (0.03 | ) | 0.04 | 0.27 | (0.32 | ) | (0.02 | ) | 0.01 | * | (0.01 | ) | * | ||||||||||||||||||||||||||
| Discontinued operations (income) loss |
(0.16 | ) | 0.02 | (0.07 | ) | (0.03 | ) | 0.40 | ( | *) | (0.08 | ) | 0.08 | (0.01 | ) | (0.03 | ) | |||||||||||||||||||||||
| Asset impairment charges, net |
— | — | 1.82 | 0.76 | 0.60 | — | — | — | — | — | ||||||||||||||||||||||||||||||
| Cumulative accounting changes |
0.16 | 0.01 | — | — | — | — | — | — | — | — | ||||||||||||||||||||||||||||||
|
|
|
|
|
|
|
|
|
|
|
|
|
|
|
|
|
|
|
|
|
|||||||||||||||||||||
| Adjusted earnings per share, including MTM—non-GAAP |
$ | 0.81 | $ | 0.87 | $ | 1.39 | $ | 0.57 | $ | 0.84 | $ | 1.21 | (a) | $ | 1.26 | $ | 1.36 | $ | 1.45 | $ | 1.55 | |||||||||||||||||||
| Mark-to-market impacts |
0.03 | (0.43 | ) | 0.51 | ||||||||||||||||||||||||||||||||||||
|
|
|
|
|
|
|
|
|
|
|
|
|
|
|
|
|
|
|
|
|
|||||||||||||||||||||
| Adjusted earnings per share, excluding MTM—non-GAAP |
NA | $ | 0.90 | $ | 0.96 | $ | 1.08 | NA | NA | NA | NA | NA | NA | |||||||||||||||||||||||||||
|
|
|
|
|
|
|
|
|
|
|
|
|
|
|
|
|
|
|
|
|
|||||||||||||||||||||
| * | Less than $500 thousand or $0.01 per share. |
| (a) | $1.25 excluding discontinued Exeter operations and accounting changes related to convertible debt and restricted stock. |
2003-12 EPS
CMS ENERGY CORPORATION
Earnings By Quarter and Year GAAP Reconciliation
(Unaudited)
| 2011 | ||||||||||||||||||||
| (In millions, except per share amounts) |
1Q | 2Q | 3Q | 4Q | YTD Dec | |||||||||||||||
| Reported net income—GAAP |
$ | 135 | $ | 100 | $ | 139 | $ | 41 | $ | 415 | ||||||||||
|
|
|
|
|
|
|
|
|
|
|
|||||||||||
| After-tax items: |
||||||||||||||||||||
| Electric and gas utility |
— | — | — | — | — | |||||||||||||||
| Enterprises |
* | (28 | ) | * | 1 | (27 | ) | |||||||||||||
| Corporate interest and other |
— | (4 | ) | — | * | (4 | ) | |||||||||||||
| Discontinued operations income |
(2 | ) | * | * | ( | *) | (2 | ) | ||||||||||||
|
|
|
|
|
|
|
|
|
|
|
|||||||||||
| Adjusted income—non-GAAP |
$ | 133 | $ | 68 | $ | 139 | $ | 42 | $ | 382 | ||||||||||
|
|
|
|
|
|
|
|
|
|
|
|||||||||||
| Average shares outstanding, basic |
250.0 | 250.3 | 251.3 | 251.7 | 250.8 | |||||||||||||||
| Average shares outstanding, diluted |
261.7 | 261.9 | 263.9 | 265.5 | 263.4 | |||||||||||||||
|
|
|
|
|
|
|
|
|
|
|
|||||||||||
| Reported earnings per share—GAAP |
$ | 0.52 | $ | 0.38 | $ | 0.53 | $ | 0.15 | $ | 1.58 | ||||||||||
|
|
|
|
|
|
|
|
|
|
|
|||||||||||
| After-tax items: |
||||||||||||||||||||
| Electric and gas utility |
— | — | — | — | — | |||||||||||||||
| Enterprises |
* | (0.11 | ) | * | * | (0.11 | ) | |||||||||||||
| Corporate interest and other |
— | (0.01 | ) | — | * | (0.01 | ) | |||||||||||||
| Discontinued operations income |
(0.01 | ) | * | * | ( | *) | (0.01 | ) | ||||||||||||
|
|
|
|
|
|
|
|
|
|
|
|||||||||||
| Adjusted earnings per share—non-GAAP |
$ | 0.51 | $ | 0.26 | $ | 0.53 | $ | 0.15 | $ | 1.45 | ||||||||||
|
|
|
|
|
|
|
|
|
|
|
|||||||||||
| 2012 | ||||||||||||||||||||
| (In millions, except per share amounts) |
1Q | 2Q | 3Q | 4Q | YTD Dec | |||||||||||||||
| Reported net income—GAAP |
$ | 67 | $ | 100 | $ | 148 | $ | 67 | $ | 382 | ||||||||||
|
|
|
|
|
|
|
|
|
|
|
|||||||||||
| After-tax items: |
||||||||||||||||||||
| Electric and gas utility |
36 | 7 | * | ( | *) | 43 | ||||||||||||||
| Enterprises |
1 | 1 | (3 | ) | ( | *) | (1 | ) | ||||||||||||
| Corporate interest and other |
— | — | — | * | * | |||||||||||||||
| Discontinued operations income |
(7 | ) | * | * | * | (7 | ) | |||||||||||||
|
|
|
|
|
|
|
|
|
|
|
|||||||||||
| Adjusted income—non-GAAP |
$ | 97 | $ | 108 | $ | 145 | $ | 67 | $ | 417 | ||||||||||
|
|
|
|
|
|
|
|
|
|
|
|||||||||||
| Average shares outstanding, basic |
255.6 | 261.2 | 262.9 | 263.0 | 260.7 | |||||||||||||||
| Average shares outstanding, diluted |
266.9 | 268.2 | 269.0 | 269.5 | 268.6 | |||||||||||||||
|
|
|
|
|
|
|
|
|
|
|
|||||||||||
| Reported earnings per share—GAAP |
$ | 0.25 | $ | 0.37 | $ | 0.55 | $ | 0.25 | $ | 1.42 | ||||||||||
|
|
|
|
|
|
|
|
|
|
|
|||||||||||
| After-tax items: |
||||||||||||||||||||
| Electric and gas utility |
0.14 | 0.03 | * | ( | *) | 0.17 | ||||||||||||||
| Enterprises |
0.01 | * | (0.01 | ) | ( | *) | (0.01 | ) | ||||||||||||
| Corporate interest and other |
— | — | — | * | * | |||||||||||||||
| Discontinued operations income |
(0.03 | ) | * | * | * | (0.03 | ) | |||||||||||||
|
|
|
|
|
|
|
|
|
|
|
|||||||||||
| Adjusted earnings per share—non-GAAP |
$ | 0.37 | $ | 0.40 | $ | 0.54 | $ | 0.25 | $ | 1.55 | ||||||||||
|
|
|
|
|
|
|
|
|
|
|
|||||||||||
Note: Year-to-date (YTD) EPS may not equal sum of quarters due to share count differences.
| * | Less than $500 thousand or $0.01 per share. |
2012 A-1
CMS Energy Corporation
Earnings Segment Results GAAP Reconciliation
(Unaudited)
| Three Months Ended | Twelve Months Ended | |||||||||||||||
| December 31 |
2012 | 2011 | 2012 | 2011 | ||||||||||||
| Electric Utility |
||||||||||||||||
| Reported |
$ | 0.10 | $ | 0.09 | $ | 1.21 | $ | 1.27 | ||||||||
| Electric Decoupling Court Order |
— | — | 0.14 | — | ||||||||||||
| Downsizing Program |
( | *) | — | 0.02 | — | |||||||||||
|
|
|
|
|
|
|
|
|
|||||||||
| Adjusted |
$ | 0.10 | $ | 0.09 | $ | 1.37 | $ | 1.27 | ||||||||
|
|
|
|
|
|
|
|
|
|||||||||
| Gas Utility |
||||||||||||||||
| Reported |
$ | 0.18 | $ | 0.16 | $ | 0.41 | $ | 0.49 | ||||||||
| Downsizing Program |
( | *) | — | 0.01 | — | |||||||||||
|
|
|
|
|
|
|
|
|
|||||||||
| Adjusted |
$ | 0.18 | $ | 0.16 | $ | 0.42 | $ | 0.49 | ||||||||
|
|
|
|
|
|
|
|
|
|||||||||
| Enterprises |
||||||||||||||||
| Reported |
$ | 0.03 | $ | (0.01 | ) | $ | 0.06 | $ | 0.13 | |||||||
| Downsizing Program |
— | — | * | — | ||||||||||||
| Tax Changes |
— | — | — | (0.11 | ) | |||||||||||
| Restructuring Costs and Other |
( | *) | * | (0.01 | ) | * | ||||||||||
|
|
|
|
|
|
|
|
|
|||||||||
| Adjusted |
$ | 0.03 | $ | (0.01 | ) | $ | 0.05 | $ | 0.02 | |||||||
|
|
|
|
|
|
|
|
|
|||||||||
| Corporate Interest and Other |
||||||||||||||||
| Reported |
$ | (0.06 | ) | $ | (0.09 | ) | $ | (0.29 | ) | $ | (0.32 | ) | ||||
| Tax Changes |
— | — | — | (0.01 | ) | |||||||||||
| Restructuring Costs and Other |
* | * | * | * | ||||||||||||
|
|
|
|
|
|
|
|
|
|||||||||
| Adjusted |
$ | (0.06 | ) | $ | (0.09 | ) | $ | (0.29 | ) | $ | (0.33 | ) | ||||
|
|
|
|
|
|
|
|
|
|||||||||
| Discontinued Operations |
||||||||||||||||
| Reported |
$ | (*) | $ | * | $ | 0.03 | $ | 0.01 | ||||||||
| Discontinued Operations Income |
* | ( | *) | (0.03 | ) | (0.01 | ) | |||||||||
|
|
|
|
|
|
|
|
|
|||||||||
| Adjusted |
$ | — | $ | — | $ | — | $ | — | ||||||||
|
|
|
|
|
|
|
|
|
|||||||||
| Totals |
||||||||||||||||
| Reported |
$ | 0.25 | $ | 0.15 | $ | 1.42 | $ | 1.58 | ||||||||
| Discontinued Operations Income |
* | ( | *) | (0.03 | ) | (0.01 | ) | |||||||||
| Electric Decoupling Court Order |
— | — | 0.14 | — | ||||||||||||
| Downsizing Program |
( | *) | — | 0.03 | — | |||||||||||
| Tax Changes |
— | — | — | (0.12 | ) | |||||||||||
| Restructuring Costs and Other |
( | *) | * | (0.01 | ) | * | ||||||||||
|
|
|
|
|
|
|
|
|
|||||||||
| Adjusted |
$ | 0.25 | $ | 0.15 | $ | 1.55 | $ | 1.45 | ||||||||
|
|
|
|
|
|
|
|
|
|||||||||
| Average Common Shares Outstanding—Diluted (in millions) |
269.5 | 265.5 | 268.6 | 263.4 | ||||||||||||
|
|
|
|
|
|
|
|
|
|||||||||
| * | Less than $0.01 per share. |
2012 A-2
Consumers Energy
2012 Cash Flow GAAP Reconciliation (in millions) (unaudited)
| Reclassifications From Sources and Uses to Statement of Cash Flows | ||||||||||||||||||||||||||||||||||||||||||
| Presentation Sources and Uses |
Tax Sharing Operating |
Interest Payments as Operating |
Premium on Early Debt Retirement As Operating |
Other Working Capital as Investing |
Capital Lease Pymts as Financing |
Securitization Debt Pymts as Financing |
Preferred Dividends as Financing |
Common Dividends as Financing |
Consolidated Statements of Cash Flows | |||||||||||||||||||||||||||||||||
| Description |
non-GAAP Amount |
GAAP Amount |
Description | |||||||||||||||||||||||||||||||||||||||
| Cash at year end 2011 |
$ | 85 | $ | — | $ | — | $ | — | $ | — | $ | — | $ | — | $ | — | $ | — | $ | 85 | Cash at year end 2011 | |||||||||||||||||||||
| Sources |
||||||||||||||||||||||||||||||||||||||||||
| Operating |
$ | 1,635 | ||||||||||||||||||||||||||||||||||||||||
| Other working capital |
(34 | ) | ||||||||||||||||||||||||||||||||||||||||
|
|
|
|
|
|
|
|
|
|
|
|
|
|
|
|
|
|
|
|
|
|||||||||||||||||||||||
| Sources |
$ | 1,601 | $ | (30 | ) | $ | (222 | ) | $ | (15 | ) | $ | (42 | ) | $ | 22 | $ | 39 | $ | — | $ | — | $ | 1,353 | Net cash provided by operating | |||||||||||||||||
| Uses |
||||||||||||||||||||||||||||||||||||||||||
| Interest and preferred dividends |
$ | (224 | ) | |||||||||||||||||||||||||||||||||||||||
| Capital |
(1,321 | ) | ||||||||||||||||||||||||||||||||||||||||
| Dividends/ |
(423 | ) | ||||||||||||||||||||||||||||||||||||||||
|
|
|
|
|
|
|
|
|
|
|
|
|
|
|
|
|
|
|
|
|
|||||||||||||||||||||||
| Uses |
$ | (1,968 | ) | $ | 30 | $ | 222 | $ | — | $ | 42 | $ | — | $ | — | $ | 2 | $ | 393 | $ | (1,279 | ) | Net cash provided by investing | |||||||||||||||||||
|
|
|
|
|
|
|
|
|
|
|
|
|
|
|
|
|
|
|
|
|
|||||||||||||||||||||||
| Cash flow |
$ | (367 | ) | $ | — | $ | — | $ | (15 | ) | $ | — | $ | 22 | $ | 39 | $ | 2 | $ | 393 | $ | 74 | Cash flow from operating and investing activities | |||||||||||||||||||
| Financing |
||||||||||||||||||||||||||||||||||||||||||
| Equity |
$ | 150 | ||||||||||||||||||||||||||||||||||||||||
| New Issues |
1,075 | |||||||||||||||||||||||||||||||||||||||||
| Retirements |
(1,025 | ) | ||||||||||||||||||||||||||||||||||||||||
| Net short-term financing & other |
87 | 15 | ||||||||||||||||||||||||||||||||||||||||
|
|
|
|
|
|
|
|
|
|
|
|
|
|
|
|
|
|
|
|
|
|||||||||||||||||||||||
| Financing |
$ | 287 | $ | — | $ | — | $ | 15 | $ | — | $ | (22 | ) | $ | (39 | ) | $ | (2 | ) | $ | (393 | ) | $ | (154 | ) | Net cash provided by financing | ||||||||||||||||
|
|
|
|
|
|
|
|
|
|
|
|
|
|
|
|
|
|
|
|
|
|||||||||||||||||||||||
| Net change |
$ | (80 | ) | $ | — | $ | — | $ | — | $ | — | $ | — | $ | — | $ | — | $ | — | $ | (80 | ) | Net change in cash | |||||||||||||||||||
|
|
|
|
|
|
|
|
|
|
|
|
|
|
|
|
|
|
|
|
|
|||||||||||||||||||||||
| Cash at year |
$ | 5 | $ | — | $ | — | $ | — | $ | — | $ | — | $ | — | $ | — | $ | — | $ | 5 | Cash at year end 2012 | |||||||||||||||||||||
|
|
|
|
|
|
|
|
|
|
|
|
|
|
|
|
|
|
|
|
|
|||||||||||||||||||||||
| a | Includes cost of removal and capital leases |
2012 A-3
CMS Energy Parent
2012 Cash Flow GAAP Reconciliation (in millions) (unaudited)
| Reclassifications From Sources and Uses to Statement of Cash Flows |
||||||||||||||||||||||||||||||
| Presentation Sources and Uses |
Interest Payments as Operating |
Overheads & Tax Payments as Operating |
Other Uses (a) as Operating |
Financing as Operating |
Cash
From Consolidated Companies |
Consolidated Statements of Cash Flows | ||||||||||||||||||||||||
| Description |
non-GAAP Amount |
GAAP Amount |
Description | |||||||||||||||||||||||||||
| Cash at year end 2011 |
$ | 56 | $ | — | $ | — | $ | — | $ | — | $ | 20 | $ | 76 | Cash at year end 2011 | |||||||||||||||
| Sources |
||||||||||||||||||||||||||||||
| Consumers Energy dividends/tax sharing |
$ | 423 | ||||||||||||||||||||||||||||
| Enterprises |
17 | |||||||||||||||||||||||||||||
|
|
|
|
|
|
|
|
|
|
|
|
|
|
|
|||||||||||||||||
| Sources |
$ | 440 | $ | (124 | ) | $ | (12 | ) | $ | 5 | $ | (35 | ) | $ | 9 | $ | 283 | Net cash provided by operating activities | ||||||||||||
| Uses |
||||||||||||||||||||||||||||||
| Interest and preferred dividends |
$ | (124 | ) | |||||||||||||||||||||||||||
| Overhead and Federal tax payments |
(12 | ) | ||||||||||||||||||||||||||||
| Equity infusions |
(150 | ) | ||||||||||||||||||||||||||||
|
|
|
|
|
|
|
|
|
|
|
|
|
|
|
|||||||||||||||||
| Uses (a) |
$ | (297 | ) | $ | 124 | $ | 12 | $ | (5) | $ | — | $ | (55 | ) | $ | (221 | ) | Net cash provided by investing activities | ||||||||||||
|
|
|
|
|
|
|
|
|
|
|
|
|
|
|
|||||||||||||||||
| Cash flow |
$ | 143 | $ | — | $ | — | $ | — | $ | (35 | ) | $ | (46 | ) | $ | 62 | Cash flow from operating and | |||||||||||||
| Financing and dividends |
||||||||||||||||||||||||||||||
| New Issues |
$ | 480 | ||||||||||||||||||||||||||||
| Retirements |
(404 | ) | ||||||||||||||||||||||||||||
| Equity programs (DRP, continuous equity) |
30 | |||||||||||||||||||||||||||||
| Net short-term financing & other |
— | |||||||||||||||||||||||||||||
| Common dividend |
(252 | ) | ||||||||||||||||||||||||||||
|
|
|
|
|
|
|
|
|
|
|
|
|
|
|
|||||||||||||||||
| Financing |
$ | (146 | ) | $ | — | $ | — | $ | — | $ | 35 | $ | 61 | $ | (50 | ) | Net cash provided by financing activities | |||||||||||||
|
|
|
|
|
|
|
|
|
|
|
|
|
|
|
|||||||||||||||||
| Net change in cash |
$ | (3 | ) | $ | — | $ | — | $ | — | $ | — | $ | 15 | $ | 12 | Net change in cash | ||||||||||||||
|
|
|
|
|
|
|
|
|
|
|
|
|
|
|
|||||||||||||||||
| Cash at year end 2012 |
$ | 53 | $ | — | $ | — | $ | — | $ | — | $ | 35 | $ | 88 | Cash at year end 2012 | |||||||||||||||
|
|
|
|
|
|
|
|
|
|
|
|
|
|
|
|||||||||||||||||
| (a) | Includes other |
2012 A-4
Consolidated CMS Energy
2012 Consolidation of Consumers Energy and CMS Energy Parent Statements of Cash Flow (in millions) (unaudited)
| Eliminations/Reclassifications to Arrive at the Consolidated Statement of Cash Flows |
||||||||||||||||||||||||||
| Statements of Cash Flows |
Consumers Common Dividend as Financing |
Consumers Preferred Dividend as Operating |
Equity Infusions to Consumers |
|||||||||||||||||||||||
| Consumers | CMS Parent | Consolidated Statements of Cash Flows | ||||||||||||||||||||||||
| Description |
Amount | Amount | Amount | Description | ||||||||||||||||||||||
| Cash at year end 2011 |
$ | 85 | $ | 76 | $ | — | $ | — | $ | — | $ | 161 | Cash at year end 2011 | |||||||||||||
| Net cash provided by operating activities |
$ | 1,353 | $ | 283 | $ | (393 | ) | $ | (2 | ) | $ | — | $ | 1,241 | Net cash provided by operating activities | |||||||||||
| Net cash provided by investing activities |
(1,279 | ) | (221 | ) | — | — | 150 | (1,350 | ) | Net cash provided by investing activities | ||||||||||||||||
|
|
|
|
|
|
|
|
|
|
|
|
|
|||||||||||||||
| Cash flow from operating and investing activities |
$ | 74 | $ | 62 | $ | (393 | ) | $ | (2 | ) | $ | 150 | $ | (109 | ) | Cash flow from operating and investing activities | ||||||||||
| Net cash provided by financing activities |
$ | (154 | ) | $ | (50 | ) | $ | 393 | $ | 2 | $ | (150 | ) | $ | 41 | Net cash provided by financing activities | ||||||||||
|
|
|
|
|
|
|
|
|
|
|
|
|
|||||||||||||||
| Net change in cash |
$ | (80 | ) | $ | 12 | $ | — | $ | — | $ | — | $ | (68 | ) | Net change in cash | |||||||||||
|
|
|
|
|
|
|
|
|
|
|
|
|
|||||||||||||||
| Cash at year end 2012 |
$ | 5 | $ | 88 | $ | — | $ | — | $ | — | $ | 93 | Cash at year end 2012 | |||||||||||||
|
|
|
|
|
|
|
|
|
|
|
|
|
|||||||||||||||
2012 A-5
CMS Energy
Reconciliation of Gross Operating Cash Flow to GAAP Operating Activities
(unaudited)
(mils)
| 2011 | 2012 | 2013 | 2014 | 2015 | 2016 | 2017 | ||||||||||||||||||||||
| Consumers Operating Income + Depreciation & Amortization |
$ | 1,527 | $ | 1,635 | $ | 1,735 | $ | 1,821 | $ | 1,948 | $ | 2,011 | $ | 2,113 | ||||||||||||||
| Enterprises Project Cash Flows |
24 | 17 | 20 | 29 | 37 | 44 | 56 | |||||||||||||||||||||
|
|
|
|
|
|
|
|
|
|
|
|
|
|
|
|||||||||||||||
| Gross Operating Cash Flow |
$ | 1,551 | $ | 1,652 | $ | 1,755 | $ | 1,850 | $ | 1,985 | $ | 2,055 | $ | 2,169 | ||||||||||||||
| Other operating activities including taxes, interest payments and working capital |
(382 | ) | (411 | ) | (405 | ) | (400 | ) | (435 | ) | (805 | ) | (819 | ) | ||||||||||||||
|
|
|
|
|
|
|
|
|
|
|
|
|
|
|
|||||||||||||||
| Net cash provided by operating activities |
$ | 1,169 | $ | 1,241 | $ | 1,350 | $ | 1,450 | $ | 1,550 | $ | 1,250 | $ | 1,350 | ||||||||||||||
|
|
|
|
|
|
|
|
|
|
|
|
|
|
|
|||||||||||||||
2011-17 OCF
CMS Energy
2012 Reconciliation of Gross Operating Cash Flow to GAAP Operating Activities
(unaudited)
(mils)
| 2012 | ||||
| Consumers Operating Income + Depreciation & Amortization |
$ | 1,635 | (a) | |
| Enterprises Project Cash Flows |
17 | |||
|
|
|
|||
| Gross Operating Cash Flow |
$ | 1,652 | ||
| Other operating activities including taxes, interest payments and working capital |
(411 | ) | ||
|
|
|
|||
| Net cash provided by operating activities |
$ | 1,241 | ||
|
|
|
|||
| (a) | Excludes impact of $59 million electric decoupling write off |
2012 OCF
Consumers Energy
2013 Forecasted Cash Flow GAAP Reconciliation (in millions) (unaudited)
| Reclassifications From Sources and Uses to Statement of Cash Flows | ||||||||||||||||||||||||||||||||||||||
| Presentation Sources and Uses |
Tax Sharing Operating |
Interest Payments as Operating |
Other Working Capital as Investing |
Capital Lease Pymts as Financing |
Securitization Debt Pymts as Financing |
Preferred Dividends as Financing |
Common Dividends as Financing |
Consolidated Statements of Cash Flows | ||||||||||||||||||||||||||||||
| non-GAAP Amount |
GAAP Amount |
|||||||||||||||||||||||||||||||||||||
| Description |
Description | |||||||||||||||||||||||||||||||||||||
| Cash at year end 2012 |
$ | 5 | $ | — | $ | — | $ | — | $ | — | $ | — | $ | — | $ | — | $ | 5 | Cash at year end 2012 | |||||||||||||||||||
| Sources |
||||||||||||||||||||||||||||||||||||||
| Operating (dep & amort $620) |
$ | 1,735 | ||||||||||||||||||||||||||||||||||||
| Other working capital |
(10 | ) | ||||||||||||||||||||||||||||||||||||
|
|
|
|
|
|
|
|
|
|
|
|
|
|
|
|
|
|
|
|||||||||||||||||||||
| Sources |
$ | 1,725 | $ | (125 | ) | $ | (228 | ) | $ | (101 | ) | $ | 28 | $ | 41 | $ | — | $ | — | $ | 1,340 | Net cash provided by operating activities | ||||||||||||||||
| Uses |
||||||||||||||||||||||||||||||||||||||
| Interest and preferred dividends |
$ | (230 | ) | |||||||||||||||||||||||||||||||||||
| Pension Contribution |
(49 | ) | ||||||||||||||||||||||||||||||||||||
| Capital expenditures a |
(1,375 | ) | ||||||||||||||||||||||||||||||||||||
| Dividends/tax sharing to CMS |
(540 | ) | ||||||||||||||||||||||||||||||||||||
|
|
|
|
|
|
|
|
|
|
|
|
|
|
|
|
|
|
|
|||||||||||||||||||||
| Uses |
$ | (2,194 | ) | $ | 125 | $ | 228 | $ | 101 | $ | — | $ | — | $ | 2 | $ | 415 | $ | (1,323 | ) | Net cash provided by investing activities | |||||||||||||||||
|
|
|
|
|
|
|
|
|
|
|
|
|
|
|
|
|
|
|
|||||||||||||||||||||
| Cash flow |
$ | (469 | ) | $ | — | $ | — | $ | — | $ | 28 | $ | 41 | $ | 2 | $ | 415 | $ | 17 | Cash flow from operating and investing activities | ||||||||||||||||||
| Financing |
||||||||||||||||||||||||||||||||||||||
| Equity |
$ | 150 | ||||||||||||||||||||||||||||||||||||
| New Issues |
325 | |||||||||||||||||||||||||||||||||||||
| Retirements |
— | |||||||||||||||||||||||||||||||||||||
| Net short-term financing & other |
15 | |||||||||||||||||||||||||||||||||||||
|
|
|
|
|
|
|
|
|
|
|
|
|
|
|
|
|
|
|
|||||||||||||||||||||
| Financing |
$ | 490 | $ | — | $ | — | $ | — | $ | (28 | ) | $ | (41 | ) | $ | (2 | ) | $ | (415 | ) | $ | 4 | Net cash provided by financing activities | |||||||||||||||
|
|
|
|
|
|
|
|
|
|
|
|
|
|
|
|
|
|
|
|||||||||||||||||||||
| Net change in cash |
$ | 21 | $ | — | $ | — | $ | — | $ | — | $ | — | $ | — | $ | — | $ | 21 | Net change in cash | |||||||||||||||||||
|
|
|
|
|
|
|
|
|
|
|
|
|
|
|
|
|
|
|
|||||||||||||||||||||
| Cash at year end 2013 |
$ | 26 | $ | — | $ | — | $ | — | $ | — | $ | — | $ | — | $ | — | $ | 26 | Cash at year end 2013 | |||||||||||||||||||
|
|
|
|
|
|
|
|
|
|
|
|
|
|
|
|
|
|
|
|||||||||||||||||||||
| a | Includes cost of removal and capital leases |
2013 B-1
CMS Energy Parent
2013 Forecasted Cash Flow GAAP Reconciliation (in millions) (unaudited)
| Reclassifications From Sources and Uses to Statement of Cash Flows | ||||||||||||||||||||||||||
| Presentation Sources and Uses |
Interest Payments as Operating |
Overheads & Tax Payments as Operating |
Other Uses (a) as Operating |
Cash From Consolidated Companies |
Consolidated Statements of Cash Flows | |||||||||||||||||||||
| non-GAAP | GAAP | |||||||||||||||||||||||||
| Description |
Amount | Amount | Description | |||||||||||||||||||||||
| Cash at year end 2012 |
$ | 53 | $ | — | $ | — | $ | — | $ | 35 | $ | 88 | Cash at year end 2012 | |||||||||||||
| Sources |
||||||||||||||||||||||||||
| Consumers Energy dividends/tax sharing |
$ | 540 | ||||||||||||||||||||||||
| Enterprises |
20 | |||||||||||||||||||||||||
|
|
|
|
|
|
|
|
|
|
|
|
|
|||||||||||||||
| Sources |
$ | 560 | $ | (135 | ) | $ | (15 | ) | $ | (6) | $ | 23 | $ | 427 | Net cash provided by operating activities | |||||||||||
| Uses |
||||||||||||||||||||||||||
| Interest and preferred dividends |
$ | (135 | ) | |||||||||||||||||||||||
| Overhead and Federal tax payments |
(15 | ) | ||||||||||||||||||||||||
| Equity infusions |
(150 | ) | ||||||||||||||||||||||||
| Pension Contribution |
(1 | ) | ||||||||||||||||||||||||
|
|
|
|
|
|
|
|
|
|
|
|
|
|||||||||||||||
| Uses (a) |
$ | (315 | ) | $ | 135 | $ | 15 | $ | 6 | $ | (86 | ) | $ | (245 | ) | Net cash provided by investing activities | ||||||||||
|
|
|
|
|
|
|
|
|
|
|
|
|
|||||||||||||||
| Cash flow |
$ | 245 | $ | — | $ | — | $ | — | $ | (63 | ) | $ | 182 | Cash flow from operating and investing activities | ||||||||||||
| Financing and dividends |
||||||||||||||||||||||||||
| New Issues |
$ | 250 | ||||||||||||||||||||||||
| Retirements |
— | |||||||||||||||||||||||||
| Equity programs (DRP, continuous equity) |
30 | |||||||||||||||||||||||||
| Net short-term financing & other |
(5 | ) | ||||||||||||||||||||||||
| Common dividend |
(270 | ) | ||||||||||||||||||||||||
|
|
|
|
|
|
|
|
|
|
|
|
|
|||||||||||||||
| Financing |
$ | 5 | $ | — | $ | — | $ | — | $ | 72 | $ | 77 | Net cash provided by financing activities | |||||||||||||
|
|
|
|
|
|
|
|
|
|
|
|
|
|||||||||||||||
| Net change in cash |
$ | 250 | $ | — | $ | — | $ | — | $ | 9 | $ | 259 | Net change in cash | |||||||||||||
|
|
|
|
|
|
|
|
|
|
|
|
|
|||||||||||||||
| Cash at year end 2013 |
$ | 303 | $ | — | $ | — | $ | — | $ | 44 | $ | 347 | Cash at year end 2013 | |||||||||||||
|
|
|
|
|
|
|
|
|
|
|
|
|
|||||||||||||||
| (a) | Includes other |
2013 B-2
Consolidated CMS Energy
2013 Forecasted Consolidation of Consumers Energy and CMS Energy Parent Statements of Cash Flow (in millions) (unaudited)
| Eliminations/Reclassifications to Arrive at the Consolidated Statement of Cash Flows |
||||||||||||||||||||||||||
| Statements of Cash Flows |
Consumers Common Dividend as Financing |
Consumers Preferred Dividend as Operating |
Equity Infusions to Consumers |
|||||||||||||||||||||||
| Consumers Amount |
CMS Parent Amount |
Consolidated Statements of Cash Flows | ||||||||||||||||||||||||
| Description |
Amount | Description | ||||||||||||||||||||||||
| Cash at year end 2012 |
$ | 5 | $ | 88 | $ | — | $ | — | $ | — | $ | 93 | Cash at year end 2012 | |||||||||||||
| Net cash provided by operating activities |
$ | 1,340 | $ | 427 | $ | (415 | ) | $ | (2 | ) | $ | — | $ | 1,350 | Net cash provided by operating activities | |||||||||||
| Net cash provided by investing activities |
(1,323 | ) | (245 | ) | — | — | 150 | (1,418 | ) | Net cash provided by investing activities | ||||||||||||||||
|
|
|
|
|
|
|
|
|
|
|
|
|
|||||||||||||||
| Cash flow from operating and investing activities |
$ | 17 | $ | 182 | $ | (415 | ) | $ | (2 | ) | $ | 150 | $ | (68 | ) | Cash flow from operating and investing activities | ||||||||||
| Net cash provided by financing activities |
$ | 4 | $ | 77 | $ | 415 | $ | 2 | $ | (150 | ) | $ | 348 | Net cash provided by financing activities | ||||||||||||
|
|
|
|
|
|
|
|
|
|
|
|
|
|||||||||||||||
| Net change in cash |
$ | 21 | $ | 259 | $ | — | $ | — | $ | — | $ | 280 | Net change in cash | |||||||||||||
|
|
|
|
|
|
|
|
|
|
|
|
|
|||||||||||||||
| Cash at year end 2013 |
$ | 26 | $ | 347 | $ | — | $ | — | $ | — | $ | 373 | Cash at year end 2013 | |||||||||||||
|
|
|
|
|
|
|
|
|
|
|
|
|
|||||||||||||||
2013 B-3