Attached files
| file | filename |
|---|---|
| 8-K - 8-K - Triangle Petroleum Corp | a13-5606_18k.htm |
Exhibit 99.1
|
|
CORPORATE PRESENTATION February 2013 |

|
|
FORWARD LOOKING STATEMENT Certain statements in this press release regarding strategic plans, expectations and objectives for future operations or results are "forward-looking statements" as defined by the Securities Litigation Reform Act of 1995. All statements, other than statements of historical facts, included in this press release that address activities, events or developments that the Company expects, believes or anticipates will or may occur in the future are forward-looking statements. These forward-looking statements are not guarantees of future performance and are subject to risks and uncertainties that could cause actual results to differ materially from the results contemplated by the forward-looking statements, including the risks discussed in the Company's annual report on Form 10-K and the Company's other filings with the Securities and Exchange Commission. Factors that could cause differences include, but are not limited to, history of losses; speculative nature of oil and natural gas exploration; changes in estimates of proved reserves; substantial capital requirements and inability to access additional capital; reductions in the borrowing base under the Company's credit facility; reallocations or reductions in the fiscal 2014 capital budget; inability to meet the drilling schedule; changes in tax regulations applicable to the oil and natural gas industry; results of acquisitions; relationships with partners and service providers; inability to acquire additional leasehold interests or other oil and natural gas properties; defects in title to the Company's oil and natural gas interests; inability to manage growth in the Company's businesses, including RockPile Energy Services and Caliber Midstream; changes in the Company’s executive management team; inability to control properties that the Company does not operate; lack of diversification; competition in the oil and natural gas industry; global financial conditions; oil and natural gas realized prices; future production and development costs; inability to market and distribute oil and natural gas produced; inability to meet financial and production guidance; inability to close the anticipated RockPile Energy Services credit facility; cancellation of expected RockPile Energy Services completion jobs by third-party operators; lack of funding or operations delays for RockPile Energy Services’ second pressure pumping spread or cased hole wireline services; delays or complications in Caliber Midstream’s construction operations; Caliber Midstream’s inability to secure third party contracts; seasonal weather conditions; government regulation of the oil and natural gas industry, including potential regulations affecting hydraulic fracturing and environmental regulations such as climate change regulations; aboriginal claims; uninsured or underinsured risks; the effect of the Company’s commodity derivative instruments and hedging program; and a material weakness in internal accounting controls. The forward-looking statements in this press release are made as of the date of this press release, even if subsequently made available by the Company on its website or otherwise. The Company does not undertake any obligation to update the forward-looking statements as a result of new information, future events or otherwise. |
|
|
TABLE OF CONTENTS Triangle Highlights Operated Program Vertical Integration Financial Overview Investment Highlights 4 7 11 14 18 Appendix 20 |
|
|
TRIANGLE HIGHLIGHTS |

|
|
TRIANGLE HIGHLIGHTS TRIANGLE PETROLEUM CORPORATION 5 |
|
|
TRIANGLE HIGHLIGHTS ACREAGE POSITION 6 Source: Triangle Petroleum Corporation and North Dakota Industrial Commission, 2013. (1) Operated assumes 30% or greater working interest. (2) Based on 4 Bakken/2Three Forks wells per unit. (3) Station Prospect is an exploratory area. DETAILS MCKENZIE COUNTY WILLIAMS COUNTY/OTHER CORE STATION PROSPECT (3) NET ACREAGE ~22,000 ~14,000 ~50,000 PERCENT OPERATED (%) (1) 50% 64% 70% BAKKEN DRILLING LOCATIONS (2) 76 56 236 THREE FORKS DRILLING LOCATIONS (2) 38 28 118 Station Prospect Core Operating Area Nesson Anticline 6 |

|
|
OPERATED PROGRAM |

|
|
McKenzie AFE ($mm) Min $11.4 Max $12.3 Average $11.9 OPERATED PROGRAM MCKENZIE COUNTY – CORE AREA 8 Source: Triangle Petroleum Corporation and North Dakota Industrial Commission, 2013. 16 DETAILS ~22,000 net acres; 50% operated Completion: Plug and perf, 100% ceramic Drilling Inventory: 114 operated locations Currently operating 2 drilling rigs 46 permits approved or submitted KEY HIGHLIGHTS 12 gross operated wells producing, 2 wells flowing back and 2 wells waiting on completion Artificial lift conversion from gas lift to rod pump complete |

|
|
OPERATED PROGRAM WILLIAMS COUNTY / OTHER CORE – CORE AREA 9 Source: Triangle Petroleum Corporation and North Dakota Industrial Commission, 2013. 16 DETAILS ~14,000 net acres; 64% operated Completion: plug and perf, 25% ceramic Drilling Inventory: 84 operated locations 21 permits approved or submitted KEY HIGHLIGHTS 4 gross operated wells producing Performance of initial wells similar to McKenzie County results Williams AFE ($mm) Min $8.9 Max $10.2 Average $9.6 |

|
|
OPERATED PROGRAM MONTANA – STATION PROSPECT 10 Source: Triangle Petroleum Corporation and Montana Board of Oil and Gas, 2013. 16 DETAILS ~50,000 net acres; 70% operated Potential Drilling Inventory: 354 operated locations KEY HIGHLIGHTS Industry activity continues to escalate in offsetting townships Exploration programs by Apache and Southwestern Energy Long-term leasehold allows a “wait-and-see” approach Asset provides substantial exploration upside Apache |
|
|
VERTICAL INTEGRATION |

|
|
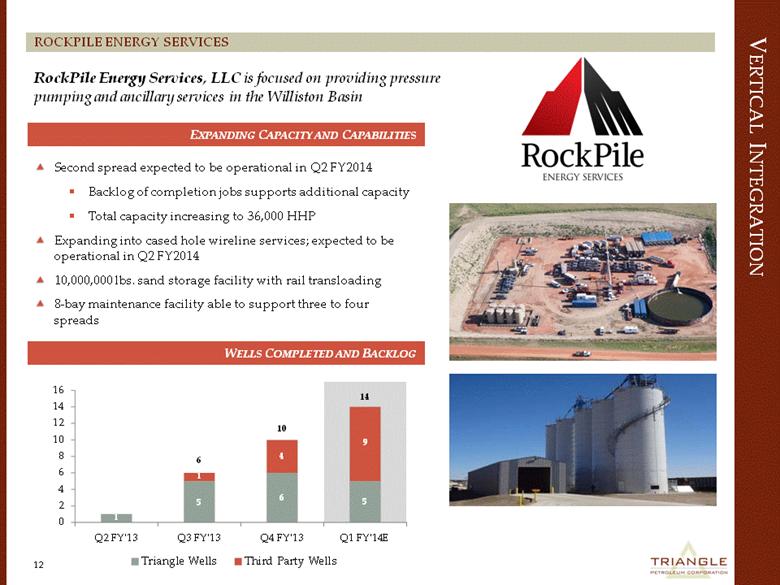
VERTICAL INTEGRATION 12 ROCKPILE ENERGY SERVICES RockPile Energy Services, LLC is focused on providing pressure pumping and ancillary services in the Williston Basin Second spread expected to be operational in Q2 FY2014 Backlog of completion jobs supports additional capacity Total capacity increasing to 36,000 HHP Expanding into cased hole wireline services; expected to be operational in Q2 FY2014 10,000,000 lbs. sand storage facility with rail transloading 8-bay maintenance facility able to support three to four spreads EXPANDING CAPACITY AND CAPABILITIES WELLS COMPLETED AND BACKLOG 9 14 10 6 1 5 6 5 1 4 0 2 4 6 8 10 12 14 16 Q2 FY'13 Q3 FY'13 Q4 FY'13 Q1 FY'14E Triangle Wells Third Party Wells |
|
|
MULTIPLE DELIVERY AND RECEIPT POINTS VERTICAL INTEGRATION 13 CALIBER MIDSTREAM Source: Triangle Petroleum Corporation and North Dakota Industrial Commission, 2013. MULTIPLE OPTIONS FOR OIL, INCLUDING PIPE AND RAIL GAS GOES TO MIDWEST MARKETS, INCLUDING CHICAGO STRATEGIC OBJECTIVE Get pipe into the ground and trucks off pads Offer Bakken operators gathering & processing capabilities at market or better rates Facilitate operational efficiencies for producers Provide gas and NGL production monetization option Salt water disposal facility operational Fresh water pipeline system operational Crude oil processing operational in Q2 fiscal 2014 Gas processing operational Q3 fiscal 2014 TIMING |

|
|
FINANCIAL OVERVIEW |

|
|
FINANCIAL OVERVIEW 15 Note: Dollars in U.S. millions, except per share data. 1) $120mm convertible note with a 5% cashless coupon per annum convertible into Triangle stock at $8.00 per share 2) Hedge details in Appendix CURRENT POSITION CURRENT POSITION LIQUIDITY PROFILE FULLY DILUTED OWNERSHIP Heavily aligned Officers and Directors Total Cash (period ended Q4 FY'13) $32.0 Revolver Availability $75.0 Total Liquidity $107.0 (period ended Q4 FY'13) Share Price (as of February 19, 2013) $7.07 90-day % Change 24.5% Shares Outstanding 46.8 Market Capitalization $330.9 Total Debt (period ended Q4 FY '13) (1) $148.0 Total Cash (period ended Q4 FY '13) $32.0 Total Enterprise Value $446.9 Total Acreage 86,000 TEV / Acres $5,196 Current Commitments: - RockPile contractural obligations - Caliber contractual obligations - Two full-time rigs (Extreme and Precision) Hedge Position: - Approximately 1,600 Bopd hedged in CY2013 - Weighted average collar of $86.94 to $102.15 |
|
|
Program consists of 2 full-time rigs Drill 23 gross operated wells Complete 24 gross operated wells Complete approximately 13 net total wells Capital Expenses Capex Budget ($mm) TUSA 2-Rig Operated Drilling Program $128 TUSA Non-Operated Drilling Program $27 TUSA Land Spend $6 Infrastructure $15 RockPile $5 Variance (5%) $9 Total $190 FINANCIAL OVERVIEW 16 FY’14 CAPITAL BUDGET Note: Budget Detail and Budget Allocation based on Management estimates and assumptions as of December 11, 2012. All forward looking information subject to a number of assumptions and uncertainties. They are not a guarantee of future performance. BUDGET DETAIL BUDGET ALLOCATION ($190MM) PROJECTED FY’14 DRILLING ACTIVITY $128 $27 $6 $15 $5 $9 2-Rig Operated Drilling Program Non-Operated Drilling Program TUSA Land Spend Infrastructure RockPile Variance (5%) |
|
|
FINANCIAL OVERVIEW FINANCIAL AND PRODUCTION GUIDANCE 17 TRIANGLE USA (E&P) Guidance Low Case Guidance High Case ROCKPILE ENERGY SERVICES 4,100 4,600 FY 2014 Avg. Daily Production* 3,400 – 3,600 Boepd CALIBER MIDSTREAM Revenue1 ($ million) EBITDA2 ($ million) Q4 (Nov’13 – Jan’14) $27 - $30 $17 - $20 Q4 Ann. $108 - $120 $68 - $80 Fiscal 2014 $95 - $105 $60 - $70 Revenue1 ($ million) EBITDA2 ($ million) Q4 (Nov’13 – Jan’14) $51 - $57 $10 - $12 Q4 Ann. $204 - $228 $40 - $48 Fiscal 2014 $168 - $185 $32 - $39 Revenue1 ($ million) EBITDA2 ($ million) Q4 (Nov’13 – Jan’14) $2.0 - $2.5 $1.5 - $2.0 Q4 Ann. $8.0 - $10.0 $6.0 - $8.0 Fiscal 2014 $5.8 - $6.5 $4.1 - $4.7 *Sold production volumes *Guidance based on realized oil price of $80.00 per barrel, at least 160 rigs operating in the Bakken, and stable commodity input prices (e.g. guar, proppant) *Footnotes (1) and (2) are located at the back of the Appendix Actual Production |
|
|
INVESTMENT HIGHLIGHTS |

|
|
INVESTMENT HIGHLIGHTS TRIANGLE PETROLEUM – INVESTMENT HIGHLIGHTS 19 Single-basin strategy with a scalable position Balanced portfolio of low-risk development opportunities and exploration upside Vertical integration facilitating low-cost strategy Experienced operations team assembled from leading independent oil companies Strong balance sheet and risk management program Substantial production and reserve growth in the near-term |
|
|
APPENDIX |

|
|
APPENDIX SUM-OF-THE-PARTS ANALYSIS 21 1. Based on recent M&A transactions in the Williston Basin 2. Assumes 6 wells per DSU; drilled approx. 11 net operated wells to-date 3. Assumes 6 wells per DSU; drilled approx. 8 net non-operated wells to-date 4. See valuation metrics in appendix 5. See “Use of Segment Information and Non-GAAP Measures” in the Appendix ROCKPILE ENERGY SERVICES Q4 FY’14 Estimated Production: 4,000 Boepd $80,000 per flowing barrel1 = $320 million Undeveloped core operated acres: 16,000 $7,000 per acre1,2 = $110 million Undeveloped core non-operated acres: 14,400 $3,000 per acre1,3 = $40 million Station Prospect (MT) acres: 50,000 Cost-basis = $20 million Net debt (as of January 31, 2013) $148 million debt & $32 million cash = $116 million CALIBER MIDSTREAM Q4 FY2014 annualized EBITDA of $7 million5 net to Triangle’s 30% ownership Peer group EV/EBITDA range of 6.8x – 15.6x 10.9x midpoint TRIANGLE USA (E&P) Q4 FY2014 annualized EBITDA of $44 million5 Peer group EV/EBITDA range of 4.0x – 6.7x 5.1x midpoint Implied Value of $375 million, or $8.00 per share Implied Value of $224 million, or $4.80 per share Implied Value of $76 million, or $1.60 per share Triangle Petroleum consolidated value of approximately $675 million, or $14.40 per share |
|
|
APPENDIX 22 ROCKPILE ENERGY SERVICES IMPLIED VALUATION Peer Group: BAS, CDI-T, CFW-T, CJES, ESI-T, FES, HP, KEG, NBR, NR, PDS, PES, PTEN, RES, SPN, SVY-T, TDG-T, WRG-V, XDC-T Source: Bloomberg 1. See “Use of Segment Information and Non-GAAP Measures” in the Appendix RockPile Energy Services Q4 FY2014 annualized EBITDA of approximately $44.0mm1 Peer group 2013E EV/EBITDA range of 4.0x to 6.7x with an average 5.1x Valuation implies $3.74 to $6.29 per share for Triangle Petroleum shareholders OILFIELD SERVICE PEER GROUP 2013(E) EV/EBITDA EV/EBITDA MULTIPLE VALUATION 4.0x 4.0x 4.1x 4.2x 4.2x 4.5x 4.7x 4.7x 5.1x 5.1x 5.2x 5.2x 5.2x 5.3x 5.4x 5.6x 5.9x 6.0x 6.6x 6.7x .0x 1.0x 2.0x 3.0x 4.0x 5.0x 6.0x 7.0x 8.0x Low Case Average Case High Case Peer EV/EBITDA 4.0x 5.1x 6.7x RPES Valuation $175mm $223mm $295mm TPC per Share $3.74 $4.76 $6.29 |
|
|
APPENDIX 23 CALIBER MIDSTREAM IMPLIED VALUATION Peer Group: ACMP, AMID, APL, BKEP, CMLP, CPNO, DPM, HEP, MMLP, MWE, NGLS, RGP, RRMS, SMLP, SXE, TCP, TLLP, TLP, WES, XTEX Source: Bloomberg See “Use of Segment Information and Non-GAAP Measures” in the Appendix Caliber Midstream Q4 FY2014 annualized EBITDA of $24 million1, or $7 million net to Triangle’s ownership Peer group 2013E EV/EBITDA range of 6.8x to 15.6x with an average 10.9x Valuation implies $1.05 to $2.41 per share for Triangle Petroleum shareholders Potentially additional value from Trigger Units and Cashless Warrants package MIDSTREAM MLP PEER GROUP 2013(E) EV/EBITDA EV/EBITDA MULTIPLE VALUATION 6.8x 8.8x 8.9x 9.3x 9.3x 9.3x 9.4x 9.4x 9.6x 10.2x 10.9x 10.9x 11.1x 11.8x 12.1x 12.2x 12.9x 13.2x 13.8x 14.1x 15.6x .0x 2.0x 4.0x 6.0x 8.0x 10.0x 12.0x 14.0x 16.0x 18.0x Low Case Average Case High Case EV/EBITDA 6.8x 10.9x 15.6x Caliber Valuation $164mm $262mm $375mm TPC Interest $49mm $78mm $112mm TPC per Share $1.05 $1.68 $2.41 |
|
|
APPENDIX 24 RISK MANAGEMENT TRIANGLE STANDARD HEDGING PROGRAM Approximately 1,600 barrels of oil per day hedged for calendar year 2013 Weighted average collar of $86.94 to $102.15 Growing hedge program as PDP reserves and production increase; quarterly redeterminations TRIANGLE-CALIBER PUT HEDGING PROGRAM Caliber volume commitment liability greatest in early development years Growing production decreases the decreasing liability Hedge Period Volume (Bopd) Days Total Volumes Floor Avg. Ceiling Calendar-month-average swap zero cost collar Cal ’13 500 365 182,500 $85.00 $104.30 Calendar-month-average swap zero cost collar Cal ’13 500 365 182,500 $85.00 $100.50 Calendar-month-average swap zero cost collar Feb-Mar’13 500 59 29,500 $90.00 $100.00 Calendar-month-average swap zero cost collar Feb-Dec ‘13 250 334 83,500 $90.00 $101.50 Calendar-month-average swap zero cost collar Feb-Jun’13 250 150 37,500 $90.00 $102.50 Calendar-month-average swap zero cost collar Feb-Sep’13 250 242 60,500 $90.00 $102.50 Calendar-month-average swap zero cost collar Cal ’14 500 365 182,500 $80.00 $101.20 Calendar-month-average swap zero cost collar Cal ’14 250 365 91,250 $85.00 $99.50 Total 820,250 Hedge Expiry Date Approx. Days Remain Volume Strike Outright bullet puts 6/17/2013 123 400,000 $75.00 Outright bullet puts 12/16/2013 304 500,000 $75.00 Total 900,000 |
|
|
FORWARD LOOKING STATEMENT Use of Segment Information and Non-GAAP Measures The Company projects revenue ranges for each of Triangle’s three segments of operation in fiscal year 2014. Revenues for each segment are disclosed in notes to the financial statements contained in the Company’s Form 10-K and Form 10-Q filings, but the sum of those unconsolidated revenues differs from Triangle’s consolidated revenues for the corresponding reporting period. The projected Caliber revenues in the Tables represent 30% of the Caliber partnership’s revenues because Triangle currently owns 30% of the partnership. Triangle’s consolidated revenues would reflect segment revenues reduced for intracompany sales (i.e. for RockPile services to Triangle’s E&P segment) and would reflect Triangle’s equity share of Caliber income (loss) rather than a 30% share of the Caliber partnership’s revenues. Triangle has presented ranges of anticipated revenue by segment because Triangle regularly reviews segment revenue as a measure of each segment’s operating performance. Triangle also believes that unconsolidated segment revenue assists investors in measuring RockPile’s performance as a stand-alone company without eliminating, on a consolidated basis, certain revenues attributable to completion services for Triangle’s economic interests in new wells operated by Triangle. EBITDA represents income before interest expense, income taxes, depreciation and amortization. EBITDA is not a calculation based upon generally accepted accounting principles in the U.S. ("GAAP"). Triangle has presented ranges of anticipated EBITDA, by segment, because it regularly reviews EBITDA by segment as a measure of the segment’s operating performance. Triangle also believes EBITDA assists investors in comparing segment performance on a consistent basis without regard to interest expense, income taxes, depreciation and amortization, which can vary significantly depending upon many factors. Most of Triangle’s consolidated interest expense relates to debt of the consolidated parent. The total of EBITDA by segment is not indicative of Triangle’s consolidated EBITDA, which reflects other matters such as (i) additional parent administrative costs, (ii) the aforementioned intracompany eliminations, and (iii) the use of the equity method, rather than consolidation, for Triangle’s investment in Caliber. The EBITDA measures presented in the Tables may not always be comparable to similarly titled measures reported by other companies due to differences in the components of the calculation. We believe that net income before income taxes is the performance measure calculated and presented in accordance with GAAP that is most directly comparable to EBITDA. Net income before income taxes in fiscal 2014 will be significantly affected by consolidated interest expense and full-cost pool amortization. Such amortization varies with changes in proved reserves, well costs during the year, and future plans in developing proved undeveloped reserves. |