Attached files
| file | filename |
|---|---|
| 8-K - CURRENT REPORT OF MATERIAL EVENTS OR CORPORATE CHANGES - NetSpend Holdings, Inc. | a13-5604_18k.htm |
| EX-99.2 - EX-99.2 - NetSpend Holdings, Inc. | a13-5604_1ex99d2.htm |
Exhibit 99.1
|
|
TSYS to Acquire NetSpend February 19, 2013 © 2013 Total System Services, Inc.® All rights reserved worldwide. |
|
|
Disclosure Cautionary Statement Regarding Forward-Looking Statements This presentation contains statements that constitute "forward-looking statements" within the meaning of the federal securities laws. These forward-looking statements include, among others, statements about the benefits of the proposed acquisition, including the expected impact on TSYS' revenue and earnings, the expected growth rate of the prepaid card industry, including payroll cards, and the expected timing for closing the acquisition. These statements are based on the current beliefs and expectations of TSYS' and NetSpend's management, as applicable, and are subject to known and unknown risks and uncertainties. Actual results may differ materially from those contemplated by the forward-looking statements. A number of important factors could cause actual results to differ materially from those contemplated by the forward-looking statements, including, but not limited to our ability to achieve expected synergies and successfully complete the integration of NetSpend, events that could give rise to a termination of the merger agreement or failure to receive necessary approvals or financing for the acquisition, the outcome of any litigation related to the transaction, and the level of expenses and other charges related to the acquisition and related financing transactions. For further information regarding the risks associated with TSYS' and NetSpend's businesses, please refer to the respective filings with the SEC and the proxy statement and other materials that will be filed with the SEC by NetSpend in connection with the transaction. There can be no assurance that the transaction will be completed, or if it is completed, that it will close within the anticipated time period or that the expected benefits of the transaction will be realized. We believe these forward-looking statements are reasonable; however, undue reliance should not be placed on any forward-looking statements, which are based on current expectations. We do not assume any obligation to update any forward-looking statements as a result of new information, future developments or otherwise. Additional Information and Where to Find It In connection with the transaction, NetSpend will file a proxy statement and other materials with the SEC. INVESTORS AND SECURITY HOLDERS ARE ADVISED TO READ THE PROXY STATEMENT AND OTHER RELEVANT MATERIALS WHEN THEY BECOME AVAILABLE BECAUSE THEY WILL CONTAIN IMPORTANT INFORMATION ABOUT NETSPEND AND THE TRANSACTION. Investors and security holders may obtain free copies of these documents (when they are available) and other documents filed with the SEC at the SEC’s web site at www.sec.gov. In addition, the documents filed by NetSpend with the SEC may be obtained free of charge by contacting NetSpend at Chief Financial Officer, Attn: Investor Relations, NetSpend Corporation, 701 Brazos Street, Austin, TX 78701. NetSpend’s filings with the SEC are also available on its website at www.netspend.com. Participants in the Solicitation NetSpend and its officers and directors and TSYS and its officers and directors may be deemed to be participants in the solicitation of proxies from NetSpend stockholders with respect to the transaction. Information about NetSpend’s officers and directors and their ownership of NetSpend common shares is set forth in the proxy statement for NetSpend’s 2012 Annual Meeting of Stockholders, which was filed with the SEC on March 30, 2012. Information about TSYS’ officers and directors is set forth in the proxy statement for TSYS’ 2012 Annual Meeting of Shareholders, which was filed with the SEC on March 15, 2012. Investors and security holders may obtain more detailed information regarding the direct and indirect interests of the participants in the solicitation of proxies in connection with the transaction by reading the preliminary and definitive proxy statements regarding the transaction, which will be filed by NetSpend with the SEC. Non-GAAP Financial Measures Throughout this presentation, we reference certain non-GAAP financial measures, including revenues before reimbursable items, EBITDA, Adjusted EBITDA, and combined EBITDA. Please refer to the Appendix to this presentation for a discussion of these non-GAAP financial measures as well as a reconciliation of those measures to the most directly comparable financial measure required by or presented in accordance with U.S. GAAP. This presentation also references certain combined financial measures which do not reflect any adjustments resulting from the proposed transaction and do not represent a “pro forma” amount determined in accordance with the SEC’s rules and regulations, including Article 11 of Regulation S-X. 2 © 2013 Total System Services, Inc.® All rights reserved worldwide. |
|
|
Agenda Introduction Philip W. Tomlinson, Chairman of the Board and Chief Executive Officer, TSYS Transaction Overview and Strategic Rationale M. Troy Woods, President and Chief Operating Officer, TSYS NetSpend Overview Dan Henry, Chief Executive Officer, NetSpend 3 © 2013 Total System Services, Inc.® All rights reserved worldwide. |
|
|
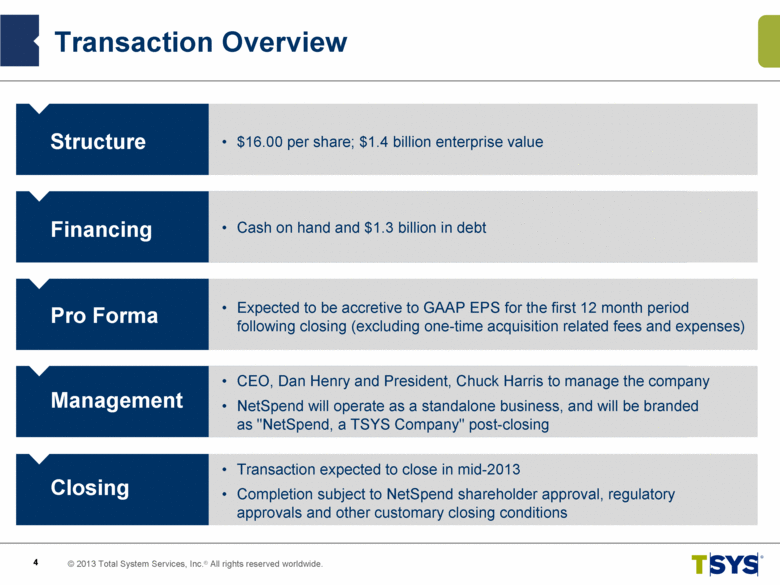
Transaction Overview Structure $16.00 per share; $1.4 billion enterprise value Cash on hand and $1.3 billion in debt Financing Expected to be accretive to GAAP EPS for the first 12 month period following closing (excluding one-time acquisition related fees and expenses) Pro Forma Management CEO, Dan Henry and President, Chuck Harris to manage the company NetSpend will operate as a standalone business, and will be branded as "NetSpend, a TSYS Company" post-closing Transaction expected to close in mid-2013 Completion subject to NetSpend shareholder approval, regulatory approvals and other customary closing conditions Closing 4 © 2013 Total System Services, Inc.® All rights reserved worldwide. |
|
|
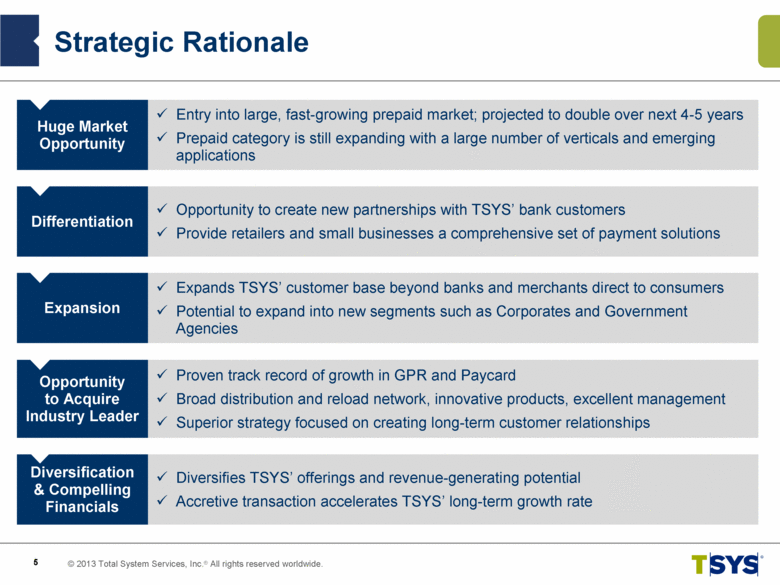
Strategic Rationale Huge Market Opportunity Entry into large, fast-growing prepaid market; projected to double over next 4-5 years Prepaid category is still expanding with a large number of verticals and emerging applications 5 Diversification & Compelling Financials Diversifies TSYS’ offerings and revenue-generating potential Accretive transaction accelerates TSYS’ long-term growth rate Differentiation Opportunity to create new partnerships with TSYS’ bank customers Provide retailers and small businesses a comprehensive set of payment solutions Expansion Expands TSYS’ customer base beyond banks and merchants direct to consumers Potential to expand into new segments such as Corporates and Government Agencies Opportunity to Acquire Industry Leader Proven track record of growth in GPR and Paycard Broad distribution and reload network, innovative products, excellent management Superior strategy focused on creating long-term customer relationships © 2013 Total System Services, Inc.® All rights reserved worldwide. |
|
|
© 2013 Total System Services, Inc.® All rights reserved worldwide. Huge Market Opportunity *Source: First Annapolis Consulting Industry spend on processing Expands TSYS’ Addressable Market Exponentially Large Addressable Market (U.S.)* $4 billion annual revenue opportunity for Prepaid Program Managers/Issuers Provides Access to a Large, High-Growth Market Opportunity Spending on Open-Loop Prepaid* GDV projected to grow at 20% CAGR from 2012 to 2016 ($ billions) 20% 6 $4 Billion (total pie) $0.4B to $0.5B |

|
|
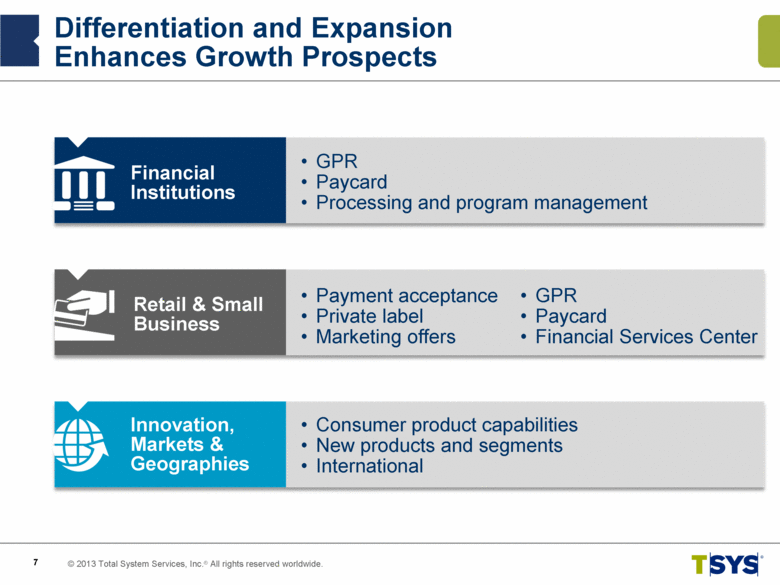
© 2013 Total System Services, Inc.® All rights reserved worldwide. Financial Institutions GPR Paycard Processing and program management Retail & Small Business Payment acceptance Private label Marketing offers Innovation, Markets & Geographies Consumer product capabilities New products and segments International 7 GPR Paycard Financial Services Center Differentiation and Expansion Enhances Growth Prospects |
|
|
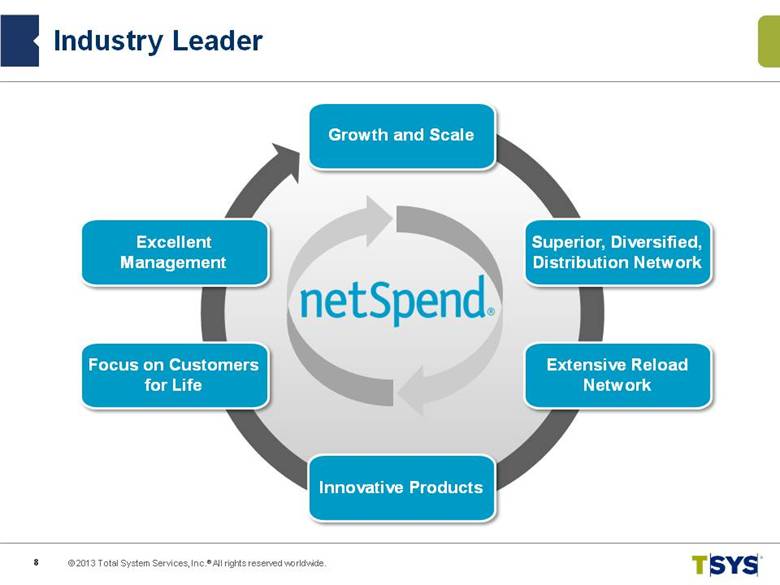
© 2013 Total System Services, Inc.® All rights reserved worldwide. Industry Leader Growth and Scale Innovative Products Focus on Customers for Life Excellent Management Extensive Reload Network Superior, Diversified, Distribution Network 8 |
|
|
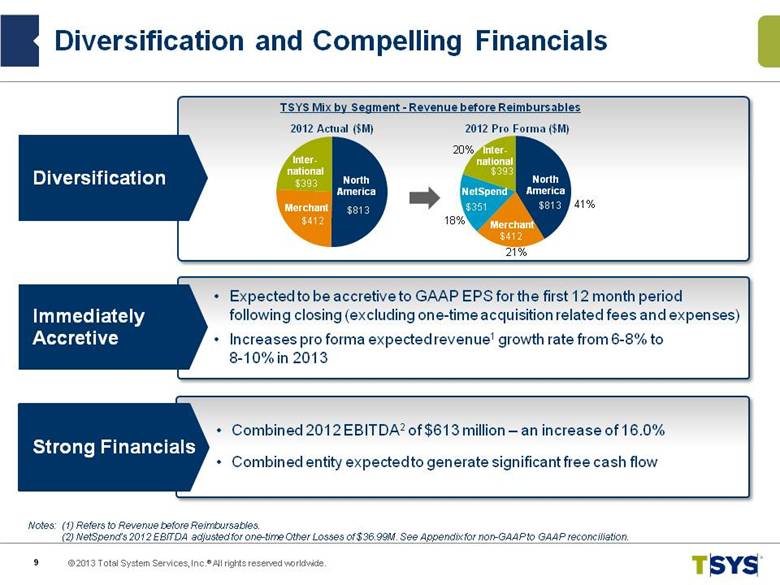
© 2013 Total System Services, Inc.® All rights reserved worldwide. Diversification and Compelling Financials Diversification Combined 2012 EBITDA2 of $613 million – an increase of 16.0% Combined entity expected to generate significant free cash flow Strong Financials 9 Notes: (1) Refers to Revenue before Reimbursables. (2) NetSpend’s 2012 EBITDA adjusted for one-time Other Losses of $36.99M. See Appendix for non-GAAP to GAAP reconciliation. 2012 Actual ($M) 2012 Pro Forma ($M) North America Inter-national Merchant Merchant North America Inter-national NetSpend TSYS Mix by Segment - Revenue before Reimbursables Expected to be accretive to GAAP EPS for the first 12 month period following closing (excluding one-time acquisition related fees and expenses) Increases pro forma expected revenue1 growth rate from 6-8% to 8-10% in 2013 Immediately Accretive 41% 21% 18% 20% |
|
|
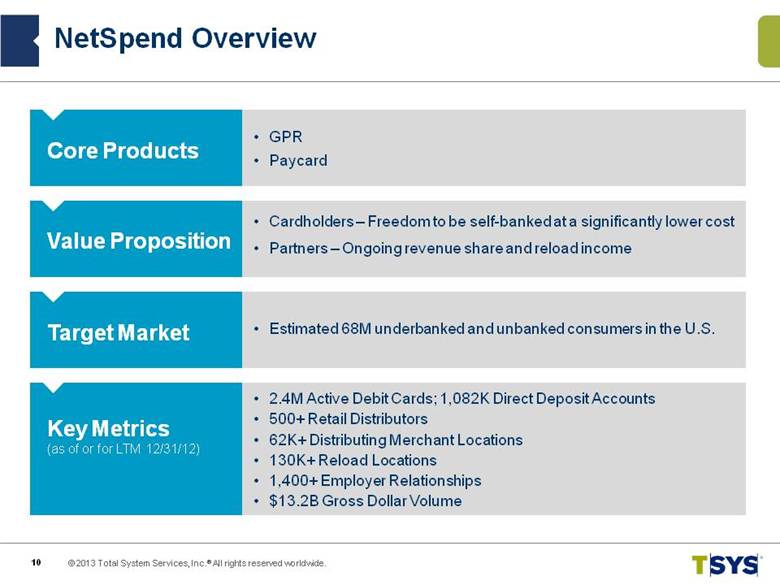
NetSpend Overview Core Products GPR Paycard Value Proposition Cardholders – Freedom to be self-banked at a significantly lower cost Partners – Ongoing revenue share and reload income Target Market Estimated 68M underbanked and unbanked consumers in the U.S. Key Metrics (as of or for LTM 12/31/12) 2.4M Active Debit Cards; 1,082K Direct Deposit Accounts 500+ Retail Distributors 62K+ Distributing Merchant Locations 130K+ Reload Locations 1,400+ Employer Relationships $13.2B Gross Dollar Volume 10 © 2013 Total System Services, Inc.® All rights reserved worldwide. |
|
|
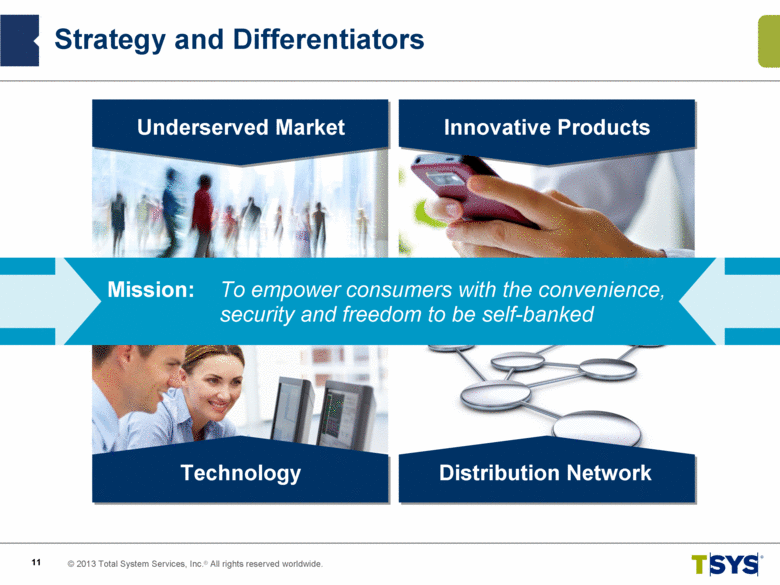
Strategy and Differentiators © 2013 Total System Services, Inc.® All rights reserved worldwide. 11 Underserved Market Innovative Products Technology Distribution Network Mission: To empower consumers with the convenience, security and freedom to be self-banked |
|
|
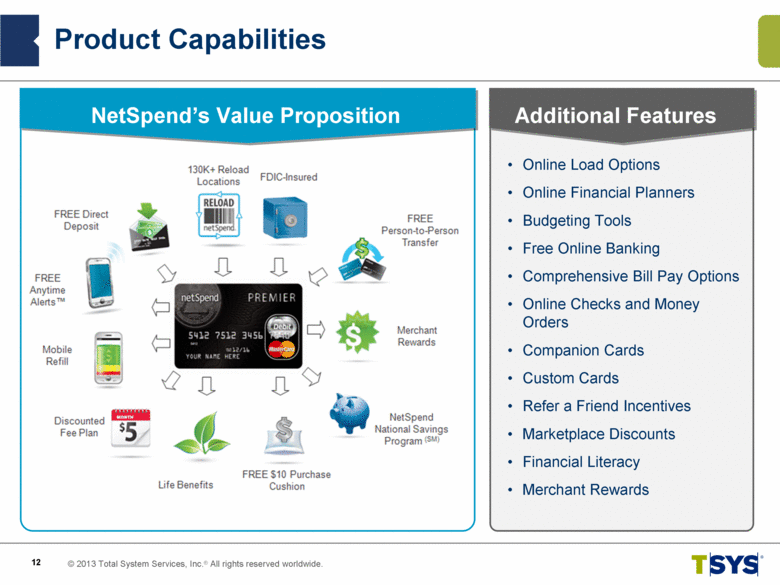
Product Capabilities © 2013 Total System Services, Inc.® All rights reserved worldwide. Additional Features NetSpend’s Value Proposition Online Load Options Online Financial Planners Budgeting Tools Free Online Banking Comprehensive Bill Pay Options Online Checks and Money Orders Companion Cards Custom Cards Refer a Friend Incentives Marketplace Discounts Financial Literacy Merchant Rewards 12 |
|
|
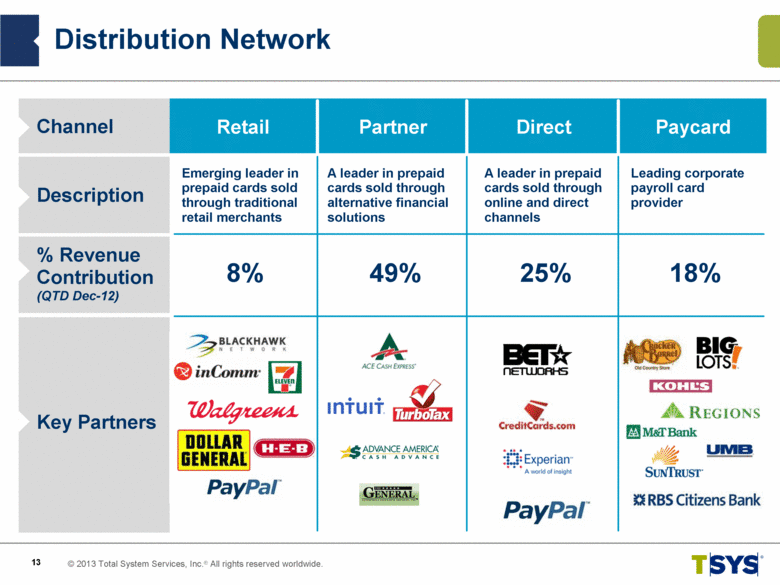
Distribution Network © 2013 Total System Services, Inc.® All rights reserved worldwide. 8% 49% 25% 18% Channel Retail Partner Direct Paycard Description Emerging leader in prepaid cards sold through traditional retail merchants A leader in prepaid cards sold through alternative financial solutions A leader in prepaid cards sold through online and direct channels Leading corporate payroll card provider % Revenue Contribution (QTD Dec-12) Key Partners 13 |
|
|
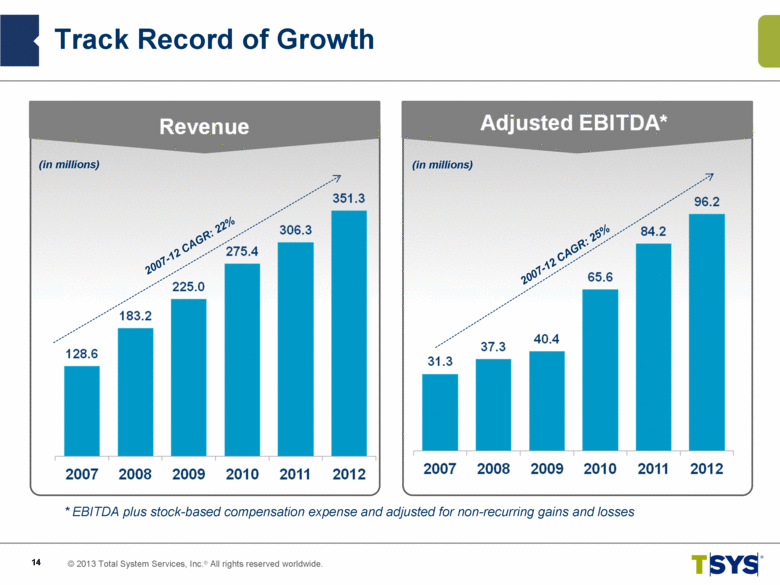
Track Record of Growth © 2013 Total System Services, Inc.® All rights reserved worldwide. * EBITDA plus stock-based compensation expense and adjusted for non-recurring gains and losses (in millions) 2007-12 CAGR: 22% (in millions) 2007-12 CAGR: 25% 14 |
|
|
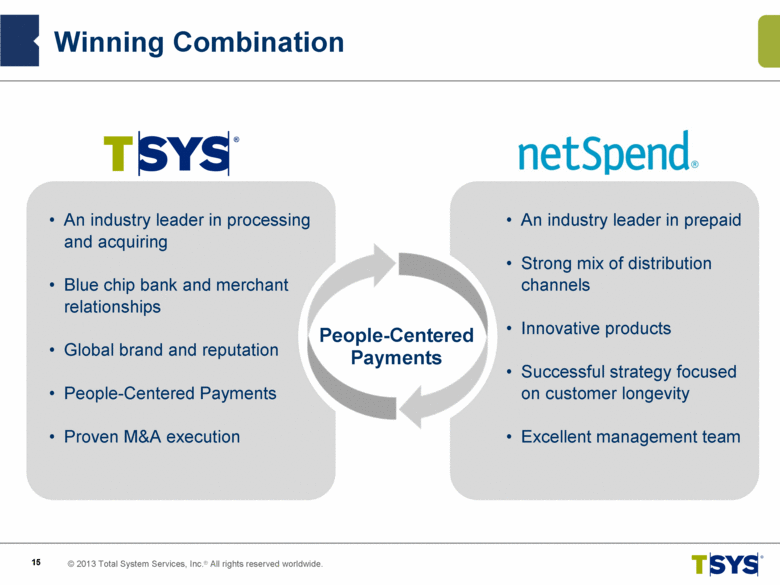
An industry leader in prepaid Strong mix of distribution channels Innovative products Successful strategy focused on customer longevity Excellent management team Winning Combination © 2013 Total System Services, Inc.® All rights reserved worldwide. An industry leader in processing and acquiring Blue chip bank and merchant relationships Global brand and reputation People-Centered Payments Proven M&A execution People-Centered Payments 15 |
|
|
Appendix © 2013 Total System Services, Inc.® All rights reserved worldwide. 16 |
|
|
© 2013 Total System Services, Inc.® All rights reserved worldwide. 17 Appendix Non-GAAP Reconciliation – Description of Non-GAAP Financial Measures TSYS Revenues Before Reimbursable Items – TSYS computes revenues before reimbursable items by adjusting revenues to remove the effect of revenue it receives for out-of-pocket expenses that are reimbursed by its clients. These expenses consist primarily of postage, access fees and third party software. NetSpend’s EBITDA and Adjusted EBITDA – NetSpend’s Adjusted EBITDA is based on the definition of NetSpend’s Adjusted EBITDA as used in its press releases, investor presentations and filings with the SEC. NetSpend computes Adjusted EBITDA by adjusting net income or net loss to remove the effect of income and expenses related to interest, taxes, depreciation and amortization (“NetSpend’s EBITDA") and then adjusting for stock-based compensation and non-recurring gains and losses. TSYS EBITDA – TSYS computes EBITDA by adjusting net income to remove the effect of income and expenses related to equity in income of equity investments, income taxes, nonoperating expense, depreciation and amortization. Combined EBITDA – Combined EBITDA reflects the arithmetic sum of NetSpend’s EBITDA and TSYS’ EBITDA. This presentation also includes Combined EBITDA excluding NetSpend’s one-time Other Losses. These financial metrics do not reflect any adjustments resulting from the proposed transaction (including any potential synergies) and do not represent a “pro forma” amount determined in accordance with the SEC’s rules and regulations, including Article 11 of Regulation S-X. |
|
|
© 2013 Total System Services, Inc.® All rights reserved worldwide. 18 Appendix Non-GAAP Reconciliation – Description of Non-GAAP Financial Measures (continued) NetSpend and TSYS each use non-GAAP financial measures to evaluate and assess their financial performance against budgets, as well as to evaluate financial performance for executive and management compensation purposes. NetSpend and TSYS each believe that their non-GAAP financial measures provide meaningful additional information about their companies to assist investors in evaluating their operating results. Accordingly, NetSpend and TSYS each include non-GAAP financial measures when reporting their financial results to their shareholders and investors in order to provide them with an additional tool to evaluate their ongoing business operations. Although NetSpend and TSYS each use non-GAAP financial measures to measure their operating results and assess their financial performance, these measures are not necessarily comparable to similarly titled captions of other companies, including each other, due to potential inconsistencies in the method of calculation. NetSpend and TSYS each believe that their use of non-GAAP financial measures provide investors with the same key financial performance indicators that are utilized by their management teams to assess their operating results, evaluate the business and make operational decisions on a prospective, going-forward basis. Hence, their management teams provide disclosure of non-GAAP financial measures to give shareholders and potential investors an opportunity to see their companies as viewed by management, to assess their companies with some of the same tools that management utilizes internally and to be able to compare such information with prior periods. NetSpend and TSYS each believe that the presentation of GAAP financial measures alone would not provide their shareholders and potential investors with the ability to appropriately analyze their ongoing operational results, and therefore expected future results. Therefore, NetSpend and TSYS each believe that inclusion of non-GAAP financial measures provides investors with additional information to help them better understand their financial statements just as their management teams utilize these non-GAAP financial measures to better understand the their business, manage budgets and allocate resources. |
|
|
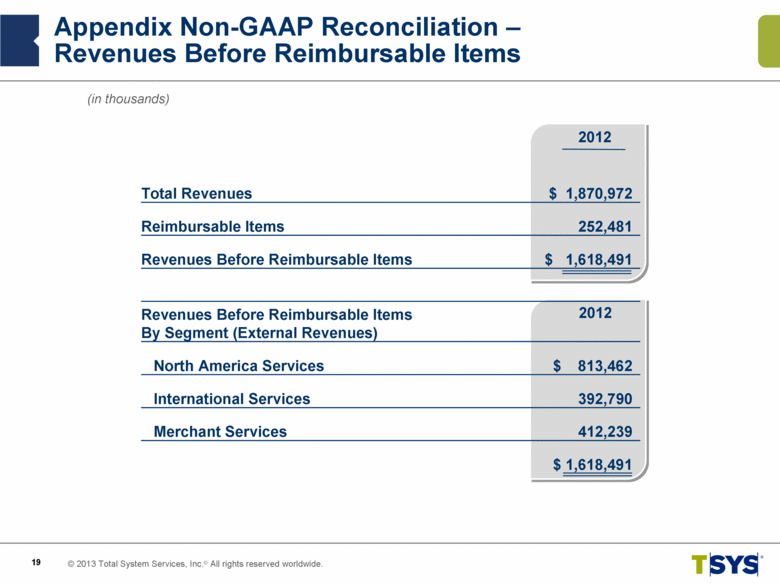
© 2013 Total System Services, Inc.® All rights reserved worldwide. 19 Appendix Non-GAAP Reconciliation – Revenues Before Reimbursable Items 2012 2012 Total Revenues $ 1,870,972 Reimbursable Items 252,481 Revenues Before Reimbursable Items $ 1,618,491 Revenues Before Reimbursable Items By Segment (External Revenues) North America Services $ 813,462 International Services 392,790 Merchant Services 412,239 $ 1,618,491 (in thousands) |
|
|
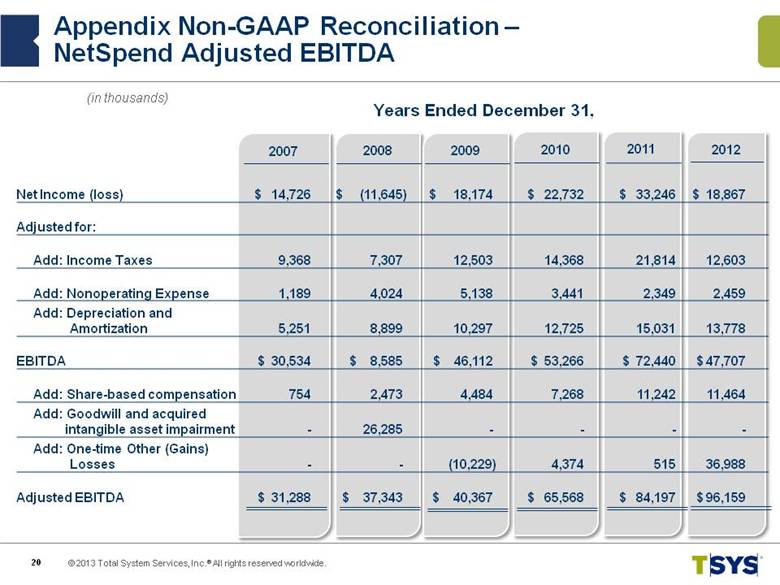
© 2013 Total System Services, Inc.® All rights reserved worldwide. 20 Appendix Non-GAAP Reconciliation – NetSpend Adjusted EBITDA 2011 2010 2008 2012 2009 2007 Net Income (loss) $ 14,726 $ (11,645) $ 18,174 $ 22,732 $ 33,246 $ 18,867 Adjusted for: Add: Income Taxes 9,368 7,307 12,503 14,368 21,814 12,603 Add: Nonoperating Expense 1,189 4,024 5,138 3,441 2,349 2,459 Add: Depreciation and Amortization 5,251 8,899 10,297 12,725 15,031 13,778 EBITDA $ 30,534 $ 8,585 $ 46,112 $ 53,266 $ 72,440 $ 47,707 Add: Share-based compensation 754 2,473 4,484 7,268 11,242 11,464 Add: Goodwill and acquired intangible asset impairment - 26,285 - - - - Add: One-time Other (Gains) Losses - - (10,229) 4,374 515 36,988 Adjusted EBITDA $ 31,288 $ 37,343 $ 40,367 $ 65,568 $ 84,197 $ 96,159 (in thousands) Years Ended December 31, |
|
|
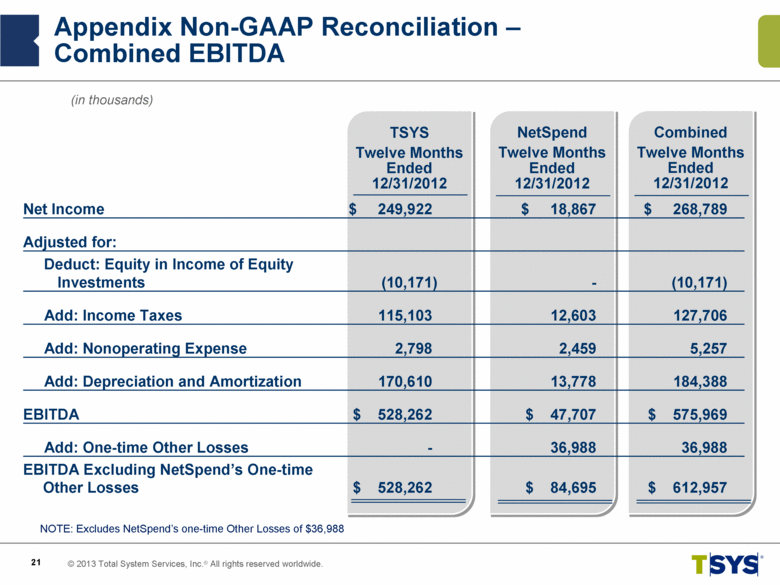
© 2013 Total System Services, Inc.® All rights reserved worldwide. 21 Appendix Non-GAAP Reconciliation – Combined EBITDA Combined Twelve Months Ended 12/31/2012 NetSpend Twelve Months Ended 12/31/2012 TSYS Twelve Months Ended 12/31/2012 Net Income $ 249,922 $ 18,867 $ 268,789 Adjusted for: Deduct: Equity in Income of Equity Investments (10,171 ) - (10,171) Add: Income Taxes 115,103 12,603 127,706 Add: Nonoperating Expense 2,798 2,459 5,257 Add: Depreciation and Amortization 170,610 13,778 184,388 EBITDA $ 528,262 $ 47,707 $ 575,969 Add: One-time Other Losses - 36,988 36,988 EBITDA Excluding NetSpend’s One-time Other Losses $ 528,262 $ 84,695 $ 612,957 (in thousands) NOTE: Excludes NetSpend’s one-time Other Losses of $36,988 |