Attached files
| file | filename |
|---|---|
| 8-K - FORM 8-K - Hillshire Brands Co | d488900d8k.htm |
 CAGNY
2013 Exhibit 99 |
 Forward Looking
Statements This presentation contains forward-looking statements regarding HSH’s
business prospects and future financial results
and
metrics.
These
statements
are
typically
preceded
by
terms
such
as
“will,”
“anticipates,”
“intends,”
“expects,”
“likely”
or “believes”
and other similar terms. These forward-looking statements are based on currently
available competitive, financial and economic data and management’s views and assumptions
regarding future events and are inherently uncertain. Investors must recognize that
actual results may differ from those expressed or implied
in
the
forward-looking
statements,
and
the
company
wishes
to
caution
you
not
to
place
undue
reliance
on
any
forward-looking
statements.
We
have
provided
cautionary
language
in
our
most
recent
Annual
Report
on
Form
10-K and other filings with the SEC identifying factors that could cause actual results to
differ materially from those expressed or implied by our forward-looking statements.
All forward-looking statements included in this presentation are qualified in their
entirety by such cautionary statements. HSH undertakes no obligation to publicly update
any forward-looking statements, whether as a result of new information, future events or otherwise, except
as required by applicable law.
This presentation includes certain non-GAAP financial measures intended to supplement, not
substitute for, comparable GAAP measures. Reconciliations of non-GAAP financial
measures to GAAP financial measures are provided in the Appendix at the end of the
presentation. Investors are urged to consider carefully the comparable GAAP
measures
and
the
reconciliations
to
those
measures
provided
in
the
Appendix,
or
on
our
website
at
www.hillshirebrands.com.
2 |
 What We Want You
to Take Away From Today Terrific portfolio of leading, iconic brands that respond to
investment
Growth and cost agendas gaining traction
Confident we will deliver on financial targets
3 |
 An Amazing
Year… Launched new company
Built new management team
Relocated headquarters to Chicago
Energized new culture
4 |
 Past 12 Months
Have Validated Our Core Investment Thesis Compete in attractive and profitable
categories Key to success is disciplined investment in brand building and
innovation
Cost efficiencies exist to fund growth agenda
Potential to deliver significant shareholder return
5 |
 Early Days But
Turnaround Starting to Take Hold 6
Percent Change in Total Volume Sales
Product
FY12
FY13 YTD
Ball Park Hot Dogs
(4.7)%
+5.2%
Jimmy Dean Frozen Breakfast
(3.6)%
+7.9%
Hillshire Farm Lunchmeat
(7.5)%
+1.0%
State Fair Corn Dogs
(1.5)%
+1.7%
Gallo Salame
(6.4)%
+3.2%
Sara Lee Pre Sliced Deli
(17.2)%
+0.1%
Sara Lee Sweet Goods
(8.8)%
(2.8)%
Source: Symphony IRI Group Total US Multi-outlet data, 52 weeks ended 7/1/12
and Fiscal YTD through 2/3/13 |
 What We Will
Cover Today Background on Hillshire Brands
Review of our four core strategies for growth
Financial outlook
7 |
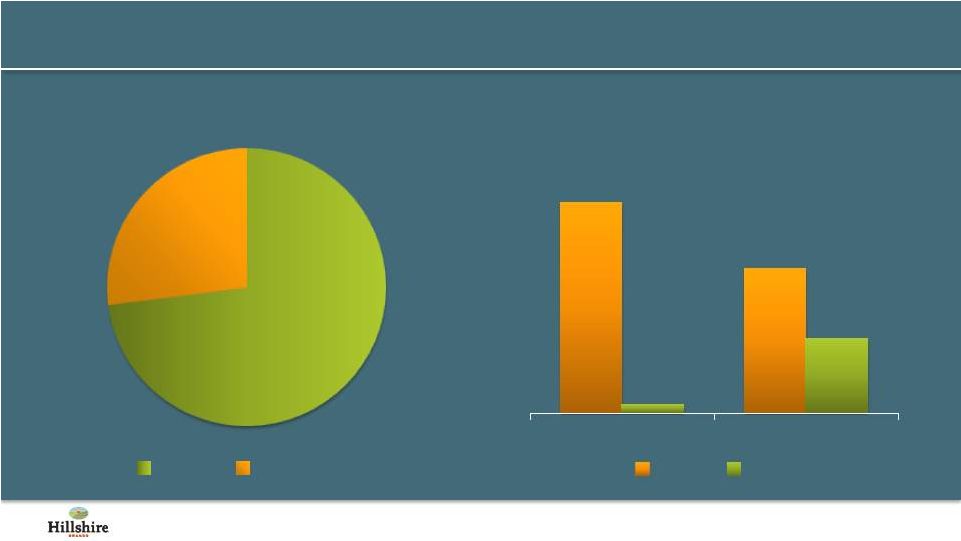 A $4B North
American Meat-Centric Food Company 8
Source: FY12 Company Financial Statement information; Based on reported net sales
73%
27%
Retail
Foodservice
Retail vs. Foodservice
96%
65%
4%
35%
Retail
Foodservice
Meat
Bakery
Meat vs. Bakery |
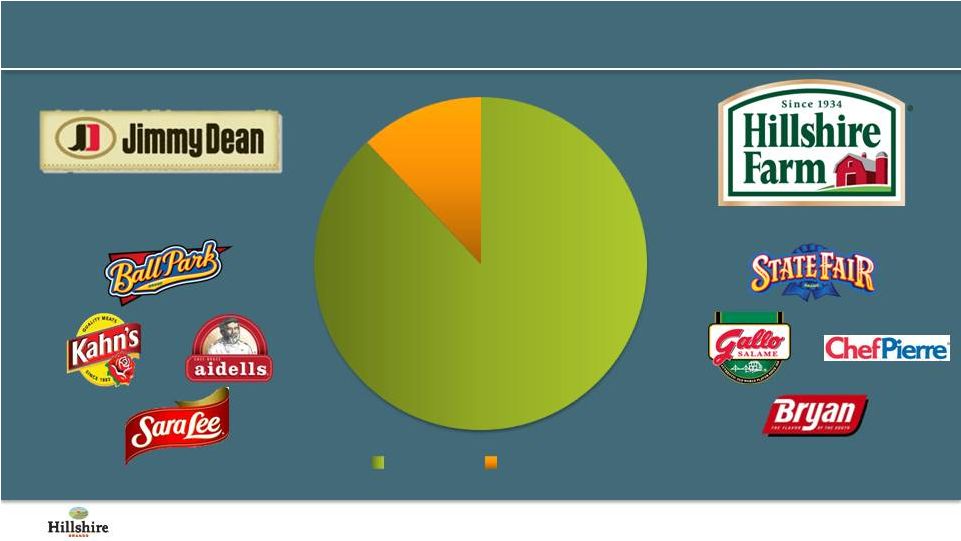 88% of Sales Are
Branded; Two $1B Brands 9
Source: Company Financial Statement information
88%
12%
Branded
Unbranded |
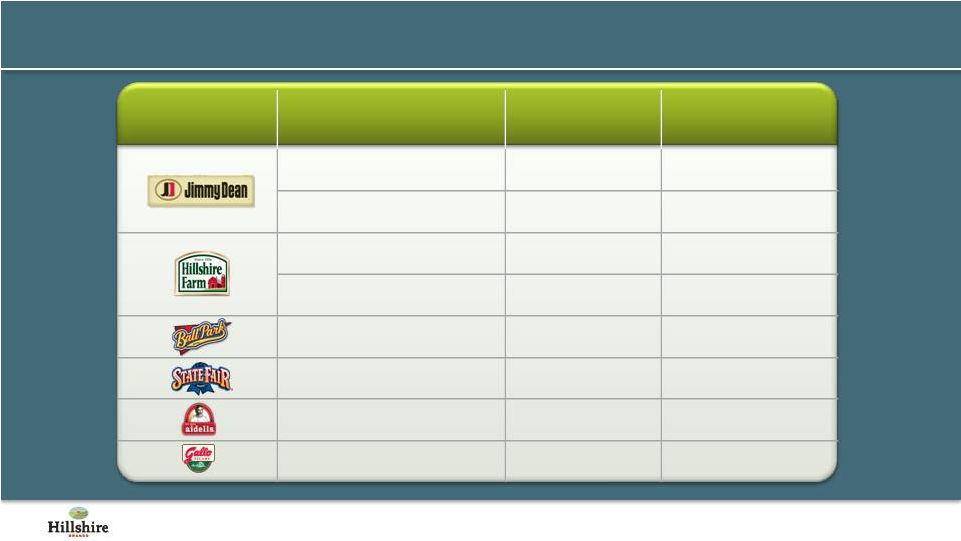 Leading Share
Positions in Core Categories 10
Source: IRI Multi-Outlet 52 weeks Ending 2/3/2013
Brand
Category
HSH Share
Position
Relative Market
Share
Breakfast Sausage
#1
2.8x
Frozen Protein Breakfast
#1
7.4x
Lunchmeat
#3
0.3x
Smoked Sausage
#1
2.8x
Hot Dogs
#1
1.1x
Corn Dogs
#1
1.7x
Super Premium Sausage
#1
1.6x
Specialty Lunchmeat
#3
0.3x |
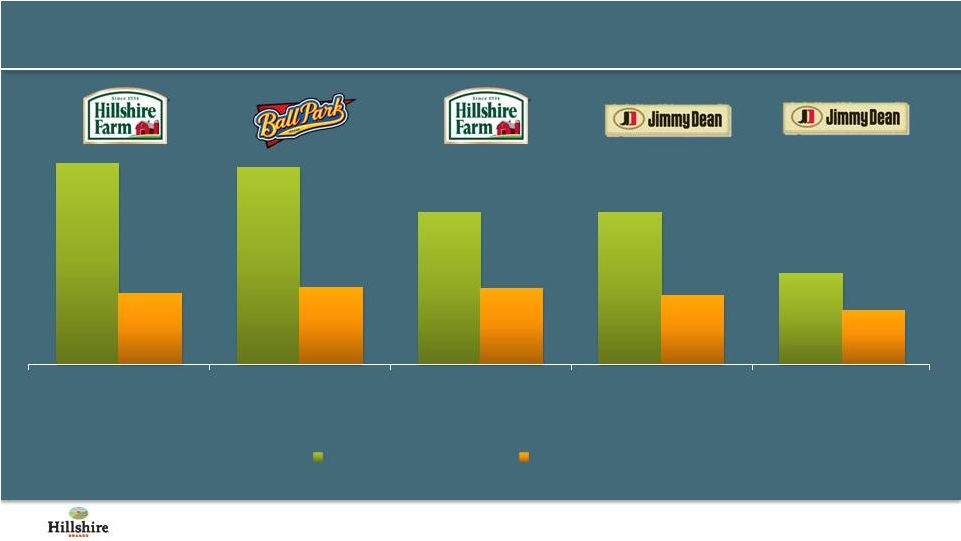 Multiple Areas
for Growth in Large Categories 11
Size of
Category
$5.1B
$2.7B
$1.8B
$1.8B
$1.5B
Source: Symphony IRI Group, National Consumer Panel, Total US–All Outlets, 52 weeks
ending 12/30/12. 80%
79%
60%
61%
36%
28%
31%
30%
28%
21%
Lunchmeat
Hot Dogs
Smoked Sausage
Breakfast Sausage
Frozen Protein Breakfast
Category HH Penetration
Brand HH Penetration |
 Core Categories
Have Limited Private Label Penetration 12
Source: Symphony IRI Group Total US Multioutlet data, 52 weeks ending. 2/3/13
Category
Private Label Share
Frozen Protein Breakfast
7%
Hot Dogs
4%
Corn Dogs
4%
Smoked Sausage
6%
Cocktail Links
5%
Fresh Breakfast Sausage
9%
Mainstream Lunchmeat
14%
Food and Beverage Industry
18% |
 Vision
Become THE
Most Innovative Meat-Centric
Food Company in the US
13 |
 Four Strategies
Will Deliver Long-Term Value Creation 14
FY 2015 Targets
Volume Growth
Net Sales Growth
MAP % of Total Revenue
Operating Margin
2-3%
4-5%
5%
10%
Core Strategies
Strengthen the core
Extend into adjacencies
Fuel growth through efficiency
Acquire on-trend brands |
 Two Core Growth
Strategies 15
Improve Business Fundamentals
Leverage Equities to
Win in New Categories
Near-term growth comes from strengthening the core
Strengthen
the Core
Extend into
Adjacencies |
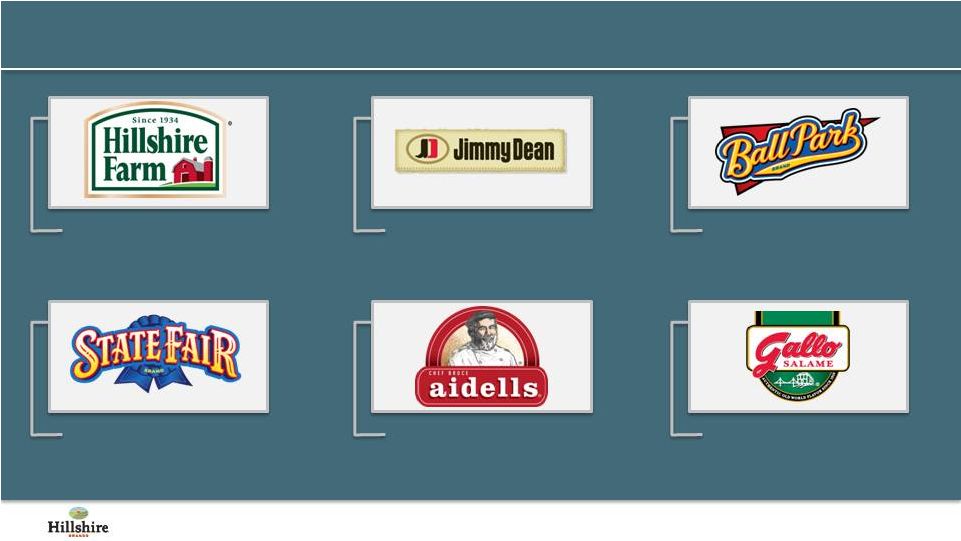
 Six Brands Will
Drive Our Growth 16
Mainstream Brands
Artisanal Brands |
 Brand Building
and Innovation Key to Growth Agenda 17
Brand positioning
World-class advertising
Category management
Brand Building
Innovation
Upgrade existing quality
and packaging
New line extensions
Adjacent innovations |
 Increasing
Investment in MAP Behind Our Core Brands 18
3.5%
4.3%
5%
Historic Average
FY13 YTD
FY15E
MAP Spending as % of Sales |
 Building a
Culture Of Innovation Creating a sustainable pipeline by
shifting focus to growth platforms
Streamlining processes to reduce
time to market
Improving in-market success by
focusing on consumer insights
19
9%
11%
13%
15%
Past 4 Years
FY13 YTD
FY15E
-
Revenue from New Innovations*
*Percent annual revenue from past three years’ rolling innovations, Retail segment only
|
 New Marketing
Leadership and Communications Partners New Marketing
Leadership
New Communications
Partner
20 |
 Sharpened Brand
Positioning 21
“Farm House
Quality Meats”
“Hearty
Comfort Food”
“Better Guy Food for
Better Guy Times”
“Smart & Sensible
Family Choices”
“Authentic Ingredients,
Exceptional Tastes”
“Artisanal
Italian Meats” |
 22
|
 Focused on
Making MAP More Effective 23
1) Purchase Interest sourced from Nielsen In-Market Study (among ad aware)
2) Emotive Power sourced from Pre-Advertising Study (OTX)
Post-Market Analytics
Pre-Market Testing
Consumption Trends
Improved
ROI
TBD
Purchase Interest
1
+25 pct. pts.
Emotive Power
2
+57 pts. |
 Strengthening
Our Customer Relationships 24
Gaining additional category captaincies
Increasing shelf space in key retailers
Improving shelf mix to higher velocity
and margin products |
 Brand Building
and Innovation Key to Growth Agenda 25
Brand positioning
World-class advertising
Category management
Brand Building
Innovation
Upgrade existing quality
and packaging
New line extensions
Adjacent innovations |
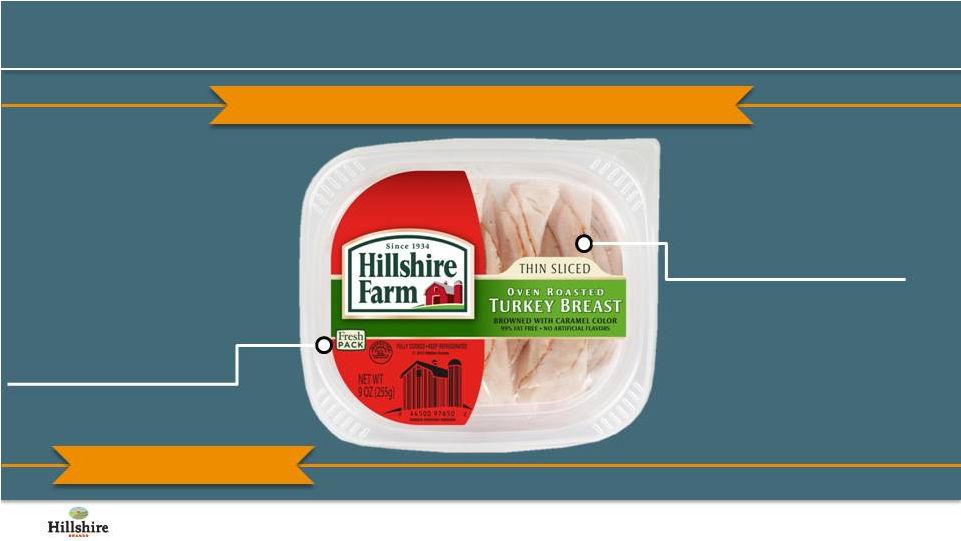 Hillshire Farm
Improving Lunchmeat Packaging 26
Launch: Q3 FY13
New “fresh”
callout
Transparent window
UPGRADES BASED ON CONSUMER INSIGHTS |
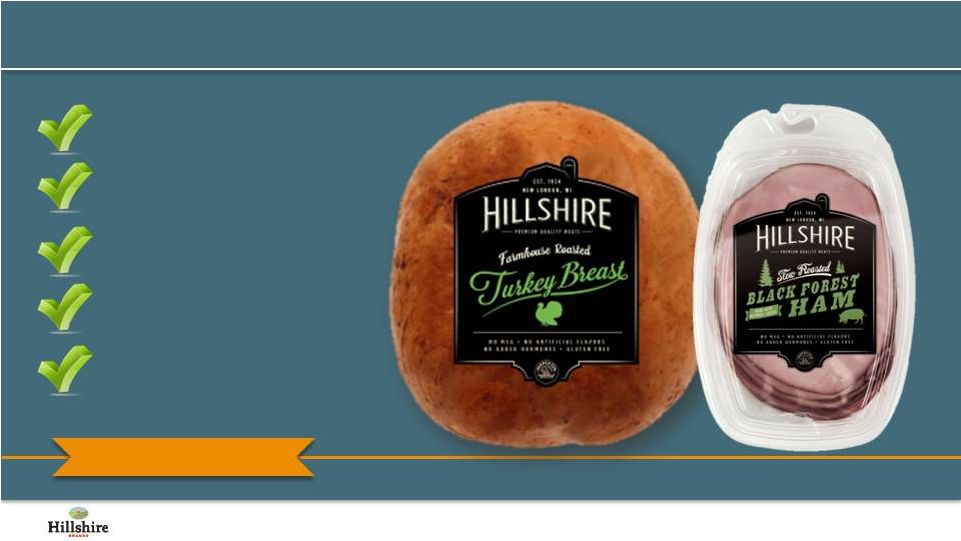
 Hillshire Farm
Improving Lunchmeat Quality 27
Better Taste
Better flavor
Optimized seasoning
Better Appearance
More natural look
Better texture
Launch: Q3 FY13 |
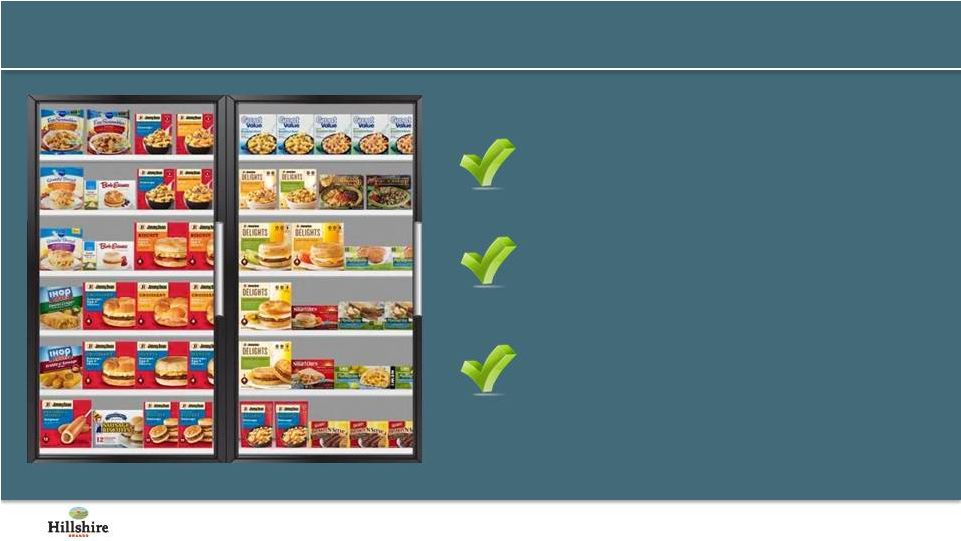
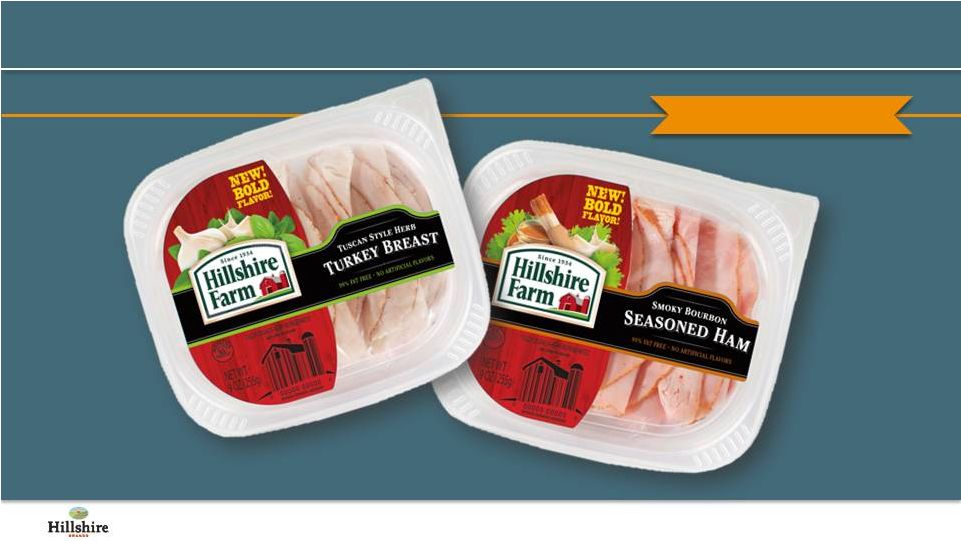 Hillshire Farm
Launching New Lunchmeat Flavors 28
Launch: Q4 FY13 |
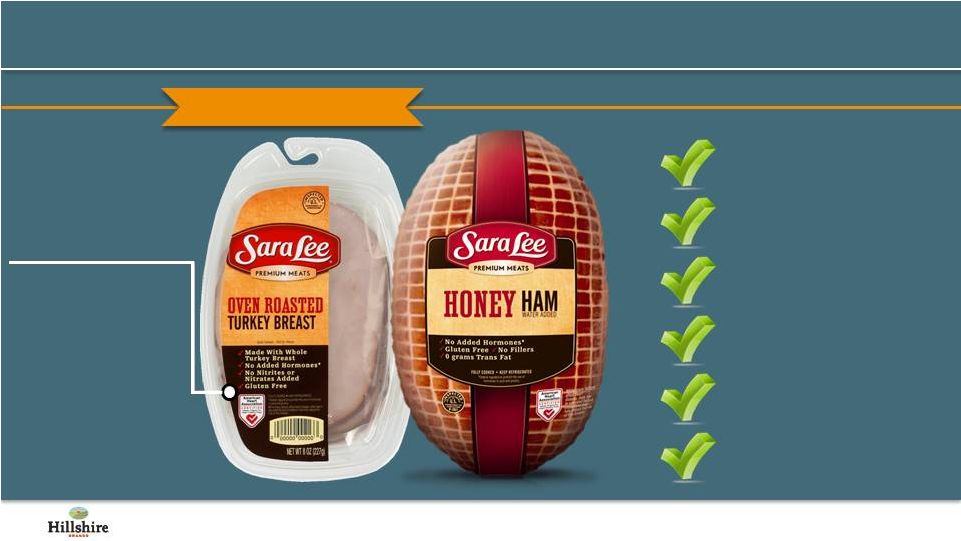 Sara Lee Deli:
Improved Quality, Improved Packaging 29
Launch: H2 FY13
American Heart
Association
Heart-Check Mark
No gluten
No MSG
No fillers
No artificial flavors
No added hormones
0 grams of trans fat |
 Hillshire Black
Label: Testing A New, Superior-Quality Approach To The Deli
30
Whole muscle meat
Seasoned in own juices
No added preservatives
No MSG
No fillers
Launch: Q1 FY14 |
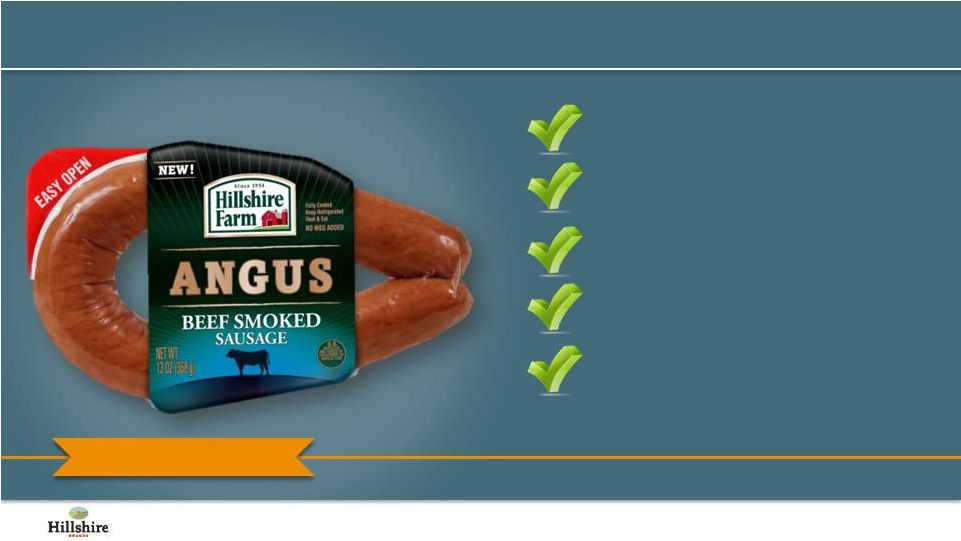 Hillshire Farm
Upgrading Smoked Sausage Quality 31
3 new varieties
No artificial colors, flavors
No MSG
Gluten free
60/40 taste win vs. competition
Launch: Q3 FY13 |
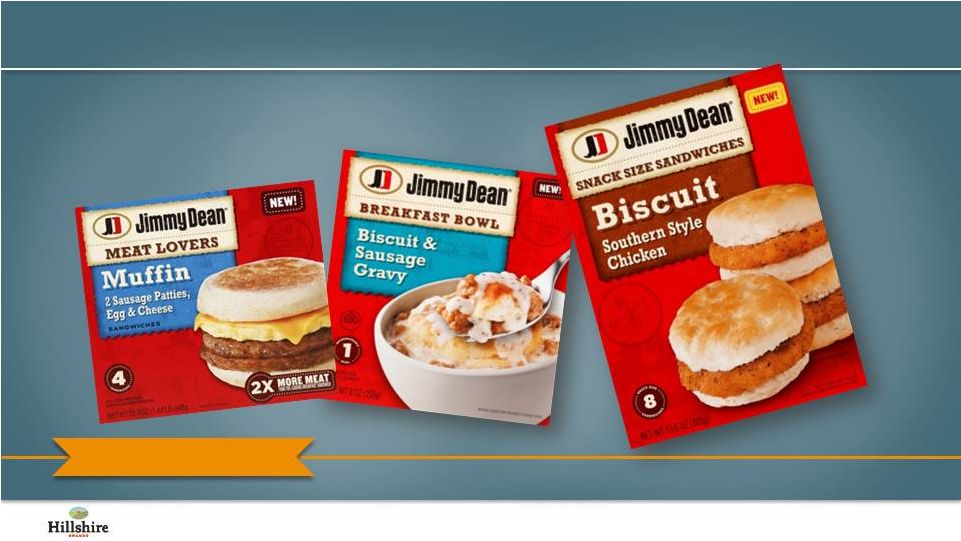 Jimmy Dean
Adding Additional Comfort Foods 32
Launch: Q3 FY13 |
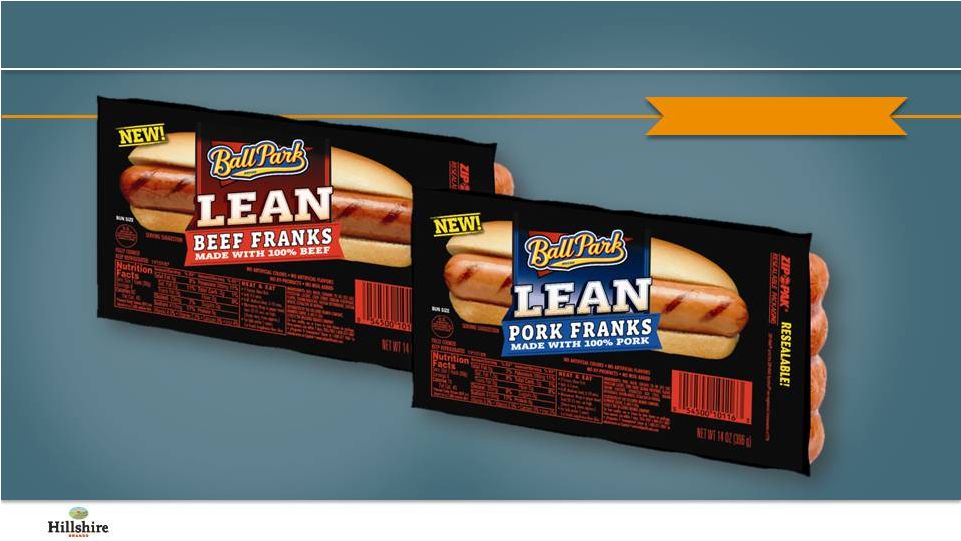 Ball Park
Bringing New, On-Trend Benefits to Hot Dogs 33
Launch: Q3 FY13 |
 State Fair
Introducing New Packaging and Varieties 34
Launch: FY14 |
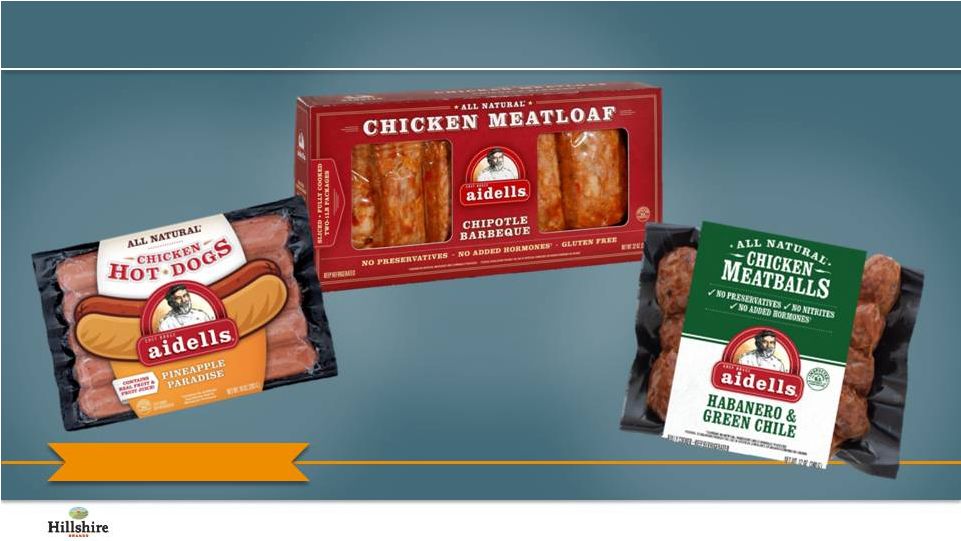
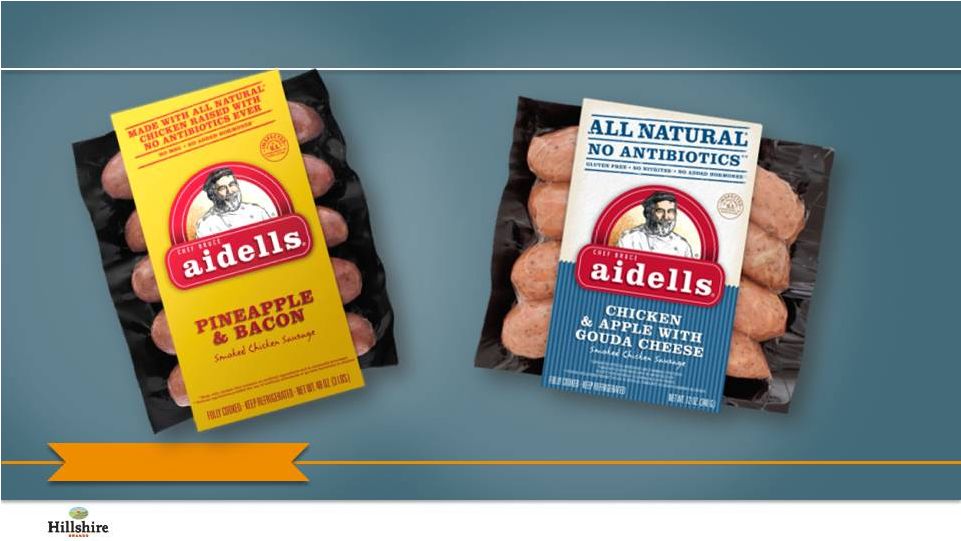 Aidells
Continues its Tradition of Flavor Experiences 35
Launch: FY13 -
FY14 |
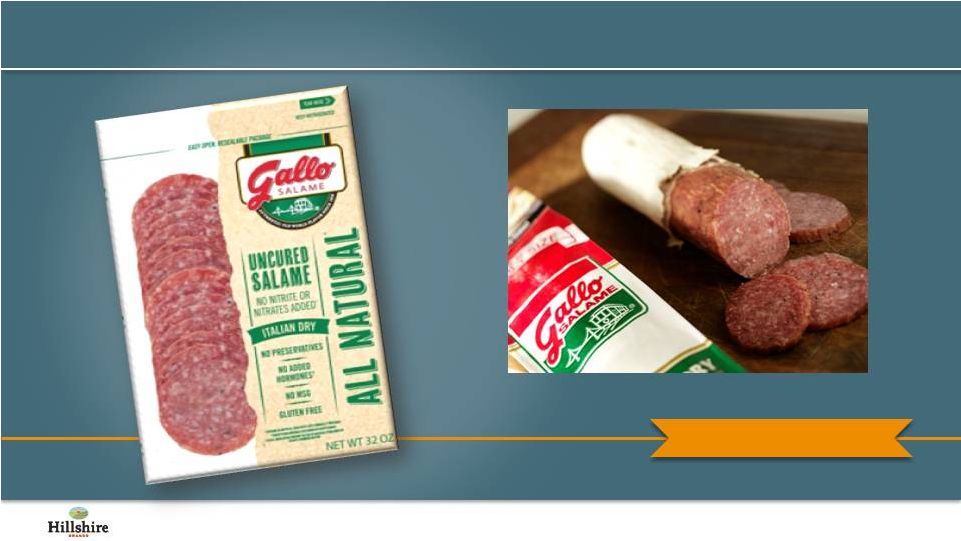 Gallo Adding
Higher-Quality Salame 36
Launch: Q4 FY13 |
 Second Growth
Opportunity Is To Extend Into Adjacencies 37
Protein
breakfast
Meat-centric
meal starters
Meat-centric
snacks
Meat-centric
entrees
Heat & eat
mini-meals
Heritage
categories |
 Track Record of
Moving From Core to Adjacencies 38 |
 Jimmy Dean
Frozen Adjacency Extended To “Better For You” 39
Launch: Q3 FY13 |
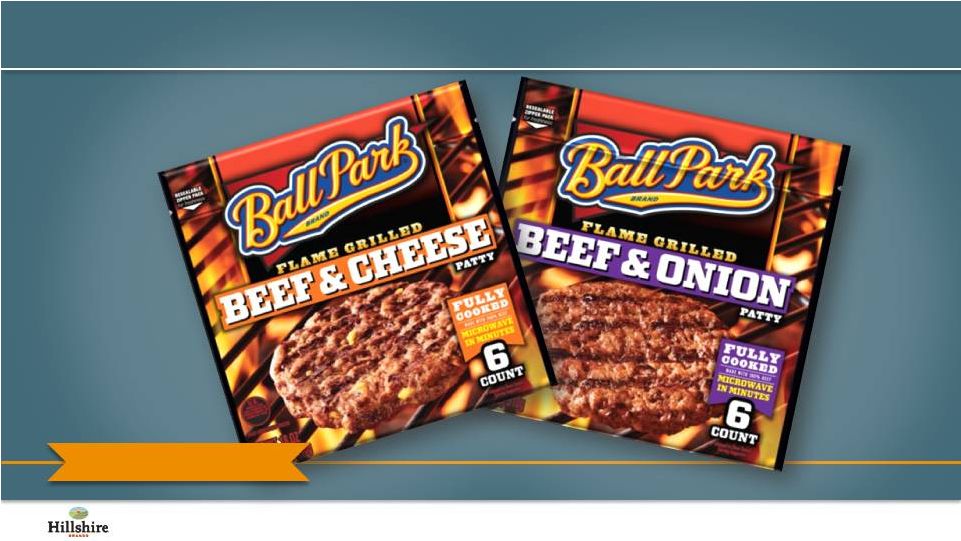 Ball Park
Extended Into Pre-cooked Burgers 40
Launch: FY12 |
 State Fair
Entering Hot Dog Category 41
Launch: Q4 FY13
Bilingual packaging |
 Aidells
Extending Beyond Smoked Sausage 42
Launch: FY13 –
FY14 |
 Recent Record of
Managing Costs Saved $90 million via cost reductions in FY11 and FY12
Right-sized workforce for speed and empowerment
•
More than 600 positions eliminated in last 24 months
Closed two plants in FY12
43 |
 We Will Remain
Relentless on Cost Efficiency Committed to $100 million of
cost savings
Opportunities for additional
efficiency
•
Supply chain
•
Trade spend
•
Productivity through culture
change
44
Expected savings by year
$ in millions
FY13
FY14/
FY15
Total
Supply chain
10
SG&A / Corp.
30
Total
40
60
100 |
 Building Brands
to Build Value Outstanding portfolio of brands with clear potential
Emerging culture of innovation and agility
Demonstrating success –
products, processes and performance
Committed to growth and profitability through brand-building
Focus on cost efficiency as fuel for growth
45
Building Value in our Brands and for our Shareholders |
 Capital
Allocation Priorities 46
Invest in Business
Dividends
Acquisitions
Share Repurchases
Pay Down Debt
Top priority
Expect to increase over time
Strategic and opportunistic
Opportunistic
Not a near-term priority |
 Assets &
Capabilities We Can Leverage With Acquisitions Consumer insights
Protein / Breakfast / Meals
expertise
Category captaincies in key
product areas
Robust R&D and innovation
focus
History of success integrating
acquired businesses
Efficient supply chain and
production
Fully-integrated SAP enterprise
system
Extensive distribution
infrastructure
Powerful brand equities with
proven ability to penetrate new
segments
Capabilities
Assets
47 |
 Criteria For
Acquisitions Value-added categories / consistent with consumer trends
Strong brands with attractive competitive positioning
Complementary / additive to HSH capabilities
Scale with suppliers and customers
Attractive top-line growth trends
Accretive to margin structure
EPS contribution and returns
Alignment with
Strategic Vision
Shareholder
Value Creation
48 |
 Remain Committed
to Our FY15 Targets 49
Volume Growth
2-3%
Net Sales Growth
4-5%
MAP % of Total Revenue
5%
Operating Margin
10%
FY 2015 Targets |
 FY13 Results on
Track 50
Strong 2013 First Half Results
Fiscal 2013 Full-Year Guidance
vs. H1 FY12
Adjusted Net Sales
+2.3%
Adjusted Operating Income
+44%
Adjusted Diluted EPS
+49%
Adjusted Net Sales
Slightly up vs. FY12
Adjusted Diluted EPS
$1.60 -
$1.70
“Adjusted” terms are non-GAAP financial measures. See our reconciliation to the
most directly comparable GAAP measure at the end of this presentation. |
 Healthy
Financial Position 51
($ in millions)
As of Dec. 31, 2012
Adjusted YTD Cash Flow
$ 114
Adjusted YTD EBITDA
$ 301
Cash
$ 299
Debt
$ 946
Net Debt
$ 647
“Adjusted” terms are non-GAAP financial measures. See our reconciliation to the
most directly comparable GAAP measure at the end of this presentation. |
 Key
Takeaways Terrific portfolio of leading, iconic brands that respond to
investment
Growth and cost agendas gaining traction
Confident we will deliver on financial targets
52 |
 Q&A
|
 Appendix
|
 Impact of
As
Significant
Reported
Items
Dispositions
Adjusted (1)
2,034
$
-
$
-
$
2,034
$
1,408
4
-
1,404
626
(4)
-
630
88
-
-
88
349
35
-
314
Net charges for exit activities, asset and business dispositions
6
6
-
-
Impairment charges
-
-
-
-
183
$
(45)
$
-
$
228
$
Impact of
As
Significant
Reported
Items
Dispositions
Adjusted (1)
Net Sales
2,040
$
-
$
52
$
1,988
$
1,469
11
37
1,421
571
(11)
15
567
77
-
1
76
367
27
7
333
Net charges for exit activities, asset and business dispositions
66
66
-
-
Impairment charges
14
14
-
-
47
$
(118)
$
7
$
158
$
Cost of Sales
SG&A (excluding MAP)
Cost of Sales
Gross Profit
Six Months ended Dec. 29, 2012 and Dec. 31, 2011 (in millions, except
per share data - unaudited) Six Months ended Dec. 29, 2012
Operating income
MAP Expense
Operating Income Reconciliation - Reported to Adjusted
Net Sales
Six Months ended Dec. 31, 2011
Gross Profit
MAP Expense
SG&A (excluding MAP)
Operating income
(1) Represents a non-GAAP financial measure. See detailed explanation of these and other
non-GAAP measures in the release dated January 31, 2013 55
|
 56
Impact of
Impact of
As
Significant
As
Significant
Reported
Items
Adjusted (1)
Reported
Items
Adjusted (1)
$
164
(45)
$
209
$
4
$
(118)
$
122
$
57
(16)
73
(11)
(46)
35
107
(29)
136
15
(72)
87
9
4
5
(223)
(440)
217
2
2
-
460
460
-
11
6
5
237
20
217
118
(23)
141
252
(52)
304
-
-
-
3
-
3
$
118
(23)
$
141
$
249
$
(52)
$
301
$
$
107
(29)
$
136
$
15
$
(72)
$
87
$
11
6
5
234
20
214
Earnings per share of common stock:
$
0.87
(0.23)
$
1.10
$
0.13
$
(0.61)
$
0.74
$
$
0.96
(0.19)
$
1.15
$
2.10
$
(0.44)
$
2.54
$
34.8%
35.2%
(277.4)%
28.8%
Net income from continuing operations
Amounts attributable to Hillshire Brands:
Diluted
Income from continuing operations
Net income
Effective tax rate - continuing operations
Discontinued operations:
Net income (loss) from discontinued operations
Net income (loss) from discontinued operations
Net income (loss)
Less: Income from noncontrolling interests, net of tax
Continuing operations:
Net income (loss) attributable to Hillshire Brands
before income taxes
Income tax expense (benefit)
Income from continuing operations
Income from continuing operations
Income from discontinued operations, net of tax
Gain (loss) on sale of discontinued operations, net of tax
Discontinued operations
Six Months ended Dec. 29, 2012 and Dec. 31, 2011 (in millions, except
per share data - unaudited) Six Months ended Dec. 29, 2012
Six Months ended Dec. 31, 2011
EPS Reconciliation - Reported to Adjusted
(1) Represents a non-GAAP financial measure. See detailed explanation of these and other
non-GAAP measures in the release dated January 31, 2013 |
 57
Cash Flow Reconciliation - Reported to Adjusted
Six Months ended Dec. 31, 2012 (in millions, except per share data - unaudited)
Six Months ended Dec. 29, 2012
As
Reported
Impact of
Significant
Items
Adjusted (1)
Cash Flow
$70
$44
$114
(1) Represents a non-GAAP financial measure. See detailed explanation of these and other
non-GAAP measures in the release dated January 31, 2013 |
 58
(1) Represents a non-GAAP financial measure. See detailed explanation of these and other
non-GAAP measures in the release dated January 31, 2013 EBITDA
Reconciliation - Reported to Adjusted
Six
Months
ended
Dec.
31,
2012
(in
millions,
except
per
share
data
-
unaudited)
Reported Net Income
118
Income
tax
expense
-
continuing
operations
57
Income
tax
benefit
-
discontinued
operations
(2)
Income
tax
expense
-
gain
on
sale
of
discontinued
operations
1
Interest (net)
19
Depreciation & Amortization
86
Reported EBITDA
279
Significant Items, excluding accelerated depreciation
22
Adjusted EBITDA (1)
301 |