Attached files
| file | filename |
|---|---|
| 8-K - 8-K - CF Industries Holdings, Inc. | a13-5608_18k.htm |
Exhibit 99.1
|
|
2012 Fourth Quarter Financial Results February 20, 2013 NYSE: CF |

|
|
All statements in this communication, other than those relating to historical facts, are “forward-looking statements.” These forward-looking statements are not guarantees of future performance and are subject to a number of assumptions, risks and uncertainties, many of which are beyond our control, which could cause actual results to differ materially from such statements. Important factors that could cause actual results to differ materially from our expectations include, among others: the volatility of natural gas prices in North America; the cyclical nature of our business and the agricultural sector; the global commodity nature of our fertilizer products, the impact of global supply and demand on our selling prices, and the intense global competition from other fertilizer producers; conditions in the U.S. agricultural industry; reliance on third party providers of transportation services and equipment; difficulties in the implementation of a new enterprise resource planning system and risks associated with cyber security; weather conditions; our ability to complete our recently announced production capacity expansion projects on schedule as planned and on budget or at all; risks associated with other expansions of our business, including unanticipated adverse consequences and the significant resources that could be required; potential liabilities and expenditures related to environmental and health and safety laws and regulations; our potential inability to obtain or maintain required permits and governmental approvals or to meet financial assurance requirements from governmental authorities; future regulatory restrictions and requirements related to greenhouse gas emissions; the seasonality of the fertilizer business; the impact of changing market conditions on our forward sales programs; risks involving derivatives and the effectiveness of our risk measurement and hedging activities; the significant risks and hazards involved in producing and handling our products against which we may not be fully insured; our reliance on a limited number of key facilities; risks associated with joint ventures; acts of terrorism and regulations to combat terrorism; difficulties in securing the supply and delivery of raw materials, increases in their costs and delay or interruptions in their delivery; risks associated with international operations; losses on our investments in securities; deterioration of global market and economic conditions; our ability to manage our indebtedness; and loss of key members of management and professional staff. More detailed information about factors that may affect our performance may be found in our filings with the Securities and Exchange Commission, including our most recent periodic reports filed on Form 10-K and Form 10-Q, which are available in the Investor Relations section of the CF Industries Web site. Forward-looking statements are given only as of the date of this release and we disclaim any obligation to update or revise the forward-looking statements, whether as a result of new information, future events or otherwise, except as required by law. Safe Harbor Statement |
|
|
Financial Highlights In millions, except percentages and EPS 2012 Q4 2011 Q4 FY 2012 FY 2011 Reported net sales $ 1,481 $ 1,718 $ 6,104 $ 6,098 Adjusted net sales (1) $ 1,611 $ 1,675 $ 6,104 $ 5,955 Reported gross margin 656 865 3,113 2,896 - As percent of reported sales 44% 50% 51% 48% Adjusted gross margin (1) 786 822 3,113 2,753 - As percent of adjusted sales (1) 49% 49% 51% 46% EBITDA(2) $ 835 $ 871 $ 3,320 $ 2,986 Net earnings attributable to common stockholders 471 439 1,849 1,539 Earnings per diluted share 7.40 6.66 28.59 21.98 Cash flow provided by operations 421 124 2,376 2,079 Adjusted to exclude the impact of a retroactive modification to the selling price calculation methodology used for products sold by Canadian Fertilizers Limited (CFL), which was made in connection with CF Industries’ pending acquisition of the outstanding interests in CFL. This modification impacts the comparability of the financial results between the 2011 and 2012 time periods. See explanation under “CFL Selling Price Modification” on slide 12 and slides 13 and 14 for the reconciliation of adjusted financial results and metrics. See slide 11 for EBITDA reconciliation. 3 |
|
|
2012 Accomplishments Delivered record net earnings, EPS, EBITDA, revenue and operating cash flow Strong demand and excellent execution Robust nitrogen demand amid tight global inventories Healthy domestic phosphate market Low natural gas costs Mitigated impact of low river water levels Clearly delineated capital allocation program Repurchased 3.1 million shares Announced new $3.0 billion repurchase program extending through December 2016 Pending C$0.9 billion acquisition of minority interests in CFL Announced $3.8 billion nitrogen capacity expansion plan 4 |
|
|
Earnings and Cash Flow 2008 2009 2010 2011 2012 Earnings per Share Operating Cash Flow (millions) 5 $7.40 |
|
|
2012 Segment Results In millions, except as noted FY 2012 H/(L) Reported FY 2011 H/(L) Adjusted FY 2011(1) Sales $ 5,097 $ 85 $ 227 Gross margin 2,914 350 493 - Percent 57% 6 pts 7 pts Volume (000 st) 12,969 (33) (33) Average selling prices ($/st) - Ammonia $ 602 $ 16 $ 44 - Urea 441 30 56 - UAN 308 (11) (11) - AN 266 6 6 Gas cost $/MMBtu $ 3.39 $ (0.89) $ (0.89) 6 In millions, except as noted FY 2012 H/(L) FY 2011 Sales $ 1,007 $ (78) Gross margin 200 (133) - Percent 20% (11) pts Volume (000 st) 2,035 113 - DAP 1,611 143 - MAP 424 (30) - Domestic 1,254 57 - Export 781 56 Average selling prices ($/st) - DAP $ 493 $ (72) - MAP 502 (63) Nitrogen Segment Phosphate Segment (1) See slides 12-14 for reconciliation of adjusted financial results. |
|
|
Q4 Nitrogen Segment Results (1) Graph source: Green Markets In millions, except as noted 2012 Q4 Reported H/(L) 2011 Q4 Reported 2012 Q4 Adjusted H/(L) 2011 Q4 Adjusted Sales $ 1,226 $ (238) $ 1,355 $ (64) Gross margin 620 (166) 750 7 - Percent 51% (3) pts 55% 3 pts Volume (000 st) 3,279 (65) 3,279 (65) Average selling prices ($/st) - Ammonia $ 567 $ (66) $ 640 $ 31 - Urea 291 (174) 401 (25) - UAN 307 (47) 307 (47) - AN 300 42 300 42 Gas cost $/MMBtu $ 3.61 $ (0.45) $ 3.61 $ (0.45) Mid-Corn Belt Prices 7 $/st 2010 2011 2012 Ammonia Urea UAN-32 (1) See slides 12-14 for reconciliation of adjusted financial results. |
|
|
Graph source: Green Markets In millions, except as noted 2012 Q4 H/(L) 2011 Q4 Sales $ 256 $ 1 Gross margin 36 (43) - Percent 14% (17) pts Volume (000 st) 509 70 - DAP 424 57 - MAP 85 13 - Domestic 367 127 - Export 142 (57) Average selling prices ($/st) - DAP $ 499 $ (77) - MAP 527 (77) DAP Central Florida Price Q4 Phosphate Segment Results 8 $/st 2010 2011 2012 |
|
|
Supplemental Information 9 Source: USDA, CF *Market Year **USDA Season Average Growing Benefit of Shale Gas $/MMBtu Source: PIRA, IFERC U.S. Farm Income (Billions of U.S. Dollars) Source: USDA 0 2 4 6 8 10 12 0% 10% 20% 30% 40% 50% 60% 70% 80% 90% 100% 2007 2008 2009 2010 2011 2012 Conventional/Other Shale Henry Hub Price Zeebrugge Cash Price $0 $20 $40 $60 $80 $100 $120 $140 $160 $0 $100 $200 $300 $400 $500 $600 2003 2004 2005 2006 2007 2008 2009 2010 2011 2012 Other Income Livestock Income Crop Income Net Cash Income Net Cash Income Gross Income $0.00 $1.00 $2.00 $3.00 $4.00 $5.00 $6.00 $7.00 $8.00 $9.00 0% 10% 20% 30% 40% 50% 60% 2000 2002 2004 2006 2008 2010 2012F* Corn Wheat Corn Price Per Bushel** Wheat Price Per Bushel** Source: USDA, Green Markets, CF $0 $100 $200 $300 $400 $500 $600 $700 $800 2009 2010 2011 2012F 2013F Corn Corn-on-Corn Soybeans Returns calculated using average March/April futures prices for harvest; 2013 returns based on current new crop futures prices for Nov/Dec 2013. U.S. Farmer Returns Over Variable Costs (U.S. Dollars per Acre) U.S. Grain Prices and Stocks-to-Use Ratios |
|
|
Outlook/Summary Continued positive agricultural market conditions Stocks-to-use ratios remain at record lows Corn acreage forecast of 97 million acres Attractive fertilizer market fundamentals Low ammonia inventories and strong domestic nitrogen demand Continued nitrogen supply curtailments and limited capacity additions CF Industries’ product inventory positioned for potential logistical challenges Company proceeding with capacity expansion projects 10 CF Industries is uniquely positioned to serve North American demand with extensive low-cost production and distribution network |
|
|
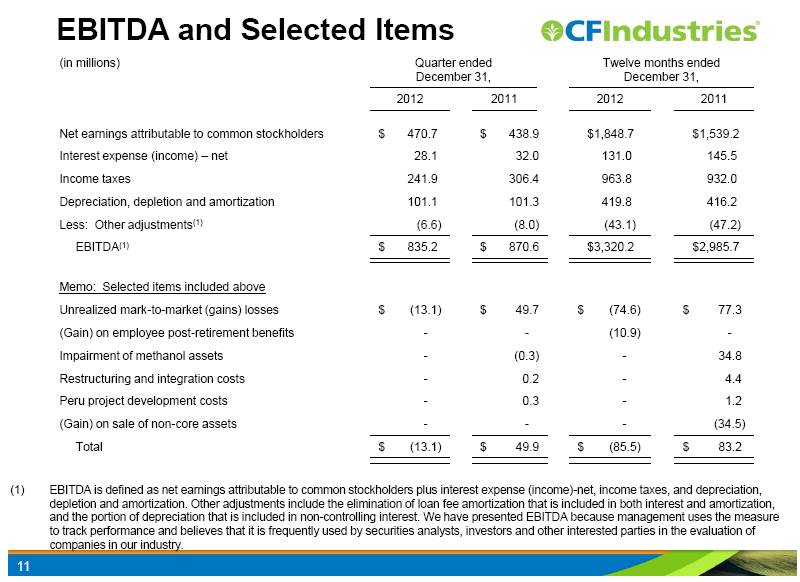
EBITDA and Selected Items 11 (in millions) Quarter ended December 31, Twelve months ended December 31, 2012 2011 2012 2011 Net earnings attributable to common stockholders $ 470.7 $ 438.9 $ 1,848.7 $ 1,539.2 Interest expense (income) – net 28.1 32.0 131.0 145.5 Income taxes 241.9 306.4 963.8 932.0 Depreciation, depletion and amortization 101.1 101.3 419.8 416.2 Less: Other adjustments(1) (6.6) (8.0) (43.1) (47.2) EBITDA(1) $ 835.2 $ 870.6 $ 3,320.2 $ 2,985.7 Memo: Selected items included above Unrealized mark-to-market (gains) losses $ (13.1) $ 49.7 $ (74.6) $ 77.3 (Gain) on employee post-retirement benefits - - (10.9) - Impairment of methanol assets - (0.3) - 34.8 Restructuring and integration costs - 0.2 - 4.4 Peru project development costs - 0.3 - 1.2 (Gain) on sale of non-core assets - - - (34.5) Total $ (13.1) $ 49.9 $ (85.5) $ 83.2 (1) EBITDA is defined as net earnings attributable to common stockholders plus interest expense (income)-net, income taxes, and depreciation, depletion and amortization. Other adjustments include the elimination of loan fee amortization that is included in both interest and amortization, and the portion of depreciation that is included in non-controlling interest. We have presented EBITDA because management uses the measure to track performance and believes that it is frequently used by securities analysts, investors and other interested parties in the evaluation of companies in our industry. |
|
|
CFL Selling Price Modifications 12 CF Industries, Inc. (CF Industries) currently owns 49% of the voting common shares and 66% of the non-voting preferred shares of Canadian Fertilizers Limited (CFL), an Alberta, Canada based nitrogen fertilizer manufacturer, and purchases 66% of the production of CFL. Viterra, Inc. (Viterra) holds 34% of the equity ownership of CFL, purchases the remaining 34% of CFL’s production and receives a distribution from CFL equal to 34% of the net earnings. CFL is a variable interest entity that is consolidated in CF Industries’ financial statements. CF Industries and Viterra purchase nitrogen fertilizer products from CFL under product purchase agreements. Under the provisions of these product purchase agreements that were in effect until the fourth quarter of 2012, CFL’s selling prices were based on market prices. An initial portion of the selling price was paid based upon production cost plus an agreed-upon margin once title passed as the product was shipped. The remaining portion of the selling price, representing the difference between the market price and production cost plus an agreed-upon margin, was paid after the end of the year. The sales revenue attributable to this remaining portion of the selling price was accrued on an interim basis. In the Company’s consolidated financial statements, the net sales and accounts receivable attributable to CFL are solely generated by transactions with Viterra, as all transactions with CF Industries are eliminated in consolidation. In the fourth quarter of 2012, the CFL Board of Directors approved an amendment to the product purchase agreements. The amendment modifies the selling prices that CFL charges for products sold to Viterra and CF Industries. The modified selling price is based on production cost plus an agreed-upon margin and is effective retroactive to January 1, 2012. As a result of the January 1, 2012 effective date of the amendment, the Company has recognized in its fourth quarter 2012 consolidated statement of operations a reduction in net sales to Viterra of $129.7 million and a corresponding reduction in net earnings attributable to the noncontrolling interest to reverse the interim market price accruals recognized in the first three quarters of 2012. These items had no impact on the Company’s net earnings attributable to common stockholders, but they did reduce net sales, gross margin, operating earnings, earnings before income taxes and net earnings attributable to noncontrolling interest by $129.7 million in the fourth quarter. The selling price modification also had no impact on the Company’s net cash flows as the selling price modification was entirely offset by a change in the distributions payable to the noncontrolling interest. In order to provide comparable information for the periods presented, the Company has provided certain financial information adjusted as if the modified CFL pricing calculation methodology had been in effect beginning on January 1, 2011. The table provided on slide 13 reflects and adjusts for the impact of the change on our consolidated net sales, gross margin, gross margin as a percent of sales and net earnings attributable to noncontrolling interest. In addition, the table on slide 14 reflects and adjusts for the impact of the change in the CFL pricing calculation methodology on nitrogen segment net sales, gross margin, gross margin as a percent of sales and average selling price per ton of ammonia and urea. In August 2012, CF Industries entered into an agreement to acquire Viterra’s interest in CFL (including its rights under its product purchase agreement with CFL) for a total purchase price of C$0.9 billion, subject to certain adjustments. Upon completion of this transaction, CF Industries will be entitled to purchase 100% of CFL’s nitrogen fertilizer production. The completion of the transaction is subject to the receipt of regulatory approvals in Canada and other terms and conditions in the definitive agreements. |
|
|
13 CFL Selling Price Modifications CONSOLIDATED RESULTS Three months ended Twelve months ended December 31, December 31, 2012 2011 2012 2011 (in millions, except as noted) Net sales As reported $ 1,481.4 $ 1,718.4 $ 6,104.0 $ 6,097.9 Impact of selling price adjustment 129.7 (43.7) - (142.6) As adjusted $ 1,611.1 $ 1,674.7 $ 6,104.0 $ 5,955.3 Gross margin As reported $ 656.2 $ 865.2 $ 3,113.3 $ 2,895.6 Impact of selling price adjustment 129.7 (43.7) - (142.6) As adjusted $ 785.9 $ 821.5 $ 3,113.3 $ 2,753.0 Gross margin percentage As reported 44.3% 50.3% 51.0% 47.5% Impact of selling price adjustment 4.5% (1.2)% - (1.3)% As adjusted 48.8% 49.1% 51.0% 46.2% Net earnings attributable to noncontrolling interest As reported $ (115.4) $ 63.3 $ 74.7 $ 221.8 Impact of selling price adjustment 129.7 (43.7) - (142.6) As adjusted $ 14.3 $ 19.6 $ 74.7 $ 79.2 |
|
|
14 Three months ended Twelve months ended NITROGEN SEGMENT DATA December 31, December 31, 2012 2011 2012 2011 (in millions, except as noted) Net sales As reported $ 1,225.6 $ 1,463.1 $ 5,096.6 $ 5,012.1 Impact of selling price adjustment 129.7 (43.7) - (142.6) As adjusted $ 1,355.3 $ 1,419.4 $ 5,096.6 $ 4,869.5 Gross margin As reported $ 620.0 $ 786.0 $ 2,913.6 $ 2,563.2 Impact of selling price adjustment 129.7 (43.7) - (142.6) As adjusted $ 749.7 $ 742.3 $ 2,913.6 $ 2,420.6 Gross margin percentage As reported 50.6% 53.7% 57.2% 51.1% Impact of selling price adjustment 4.7% (1.4)% - (1.4)% As adjusted 55.3% 52.3% 57.2% 49.7% Average selling prices (dollars per ton) Ammonia As reported $ 567 $ 633 $ 602 $ 586 Impact of selling price adjustment 73 (24) - (28) As adjusted $ 640 $ 609 $ 602 $ 558 Granular urea As reported $ 291 $ 465 $ 441 $ 411 Impact of selling price adjustment 110 (39) - (26) As adjusted $ 401 $ 426 $ 441 $ 385 CFL Selling Price Modifications |