Attached files
| file | filename |
|---|---|
| 8-K - 8-K - RED ROBIN GOURMET BURGERS INC | a13-5478_18k.htm |
| EX-3.1 - EX-3.1 - RED ROBIN GOURMET BURGERS INC | a13-5478_1ex3d1.htm |
| EX-99.3 - EX-99.3 - RED ROBIN GOURMET BURGERS INC | a13-5478_1ex99d3.htm |
| EX-99.1 - EX-99.1 - RED ROBIN GOURMET BURGERS INC | a13-5478_1ex99d1.htm |
Exhibit 99.2
|
|
FISCAL Q412 RESULTS February 19, 2013 1 |
|
|
Forward-Looking Statements 2 Forward-looking statements in this press release regarding our expected earnings; restaurant sales; operating, marketing and growth initiatives; future economic performance; costs and capital expenditures; certain statements under the heading “2013 Outlook – Financials” and all other statements that are not historical facts, are made under the safe harbor provisions of the Private Securities Litigation Reform Act of 1995. These statements are based on assumptions believed by the Company to be reasonable and speak only as of the date on which such statements are made. Without limiting the generality of the foregoing, words such as “expect,” “growth,” “initiatives,” “believe,” “anticipate,” “intend,” or the negative or other variations thereof or comparable terminology are intended to identify forward-looking statements. We undertake no obligation to update such statements to reflect events or circumstances arising after such date, and we caution investors not to place undue reliance on any such forward-looking statements. Forward-looking statements involve risks and uncertainties that could cause actual results to differ materially from those described in the statements based on a number of factors, including but not limited to the following: the effectiveness of the Company’s marketing strategies, loyalty program and guest count initiatives to achieve restaurant sales growth; the ability to achieve anticipated revenue, cost savings and efficiencies from our anticipated new technology systems and other initiatives; the ability to fulfill planned expansion; the cost and availability of key food products, labor and energy; availability of capital or credit facility borrowings; the adequacy of cash flows or available debt resources to fund operations and growth opportunities; federal, state and local regulation of our business; and other risk factors described from time to time in the Company’s Form 10-K, Form 10-Q and Form 8-K reports (including all amendments to those reports) filed with the U.S. Securities and Exchange Commission. This presentation may also contain non-GAAP financial information. Management uses this information in its internal analysis of results and believes that this information may be informative to investors in gauging the quality of our financial performance, identifying trends in our results and providing meaningful period-to-period comparisons. For a reconciliation of non-GAAP measures presented in this document, see the accompanying supplemental information posted to the investor relations section of our website at www.redrobin.com. |
|
|
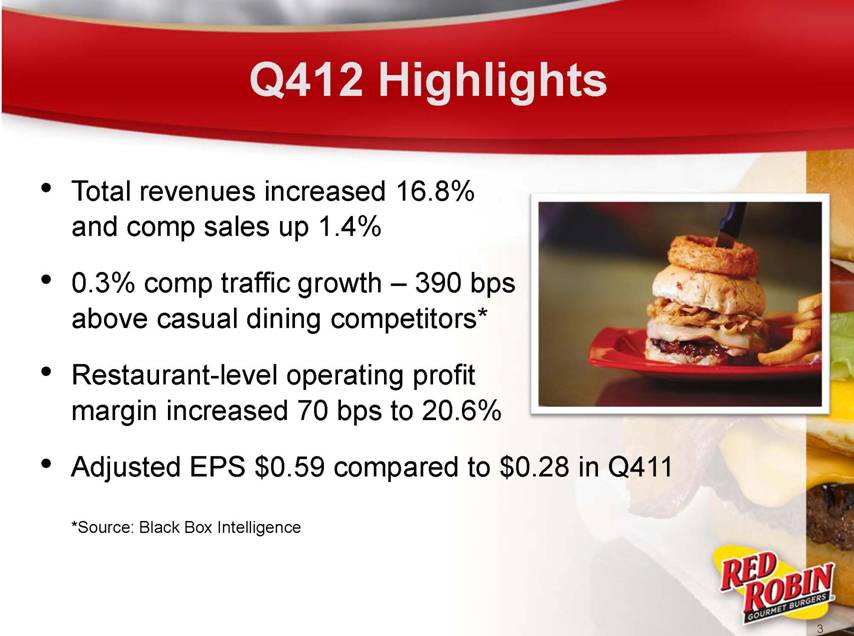
Q412 Highlights Total revenues increased 16.8% and comp sales up 1.4% 0.3% comp traffic growth – 390 bps above casual dining competitors* Restaurant-level operating profit margin increased 70 bps to 20.6% Adjusted EPS $0.59 compared to $0.28 in Q411 *Source: Black Box Intelligence 3 |
|
|
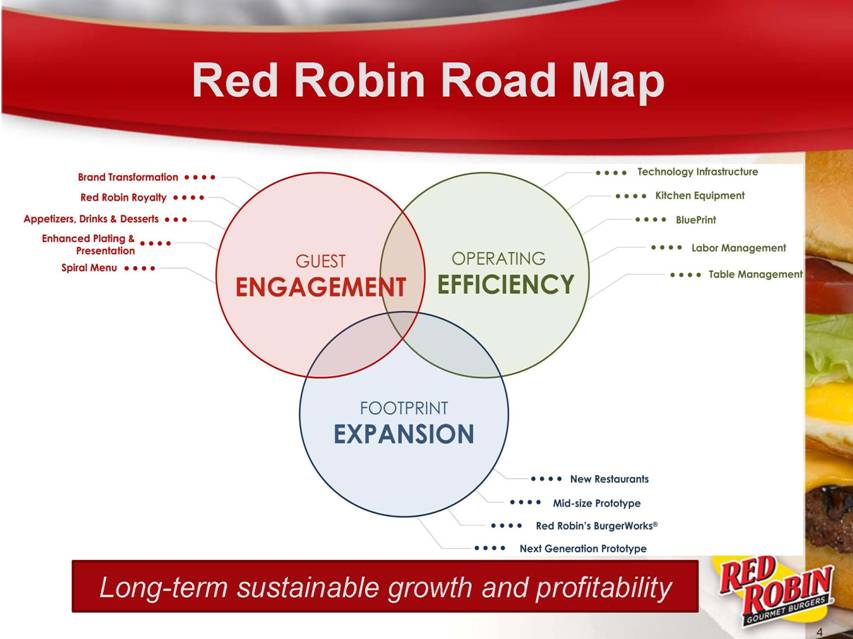
Red Robin Road Map 4 Long-term sustainable growth and profitability |
|
|
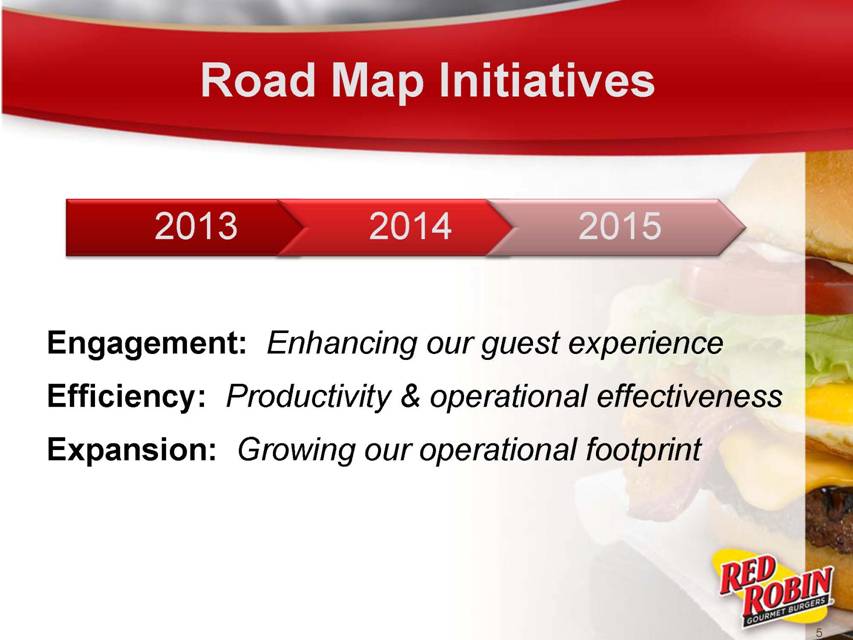
Road Map Initiatives 2013 2014 2015 Engagement: Enhancing our guest experience Efficiency: Productivity & operational effectiveness Expansion: Growing our operational footprint 5 |
|
|
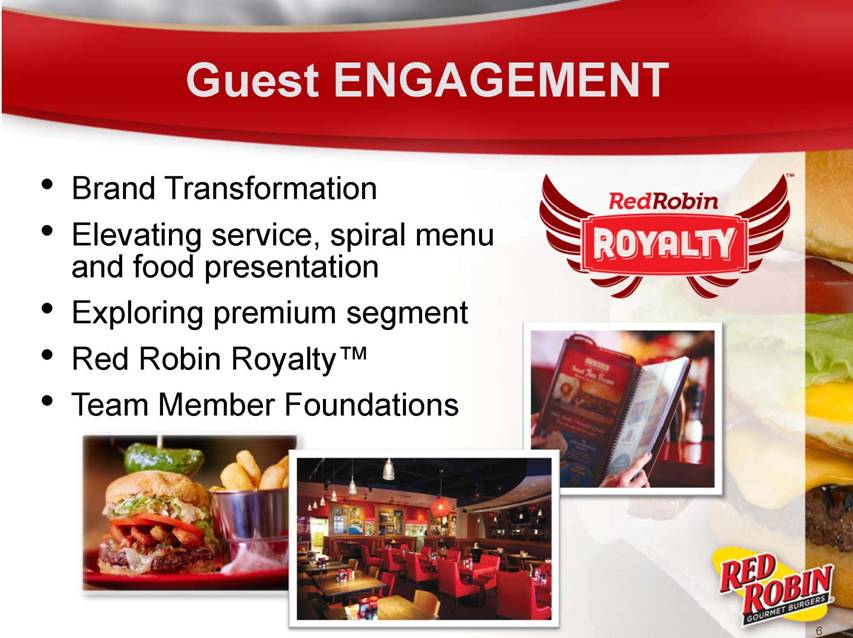
Guest ENGAGEMENT Brand Transformation Elevating service, spiral menu and food presentation Exploring premium segment Red Robin Royalty™ Team Member Foundations 6 |
|
|
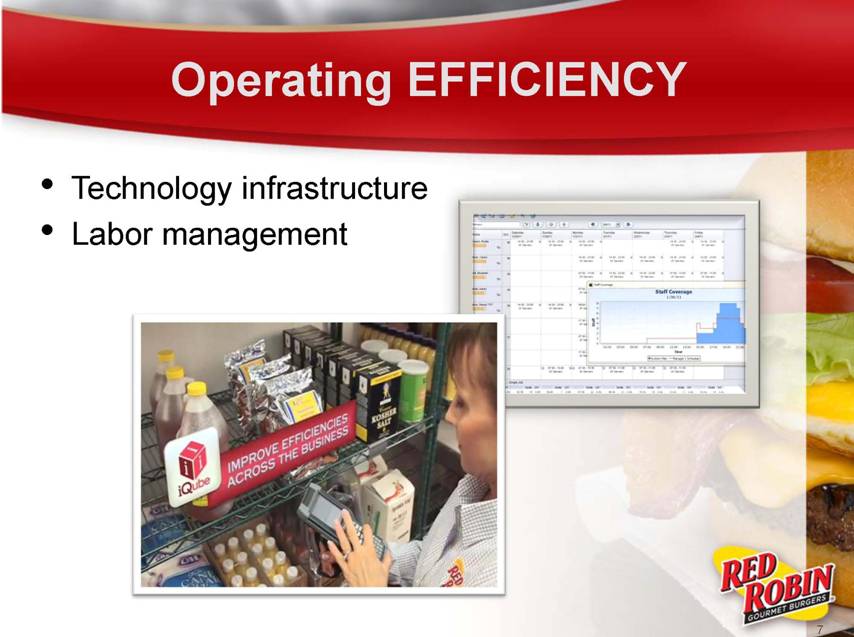
Operating EFFICIENCY Technology infrastructure Labor management 7 |
|
|
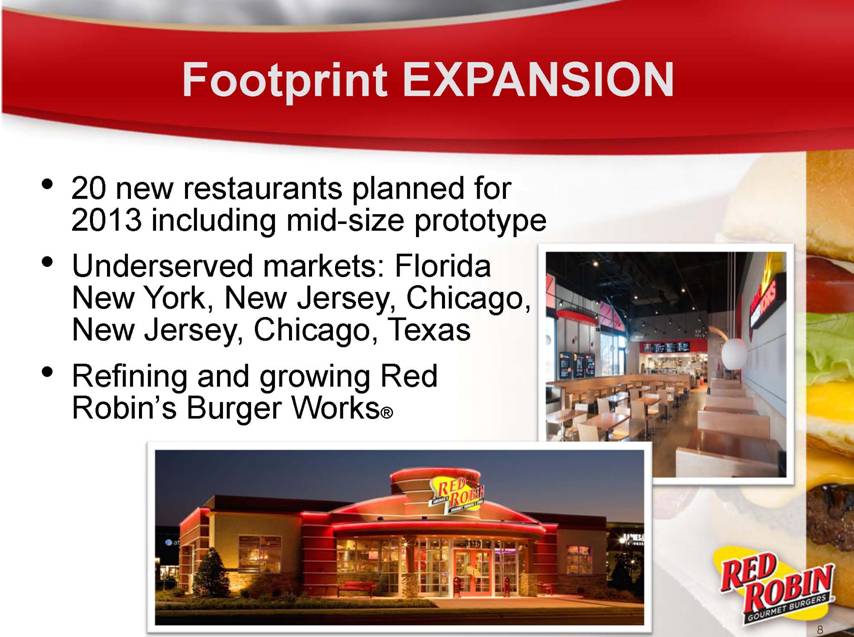
Footprint EXPANSION 20 new restaurants planned for 2013 including mid-size prototype Underserved markets: Florida New York, New Jersey, Chicago, New Jersey, Chicago, Texas Refining and growing Red Robin’s Burger Works® 8 |
|
|
Financial Update |
|
|
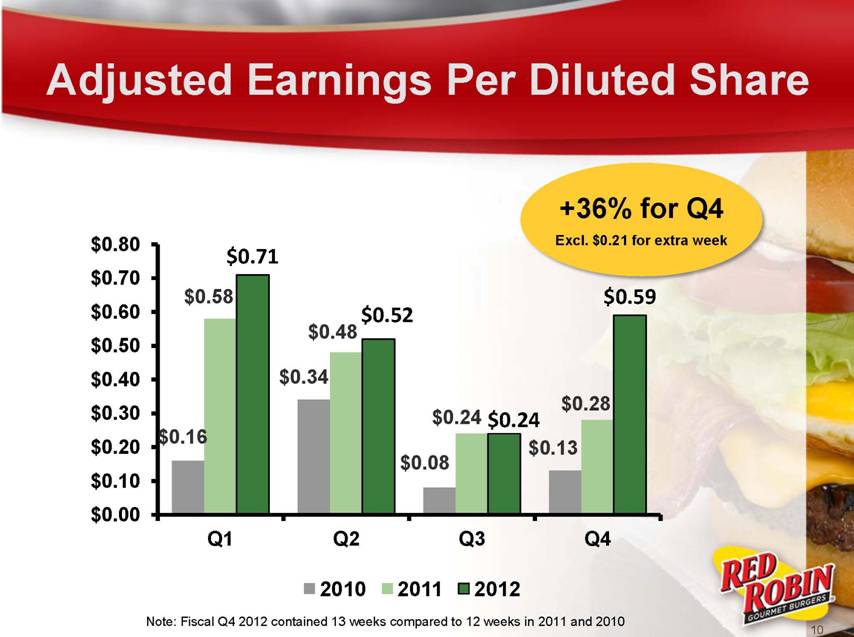
$0.16 $0.34 $0.08 $0.13 $0.58 $0.48 $0.24 $0.28 $0.71 $0.52 $0.24 $0.59 $0.00 $0.10 $0.20 $0.30 $0.40 $0.50 $0.60 $0.70 $0.80 Q1 Q2 Q3 Q4 2010 2011 2012 Adjusted Earnings Per Diluted Share +36% for Q4 Excl. $0.21 for extra week Note: Fiscal Q4 2012 contained 13 weeks compared to 12 weeks in 2011 and 2010 |
|
|
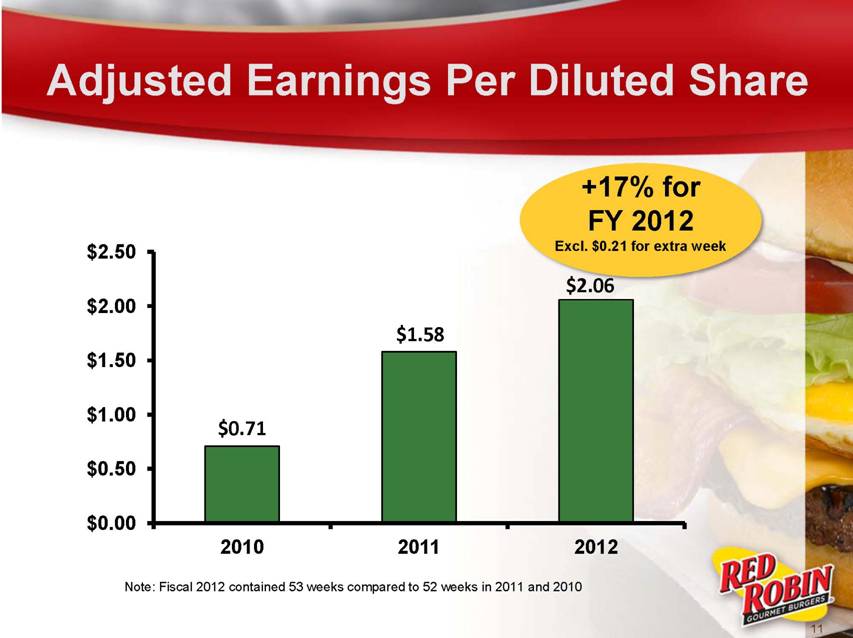
Adjusted Earnings Per Diluted Share $0.71 $1.58 $2.06 $0.00 $0.50 $1.00 $1.50 $2.00 $2.50 2010 2011 2012 Note: Fiscal 2012 contained 53 weeks compared to 52 weeks in 2011 and 2010 +17% for FY 2012 Excl. $0.21 for extra week |
|
|
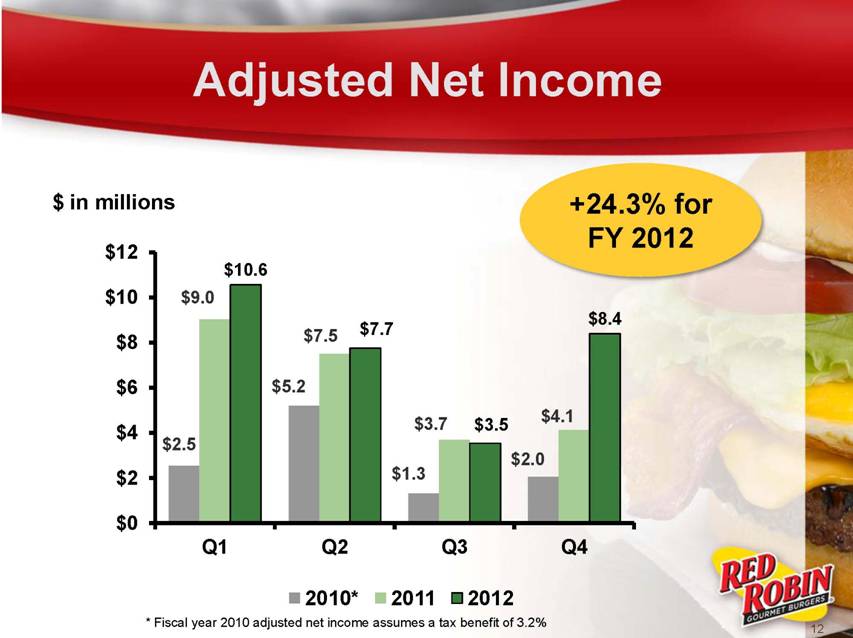
Adjusted Net Income $2.5 $5.2 $1.3 $2.0 $9.0 $7.5 $3.7 $4.1 $10.6 $7.7 $3.5 $8.4 $0 $2 $4 $6 $8 $10 $12 Q1 Q2 Q3 Q4 2010* 2011 2012 $ in millions * Fiscal year 2010 adjusted net income assumes a tax benefit of 3.2% +24.3% for FY 2012 |
|
|
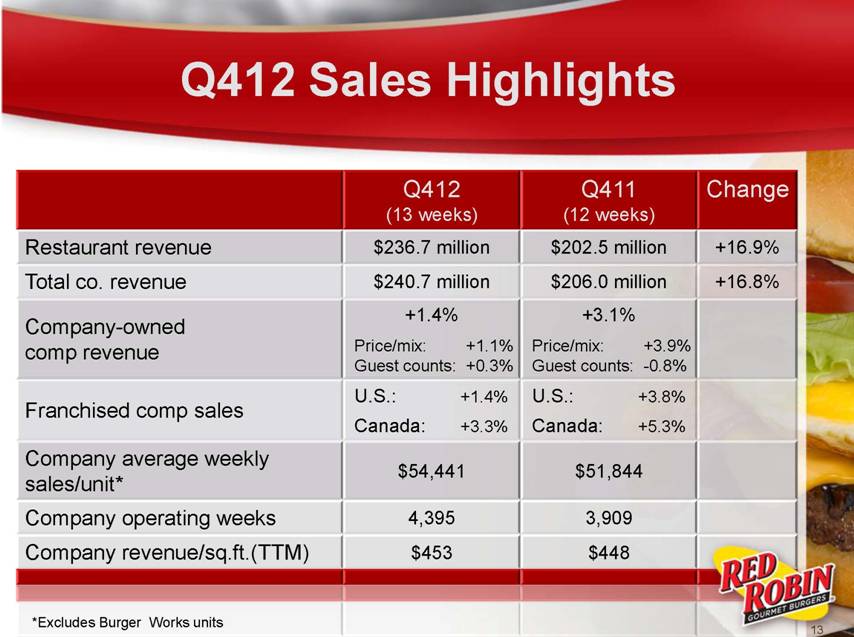
Q412 Sales Highlights Q412 Q411 Change (13 weeks) (12 weeks) Restaurant revenue $236.7 million $202.5 million +16.9% Total co. revenue $240.7 million $206.0 million +16.8% +1.4% +3.1% Company-owned comp revenue Price/mix: +1.1% Guest counts: +0.3% Price/mix: +3.9% Guest counts: -0.8% U.S.: +1.4% U.S.: +3.8% Franchised comp sales Canada: +3.3% Canada: +5.3% Company average weekly sales/unit* $54,441 $51,844 Company operating weeks 4,395 3,909 Company revenue/sq.ft.(TTM) $453 $448 *Excludes Burger Works units |
|
|
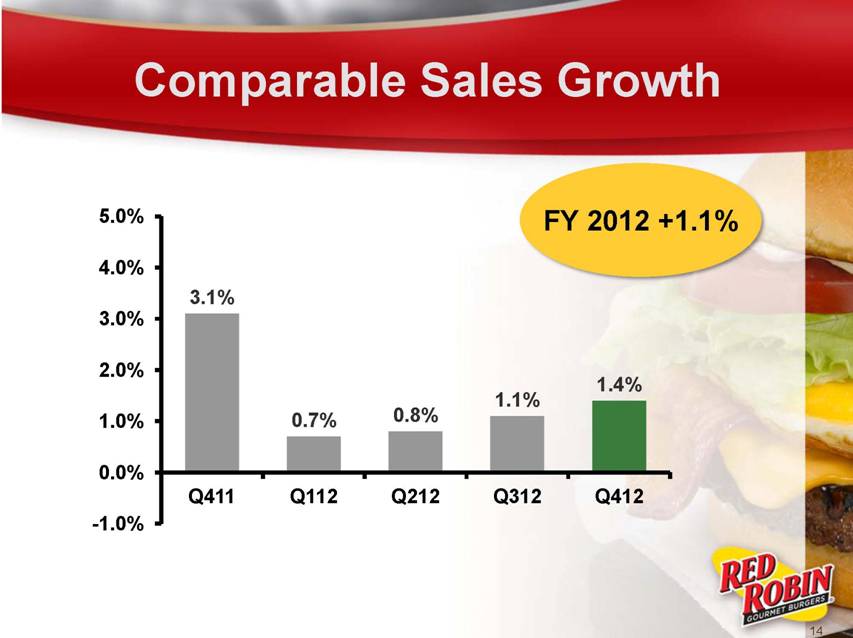
Comparable Sales Growth 3.1% 0.7% 0.8% 1.1% 1.4% -1.0% 0.0% 1.0% 2.0% 3.0% 4.0% 5.0% Q411 Q112 Q212 Q312 Q412 FY 2012 +1.1% |
|
|
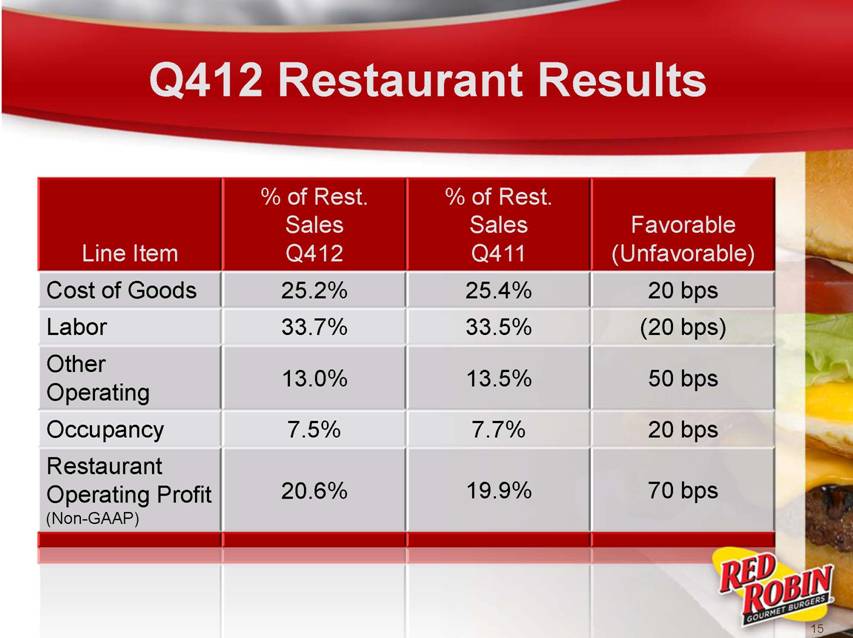
Q412 Restaurant Results % of Rest. % of Rest. Sales Sales Favorable Line Item Q412 Q411 (Unfavorable) Cost of Goods 25.2% 25.4% 20 bps Labor 33.7% 33.5% (20 bps) Other Operating 13.0% 13.5% 50 bps Occupancy 7.5% 7.7% 20 bps Restaurant Operating Profit 20.6% 19.9% 70 bps (Non-GAAP) |
|
|
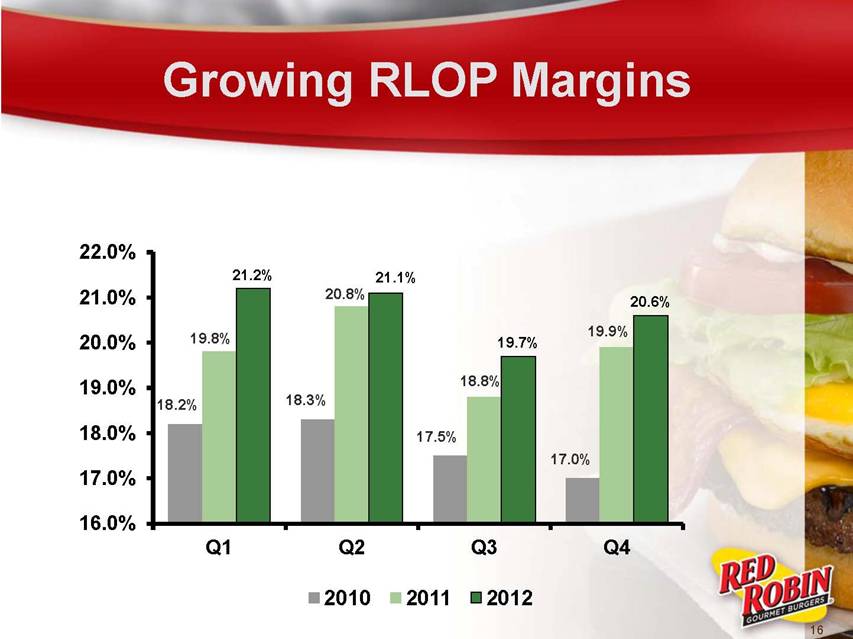
Growing RLOP Margins 18.2% 18.3% 17.5% 17.0% 19.8% 20.8% 18.8% 19.9% 21.2% 21.1% 19.7% 20.6% 16.0% 17.0% 18.0% 19.0% 20.0% 21.0% 22.0% Q1 Q2 Q3 Q4 2010 2011 2012 |
|
|
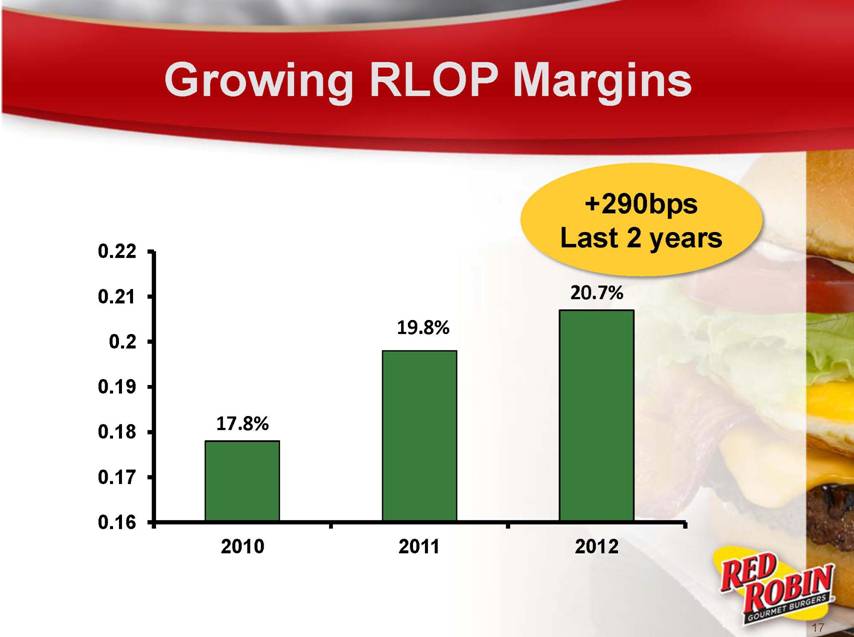
Growing RLOP Margins 17.8% 19.8% 20.7% 0.16 0.17 0.18 0.19 0.2 0.21 0.22 2010 2011 2012 +290bps Last 2 years 17 |
|
|
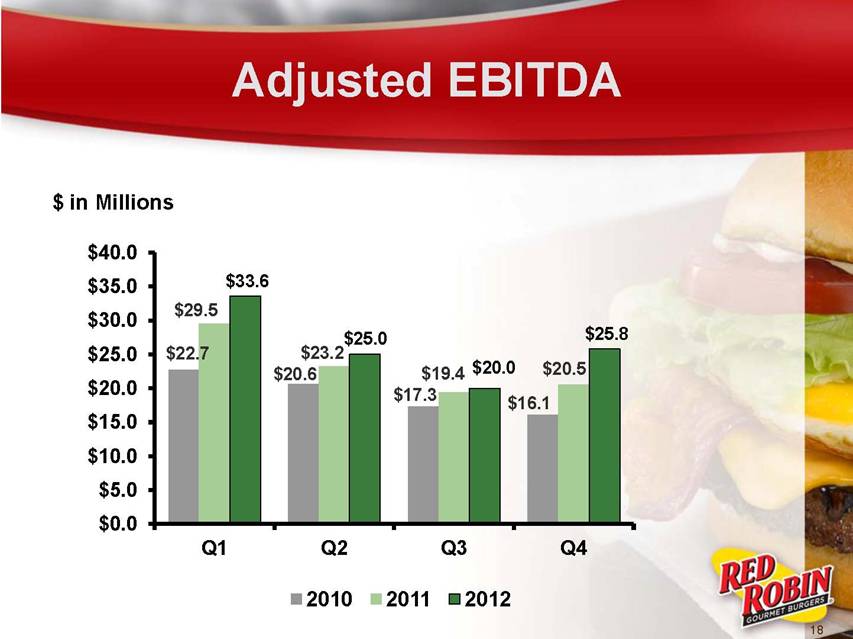
Adjusted EBITDA $22.7 $20.6 $17.3 $16.1 $29.5 $23.2 $19.4 $20.5 $33.6 $25.0 $20.0 $25.8 $0.0 $5.0 $10.0 $15.0 $20.0 $25.0 $30.0 $35.0 $40.0 Q1 Q2 Q3 Q4 2010 2011 2012 $ in Millions 18 |
|
|
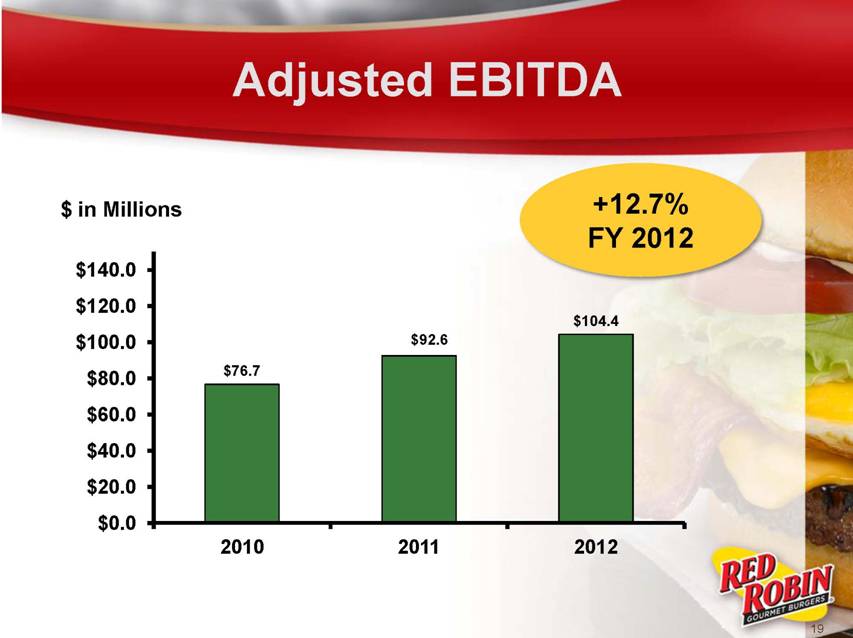
Adjusted EBITDA $76.7 $92.6 $104.4 $0.0 $20.0 $40.0 $60.0 $80.0 $100.0 $120.0 $140.0 2010 2011 2012 +12.7% FY 2012 $ in Millions 19 |
|
|
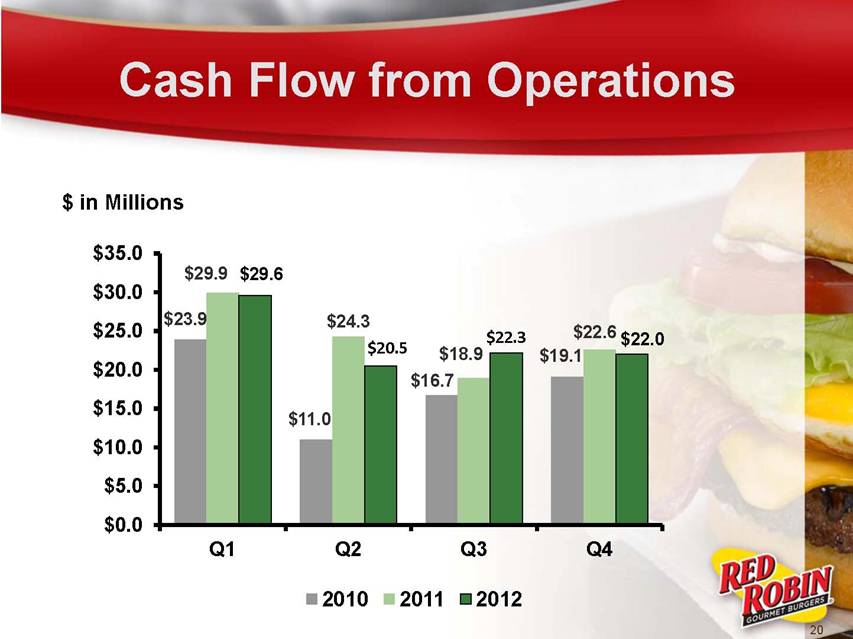
Cash Flow from Operations $ in Millions $23.9 $11.0 $16.7 $19.1 $29.9 $24.3 $18.9 $22.6 $29.6 $20.5 $22.3 $22.0 $0.0 $5.0 $10.0 $15.0 $20.0 $25.0 $30.0 $35.0 Q1 Q2 Q3 Q4 2010 2011 2012 20 |
|
|
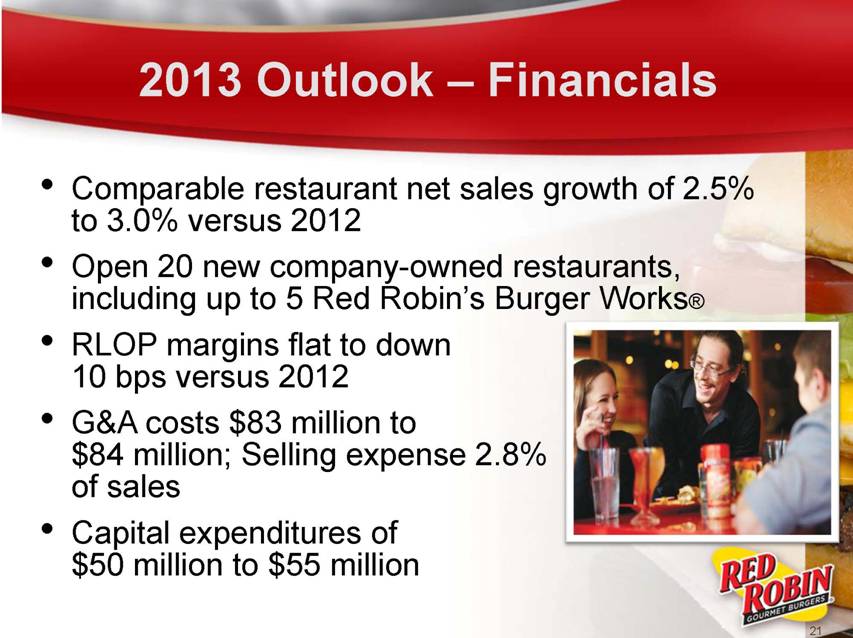
2013 Outlook – Financials Comparable restaurant net sales growth of 2.5% to 3.0% versus 2012 Open 20 new company-owned restaurants, including up to 5 Red Robin’s Burger Works® RLOP margins flat to down 10 bps versus 2012 G&A costs $83 million to $84 million; Selling expense 2.8% of sales Capital expenditures of $50 million to $55 million 21 |
|
|
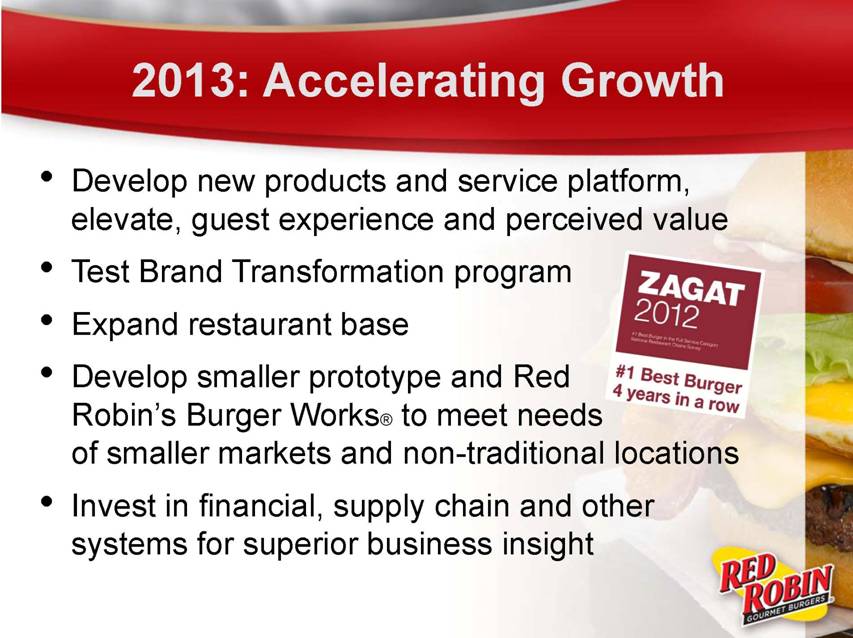
2013: Accelerating Growth Develop new products and service platform, elevate, guest experience and perceived value Test Brand Transformation program Expand restaurant base Develop smaller prototype and Red Robin’s Burger Works® to meet needs of smaller markets and non-traditional locations Invest in financial, supply chain and other systems for superior business insight |
|
|
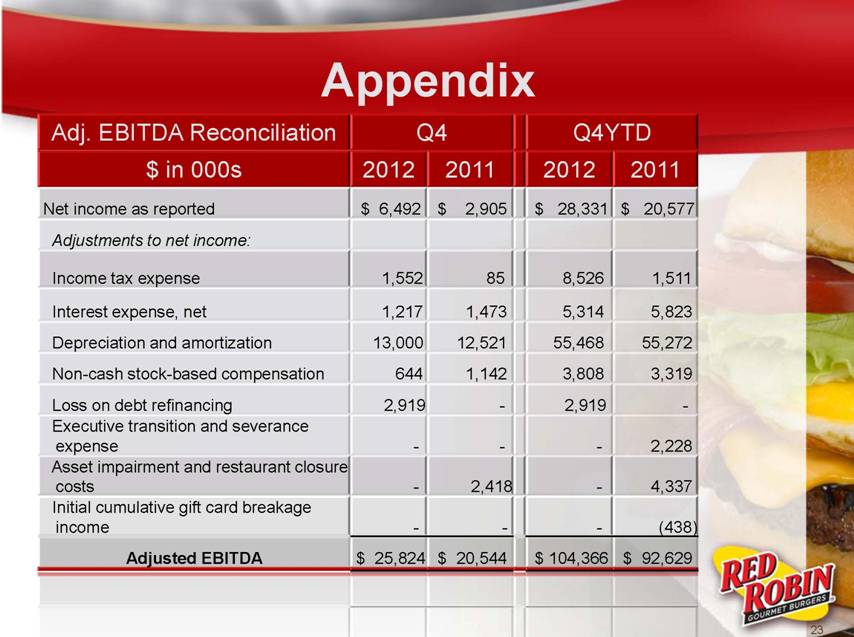
Appendix Adj. EBITDA Reconciliation Q4 Q4YTD $ in 000s 2012 2011 2012 2011 Net income as reported $ 6,492 $ 2,905 $ 28,331 $ 20,577 Adjustments to net income: Income tax expense 1,552 85 8,526 1,511 Interest expense, net 1,217 1,473 5,314 5,823 Depreciation and amortization 13,000 12,521 55,468 55,272 Non-cash stock-based compensation 644 1,142 3,808 3,319 Loss on debt refinancing 2,919 -2,919 -Executive transition and severance expense ---2,228 Asset impairment and restaurant closure costs -2,418 -4,337 Initial cumulative gift card breakage income ---(438) Adjusted EBITDA $ 25,824 $ 20,544 $ 104,366 $ 92,629 23 |
|
|
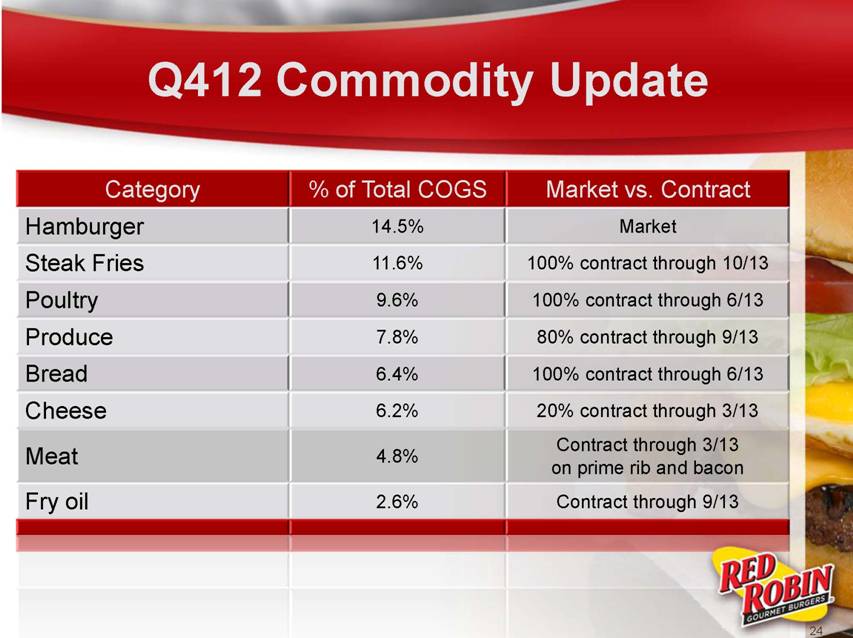
Q412 Commodity Update Category % of Total COGS Market vs. Contract Hamburger 14.5% Market Steak Fries 11.6% 100% contract through 10/13 Poultry 9.6% 100% contract through 6/13 Produce 7.8% 80% contract through 9/13 Bread 6.4% 100% contract through 6/13 Cheese 6.2% 20% contract through 3/13 Meat 4.8% Contract through 3/13 on prime rib and bacon Fry oil 2.6% Contract through 9/13 24 |