Attached files
| file | filename |
|---|---|
| 8-K - FORM 8-K - American Assets Trust, Inc. | a8-k.htm |
| EX-99.1 - PRESS RELEASE - American Assets Trust, Inc. | a4q12earningsrelease.htm |
FOURTH QUARTER 2012 | |
Supplemental Information | |
 | |
Investor and Media Contact | |
American Assets Trust | |
Robert F. Barton | |
Executive Vice President and Chief Financial Officer | |
858-350-2607 | |
| |
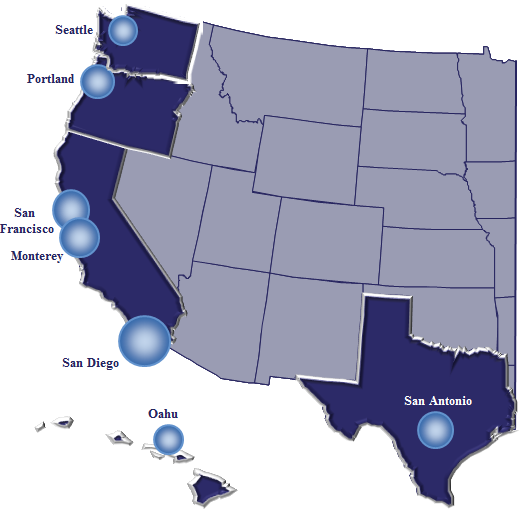
American Asset Trust, Inc.'s Portfolio is concentrated in high-barrier-to-entry markets
with favorable supply/demand characteristics
 | ||||||||||||||||
Retail | Office | Multifamily | Mixed-Use | |||||||||||||
Market | Square Feet | Square Feet | Units | Square Feet | Suites | |||||||||||
San Diego | 1,217,923 | 668,869 | 922 | (1) | — | — | ||||||||||
San Francisco | 35,156 | 519,548 | — | — | — | |||||||||||
Oahu | 549,494 | — | — | 96,707 | 369 | |||||||||||
Monterey | 676,571 | — | — | — | — | |||||||||||
San Antonio | 589,501 | — | — | — | — | |||||||||||
Portland | — | 966,642 | — | — | — | |||||||||||
Seattle | — | 490,508 | — | — | — | |||||||||||
Total | 3,068,645 | 2,645,567 | 922 | 96,707 | 369 | |||||||||||
Square Feet | % | |||||||
Note: Circled areas represent all markets in which American Assets Trust, Inc. (the "Company") currently owns and operates its real estate assets. Size of circle denotes approximation of square feet / units. | Retail | 3.1 | million | 54% | ||||
Office | 2.6 | million | 46% | |||||
Data is as of December 31, 2012. | Totals | 5.7 | million | |||||
(1) Includes 122 RV spaces. | ||||||||
Fourth Quarter 2012 Supplemental Information | Page 2 |
INDEX | |
FOURTH QUARTER 2012 SUPPLEMENTAL INFORMATION | ||
1. | FINANCIAL HIGHLIGHTS | |
Consolidated Balance Sheets | ||
Consolidated Statements of Income | ||
Funds From Operations (FFO), FFO As Adjusted & Funds Available for Distribution | ||
Corporate Guidance | ||
Same-Store Portfolio Net Operating Income (NOI) | ||
Same-Store Portfolio NOI Comparison | ||
NOI By Region | ||
NOI Breakdown | ||
Property Revenue and Operating Expenses | ||
Segment Capital Expenditures | ||
Summary of Outstanding Debt | ||
Market Capitalization | ||
Summary of Redevelopment Opportunities | ||
2. | PORTFOLIO DATA | |
Property Report | ||
Retail Leasing Summary | ||
Office Leasing Summary | ||
Multifamily Leasing Summary | ||
Mixed-Use Leasing Summary | ||
Lease Expirations | ||
Portfolio Leased Statistics | ||
Top Tenants - Retail | ||
Top Tenants - Office | ||
3. | APPENDIX | |
Glossary of Terms | ||
This Supplemental Information contains forward-looking statements within the meaning of the Private Securities Litigation Reform Act of 1995 (set forth in Section 27A of the Securities Act of 1933, as amended, or the Securities Act, and Section 21E of the Securities Exchange Act of 1934, as amended, or the Exchange Act). Forward-looking statements involve numerous risks and uncertainties and you should not rely on them as predictions of future events. Forward-looking statements depend on assumptions, data or methods which may be incorrect or imprecise and we may not be able to realize them. We do not guarantee that the transactions and events described will happen as described (or that they will happen at all). The following factors, among others, could cause actual results and future events to differ materially from those set forth or contemplated in the forward-looking statements: adverse economic or real estate developments in our markets; our failure to generate sufficient cash flows to service our outstanding indebtedness; defaults on, early terminations of or non-renewal of leases by tenants, including significant tenants; difficulties in identifying properties to acquire and completing acquisitions; difficulties in completing dispositions; our failure to successfully operate acquired properties and operations; our inability to develop or redevelop our properties due to market conditions; fluctuations in interest rates and increased operating costs; risks related to joint venture arrangements; our failure to obtain necessary outside financing; on-going litigation; general economic conditions; financial market fluctuations; risks that affect the general retail, office, multifamily and mixed-use environment; the competitive environment in which we operate; decreased rental rates or increased vacancy rates; conflicts of interests with our officers or directors; lack or insufficient amounts of insurance; environmental uncertainties and risks related to adverse weather conditions and natural disasters; other factors affecting the real estate industry generally; limitations imposed on our business and our ability to satisfy complex rules in order for us to continue to qualify as a REIT for U.S. federal income tax purposes; and changes in governmental regulations or interpretations thereof, such as real estate and zoning laws and increases in real property tax rates and taxation of REITs.
While forward-looking statements reflect our good faith beliefs, they are not guarantees of future performance. We disclaim any obligation to publicly update or revise any forward-looking statement to reflect changes in underlying assumptions or factors, or new information, data or methods, future events or other changes. For a further discussion of these and other factors that could impact our future results, refer to our most recent Annual Report on Form 10-K and other risks described in documents subsequently filed by us from time to time with the Securities and Exchange Commission.
Fourth Quarter 2012 Supplemental Information | Page 3 |
| |
FINANCIAL HIGHLIGHTS
Fourth Quarter 2012 Supplemental Information | Page 4 |
CONSOLIDATED BALANCE SHEETS | |
(Amounts in thousands, except shares and per share data) | December 31, 2012 | December 31, 2011 | |||||
ASSETS | |||||||
Real estate, at cost | |||||||
Operating real estate | $ | 1,891,549 | $ | 1,600,643 | |||
Construction in progress | 32,183 | 3,495 | |||||
Held for development | 14,944 | 24,675 | |||||
1,938,676 | 1,628,813 | ||||||
Accumulated depreciation | (270,494 | ) | (224,867 | ) | |||
Net real estate | 1,668,182 | 1,403,946 | |||||
Cash and cash equivalents | 42,479 | 112,723 | |||||
Restricted cash | 7,421 | 8,978 | |||||
Marketable securities | — | 28,235 | |||||
Accounts receivable, net | 6,440 | 6,810 | |||||
Deferred rent | 29,395 | 22,344 | |||||
Other assets, net | 73,670 | 74,424 | |||||
Assets of discontinued operations | — | 51,821 | |||||
TOTAL ASSETS | $ | 1,827,587 | $ | 1,709,281 | |||
LIABILITIES AND EQUITY | |||||||
LIABILITIES: | |||||||
Secured notes payable | $ | 1,044,682 | $ | 912,067 | |||
Accounts payable and accrued expenses | 29,509 | 24,805 | |||||
Security deposits payable | 4,856 | 4,091 | |||||
Other liabilities and deferred credits | 62,811 | 55,579 | |||||
Liabilities of discontinued operations | — | 33,011 | |||||
Total liabilities | 1,141,858 | 1,029,553 | |||||
Commitments and contingencies | |||||||
EQUITY: | |||||||
American Assets Trust, Inc. stockholders' equity | |||||||
Common stock $0.01 par value, 490,000,000 shares authorized, 39,664,212 and 39,283,796 shares outstanding at December 31, 2012 and December 31, 2011, respectively | 397 | 393 | |||||
Additional paid in capital | 663,589 | 653,645 | |||||
Accumulated dividends in excess of net income | (25,625 | ) | (28,007 | ) | |||
Total American Assets Trust, Inc. stockholders' equity | 638,361 | 626,031 | |||||
Noncontrolling interests | 47,368 | 53,697 | |||||
Total equity | 685,729 | 679,728 | |||||
TOTAL LIABILITIES AND EQUITY | $ | 1,827,587 | $ | 1,709,281 | |||
Fourth Quarter 2012 Supplemental Information | Page 5 |
CONSOLIDATED STATEMENTS OF INCOME | |
(Amounts in thousands, except shares and per share data) | Three Months Ended | Year Ended | |||||||||||||
December 31, | December 31, | ||||||||||||||
2012 | 2011 | 2012 | 2011 | ||||||||||||
REVENUE: | |||||||||||||||
Rental income | $ | 60,191 | $ | 51,458 | $ | 225,249 | $ | 194,168 | |||||||
Other property income | 2,929 | 2,380 | 10,217 | 8,617 | |||||||||||
Total revenue | 63,120 | 53,838 | 235,466 | 202,785 | |||||||||||
EXPENSES: | |||||||||||||||
Rental expenses | 17,287 | 16,723 | 64,089 | 58,133 | |||||||||||
Real estate taxes | 4,947 | 4,549 | 22,025 | 18,746 | |||||||||||
General and administrative | 4,063 | 3,091 | 15,593 | 13,627 | |||||||||||
Depreciation and amortization | 16,576 | 15,293 | 61,853 | 55,936 | |||||||||||
Total operating expenses | 42,873 | 39,656 | 163,560 | 146,442 | |||||||||||
OPERATING INCOME | 20,247 | 14,182 | 71,906 | 56,343 | |||||||||||
Interest expense | (15,152 | ) | (14,236 | ) | (57,328 | ) | (54,580 | ) | |||||||
Early extinguishment of debt | — | — | — | (25,867 | ) | ||||||||||
Loan transfer and consent fees | — | — | — | (8,808 | ) | ||||||||||
Gain on acquisition | — | — | — | 46,371 | |||||||||||
Other income (expense), net | (273 | ) | 614 | (629 | ) | 212 | |||||||||
INCOME FROM CONTINUING OPERATIONS | 4,822 | 560 | 13,949 | 13,671 | |||||||||||
DISCONTINUED OPERATIONS | |||||||||||||||
Income from discontinued operations | 279 | 95 | 932 | 1,672 | |||||||||||
Gain on sale of real estate property | 36,720 | — | 36,720 | 3,981 | |||||||||||
Results from discontinued operations | 36,999 | 95 | 37,652 | 5,653 | |||||||||||
NET INCOME | 41,821 | 655 | 51,601 | 19,324 | |||||||||||
Net income attributable to restricted shares | (133 | ) | (132 | ) | (529 | ) | (482 | ) | |||||||
Net loss attributable to Predecessor's noncontrolling interests in consolidated real estate entities | — | — | — | 2,458 | |||||||||||
Net income attributable to Predecessor's controlled owners' equity | — | — | — | (16,995 | ) | ||||||||||
Net income attributable to unitholders in the Operating Partnership | (13,111 | ) | (179 | ) | (16,133 | ) | (1,388 | ) | |||||||
NET INCOME ATTRIBUTABLE TO AMERICAN ASSETS TRUST, INC. STOCKHOLDERS | $ | 28,577 | $ | 344 | $ | 34,939 | $ | 2,917 | |||||||
Basic net income (loss) from continuing operations attributable to common stockholders per share | $ | 0.08 | $ | 0.01 | $ | 0.24 | $ | (0.02 | ) | ||||||
Basic net income from discontinued operations attributable to common stockholders per share | 0.65 | — | 0.66 | 0.10 | |||||||||||
Basic net income attributable to common stockholders per share | $ | 0.73 | $ | 0.01 | $ | 0.90 | $ | 0.08 | |||||||
Weighted average shares of common stock outstanding - basic | 38,952,816 | 38,655,084 | 38,736,113 | 36,748,806 | |||||||||||
Diluted net income (loss) from continuing operations attributable to common stockholders per share | $ | 0.08 | $ | 0.01 | $ | 0.24 | $ | (0.02 | ) | ||||||
Diluted net income (loss) from discontinued operations attributable to common stockholders per share | 0.65 | — | 0.66 | 0.10 | |||||||||||
Diluted net income attributable to common stockholders per share | $ | 0.73 | $ | 0.01 | $ | 0.90 | $ | 0.08 | |||||||
Weighted average shares of common stock outstanding - diluted | 57,054,425 | 57,051,173 | 57,053,909 | 54,219,807 | |||||||||||
Fourth Quarter 2012 Supplemental Information | Page 6 |
FUNDS FROM OPERATIONS, FFO AS ADJUSTED & FUNDS AVAILABLE FOR DISTRIBUTION | |
(Amounts in thousands, except share and per share data) | Three Months Ended | Year Ended | |||||||||||||
December 31, | December 31, | ||||||||||||||
2012 | 2011 | 2012 | 2011 | ||||||||||||
Funds from Operations (FFO) (1) | |||||||||||||||
Net income | $ | 41,821 | $ | 655 | $ | 51,601 | $ | 19,324 | |||||||
Depreciation and amortization of real estate assets (2) | 16,656 | 15,723 | 63,011 | 58,543 | |||||||||||
Depreciation and amortization on unconsolidated real estate joint ventures (pro rata) | — | — | — | 688 | |||||||||||
Gain on sale of real estate | (36,720 | ) | — | (36,720 | ) | (3,981 | ) | ||||||||
FFO, as defined by NAREIT | 21,757 | 16,378 | 77,892 | 74,574 | |||||||||||
Less: FFO attributable to Predecessor's controlled and noncontrolled owners' equity | — | — | — | (16,973 | ) | ||||||||||
Less: Nonforfeitable dividends on incentive stock awards | (88 | ) | (89 | ) | (354 | ) | (316 | ) | |||||||
FFO attributable to common stock and common units | $ | 21,669 | $ | 16,289 | $ | 77,538 | $ | 57,285 | |||||||
FFO per diluted share/unit | $ | 0.38 | $ | 0.28 | $ | 1.35 | $ | 1.05 | |||||||
Weighted average number of common shares and common units, diluted (3) | 57,266,950 | 57,258,935 | 57,262,767 | 54,417,123 | |||||||||||
FFO As Adjusted (1) | |||||||||||||||
FFO | $ | 21,757 | $ | 16,378 | $ | 77,892 | $ | 74,574 | |||||||
Early extinguishment of debt | — | — | — | 25,867 | |||||||||||
Loan transfer and consent fees | — | — | — | 9,019 | |||||||||||
Gain on acquisition of controlling interests (4) | — | — | — | (46,371 | ) | ||||||||||
FFO As Adjusted | 21,757 | 16,378 | 77,892 | 63,089 | |||||||||||
Less: FFO As Adjusted attributable to Predecessor's controlled and noncontrolled owners' equity | — | — | — | (2,462 | ) | ||||||||||
Less: Nonforfeitable dividends on incentive stock awards | (88 | ) | (89 | ) | (354 | ) | (316 | ) | |||||||
FFO As Adjusted attributable to common stock and units | $ | 21,669 | $ | 16,289 | $ | 77,538 | $ | 60,311 | |||||||
FFO As Adjusted per diluted share/unit | $ | 0.38 | $ | 0.28 | $ | 1.35 | $ | 1.11 | |||||||
Weighted average number of common shares and units, diluted (3) | 57,266,950 | 57,258,935 | 57,262,767 | 54,417,123 | |||||||||||
Dividends | |||||||||||||||
Dividends declared and paid | $ | 12,114 | $ | 12,113 | $ | 48,452 | $ | 46,123 | |||||||
Dividends declared and paid per share/unit | $ | 0.21 | $ | 0.21 | $ | 0.84 | $ | 0.80 | |||||||
Fourth Quarter 2012 Supplemental Information | Page 7 |
FUNDS FROM OPERATIONS, FFO AS ADJUSTED & FUNDS AVAILABLE FOR DISTRIBUTION (CONTINUED) | |
(Amounts in thousands, except share and per share data) | Three Months Ended | Year Ended | |||||||||||||
December 31, | December 31, | ||||||||||||||
2012 | 2011 | 2012 | 2011 | ||||||||||||
Funds Available for Distribution (FAD) (1) | |||||||||||||||
FFO As Adjusted | $ | 21,757 | $ | 16,378 | $ | 77,892 | $ | 63,089 | |||||||
Adjustments: | |||||||||||||||
Tenant improvements, leasing commissions and maintenance capital expenditures (5) | (8,040 | ) | (4,674 | ) | (30,898 | ) | (11,199 | ) | |||||||
Net effect of straight-line rents (6) | (2,125 | ) | (694 | ) | (7,580 | ) | (3,778 | ) | |||||||
Amortization of net above (below) market rents (7) | (254 | ) | 506 | 237 | 1,117 | ||||||||||
Net effect of other lease intangibles (8) | 71 | (482 | ) | 268 | 584 | ||||||||||
Amortization of debt issuance costs and debt fair value adjustment | 983 | 1,018 | 3,911 | 3,883 | |||||||||||
Non-cash compensation expense | 724 | 713 | 2,852 | 2,615 | |||||||||||
Unrealized (gains) losses on marketable securities | — | (128 | ) | 538 | (125 | ) | |||||||||
Loss on sale of marketable securities | — | — | 121 | — | |||||||||||
Nonforfeitable dividends on incentive stock awards | (88 | ) | (89 | ) | (354 | ) | (316 | ) | |||||||
Adjustments related to discontinued operations | (303 | ) | (199 | ) | (1,313 | ) | (544 | ) | |||||||
FAD | $ | 12,725 | $ | 12,349 | $ | 45,674 | $ | 55,326 | |||||||
Summary of Capital Expenditures | |||||||||||||||
Tenant improvements and leasing commissions (5) | $ | 5,804 | $ | 2,753 | $ | 24,032 | $ | 6,635 | |||||||
Maintenance capital expenditures | 2,236 | 1,921 | 6,866 | 4,564 | |||||||||||
$ | 8,040 | $ | 4,674 | $ | 30,898 | $ | 11,199 | ||||||||
Notes:
(1) | See Glossary of Terms. |
(2) | The year ended December 31, 2012 includes depreciation and amortization on 160 King Street, which was sold on December 4, 2012. The year ended December 31, 2011 includes depreciation and amortization on 160 King Street and Valencia Corporate Center, which was sold on August 30, 2011. 160 King Street and Valencia Corporate Center are classified as discontinued operations. |
(3) | For the years ended December 31, 2012 and 2011, the weighted average common shares and common units used to compute FFO and FFO As Adjusted per diluted share/unit include operating partnership common units and unvested restricted stock awards that are subject to time vesting. The shares/units used to compute FFO and FFO As Adjusted per diluted share/unit include additional shares/units which were excluded from the computation of diluted EPS, as they were anti-dilutive for the periods presented. |
(4) | Represents the gain recognized upon acquisition of the outside ownership interests in the Solana Beach Centre entities and the Waikiki Beach Walk entities on January 19, 2011, in which we previously held a noncontrolling interest. |
(5) | Includes $6.1 million of tenant improvements related to salesforce.com, which was identified during the IPO as a Use of Proceeds. |
(6) | Represents the straight-line rent income recognized during the period offset by cash received during the period and the provision for bad debts recorded for deferred rent receivable balances. |
(7) | Represents the adjustment related to the acquisition of buildings with above (below) market rents. |
(8) | Represents adjustments related to amortization of lease incentives paid to tenants and amortization of lease intangibles and straight-line rent expense for our leases of the Annex at The Landmark at One Market and retail space at Waikiki Beach Walk - Retail. |
Fourth Quarter 2012 Supplemental Information | Page 8 |
CORPORATE GUIDANCE | |
(Unaudited, amounts in thousands, except share and per share data) | ||||||||
2013 Guidance Range (1) | ||||||||
Funds from Operations (FFO) | ||||||||
Net income | $ | 15,220 | $ | 20,054 | ||||
Depreciation and amortization of real estate assets | 64,040 | 64,040 | ||||||
FFO, as defined by NAREIT | 79,260 | 84,094 | ||||||
Less: Nonfortfeitable dividends on incentive stock awards | (352 | ) | (352 | ) | ||||
FFO attributable to common stock and units | $ | 78,908 | $ | 83,742 | ||||
Weighted average number of common shares and units, diluted | 57,270,283 | 57,270,283 | ||||||
FFO per diluted share | $ | 1.38 | $ | 1.46 | ||||
Notes:
(1) | The Company's guidance excludes any impact from future acquisitions, dispositions, equity issuances or repurchases, debt financings or repayments. |
These estimates are forward-looking and reflect management's view of current and future market conditions, including certain assumptions with respect to leasing activity, rental rates, occupancy levels, interest rates and the amount and timing of acquisition and development activities. Our actual results may differ materially from these estimates.
Fourth Quarter 2012 Supplemental Information | Page 9 |
SAME-STORE PORTFOLIO NET OPERATING INCOME (NOI) | |
(Amounts in thousands) | Three Months Ended December 31, 2012 | ||||||||||||||||||
Retail | Office | Multifamily | Mixed-Use | Total | |||||||||||||||
Real estate rental revenue | |||||||||||||||||||
Same-store portfolio | $ | 24,104 | $ | 16,881 | $ | 3,895 | $ | 12,471 | $ | 57,351 | |||||||||
Non-same store portfolio (1) | 50 | 5,719 | — | — | 5,769 | ||||||||||||||
Total | 24,154 | 22,600 | 3,895 | 12,471 | 63,120 | ||||||||||||||
Real estate expenses | |||||||||||||||||||
Same-store portfolio | 6,277 | 4,876 | 1,477 | 8,100 | 20,730 | ||||||||||||||
Non-same store portfolio (1) | 30 | 1,474 | — | — | 1,504 | ||||||||||||||
Total | 6,307 | 6,350 | 1,477 | 8,100 | 22,234 | ||||||||||||||
Net Operating Income (NOI), GAAP basis | |||||||||||||||||||
Same-store portfolio | 17,827 | 12,005 | 2,418 | 4,371 | 36,621 | ||||||||||||||
Non-same store portfolio (1) | 20 | 4,245 | — | — | 4,265 | ||||||||||||||
Total | $ | 17,847 | $ | 16,250 | $ | 2,418 | $ | 4,371 | $ | 40,886 | |||||||||
Same-store portfolio NOI, GAAP basis | $ | 17,827 | $ | 12,005 | $ | 2,418 | $ | 4,371 | $ | 36,621 | |||||||||
Net effect of straight-line rents (2) | 44 | (519 | ) | — | (92 | ) | (567 | ) | |||||||||||
Amortization of net above (below) market rents (3) | (195 | ) | 198 | — | 226 | 229 | |||||||||||||
Net effect of other lease intangibles (4) | — | 85 | — | (14 | ) | 71 | |||||||||||||
Same-store portfolio NOI, cash basis | $ | 17,676 | $ | 11,769 | $ | 2,418 | $ | 4,491 | $ | 36,354 | |||||||||
Notes:
(1) | Same-store portfolio and non-same store portfolio are determined based on properties held on December 31, 2012 and December 31, 2011. See Glossary of Terms. |
(2) | Represents the straight-line rent income recognized during the period offset by cash received during the period and the provision for bad debts recorded for deferred rent receivable balances. |
(3) | Represents the adjustment related to the acquisition of buildings with above (below) market rents. |
(4) | Represents adjustments related to amortization of lease incentives paid to tenants and amortization of lease intangibles and straight-line rent expense for our lease of the Annex at The Landmark at One Market and retail space at Waikiki Beach Walk - Retail. |
Fourth Quarter 2012 Supplemental Information | Page 10 |
SAME-STORE PORTFOLIO NET OPERATING INCOME (NOI) | |
(Amounts in thousands) | Year Ended December 31, 2012 | ||||||||||||||||||
Retail | Office | Multifamily | Mixed-Use | Total | |||||||||||||||
Real estate rental revenue | |||||||||||||||||||
Same-store portfolio | $ | 82,955 | $ | 36,000 | $ | 14,852 | $ | — | $ | 133,807 | |||||||||
Non-same store portfolio (1) | 9,036 | 42,101 | — | 50,522 | 101,659 | ||||||||||||||
Total | 91,991 | 78,101 | 14,852 | 50,522 | 235,466 | ||||||||||||||
Real estate expenses | |||||||||||||||||||
Same-store portfolio | 22,850 | 11,082 | 5,914 | — | 39,846 | ||||||||||||||
Non-same store portfolio (1) | 2,105 | 12,698 | — | 31,465 | 46,268 | ||||||||||||||
Total | 24,955 | 23,780 | 5,914 | 31,465 | 86,114 | ||||||||||||||
Net Operating Income (NOI), GAAP basis | |||||||||||||||||||
Same-store portfolio | 60,105 | 24,918 | 8,938 | — | 93,961 | ||||||||||||||
Non-same store portfolio (1) | 6,931 | 29,403 | — | 19,057 | 55,391 | ||||||||||||||
Total | $ | 67,036 | $ | 54,321 | $ | 8,938 | $ | 19,057 | $ | 149,352 | |||||||||
Same-store portfolio NOI, GAAP basis | $ | 60,105 | $ | 24,918 | $ | 8,938 | $ | — | $ | 93,961 | |||||||||
Net effect of straight-line rents (2) | (715 | ) | (2,976 | ) | — | — | (3,691 | ) | |||||||||||
Amortization of net above (below) market rents (3) | 225 | (9 | ) | — | — | 216 | |||||||||||||
Net effect of other lease intangibles (4) | — | 327 | — | — | 327 | ||||||||||||||
Same-store portfolio NOI, cash basis | $ | 59,615 | $ | 22,260 | $ | 8,938 | $ | — | $ | 90,813 | |||||||||
Notes:
(1) | Same-store portfolio and non-same store portfolio are determined based on properties held on December 31, 2012 and December 31, 2011. See Glossary of Terms. |
(2) | Represents the straight-line rent income recognized during the period offset by cash received during the period and the provision for bad debts recorded for deferred rent receivable balances. |
(3) | Represents the adjustment related to the acquisition of buildings with above (below) market rents. |
(4) | Represents adjustments related to amortization of lease incentives paid to tenants and amortization of lease intangibles and straight-line rent expense for our lease of the Annex at The Landmark at One Market and retail space at Waikiki Beach Walk - Retail. |
Fourth Quarter 2012 Supplemental Information | Page 11 |
SAME-STORE PORTFOLIO NOI COMPARISON | |
(Amounts in thousands) | Three Months Ended | Year Ended | |||||||||||||||||||
December 31, | December 31, | ||||||||||||||||||||
2012 | 2011 | Change | 2012 | 2011 | Change | ||||||||||||||||
Cash Basis: | |||||||||||||||||||||
Retail | $ | 17,676 | $ | 15,526 | 13.8 | % | $ | 59,615 | $ | 57,424 | 3.8 | % | |||||||||
Office | 11,769 | 9,719 | 21.1 | 22,260 | 22,138 | 0.6 | |||||||||||||||
Multifamily | 2,418 | 2,129 | 13.6 | 8,938 | 8,743 | 2.2 | |||||||||||||||
Mixed-Use | 4,491 | 4,136 | 8.6 | — | — | — | |||||||||||||||
$ | 36,354 | $ | 31,510 | 15.4 | % | $ | 90,813 | $ | 88,305 | 2.8 | % | ||||||||||
GAAP Basis: | |||||||||||||||||||||
Retail | $ | 17,827 | $ | 14,512 | 22.8 | % | $ | 60,105 | $ | 56,038 | 7.3 | % | |||||||||
Office | 12,005 | 11,824 | 1.5 | 24,918 | 24,044 | 3.6 | |||||||||||||||
Multifamily | 2,418 | 2,129 | 13.6 | 8,938 | 8,743 | 2.2 | |||||||||||||||
Mixed-Use | 4,371 | 3,946 | 10.8 | — | — | — | |||||||||||||||
$ | 36,621 | $ | 32,411 | 13.0 | % | $ | 93,961 | $ | 88,825 | 5.8 | % | ||||||||||
Fourth Quarter 2012 Supplemental Information | Page 12 |
NOI BY REGION | |
(Amounts in thousands) | Three Months Ended December 31, 2012 | ||||||||||||||||||
Retail | Office | Multifamily | Mixed-Use | Total | |||||||||||||||
Southern California | |||||||||||||||||||
NOI, GAAP basis (1) | $ | 7,147 | $ | 4,510 | $ | 2,418 | $ | — | $ | 14,075 | |||||||||
Net effect of straight-line rents (2) | (109 | ) | (137 | ) | — | — | (246 | ) | |||||||||||
Amortization of net above (below) market rents (3) | (220 | ) | 48 | — | — | (172 | ) | ||||||||||||
Net effect of other lease intangibles | — | 104 | — | — | 104 | ||||||||||||||
NOI, cash basis | 6,818 | 4,525 | 2,418 | — | 13,761 | ||||||||||||||
Northern California | |||||||||||||||||||
NOI, GAAP basis (1) | 2,705 | 4,068 | — | — | 6,773 | ||||||||||||||
Net effect of straight-line rents (2) | (2 | ) | (489 | ) | — | — | (491 | ) | |||||||||||
Amortization of net above (below) market rents (3) | (67 | ) | (67 | ) | — | — | (134 | ) | |||||||||||
Net effect of other lease intangibles (4) | — | (19 | ) | — | — | (19 | ) | ||||||||||||
NOI, cash basis | 2,636 | 3,493 | — | — | 6,129 | ||||||||||||||
Hawaii | |||||||||||||||||||
NOI, GAAP basis (1) | 4,695 | — | — | 4,371 | 9,066 | ||||||||||||||
Net effect of straight-line rents (2) | 152 | — | — | (92 | ) | 60 | |||||||||||||
Amortization of net above (below) market rents (3) | 174 | — | — | 226 | 400 | ||||||||||||||
Net effect of other lease intangibles (4) | — | — | — | (14 | ) | (14 | ) | ||||||||||||
NOI, cash basis | 5,021 | — | — | 4,491 | 9,512 | ||||||||||||||
Oregon | |||||||||||||||||||
NOI, GAAP basis (1) | — | 4,156 | — | — | 4,156 | ||||||||||||||
Net effect of straight-line rents (2) | — | (50 | ) | — | — | (50 | ) | ||||||||||||
Amortization of net above (below) market rents (3) | — | 151 | — | — | 151 | ||||||||||||||
Net effect of other lease intangibles (4) | — | — | — | — | — | ||||||||||||||
NOI, cash basis | — | 4,257 | — | — | 4,257 | ||||||||||||||
Texas | |||||||||||||||||||
NOI, GAAP basis (1) | 3,300 | — | — | — | 3,300 | ||||||||||||||
Net effect of straight-line rents (2) | 1 | — | — | — | 1 | ||||||||||||||
Amortization of net above (below) market rents (3) | (82 | ) | — | — | — | (82 | ) | ||||||||||||
NOI, cash basis | 3,219 | — | — | — | 3,219 | ||||||||||||||
Washington | |||||||||||||||||||
NOI, GAAP basis (1) | — | 3,516 | — | — | 3,516 | ||||||||||||||
Net effect of straight-line rents (2) | — | (1,399 | ) | — | — | (1,399 | ) | ||||||||||||
Amortization of net above (below) market rents (3) | — | (417 | ) | — | — | (417 | ) | ||||||||||||
NOI, cash basis | — | 1,700 | — | — | 1,700 | ||||||||||||||
Total | |||||||||||||||||||
NOI, GAAP basis (1) | 17,847 | 16,250 | 2,418 | 4,371 | 40,886 | ||||||||||||||
Net effect of straight-line rents (2) | 42 | (2,075 | ) | — | (92 | ) | (2,125 | ) | |||||||||||
Amortization of net above (below) market rents (3) | (195 | ) | (285 | ) | — | 226 | (254 | ) | |||||||||||
Net effect of other lease intangibles (4) | — | 85 | — | (14 | ) | 71 | |||||||||||||
NOI, cash basis | $ | 17,694 | $ | 13,975 | $ | 2,418 | $ | 4,491 | $ | 38,578 | |||||||||
Notes:
(1) | See Glossary of Terms. |
(2) | Represents the straight-line rent income recognized during the period offset by cash received during the period and the provision for bad debts recorded for deferred rent receivable balances. |
(3) | Represents the adjustment related to the acquisition of buildings with above (below) market rents. |
(4) | Represents adjustments related to amortization of lease incentives paid to tenants and amortization of lease intangibles and straight-line rent expense for our leases of the Annex at The Landmark at One Market and retail space at Waikiki Beach Walk - Retail. |
Fourth Quarter 2012 Supplemental Information | Page 13 |
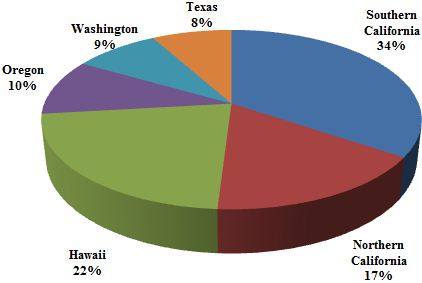
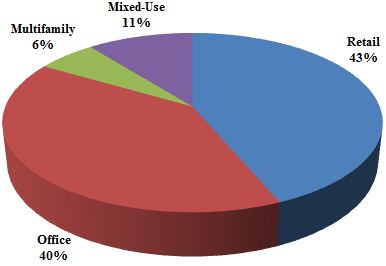
NOI BREAKDOWN | |
Three Months Ended December 31, 2012 | ||
Portfolio Cash NOI Breakdown | ||
Portfolio Diversification by Geographic Region | Portfolio Diversification by Segment | |
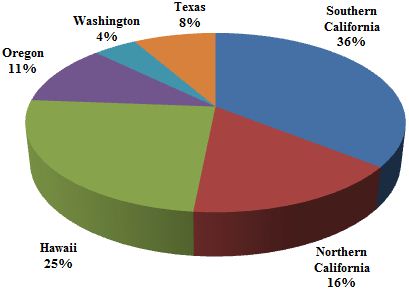 | 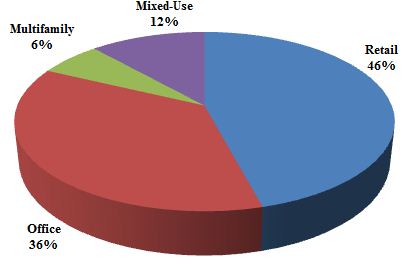 | |
Portfolio GAAP NOI Breakdown | ||
Portfolio Diversification by Geographic Region | Portfolio Diversification by Segment | |
 |  | |
Fourth Quarter 2012 Supplemental Information | Page 14 |
PROPERTY REVENUE AND OPERATING EXPENSES | |
(Amounts in thousands) | Three Months Ended December 31, 2012 | |||||||||||||||
Additional | Property | |||||||||||||||
Property | Billed Expense | Operating | ||||||||||||||
Property | Base Rent (1) | Income (2) | Reimbursements (3) | Expenses (4) | ||||||||||||
Retail Portfolio | ||||||||||||||||
Carmel Country Plaza | $ | 857 | $ | 19 | $ | 183 | $ | (201 | ) | |||||||
Carmel Mountain Plaza | 2,532 | 43 | 697 | (846 | ) | |||||||||||
South Bay Marketplace | 538 | 25 | 239 | (205 | ) | |||||||||||
Rancho Carmel Plaza | 191 | 109 | 47 | (80 | ) | |||||||||||
Lomas Santa Fe Plaza | 1,306 | 32 | 302 | (356 | ) | |||||||||||
Solana Beach Towne Centre | 1,395 | 42 | 471 | (477 | ) | |||||||||||
Del Monte Center | 2,212 | 515 | 981 | (1,114 | ) | |||||||||||
Geary Marketplace (5) | 48 | — | — | (2 | ) | |||||||||||
The Shops at Kalakaua | 393 | 20 | 30 | (66 | ) | |||||||||||
Waikele Center | 4,403 | 469 | 1,081 | (1,311 | ) | |||||||||||
Alamo Quarry Market | 3,208 | 284 | 1,385 | (1,658 | ) | |||||||||||
Subtotal Retail Portfolio | $ | 17,083 | $ | 1,558 | $ | 5,416 | $ | (6,316 | ) | |||||||
Office Portfolio | ||||||||||||||||
Torrey Reserve Campus (6) | $ | 3,818 | $ | 160 | $ | 187 | $ | (787 | ) | |||||||
Solana Beach Corporate Centre | 1,694 | 1 | 37 | (391 | ) | |||||||||||
The Landmark at One Market | 4,742 | 21 | 157 | (1,880 | ) | |||||||||||
One Beach Street | 698 | — | 11 | (256 | ) | |||||||||||
First & Main | 2,756 | 117 | 29 | (529 | ) | |||||||||||
Lloyd District Portfolio | 2,852 | 267 | 110 | (1,319 | ) | |||||||||||
City Center Bellevue (7) | 3,391 | 494 | 108 | (1,213 | ) | |||||||||||
Subtotal Office Portfolio | $ | 19,951 | $ | 1,060 | $ | 639 | $ | (6,375 | ) | |||||||
Multifamily Portfolio | ||||||||||||||||
Loma Palisades | $ | 2,490 | $ | 171 | $ | — | $ | (962 | ) | |||||||
Imperial Beach Gardens | 652 | 48 | — | (264 | ) | |||||||||||
Mariner's Point | 296 | 22 | — | (127 | ) | |||||||||||
Santa Fe Park RV Resort | 195 | 17 | — | (124 | ) | |||||||||||
Subtotal Multifamily Portfolio | $ | 3,633 | $ | 258 | $ | — | $ | (1,477 | ) | |||||||
Fourth Quarter 2012 Supplemental Information | Page 15 |
PROPERTY REVENUE AND OPERATING EXPENSES (CONTINUED) | |
(Amounts in thousands) | Three Months Ended December 31, 2012 | |||||||||||||||
Additional | Property | |||||||||||||||
Property | Billed Expense | Operating | ||||||||||||||
Property | Base Rent (1) | Income (2) | Reimbursements (3) | Expenses (4) | ||||||||||||
Mixed-Use Portfolio | ||||||||||||||||
Waikiki Beach Walk - Retail | $ | 2,361 | $ | 1,147 | $ | 896 | $ | (1,647 | ) | |||||||
Waikiki Beach Walk - Embassy Suites™ | 7,588 | 597 | — | (6,451 | ) | |||||||||||
Subtotal Mixed-Use Portfolio | $ | 9,949 | $ | 1,744 | $ | 896 | $ | (8,098 | ) | |||||||
Total | $ | 50,616 | $ | 4,620 | $ | 6,951 | $ | (22,266 | ) | |||||||
Notes:
(1) | Base rent for our retail and office portfolio and the retail portion of our mixed-use portfolio represents base rent for the three months ended December 31, 2012 (before abatements) and excludes the impact of straight-line rent and above (below) market rent adjustments. Total abatements for our retail and office portfolio were approximately $19 and $1,351, respectively, for the three months ended December 31, 2012. There were no abatements for the retail portion of our mixed-use portfolio for the three months ended December 31, 2012. In the case of triple net or modified gross leases, annualized base rent does not include tenant reimbursements for real estate taxes, insurance, common area or other operating expenses. Multifamily portfolio base rent represents base rent (including parking, before abatements) less vacancy allowance and employee rent credits and includes additional rents (additional rents include insufficient notice penalties, month-to-month charges and pet rent). Total abatements for our multifamily portfolio were insignificant for the three months ended December 31, 2012. For Waikiki Beach Walk - Embassy Suites TM, base rent is equal to the actual room revenue for the three months ended December 31, 2012. |
(2) | Represents additional property-related income for the three months ended December 31, 2012, which includes: (i) percentage rent, (ii) other rent (such as storage rent, license fees and association fees) and (iii) other property income (such as late fees, default fees, lease termination fees, parking revenue, the reimbursement of general excise taxes, laundry income and food and beverage sales). |
(3) | Represents billed tenant expense reimbursements for the three months ended December 31, 2012. |
(4) | Represents property operating expenses for the three months ended December 31, 2012. Property operating expenses includes all rental expenses, except non-cash rent expense and the provision for bad debt recorded for deferred rent receivables. |
(5) | Includes revenue and expenses since the acquisition of Geary Marketplace for the period from December 19, 2012 to December 31, 2012. |
(6) | Base rent shown includes amounts related to American Assets Trust, L.P.'s lease at ICW Plaza. This intercompany rent is eliminated in the consolidated statement of operations. The base rent was $134 and abatements were $134 for the three months ended December 31, 2012. |
(7) | Includes revenue and expenses since the acquisition of City Center Bellevue for the period from August 21, 2012 to December 31, 2012. |
Fourth Quarter 2012 Supplemental Information | Page 16 |
SEGMENT CAPITAL EXPENDITURES | |
(Amounts in thousands) | Three Months Ended December 31, 2012 | |||||||||||||||||||||||
Segment | Tenant Improvements and Leasing Commissions | Maintenance Capital Expenditures | Total Tenant Improvements, Leasing Commissions and Maintenance Capital Expenditures | Redevelopment and Expansions | New Development | Total Capital Expenditures | ||||||||||||||||||
Retail Portfolio | $ | 1,893 | $ | 565 | $ | 2,458 | $ | — | $ | 19 | $ | 2,477 | ||||||||||||
Office Portfolio | 3,896 | 1,030 | 4,926 | 1,608 | 74 | 6,608 | ||||||||||||||||||
Multifamily Portfolio | — | 182 | 182 | — | — | 182 | ||||||||||||||||||
Mixed-Use Portfolio | 15 | 459 | 474 | — | — | 474 | ||||||||||||||||||
Total | $ | 5,804 | $ | 2,236 | $ | 8,040 | $ | 1,608 | $ | 93 | $ | 9,741 | ||||||||||||
Year Ended December 31, 2012 | ||||||||||||||||||||||||
Segment | Tenant Improvements and Leasing Commissions | Maintenance Capital Expenditures | Total Tenant Improvements, Leasing Commissions and Maintenance Capital Expenditures | Redevelopment and Expansions | New Development | Total Capital Expenditures | ||||||||||||||||||
Retail Portfolio | $ | 10,114 | $ | 1,962 | $ | 12,076 | $ | 1,905 | $ | 230 | $ | 14,211 | ||||||||||||
Office Portfolio | 13,882 | 3,249 | 17,131 | 1,993 | 3,012 | 22,136 | ||||||||||||||||||
Multifamily Portfolio | — | 964 | 964 | — | — | 964 | ||||||||||||||||||
Mixed-Use Portfolio | 36 | 691 | 727 | — | — | 727 | ||||||||||||||||||
Total | $ | 24,032 | $ | 6,866 | $ | 30,898 | $ | 3,898 | $ | 3,242 | $ | 38,038 | ||||||||||||
Fourth Quarter 2012 Supplemental Information | Page 17 |
SUMMARY OF OUTSTANDING DEBT | |
(Amounts in thousands) | Amount | ||||||||||||||||
Outstanding at | Annual Debt | Balance at | |||||||||||||||
Debt | December 31, 2012 | Interest Rate | Service | Maturity Date | Maturity | ||||||||||||
Alamo Quarry Market (1)(2) | $ | 93,942 | 5.67 | % | $ | 7,567 | January 8, 2014 | $ | 91,717 | ||||||||
Waikele Center (4) | 140,700 | 5.15 | 7,360 | November 1, 2014 | 140,700 | ||||||||||||
The Shops at Kalakaua (4) | 19,000 | 5.45 | 1,053 | May 1, 2015 | 19,000 | ||||||||||||
The Landmark at One Market (2)(4) | 133,000 | 5.61 | 7,558 | July 5, 2015 | 133,000 | ||||||||||||
Del Monte Center (4) | 82,300 | 4.93 | 4,121 | July 8, 2015 | 82,300 | ||||||||||||
First & Main (4) | 84,500 | 3.97 | 3,397 | July 1, 2016 | 84,500 | ||||||||||||
Imperial Beach Gardens (4) | 20,000 | 6.16 | 1,250 | September 1, 2016 | 20,000 | ||||||||||||
Mariner's Point (4) | 7,700 | 6.09 | 476 | September 1, 2016 | 7,700 | ||||||||||||
South Bay Marketplace (4) | 23,000 | 5.48 | 1,281 | February 10, 2017 | 23,000 | ||||||||||||
Waikiki Beach Walk - Retail (4) | 130,310 | 5.39 | 7,020 | July 1, 2017 | 130,310 | ||||||||||||
Solana Beach Corporate Centre III-IV (5) | 37,204 | 6.39 | 2,798 | August 1, 2017 | 35,136 | ||||||||||||
Loma Palisades (4) | 73,744 | 6.09 | 4,553 | July 1, 2018 | 73,744 | ||||||||||||
One Beach Street (4) | 21,900 | 3.94 | 875 | April 1, 2019 | 21,900 | ||||||||||||
Torrey Reserve - North Court (1) | 21,659 | 7.22 | 1,836 | June 1, 2019 | 19,443 | ||||||||||||
Torrey Reserve - VCI, VCII, VCIII (1) | 7,294 | 6.36 | 560 | June 1, 2020 | 6,439 | ||||||||||||
Solana Beach Corporate Centre I-II (1) | 11,637 | 5.91 | 855 | June 1, 2020 | 10,169 | ||||||||||||
Solana Beach Towne Centre (1) | 38,790 | 5.91 | 2,849 | June 1, 2020 | 33,898 | ||||||||||||
City Center Bellevue (4) | 111,000 | 3.98 | 4,479 | November 1, 2022 | 111,000 | ||||||||||||
Total / Weighted Average | $ | 1,057,680 | 5.26 | % | $ | 59,888 | $ | 1,043,956 | |||||||||
Unamortized fair value adjustment | (12,998 | ) | |||||||||||||||
Secured Notes Payable | $ | 1,044,682 | |||||||||||||||
Fixed Rate Debt Ratio of Secured Notes Payable | |||||||||||||||||
Fixed rate debt | 100 | % | |||||||||||||||
Notes:
(1) | Principal payments based on a 30-year amortization schedule. |
(2) | Maturity date is the earlier of the loan maturity date under the loan agreement, or the "Anticipated Repayment Date" as specifically defined in the loan agreement, which is the date after which substantial economic penalties apply if the loan has not been paid off. |
(3) | Principal payments based on a 20-year amortization schedule. |
(4) | Interest only. |
(5) | Loan was interest only through August 2012. Beginning in September 2012, principal payments are based on a 30-year amortization schedule. Annual debt service is for the period October 1, 2012 through September 30, 2013. |
Fourth Quarter 2012 Supplemental Information | Page 18 |
MARKET CAPITALIZATION | |
(Amounts in thousands, except per share data) | ||||||
Market data | December 31, 2012 | |||||
Common shares outstanding | 39,664 | |||||
Common units outstanding | 18,024 | 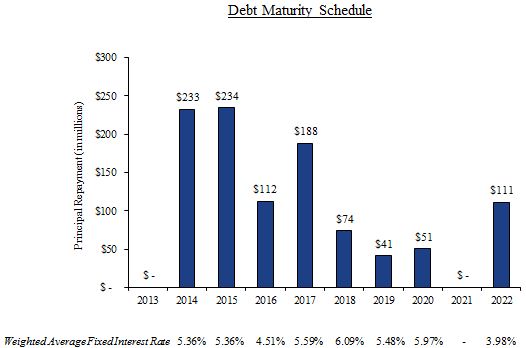 | ||||
Common shares and common units outstanding | 57,688 | |||||
Market price per common share | $ | 27.93 | ||||
Equity market capitalization | $ | 1,611,226 | ||||
Total debt | $ | 1,057,680 | ||||
Total market capitalization | $ | 2,668,906 | ||||
Less: Cash on hand | $ | (42,479 | ) | |||
Total enterprise value | $ | 2,626,427 | ||||
Total assets, gross | $ | 2,098,081 | ||||
Total debt/Total capitalization | 39.6 | % | ||||
Total debt/Total enterprise value | 40.3 | % | ||||
Net debt/Total enterprise value (1) | 38.7 | % | ||||
Total debt/Total assets, gross | 50.4 | % | ||||
Total debt/EBITDA (2)(3) | 7.0 | x | ||||
Net debt/EBITDA (2)(3) | 6.7 | x | ||||
Interest coverage ratio (4) | 2.5 | x | ||||
Fixed charge coverage ratio (4) | 2.5 | x | ||||
Notes:
(1) | Net debt is equal to total debt less cash on hand. |
(2) | See Glossary of Terms for discussion of EBITDA. |
(3) | As used here, EBITDA represents the actual for the three months ended December 31, 2012 annualized. |
(4) | Calculated as EBITDA divided by interest on borrowed funds, including capitalized interest and excluding debt fair value adjustments and loan fee amortization. |
Fourth Quarter 2012 Supplemental Information | Page 19 |
SUMMARY OF REDEVELOPMENT OPPORTUNITIES | |
Our portfolio has numerous potential opportunities to create future shareholder value. These opportunities could be subject to government approvals, lender consents, tenant consents, market conditions, availability of debt and/or equity financing, etc. Many of these opportunities are in their preliminary stages and may not ultimately come to fruition. This schedule will update as we modify various assumptions and markets conditions change. Square footages and units set forth below are estimates only and ultimately may differ materially from actual square footages and units. | ||||||||||||||||||||||
In-Process Development Projects | ||||||||||||||||||||||
Property | Property Type | Location | Estimated Start Date | Estimated Completion Date | Estimated Stabilization Date (1) | Estimated Rentable Square Feet | Cost Incurred to Date (2) | Total Estimated Investment (2) | Estimated Stabilized Yield (3) | |||||||||||||
Torrey Reserve III & IV | Office | San Diego, CA | 2012 | 2014 | 2015 | 81,500 | $ | 6,413,000 | $ | 34,100,000 | 8.6% | |||||||||||
Carmel Mountain Plaza | Retail | San Diego, CA | 2012 | 2013 | 2013 | 10,000 | $ | 495,000 | $ | 800,000 | 37.5% | |||||||||||
Development/Redevelopment Pipeline | |||||||||
Property | Property Type | Location | Estimated Square Footage (4) | Multifamily Units | |||||
Solana Beach Corporate Centre (Building 5) | Retail | Solana Beach, CA | 10,000 | N/A | |||||
Lomas Santa Fe Plaza | Retail | Solana Beach, CA | 45,000 | N/A | |||||
Sorrento Pointe | Office | San Diego, CA | 88,000 | N/A | |||||
Lloyd District Portfolio (5) | Mixed Use | Portland, OR | 53,000 | 637 | |||||
Solana Beach - Highway 101 | Mixed Use | Solana Beach, CA | 48,000 | 36 | |||||
Notes:
(1) | Based on management's estimation of stabilized occupancy (95%). |
(2) | Excludes allocated land costs and capitalized interest costs capitalized in accordance with Accounting Standards Codification ("ASC") 835-20-50-1. |
(3) | Calculated as return on invested capital when project has reached stabilized occupancy, and excludes allocated land costs and interest cost capitalized in accordance with ASC 838-20-50-1. |
(4) | Represents commercial portion of development opportunity for Lloyd District Portfolio and Solana Beach - Highway 101. |
(5) | Development plans began during the second quarter of 2012. |
Fourth Quarter 2012 Supplemental Information | Page 20 |
| |
PORTFOLIO DATA
Fourth Quarter 2012 Supplemental Information | Page 21 |
PROPERTY REPORT | |
As of December 31, 2012 | Retail and Office Portfolios | |||||||||||||||||||||
Net | Annualized | |||||||||||||||||||||
Number | Rentable | Base Rent | ||||||||||||||||||||
Year Built/ | of | Square | Percentage | Annualized | per Leased | |||||||||||||||||
Property | Location | Renovated | Buildings | Feet (1) | Leased (2) | Base Rent (3) | Square Foot (4) | Retail Anchor Tenant(s) (5) | Other Principal Retail Tenants (6) | |||||||||||||
Retail Properties | ||||||||||||||||||||||
Carmel Country Plaza | San Diego, CA | 1991 | 9 | 78,098 | 100.0% | $ | 3,418,273 | $43.77 | Sharp Healthcare, San Diego County Credit Union | |||||||||||||
Carmel Mountain Plaza (7) | San Diego, CA | 1994 | 13 | 520,228 | 92.1 | 10,333,487 | 21.57 | Sears | Sports Authority, Nordstrom Rack | |||||||||||||
South Bay Marketplace (7) | San Diego, CA | 1997 | 9 | 132,877 | 100.0 | 2,150,465 | 16.18 | Ross Dress for Less, Grocery Outlet | ||||||||||||||
Rancho Carmel Plaza | San Diego, CA | 1993 | 3 | 30,421 | 89.3 | 765,496 | 28.18 | Oggi's Pizza & Brewing Co., Sprint PCS Assets | ||||||||||||||
Lomas Santa Fe Plaza | Solana Beach, CA | 1972/1997 | 9 | 209,569 | 94.8 | 5,265,448 | 26.50 | Vons, Ross Dress for Less | ||||||||||||||
Solana Beach Towne Centre | Solana Beach, CA | 1973/2000/2004 | 12 | 246,730 | 99.4 | 5,652,581 | 23.05 | Dixieline Probuild, Marshalls | ||||||||||||||
Del Monte Center (7) | Monterey, CA | 1967/1984/2006 | 16 | 676,571 | 98.9 | 9,192,149 | 13.74 | Macy's, KLA Monterrey | Century Theatres, Macy's Furniture Gallery | |||||||||||||
Geary Marketplace | Walnut Creek, CA | 2012 | 3 | 35,156 | 100.0 | 1,068,883 | 30.40 | Sprouts Farmer Market, Freebirds Wild Burrito | ||||||||||||||
The Shops at Kalakaua | Honolulu, HI | 1971/2006 | 3 | 11,671 | 100.0 | 1,569,640 | 134.49 | Whalers General Store, Diesel U.S.A. Inc. | ||||||||||||||
Waikele Center | Waipahu, HI | 1993/2008 | 9 | 537,823 | 94.8 | 17,616,476 | 34.55 | Lowe's, Kmart, Sports Authority, Foodland Super Market | Old Navy, Officemax | |||||||||||||
Alamo Quarry Market (7) | San Antonio, TX | 1997/1999 | 16 | 589,501 | 99.9 | 12,895,221 | 21.90 | Regal Cinemas | Bed Bath & Beyond, Whole Foods Market | |||||||||||||
Subtotal/Weighted Average Retail Portfolio | 102 | 3,068,645 | 97.0% | $ | 69,928,119 | $23.49 | ||||||||||||||||
Office Properties | ||||||||||||||||||||||
Torrey Reserve Campus | San Diego, CA | 1996-2000 | 9 | 456,850 | 93.1% | $ | 15,431,733 | $36.28 | ||||||||||||||
Solana Beach Corporate Centre | Solana Beach, CA | 1982/2005 | 4 | 212,019 | 93.5 | 6,752,284 | 34.06 | |||||||||||||||
The Landmark at One Market (8) | San Francisco, CA | 1917/2000 | 1 | 421,934 | 100.0 | 18,966,745 | 44.95 | |||||||||||||||
One Beach Street | San Francisco, CA | 1924/1972/1987/1992 | 1 | 97,614 | 100.0 | 2,794,437 | 28.63 | |||||||||||||||
First & Main | Portland, OR | 2010 | 1 | 361,229 | 98.8 | 11,150,871 | 31.24 | |||||||||||||||
Lloyd District Portfolio | Portland, OR | 1940-2011 | 6 | 605,413 | 85.3 | 11,462,073 | 22.20 | |||||||||||||||
City Center Bellevue | Bellevue, WA | 1987 | 1 | 490,508 | 92.1 | 13,595,919 | 30.10 | |||||||||||||||
Subtotal/Weighted Average Office Portfolio | 23 | 2,645,567 | 93.3% | $ | 80,154,062 | $32.47 | ||||||||||||||||
Total/Weighted Average Retail and Office Portfolio | 125 | 5,714,212 | 95.3% | $ | 150,082,181 | $27.56 | ||||||||||||||||
Fourth Quarter 2012 Supplemental Information | Page 22 |
PROPERTY REPORT (CONTINUED) | |
As of December 31, 2012 | |||||||||||||||||||||||||
Average | |||||||||||||||||||||||||
Number | Monthly | ||||||||||||||||||||||||
Year Built/ | of | Percentage | Annualized | Base Rent per | |||||||||||||||||||||
Property | Location | Renovated | Buildings | Units | Leased (2) | Base Rent (3) | Leased Unit (4) | ||||||||||||||||||
Loma Palisades | San Diego, CA | 1958/2001-2008 | 80 | 548 | 97.4% | $ | 9,932,424 | $ | 1,551 | ||||||||||||||||
Imperial Beach Gardens | Imperial Beach, CA | 1959/2008-present | 26 | 160 | 98.8 | 2,619,372 | $ | 1,381 | |||||||||||||||||
Mariner's Point | Imperial Beach, CA | 1986 | 8 | 88 | 100.0 | 1,189,188 | $ | 1,126 | |||||||||||||||||
Santa Fe Park RV Resort (9) | San Diego, CA | 1971/2007-2008 | 1 | 126 | 74.0 | 913,200 | $ | 816 | |||||||||||||||||
Total/Weighted Average Multifamily Portfolio | 115 | 922 | 94.7% | $ | 14,654,184 | $ | 1,399 | ||||||||||||||||||
Mixed-Use Portfolio | |||||||||||||||||||||||||
Net | Annualized | ||||||||||||||||||||||||
Number | Rentable | Base Rent | |||||||||||||||||||||||
Year Built/ | of | Square | Percentage | Annualized | per Leased | Retail | |||||||||||||||||||
Retail Portion | Location | Renovated | Buildings | Feet (1) | Leased (2) | Base Rent (3) | Square Foot (4) | Anchor Tenant(s) (5) | Other Principal Retail Tenants (6) | ||||||||||||||||
Waikiki Beach Walk - Retail | Honolulu, HI | 2006 | 3 | 96,707 | 95.5 | % | $ | 9,977,318 | $ | 108.03 | Yardhouse, Ruth's Chris | ||||||||||||||
Annualized | |||||||||||||||||||||||||
Number | Revenue per | ||||||||||||||||||||||||
Year Built/ | of | Average | Average | Available | |||||||||||||||||||||
Hotel Portion | Location | Renovated | Buildings | Units | Occupancy (10) | Daily Rate(10) | Room (10) | ||||||||||||||||||
Waikiki Beach Walk - Embassy Suites™ | Honolulu, HI | 2008 | 2 | 369 | 84.3 | % | $ | 265.13 | $ | 223.50 | |||||||||||||||
Notes:
(1) | The net rentable square feet for each of our retail properties and the retail portion of our mixed-use property is the sum of (1) the square footages of existing leases, plus (2) for available space, the field-verified square footage. The net rentable square feet for each of our office properties is the sum of (1) the square footages of existing leases, plus (2) for available space, management’s estimate of net rentable square feet based, in part, on past leases. The net rentable square feet included in such office leases is generally determined consistently with the Building Owners and Managers Association, or BOMA, 1996 measurement guidelines. |
(2) | Percentage leased for each of our retail and office properties and the retail portion of the mixed-use property includes square footage under leases as of December 31, 2012, including leases which may not have commenced as of December 31, 2012. Percentage leased for our multifamily properties includes total units rented as of December 31, 2012. |
(3) | Annualized base rent is calculated by multiplying base rental payments (defined as cash base rents (before abatements)) for the month ended December 31, 2012, by 12. In the case of triple net or modified gross leases, annualized base rent does not include tenant reimbursements for real estate taxes, insurance, common area or other operating expenses. |
(4) | Annualized base rent per leased square foot is calculated by dividing annualized base rent, by square footage under lease as of December 31, 2012. Annualized base rent per leased unit is calculated by dividing annualized base rent, by units under lease as of December 31, 2012. |
(5) | Retail anchor tenants are defined as retail tenants leasing 50,000 square feet or more. |
(6) | Other principal retail tenants are defined as the two tenants leasing the most square footage, excluding anchor tenants. |
(7) | Net rentable square feet at certain of our retail properties includes pad sites leased pursuant to the ground leases in the following table: |
Property | Number of Ground Leases | Square Footage Leased Pursuant to Ground Leases | Aggregate Annualized Base Rent | ||||||
Carmel Mountain Plaza | 6 | 127,112 | $ | 1,020,900 | |||||
South Bay Marketplace | 1 | 2,824 | $ | 91,320 | |||||
Del Monte Center | 2 | 295,100 | $ | 201,291 | |||||
Alamo Quarry Market | 4 | 31,994 | $ | 459,075 | |||||
(8) | This property contains 421,934 net rentable square feet consisting of The Landmark at One Market (377,714 net rentable square feet) as well as a separate long-term leasehold interest in approximately 44,220 net rentable square feet of space located in an adjacent six-story leasehold known as the Annex. We currently lease the Annex from an affiliate of the Paramount Group pursuant to a long-term master lease effective through June 30, 2016, which we have the option to extend until 2026 pursuant to two five-year extension options. |
(9) | The Santa Fe Park RV Resort is subject to seasonal variation, with higher rates of occupancy occurring during the summer months. During the 12 months ended December 31, 2012, the highest average monthly occupancy rate for this property was 92%, occurring in July 2012. The number of units at the Santa Fe Park RV Resort includes 122 RV spaces and four apartments. |
(10) | Average occupancy represents the percentage of available units that were sold during the three months ended December 31, 2012, and is calculated by dividing the number of units sold by the product of the total number of units and the total number of days in the period. Average daily rate represents the average rate paid for the units sold and is calculated by dividing the total room revenue (i.e., excluding food and beverage revenues or other hotel operations revenues such as telephone, parking and other guest services) for the three months ended December 31, 2012, by the number of units sold. Revenue per available room, or RevPAR, represents the total unit revenue per total available units for the three months ended December 31, 2012 and is calculated by multiplying average occupancy by the average daily rate. RevPAR does not include food and beverage revenues or other hotel operations revenues such as telephone, parking and other guest services. |
Fourth Quarter 2012 Supplemental Information | Page 23 |
RETAIL LEASING SUMMARY | |
As of December 31, 2012 | |||||||||||||||||||||||||||||||||||
Total Lease Summary - Comparable (1) | |||||||||||||||||||||||||||||||||||
Number of Leases Signed | % of Comparable Leases Signed | Net Rentable Square Feet Signed | Contractual Rent Per Sq. Ft. (2) | Prior Rent Per Sq. Ft. (3) | Annual Change in Rent | Cash Basis % Change Over Prior Rent | Straight-Line Basis % Change Over Prior Rent | Weighted Average Lease Term (4) | Tenant Improvements & Incentives | Tenant Improvements & Incentives Per Sq. Ft. | |||||||||||||||||||||||||
Quarter | |||||||||||||||||||||||||||||||||||
4th Quarter 2012 | 13 | 100% | 33,269 | $33.32 | $31.86 | $ | 48,639 | 4.6 | % | 12.3 | % | 3.7 | $ | 61,650 | $1.85 | ||||||||||||||||||||
3rd Quarter 2012 | 15 | 100% | 56,673 | $25.90 | $25.04 | $ | 48,868 | 3.4 | % | 8.4 | % | 4.9 | $ | 111,000 | $1.96 | ||||||||||||||||||||
2nd Quarter 2012 | 15 | 100% | 96,932 | $32.25 | $31.13 | $ | 95,543 | 3.6 | % | 5.8 | % | 5.0 | $ | 996,157 | $11.75 | ||||||||||||||||||||
1st Quarter 2012 | 13 | 100% | 27,115 | $43.83 | $46.10 | $ | (61,374 | ) | (4.9 | )% | 4.0 | % | 5.6 | $ | 293,673 | $10.83 | |||||||||||||||||||
Total 12 months | 56 | 100% | 213,989 | $32.20 | $31.53 | $ | 131,676 | 2.0 | % | 13.2 | % | 4.8 | $ | 1,462,480 | $7.50 | ||||||||||||||||||||
New Lease Summary - Comparable (1) | |||||||||||||||||||||||||||||||||||
Number of Leases Signed | % of Comparable Leases Signed | Net Rentable Square Feet Signed | Contractual Rent Per Sq. Ft. (2) | Prior Rent Per Sq. Ft. (3) | Annual Change in Rent | Cash Basis % Change Over Prior Rent | Straight-Line Basis % Change Over Prior Rent | Weighted Average Lease Term (4) | Tenant Improvements & Incentives | Tenant Improvements & Incentives Per Sq. Ft. | |||||||||||||||||||||||||
Quarter | |||||||||||||||||||||||||||||||||||
4th Quarter 2012 | — | — | — | — | — | $ | — | — | — | — | $ | — | — | ||||||||||||||||||||||
3rd Quarter 2012 | 1 | 7% | 1,392 | $42.00 | $56.75 | $ | (20,532 | ) | (26.0 | )% | (26.0 | )% | 4.2 | $ | — | — | |||||||||||||||||||
2nd Quarter 2012 | 2 | 13% | 20,545 | $42.25 | $30.59 | $ | 98,174 | 38.1 | % | 42.5 | % | 9.5 | $ | 976,884 | $47.55 | ||||||||||||||||||||
1st Quarter 2012 | 3 | 23% | 4,906 | $36.98 | $38.31 | $ | (6,541 | ) | (3.5 | )% | (6.2 | )% | 7.1 | $ | 223,548 | $45.57 | |||||||||||||||||||
Total 12 months | 6 | 11% | 26,843 | $41.27 | $33.36 | $ | 71,101 | 7.9 | % | 85.9 | % | 8.8 | $ | 1,200,432 | $44.72 | ||||||||||||||||||||
Renewal Lease Summary - Comparable (1)(5) | |||||||||||||||||||||||||||||||||||
Number of Leases Signed | % of Comparable Leases Signed | Net Rentable Square Feet Signed | Contractual Rent Per Sq. Ft. (2) | Prior Rent Per Sq. Ft. (3) | Annual Change in Rent | Cash Basis % Change Over Prior Rent | Straight-Line Basis % Change Over Prior Rent | Weighted Average Lease Term (4) | Tenant Improvements & Incentives | Tenant Improvements & Incentives Per Sq. Ft. | |||||||||||||||||||||||||
Quarter | |||||||||||||||||||||||||||||||||||
4th Quarter 2012 | 13 | 100% | 33,269 | $33.32 | $31.86 | $ | 48,639 | 4.6 | % | 12.3 | % | 3.7 | $ | 61,650 | $1.85 | ||||||||||||||||||||
3rd Quarter 2012 | 14 | 93% | 55,281 | $25.50 | $24.24 | $ | 69,400 | 5.2 | % | 10.5 | % | 4.9 | $ | 111,000 | $2.01 | ||||||||||||||||||||
2nd Quarter 2012 | 13 | 87% | 76,387 | $31.15 | $31.18 | $ | (2,631 | ) | (0.1 | )% | 1.9 | % | 4.5 | $ | 19,273 | $0.25 | |||||||||||||||||||
1st Quarter 2012 | 10 | 77% | 22,209 | $45.35 | $47.82 | $ | (54,833 | ) | (5.2 | )% | 6.0 | % | 5.2 | $ | 70,125 | $3.16 | |||||||||||||||||||
Total 12 months | 50 | 89% | 187,146 | $31.55 | $31.23 | $ | 60,575 | 1.0 | % | 6.5 | % | 4.6 | $ | 262,048 | $1.40 | ||||||||||||||||||||
Total Lease Summary - Comparable and Non-Comparable | |||||||||||||||||||||||||||||||||||
Number of Leases Signed | Net Rentable Square Feet Signed | Contractual Rent Per Sq. Ft. (2) | Weighted Average Lease Term (4) | Tenant Improvements & Incentives | Tenant Improvements & Incentives Per Sq. Ft. | ||||||||||||||||||||||||||||||
Quarter | |||||||||||||||||||||||||||||||||||
4th Quarter 2012 | 13 | 33,269 | $33.32 | 3.7 | $ | 61,650 | $1.85 | ||||||||||||||||||||||||||||
3rd Quarter 2012 | 19 | 78,236 | $25.10 | 5.0 | $ | 939,550 | $12.01 | ||||||||||||||||||||||||||||
2nd Quarter 2012 | 19 | 134,567 | $32.16 | 6.4 | $ | 2,738,277 | $20.35 | ||||||||||||||||||||||||||||
1st Quarter 2012 | 16 | 31,896 | $41.65 | 5.3 | $ | 319,483 | $10.02 | ||||||||||||||||||||||||||||
Total 12 months | 67 | 277,968 | $31.40 | 5.6 | $ | 4,058,960 | $14.60 | ||||||||||||||||||||||||||||
Notes:
(1) | Comparable leases represent those leases signed on spaces for which there was a previous lease. |
(2) | Contractual rent represents contractual minimum rent under the new lease for the first twelve months of the term. |
(3) | Prior rent represents the minimum rent paid under the previous lease in the final twelve months of the term. |
(4) | Weighted average is calculated on the basis of square footage. |
(5) | Excludes renewals at fixed contractual rates specified in the lease. |
Fourth Quarter 2012 Supplemental Information | Page 24 |
OFFICE LEASING SUMMARY | |
As of December 31, 2012 | ||||||||||||||||||||||||||||||||||
Total Lease Summary - Comparable (1) | ||||||||||||||||||||||||||||||||||
Number of Leases Signed | % of Comparable Leases Signed | Net Rentable Square Feet Signed | Contractual Rent Per Sq. Ft. (2) | Prior Rent Per Sq. Ft. (3) | Annual Change in Rent | Cash Basis % Change Over Prior Rent | Straight-Line Basis % Change Over Prior Rent | Weighted Average Lease Term (4) | Tenant Improvements & Incentives | Tenant Improvements & Incentives Per Sq. Ft. | ||||||||||||||||||||||||
Quarter | ||||||||||||||||||||||||||||||||||
4th Quarter 2012 | 14 | 100% | 93,022 | $39.76 | $34.28 | $ | 509,561 | 16.0 | % | 16.1 | % | 3.3 | $ | 82,927 | $0.89 | |||||||||||||||||||
3rd Quarter 2012 | 15 | 100% | 71,469 | $29.88 | $28.71 | $ | 83,359 | 4.1 | % | 11.7 | % | 3.2 | $ | 339,270 | $4.75 | |||||||||||||||||||
2nd Quarter 2012 | 10 | 100% | 70,231 | $44.88 | $34.59 | $ | 722,907 | 29.8 | % | 49.4 | % | 5.5 | $ | 339,141 | $4.83 | |||||||||||||||||||
1st Quarter 2012 | 13 | 100% | 52,132 | $30.26 | $34.69 | $ | (231,039 | ) | (12.8 | )% | (2.6 | )% | 4.2 | $ | 710,939 | $13.64 | ||||||||||||||||||
Total 12 months | 52 | 100% | 286,854 | $36.83 | $33.04 | $ | 1,084,788 | 11.4 | % | 19.9 | % | 4.0 | $ | 1,472,277 | $5.13 | |||||||||||||||||||
New Lease Summary - Comparable (1) | ||||||||||||||||||||||||||||||||||
Number of Leases Signed | % of Comparable Leases Signed | Net Rentable Square Feet Signed | Contractual Rent Per Sq. Ft. (2) | Prior Rent Per Sq. Ft. (3) | Annual Change in Rent | Cash Basis % Change Over Prior Rent | Straight-Line Basis % Change Over Prior Rent | Weighted Average Lease Term (4) | Tenant Improvements & Incentives | Tenant Improvements & Incentives Per Sq. Ft. | ||||||||||||||||||||||||
Quarter | ||||||||||||||||||||||||||||||||||
4th Quarter 2012 | 2 | 14% | 10,096 | $30.03 | $34.67 | $ | (46,826 | ) | (13.4 | )% | (18.0 | )% | 1.9 | $ | — | — | ||||||||||||||||||
3rd Quarter 2012 | 3 | 20% | 4,427 | $34.44 | $37.42 | $ | (13,172 | ) | (8.0 | )% | (1.4 | )% | 3.6 | $ | 17,592 | $3.97 | ||||||||||||||||||
2nd Quarter 2012 | 5 | 50% | 39,469 | $51.69 | $33.05 | $ | 735,528 | 56.4 | % | 69.6 | % | 6.4 | $ | 274,361 | $6.95 | |||||||||||||||||||
1st Quarter 2012 | 6 | 46% | 12,283 | $35.51 | $34.74 | $ | 9,473 | 2.2 | % | 20.1 | % | 4.1 | $ | 293,958 | $23.93 | |||||||||||||||||||
Total 12 months | 16 | 31% | 66,275 | $44.24 | $33.90 | $ | 685,003 | 30.5 | % | 42.6 | % | 5.1 | $ | 585,911 | $8.84 | |||||||||||||||||||
Renewal Lease Summary - Comparable (1)(5) | ||||||||||||||||||||||||||||||||||
Number of Leases Signed | % of Comparable Leases Signed | Net Rentable Square Feet Signed | Contractual Rent Per Sq. Ft. (2) | Prior Rent Per Sq. Ft. (3) | Annual Change in Rent | Cash Basis % Change Over Prior Rent | Straight-Line Basis % Change Over Prior Rent | Weighted Average Lease Term (4) | Tenant Improvements & Incentives | Tenant Improvements & Incentives Per Sq. Ft. | ||||||||||||||||||||||||
Quarter | ||||||||||||||||||||||||||||||||||
4th Quarter 2012 | 12 | 86% | 82,926 | $40.95 | $34.24 | $ | 556,387 | 19.6 | % | 20.3 | % | 3.5 | $ | 82,927 | $1.00 | |||||||||||||||||||
3rd Quarter 2012 | 12 | 80% | 67,042 | $29.58 | $28.14 | $ | 96,531 | 5.1 | % | 12.9 | % | 3.2 | $ | 321,678 | $4.80 | |||||||||||||||||||
2nd Quarter 2012 | 5 | 50% | 30,762 | $36.15 | $36.56 | $ | (12,621 | ) | (1.1 | )% | 19.7 | % | 4.4 | $ | 64,780 | $2.11 | ||||||||||||||||||
1st Quarter 2012 | 7 | 54% | 39,849 | $28.64 | $34.67 | $ | (240,512 | ) | (17.4 | )% | (9.0 | )% | 4.2 | $ | 416,981 | $10.46 | ||||||||||||||||||
Total 12 months | 36 | 69% | 220,579 | $34.60 | $32.79 | $ | 399,785 | 5.5 | % | 12.5 | % | 3.7 | $ | 886,366 | $4.02 | |||||||||||||||||||
Total Lease Summary - Comparable and Non-Comparable | ||||||||||||||||||||||||||||||||||
Number of Leases Signed | Net Rentable Square Feet Signed | Contractual Rent Per Sq. Ft. (2) | Weighted Average Lease Term (4) | Tenant Improvements & Incentives | Tenant Improvements & Incentives Per Sq. Ft. | |||||||||||||||||||||||||||||
Quarter | ||||||||||||||||||||||||||||||||||
4th Quarter 2012 | 16 | 95,263 | $39.66 | 3.3 | $ | 82,927 | $0.87 | |||||||||||||||||||||||||||
3rd Quarter 2012 | 23 | 94,803 | $30.08 | 3.4 | $ | 698,008 | $7.36 | |||||||||||||||||||||||||||
2nd Quarter 2012 | 13 | 82,830 | $41.48 | 5.9 | $ | 1,202,425 | $14.52 | |||||||||||||||||||||||||||
1st Quarter 2012 | 16 | 63,969 | $29.02 | 4.0 | $ | 907,761 | $14.19 | |||||||||||||||||||||||||||
Total 12 months | 68 | 336,865 | $35.39 | 4.1 | $ | 2,891,121 | $8.58 | |||||||||||||||||||||||||||
Notes:
(1) | Comparable leases represent those leases signed on spaces for which there was a previous lease. |
(2) | Contractual rent represents contractual minimum rent under the new lease for the first twelve months of the term. |
(3) | Prior rent represents the minimum rent paid under the previous lease in the final twelve months of the term. |
(4) | Weighted average is calculated on the basis of square footage. |
(5) | Excludes renewals at fixed contractual rates specified in the lease. |
Fourth Quarter 2012 Supplemental Information | Page 25 |
MULTIFAMILY LEASING SUMMARY | |
As of December 31, 2012 | ||||||||
Lease Summary - Loma Palisades | ||||||||
Number of Leased Units | Percentage leased (1) | Annualized Base Rent (2) | Average Monthly Base Rent per Leased Unit (3) | |||||
Quarter | ||||||||
4th Quarter 2012 | 534 | 97.4% | $9,932,424 | $1,551 | ||||
3rd Quarter 2012 | 548 | 100.0% | $9,951,864 | $1,513 | ||||
2nd Quarter 2012 | 541 | 98.7% | $9,419,424 | $1,451 | ||||
1st Quarter 2012 | 489 | 89.2% | $9,419,892 | $1,606 | ||||
Lease Summary - Imperial Beach Garden | ||||||||
Number of Leased Units | Percentage leased (1) | Annualized Base Rent (2) | Average Monthly Base Rent per Leased Unit (3) | |||||
Quarter | ||||||||
4th Quarter 2012 | 158 | 98.8% | $2,619,372 | $1,381 | ||||
3rd Quarter 2012 | 158 | 98.8% | $2,596,812 | $1,369 | ||||
2nd Quarter 2012 | 159 | 99.4% | $2,555,880 | $1,339 | ||||
1st Quarter 2012 | 143 | 89.4% | $2,388,684 | $1,392 | ||||
Lease Summary - Mariner's Point | ||||||||
Number of Leased Units | Percentage leased (1) | Annualized Base Rent (2) | Average Monthly Base Rent per Leased Unit (3) | |||||
Quarter | ||||||||
4th Quarter 2012 | 88 | 100.0% | $1,189,188 | $1,126 | ||||
3rd Quarter 2012 | 88 | 100.0% | $1,158,144 | $1,097 | ||||
2nd Quarter 2012 | 86 | 97.7% | $1,101,828 | $1,068 | ||||
1st Quarter 2012 | 85 | 96.6% | $1,063,440 | $1,042 | ||||
Lease Summary - Santa Fe Park RV Resort | ||||||||
Number of Leased Units | Percentage leased (1) | Annualized Base Rent (2) | Average Monthly Base Rent per Leased Unit (3) | |||||
Quarter | ||||||||
4th Quarter 2012 | 93 | 74.0% | $913,200 | $816 | ||||
3rd Quarter 2012 | 93 | 73.8% | $873,204 | $783 | ||||
2nd Quarter 2012 | 115 | 97.0% | $1,022,496 | $743 | ||||
1st Quarter 2012 | 98 | 78.0% | $727,224 | $617 | ||||
Total Multifamily Lease Summary | ||||||||
Number of Leased Unit | Percentage leased (1) | Annualized Base Rent (2) | Average Monthly Base Rent per Leased Unit (3) | |||||
Quarter | ||||||||
4th Quarter 2012 | 873 | 94.7% | $14,654,184 | $1,399 | ||||
3rd Quarter 2012 | 887 | 96.2% | $14,580,024 | $1,370 | ||||
2nd Quarter 2012 | 901 | 97.7% | $14,099,628 | $1,304 | ||||
1st Quarter 2012 | 815 | 88.4% | $13,599,240 | $1,390 | ||||
Notes:
(1) | Percentage leased for our multifamily properties includes total units rented as of each respective quarter end date. |
(2) | Annualized base rent is calculated by multiplying base rental payments (defined as cash base rents (before abatements)) as of each respective quarter end date. |
(3) | Annualized base rent per leased unit is calculated by dividing annualized base rent, by units under lease as of each respective quarter end date. |
Fourth Quarter 2012 Supplemental Information | Page 26 |
MIXED-USE LEASING SUMMARY | |
As of December 31, 2012 | ||||||||
Lease Summary - Retail Portion | ||||||||
Number of Leased Square Feet | Percentage leased (1) | Annualized Base Rent (2) | Annualized base Rent per Leased Square Foot (3) | |||||
Quarter | ||||||||
4th Quarter 2012 | 92,333 | 95.5% | $9,977,318 | $108 | ||||
3rd Quarter 2012 | 94,025 | 97.4% | $9,208,893 | $98 | ||||
2nd Quarter 2012 | 90,699 | 93.9% | $9,494,329 | $105 | ||||
1st Quarter 2012 | 95,423 | 98.8% | $9,592,426 | $101 | ||||
Lease Summary - Hotel Portion | ||||||||
Number of Leased Units | Average Occupancy (4) | Average Daily Rate (4) | Annualized Revenue per Available Room (4) | |||||
Quarter | ||||||||
4th Quarter 2012 | 328 | 84.3% | $265 | $224 | ||||
3rd Quarter 2012 | 333 | 89.7% | $293 | $263 | ||||
2nd Quarter 2012 | 334 | 88.7% | $250 | $222 | ||||
1st Quarter 2012 | 341 | 92.2% | $248 | $228 | ||||
Notes:
(1) | Percentage leased for mixed-use property includes square footage under leases as of December 31, 2012, including leases which may not have commenced as of December 31, 2012. |
(2) | Annualized base rent is calculated by multiplying base rental payments (defined as cash base rents (before abatements)) for the month ended December 31, 2012, by 12. In the case of triple net or modified gross leases, annualized base rent does not include tenant reimbursements for real estate taxes, insurance, common area or other operating expenses. |
(3) | Annualized base rent per leased square foot is calculated by dividing annualized base rent, by square footage under lease as of December 31, 2012. |
(4) | Average occupancy represents the percentage of available units that were sold during the three months ended December 31, 2012, and is calculated by dividing the number of units sold by the product of the total number of units and the total number of days in the period. Average daily rate represents the average rate paid for the units sold and is calculated by dividing the total room revenue (i.e., excluding food and beverage revenues or other hotel operations revenues such as telephone, parking and other guest services) for each respective quarter period by the number of units sold. Revenue per available room, or RevPAR, represents the total unit revenue per total available units for each respective quarter period and is calculated by multiplying average occupancy by the average daily rate. RevPAR does not include food and beverage revenues or other hotel operations revenues such as telephone, parking and other guest services. |
Fourth Quarter 2012 Supplemental Information | Page 27 |
LEASE EXPIRATIONS | |
As of December 31, 2012 | |||||||||||||||||||||||||||||||||||||||||
Assumes no exercise of lease options | |||||||||||||||||||||||||||||||||||||||||
Office | Retail | Mixed-Use (Retail Portion Only) | Total | ||||||||||||||||||||||||||||||||||||||
% of | % of | Annualized | % of | % of | Annualized | % of | % of | Annualized | % of | Annualized | |||||||||||||||||||||||||||||||
Expiring | Office | Total | Base Rent | Expiring | Retail | Total | Base Rent | Expiring | Mixed-Use | Total | Base Rent | Expiring | Total | Base Rent | |||||||||||||||||||||||||||
Year | Sq. Ft. | Sq. Ft. | Sq. Ft. | Per Sq. Ft.(1) | Sq. Ft. | Sq. Ft. | Sq. Ft. | Per Sq. Ft.(1) | Sq. Ft. | Sq. Ft. | Sq. Ft. | Per Sq. Ft.(1) | Sq. Ft. | Sq. Ft. | Per Sq. Ft.(1) | ||||||||||||||||||||||||||
Month to Month | 35,557 | 1.3 | % | 0.6 | % | $6.82 | 19,274 | 0.6 | % | 0.3 | % | $30.30 | 5,105 | 5.3 | % | 0.1 | % | $15.49 | 59,936 | 1.0 | % | $15.11 | |||||||||||||||||||
2013 | 189,760 | 7.2 | 3.3 | $30.65 | 319,639 | (2) | 10.4 | 5.5 | $26.98 | 8,048 | 8.3 | 0.1 | $120.80 | 517,447 | 8.9 | $29.79 | |||||||||||||||||||||||||
2014 | 227,965 | 8.6 | 3.9 | $30.18 | 406,347 | 13.2 | 7.0 | $28.98 | 2,438 | 2.5 | — | $227.99 | 636,750 | 11.0 | $30.17 | ||||||||||||||||||||||||||
2015 | 389,307 | 14.7 | 6.7 | $31.18 | 240,152 | 7.8 | 4.1 | $25.92 | 11,607 | 12.0 | 0.2 | $219.27 | 641,066 | 11.0 | $32.61 | ||||||||||||||||||||||||||
2016 | 250,823 | (3)(4) | 9.5 | 4.3 | $29.56 | 186,468 | 6.1 | 3.2 | $34.29 | 12,402 | 12.8 | 0.2 | $146.97 | 449,693 | 7.7 | $34.76 | |||||||||||||||||||||||||
2017 | 308,855 | (6) | 11.7 | 5.3 | $39.87 | 327,463 | 10.7 | 5.6 | $24.71 | 7,407 | (5) | 7.7 | 0.1 | $156.42 | 643,725 | 11.1 | $33.50 | ||||||||||||||||||||||||
2018 | 187,428 | 7.1 | 3.2 | $34.44 | 930,231 | 30.3 | 16.0 | $16.78 | 4,673 | 4.8 | 0.1 | $142.23 | 1,122,332 | 19.3 | $20.25 | ||||||||||||||||||||||||||
2019 | 245,469 | 9.3 | 4.2 | $38.97 | 78,364 | (7) | 2.6 | 1.3 | $28.63 | 11,690 | 12.1 | 0.2 | $53.16 | 335,523 | 5.8 | $37.05 | |||||||||||||||||||||||||
2020 | 243,114 | (8) | 9.2 | 4.2 | $39.23 | 118,506 | 3.9 | 2.0 | $8.87 | 17,843 | 18.5 | 0.3 | $44.82 | 379,463 | 6.5 | $30.02 | |||||||||||||||||||||||||
2021 | 198,313 | 7.5 | 3.4 | $35.10 | 42,990 | 1.4 | 0.7 | $39.26 | — | — | — | — | 241,303 | 4.2 | $35.84 | ||||||||||||||||||||||||||
2022 | 9,364 | 0.4 | 0.2 | $20.00 | 143,655 | 4.7 | 2.5 | $30.07 | 10,617 | 11.0 | 0.2 | $71.39 | 163,636 | 2.8 | $32.18 | ||||||||||||||||||||||||||
Thereafter | 103,450 | 3.8 | 1.8 | $25.49 | 156,032 | 5.1 | 2.7 | $21.31 | — | — | — | — | 259,482 | 4.5 | $22.98 | ||||||||||||||||||||||||||
Signed Leases Not Commenced | 78,794 | 3.0 | 1.4 | — | 6,488 | 0.2 | 0.1 | — | 503 | 0.5 | — | — | 85,785 | 1.5 | — | ||||||||||||||||||||||||||
Available | 177,368 | 6.7 | 3.1 | — | 93,036 | 3.0 | 1.6 | — | 4,374 | 4.5 | 0.1 | — | 274,778 | 4.7 | — | ||||||||||||||||||||||||||
Total | 2,645,567 | 100.0 | % | 45.6 | % | $30.30 | 3,068,645 | 100.0 | % | 52.6 | % | $22.79 | 96,707 | 100.0 | % | 1.6 | % | $103.17 | 5,810,919 | 100.0 | % | $27.54 | |||||||||||||||||||
Assumes all lease options are exercised | |||||||||||||||||||||||||||||||||||||||||
Office | Retail | Mixed-Use (Retail Portion Only) | Total | ||||||||||||||||||||||||||||||||||||||
% of | % of | Annualized | % of | % of | Annualized | % of | % of | Annualized | % of | Annualized | |||||||||||||||||||||||||||||||
Expiring | Office | Total | Base Rent | Expiring | Retail | Total | Base Rent | Expiring | Mixed-Use | Total | Base Rent | Expiring | Total | Base Rent | |||||||||||||||||||||||||||
Year | Sq. Ft. | Sq. Ft. | Sq. Ft. | Per Sq. Ft.(1) | Sq. Ft. | Sq. Ft. | Sq. Ft. | Per Sq. Ft.(1) | Sq. Ft. | Sq. Ft. | Sq. Ft. | Per Sq. Ft.(1) | Sq. Ft. | Sq. Ft. | Per Sq. Ft.(1) | ||||||||||||||||||||||||||
Month to Month | 35,557 | 1.3 | % | 0.6 | % | $6.82 | 19,274 | 0.6 | % | 0.3 | % | $30.30 | 5,105 | 5.3 | % | 0.1 | % | $15.49 | 59,936 | 1.0 | % | $15.11 | |||||||||||||||||||
2013 | 139,015 | 5.3 | 2.4 | $30.46 | 128,841 | 4.2 | 2.2 | $34.77 | 8,048 | 8.3 | 0.1 | $120.80 | 275,904 | 4.7 | $35.11 | ||||||||||||||||||||||||||
2014 | 57,609 | 2.2 | 1.0 | $31.10 | 166,573 | 5.4 | 2.9 | $30.92 | 2,438 | 2.5 | — | $227.99 | 226,620 | 3.9 | $33.09 | ||||||||||||||||||||||||||
2015 | 166,110 | 6.3 | 2.9 | $34.36 | 56,632 | 1.9 | 1.0 | $34.79 | 5,393 | 5.6 | 0.1 | $181.55 | 228,135 | 3.9 | $37.95 | ||||||||||||||||||||||||||
2016 | 199,017 | 7.5 | 3.4 | $28.17 | 57,418 | 1.9 | 1.0 | $29.32 | 8,374 | 8.7 | 0.1 | $160.13 | 264,809 | 4.6 | $32.59 | ||||||||||||||||||||||||||
2017 | 51,303 | 1.9 | 0.9 | $32.13 | 101,182 | 3.3 | 1.7 | $31.31 | 6,367 | 6.6 | 0.1 | $153.15 | 158,852 | 2.7 | $36.46 | ||||||||||||||||||||||||||
2018 | 58,884 | 2.2 | 1.0 | $32.50 | 156,254 | 5.1 | 2.7 | $21.62 | 4,673 | 4.8 | 0.1 | $142.23 | 219,811 | 3.8 | $27.10 | ||||||||||||||||||||||||||
2019 | 116,098 | 4.4 | 2.0 | $31.85 | 136,241 | 4.4 | 2.3 | $24.68 | — | — | — | — | 252,339 | 4.3 | $27.98 | ||||||||||||||||||||||||||
2020 | 203,360 | 7.7 | 3.5 | $28.15 | 211,242 | 6.9 | 3.6 | $20.97 | 1,951 | 2.0 | — | $135.66 | 416,553 | 7.2 | $25.01 | ||||||||||||||||||||||||||
2021 | 44,276 | 1.7 | 0.8 | $31.85 | 54,991 | 1.8 | 0.9 | $46.19 | 10,242 | 10.6 | 0.2 | $199.93 | 109,509 | 1.9 | $54.77 | ||||||||||||||||||||||||||
2022 | 339,696 | 12.8 | 5.8 | $32.33 | 83,663 | 2.7 | 1.4 | $34.69 | 10,617 | 11.0 | 0.2 | $71.39 | 433,976 | 7.5 | $33.74 | ||||||||||||||||||||||||||
Thereafter | 978,480 | (6)(8) | 37.0 | 16.8 | $38.01 | 1,796,810 | (7) | 58.6 | 30.9 | $20.19 | 28,622 | 29.6 | 0.5 | $46.82 | 2,803,912 | 48.3 | $26.68 | ||||||||||||||||||||||||
Signed Leases Not Commenced | 78,794 | 3.0 | 1.4 | — | 6,488 | 0.2 | 0.1 | — | 503 | 0.5 | — | — | 85,785 | 1.5 | — | ||||||||||||||||||||||||||
Available | 177,368 | 6.7 | 3.1 | — | 93,036 | 3.0 | 1.6 | — | 4,374 | 4.5 | 0.1 | — | 274,778 | 4.7 | — | ||||||||||||||||||||||||||
Total | 2,645,567 | 100.0 | % | 45.6 | % | $30.30 | 3,068,645 | 100.0 | % | 52.6 | % | $22.79 | 96,707 | 100.0 | % | 1.6 | % | $103.17 | 5,810,919 | 100.0 | % | $27.54 | |||||||||||||||||||
Fourth Quarter 2012 Supplemental Information | Page 28 |
LEASE EXPIRATIONS (CONTINUED) | |
As of December 31, 2012 | |||
Notes:
(1) | Annualized base rent per leased square foot is calculated by dividing (i) annualized base rent for leases expiring during the applicable period, by (ii) square footage under such expiring leases. Annualized base rent is calculated by multiplying (i) base rental payments (defined as cash base rents (before abatements)) for the month ended December 31, 2012 for the leases expiring during the applicable period, by (ii) 12. |
(2) | The expirations include 1,900 square feet currently leased by Yankee Candle at Alamo Quarry Market, for which Lucchese Boot Company has signed an agreement to lease such space upon Yankee Candle's lease termination from January 31, 2013 through May 31, 2013. |
(3) | The expirations include 2,823 square feet currently leased by Windermere Services, Inc. at Lloyd District Portfolio, for which Pinnacle Capital has signed an agreement to lease such space upon Windermere Services, Inc.'s lease termination from March, 31 2013 through March 31, 2016. |
(4) | The expirations include 2,220 square feet currently leased by Northwest Media at City Center Bellevue, for which PAH Investments, LLC has signed an agreement to lease such space upon Northwest Media's lease termination from January 31, 2013 through February 28, 2016. |
(5) | The expirations include 503 square feet currently leased by Kaiwa at Waikiki Beach Walk - Retail, for which Natur Hawii has signed an agreement to lease such space upon Kaiwa's lease termination from December 31, 2012 through December 31, 2017. |
(6) | The expirations include 45,795 square feet currently leased by Microsoft Corporation at The Landmark at One Market, for which Autodesk, Inc. has signed an agreement to lease such space upon Microsoft's lease termination from December 31, 2012 through December 31, 2017, with an option to extend the lease through December 31, 2023. |
(7) | The expirations include 966 square feet currently leased by Quarry Nails at Alamo Quarry Market, for which Whole Earth Provision Co. has signed an agreement to lease such space upon Quarry Nails' lease termination from March 31, 2013 through January 21, 2019, with an option to extend the lease through January 31, 2029. |
(8) | The expirations include 27,226 square feet currently leased by Simpson Gumpterz & Heger at The Landmark at One Market, for which salesforce.com has signed an agreement to lease such space upon Simpson Gumpterz & Heger's lease termination from October 31, 2013 through April 30, 2020, with an option to extend the lease through April 30, 2030. |
Fourth Quarter 2012 Supplemental Information | Page 29 |
PORTFOLIO LEASED STATISTICS | |
At December 31, 2012 | At December 31, 2011 | |||||||||||||||||
Type | Size | Leased (1) | Leased % | Size | Leased (1) | Leased % | ||||||||||||
Overall Portfolio Statistics | ||||||||||||||||||
Retail Properties (square feet) | 3,068,645 | 2,975,609 | 97.0 | % | 3,031,339 | 2,878,832 | 95.0 | % | ||||||||||
Office Properties (square feet) (3) | 2,645,567 | 2,468,199 | 93.3 | % | 2,061,742 | 1,936,678 | 93.9 | % | ||||||||||
Multifamily Properties (units) | 922 | 873 | 94.7 | % | 922 | 846 | 91.8 | % | ||||||||||
Mixed-Use Properties (square feet) | 96,707 | 92,333 | 95.5 | % | 96,569 | 95,783 | 99.2 | % | ||||||||||
Mixed-Use Properties (units) | 369 | 328 | (4) | 88.9 | % | 369 | 326.196 | (4) | 88.4 | % | ||||||||
Same-Store(2) Statistics | ||||||||||||||||||
Retail Properties (square feet) | 3,033,489 | 2,940,453 | 96.9 | % | 2,784,609 | (5) | 2,638,754 | 94.8 | % | |||||||||
Office Properties (square feet) | 2,057,445 | 1,918,897 | 93.3 | % | 878,735 | (6) | 848,555 | 96.6 | % | |||||||||
Multifamily Properties (units) | 922 | 873 | 94.7 | % | 922 | 846 | 91.8 | % | ||||||||||
Mixed-Use Properties (square feet) | 96,707 | 92,333 | 95.5 | % | — | (7) | — | — | % | |||||||||
Mixed-Use Properties (units) | 369 | 328 | (4) | 88.9 | % | — | (7) | — | — | % | ||||||||
Notes:
(1) | Leased square feet includes square feet under lease as of each date, including leases which may not have commenced as of that date. Leased units for our multifamily properties include total units rented as of that date. |
(2) | See Glossary of Terms. |
(3) | Excludes 160 King Street, which was sold on December 4, 2012. |
(4) | Represents average occupancy for the years ended December 31, 2012 and December 31, 2011. |
(5) | Excludes Solana Beach Towne Centre, as the controlling interest in this entity was acquired on January 19, 2011. |
(6) | Excludes Solana Beach Corporate Centre, as the controlling interest in this entity was acquired on January 19, 2011, First & Main, as it was acquired on March 11, 2011, Lloyd District Portfolio, as it was acquired on July 1, 2011, One Beach Street, as it was acquired on January 24, 2012 and City Center Bellevue, as it was acquired on August 21, 2012. |
(7) | Excludes the Waikiki Beach Walk property, as the controlling interest in this entity was acquired on January 19, 2011. |
Fourth Quarter 2012 Supplemental Information | Page 30 |
TOP TENANTS - RETAIL | |
As of December 31, 2012 | |||||||||||||||||||||||||
Tenant | Property(ies) | Lease Expiration | Total Leased Square Feet | Rentable Square Feet as a Percentage of Total Retail | Rentable Square Feet as a Percentage of Total | Annualized Base Rent | Annualized Base Rent as a Percentage of Total Retail | Annualized Base Rent as a Percentage of Total | |||||||||||||||||
1 | Lowe's | Waikele Center | 5/31/2018 | 155,000 | 5.1 | % | 2.7 | % | $ | 4,221,786 | 6.0 | % | 2.6 | % | |||||||||||
2 | Kmart | Waikele Center | 6/30/2018 | 119,590 | 3.9 | 2.1 | 3,826,880 | 5.5 | 2.4 | ||||||||||||||||
3 | Foodland Super Market | Waikele Center | 1/25/2014 | 50,000 | 1.6 | 0.9 | 2,430,981 | 3.5 | 1.5 | ||||||||||||||||
4 | Sports Authority | Carmel Mountain Plaza,Waikele Center | 11/30/2013 7/18/2018 | 90,722 | 3.0 | 1.6 | 2,076,602 | 3.0 | 1.3 | ||||||||||||||||
5 | Nordstrom Rack | Carmel Mountain Plaza, Alamo Quarry Market | 9/30/2022 10/31/2022 | 69,047 | 2.3 | 1.2 | 1,990,316 | 2.8 | 1.2 | ||||||||||||||||
6 | Sprouts Farmers Market | Solana Beach Towne Centre, Carmel Mountain Plaza, Geary Marketplace | 6/30/2014 3/31/2025 9/30/2032 | 71,431 | 2.3 | 1.2 | 1,763,776 | 2.5 | 1.1 | ||||||||||||||||
7 | Ross Dress for Less | Lomas Santa Fe Plaza, Carmel Mountain Plaza, South Bay Marketplace | 1/31/2013 1/31/2014 1/31/2018 | 81,125 | 2.6 | 1.4 | 1,595,826 | 2.3 | 1.0 | ||||||||||||||||
8 | Old Navy | South Bay Marketplace, Waikele Center, Alamo Quarry Market | 4/30/2016 7/31/2016 9/30/2017 | 59,780 | 1.9 | 1.0 | * | * | * | ||||||||||||||||
9 | Officemax | Waikele Center, Alamo Quarry Market | 1/31/2014 9/30/2017 | 47,962 | 1.6 | 0.8 | 1,176,511 | 1.7 | 0.7 | ||||||||||||||||
10 | Marshalls | Solana Beach Towne Centre, Carmel Mountain Plaza | 1/13/2015 1/31/2019 | 68,055 | 2.2 | 1.2 | 1,106,146 | 1.6 | 0.7 | ||||||||||||||||
Top 10 Retail Tenants Total | 812,712 | 26.5 | % | 14.1 | % | $ | 20,188,824 | 28.9 | % | 12.5 | % | ||||||||||||||
* | Data withheld at tenant's request. |
Fourth Quarter 2012 Supplemental Information | Page 31 |
TOP TENANTS - OFFICE | |
As of December 31, 2012 | |||||||||||||||||||||||||
Tenant | Property(ies) | Lease Expiration | Total Leased Square Feet | Rentable Square Feet as a Percentage of Total Office | Rentable Square Feet as a Percentage of Total | Annualized Base Rent | Annualized Base Rent as a Percentage of Total Office | Annualized Base Rent as a Percentage of Total | |||||||||||||||||
1 | salesforce.com | The Landmark at One Market | 6/30/2019 4/30/2020 5/31/2021 | 226,892 | 8.6 | % | 3.9 | % | $ | 10,624,175 | 13.3 | % | 6.6 | % | |||||||||||
2 | Veterans Benefits Administration | First & Main | 8/31/2020 | 93,572 | 3.5 | 1.6 | 3,006,453 | 3.8 | 1.9 | ||||||||||||||||
3 | Autodesk, Inc. | The Landmark at One Market | 12/31/2015 12/31/2017 | 68,869 | 2.6 | 1.2 | 2,984,838 | 3.7 | 1.9 | ||||||||||||||||
4 | Microsoft Corporation | The Landmark at One Market | 12/31/2012 | 45,795 | 1.7 | 0.8 | 2,976,675 | 3.7 | 1.9 | ||||||||||||||||
5 | Treasury Tax Administration | First & Main | 8/31/2015 | 70,660 | 2.7 | 1.2 | 2,583,330 | 3.2 | 1.6 | ||||||||||||||||
6 | Insurance Company of the West | Torrey Reserve Campus | 12/31/2016 | 81,040 | 3.1 | 1.4 | 2,449,631 | 3.1 | 1.5 | ||||||||||||||||
7 | Treasury Call Center | First & Main | 8/31/2020 | 63,648 | 2.4 | 1.1 | 2,184,302 | 2.7 | 1.4 | ||||||||||||||||
8 | Caradigm USA LLC | City Center Bellevue | 8/14/2017 | 68,956 | 2.6 | 1.2 | 2,103,158 | 2.6 | 1.3 | ||||||||||||||||
9 | Alliant International University | One Beach Street | 10/31/2019 | 64,161 | 2.4 | 1.1 | 1,775,176 | 2.2 | 1.1 | ||||||||||||||||
10 | Portland Energy Conservation | First & Main | 1/31/2021 | 73,422 | 2.8 | 1.3 | 1,588,118 | 2.0 | 1.0 | ||||||||||||||||
Top 10 Office Tenants Total | 857,015 | 32.4 | % | 14.8 | % | $ | 32,275,856 | 40.3 | % | 20.2 | % | ||||||||||||||
Fourth Quarter 2012 Supplemental Information | Page 32 |
| |
APPENDIX
Fourth Quarter 2012 Supplemental Information | Page 33 |
GLOSSARY OF TERMS | |
Earnings Before Interest, Taxes, Depreciation, and Amortization (EBITDA): EBITDA is a non-GAAP measure that means net income or loss plus depreciation and amortization, net interest expense, income taxes, gain or loss on sale of real estate and impairments of real estate, if any. EBITDA is presented because it approximates a key performance measure in our debt covenants, but it should not be considered an alternative measure of operating results or cash flow from operations as determined in accordance with GAAP. The reconciliation of net income to EBITDA for the three months and year ended December 31, 2012 and 2011 is as follows:
Three Months Ended | Year Ended | |||||||||||||||
December 31, | December 31, | |||||||||||||||
2012 | 2011 | 2012 | 2011 | |||||||||||||
Net income | $ | 41,821 | $ | 655 | $ | 51,601 | $ | 19,324 | ||||||||
Depreciation and amortization (including discontinued operations) | 16,656 | 15,723 | 63,011 | 58,543 | ||||||||||||
Interest expense (including discontinued operations) | 15,521 | 14,696 | 59,043 | 56,552 | ||||||||||||
Interest income | (7 | ) | (535 | ) | (336 | ) | (1,621 | ) | ||||||||
Income tax expense | 460 | (82 | ) | 1,016 | 831 | |||||||||||
Gain on sale of real estate | (36,720 | ) | — | (36,720 | ) | (3,981 | ) | |||||||||
EBITDA | $ | 37,731 | $ | 30,457 | $ | 137,615 | $ | 129,648 | ||||||||
Adjusted EBITDA: Adjusted EBITDA is a non-GAAP measure that begins with EBITDA and includes adjustments for certain items that we believe are not representative of ongoing operating performance. We use Adjusted EBITDA as a supplemental performance measure because losses from early extinguishment of debt, loan transfer and consent fees and gains on acquisitions of controlling interests create significant earnings volatility which in turn results in less comparability between reporting periods and less predictability regarding future earnings potential. The adjustments noted resulted from our initial public offering and formation transactions.
Three Months Ended | Year Ended | |||||||||||||||
December 31, | December 31, | |||||||||||||||
2012 | 2011 | 2012 | 2011 | |||||||||||||
EBITDA | $ | 37,731 | $ | 30,457 | $ | 137,615 | $ | 129,648 | ||||||||
Early extinguishment of debt | — | — | — | 25,867 | ||||||||||||
Loan transfer and consent fees | — | — | — | 8,808 | ||||||||||||
Gain on acquisition | — | — | — | (46,371 | ) | |||||||||||
Adjusted EBITDA | $ | 37,731 | $ | 30,457 | $ | 137,615 | $ | 117,952 | ||||||||
Funds From Operations (FFO): FFO is a supplemental measure of real estate companies' operating performances. The National Association of Real Estate Investment Trusts (NAREIT) defines FFO as follows: net income, computed in accordance with GAAP plus depreciation and amortization of real estate assets and excluding extraordinary items, gains and losses on sale of real estate and impairment losses. NAREIT developed FFO as a relative measure of performance and liquidity of an equity REIT in order to recognize that the value of income-producing real estate historically has not depreciated on the basis determined under GAAP. However, FFO does not represent cash flows from operating activities in accordance with GAAP (which, unlike FFO, generally reflects all cash effects of transactions and other events in the determination of net income); should not be considered an alternative to net income as an indication of our performance; and is not necessarily indicative of cash flow as a measure of liquidity or ability to pay dividends. We consider FFO a meaningful, additional measure of operating performance primarily because it excludes the assumption that the value of real estate assets diminishes predictably over time, and because industry analysts have accepted it as a performance measure. Comparison of our presentation of FFO to similarly titled measures for other REITs may not necessarily be meaningful due to possible differences in the application of the NAREIT definition used by such REITs.
Funds From Operations As Adjusted (FFO As Adjusted): FFO As Adjusted is a supplemental measure of real estate companies' operating performances. We use FFO As Adjusted as a supplemental performance measure because losses from early extinguishment of debt, loan transfer and consent fees and gains on acquisitions of controlling interests create significant earnings volatility which in turn results in less comparability between reporting periods and less predictability regarding future earnings potential. The adjustments noted resulted from our initial public offering and formation transactions. However, other REITs may use different methodologies for defining adjustments and, accordingly, our FFO As Adjusted may not be comparable to other REITs.
Fourth Quarter 2012 Supplemental Information | Page 34 |
GLOSSARY OF TERMS (CONTINUED) | |
Funds Available for Distribution (FAD): FAD is a supplemental measure of our liquidity. We compute FAD by subtracting from FFO As Adjusted tenant improvements, leasing commissions and maintenance capital expenditures, eliminating the net effect of straight-line rents, amortization of above (below) market rents for acquisition properties, the effects of other lease intangibles, adding noncash amortization of deferred financing costs and debt fair value adjustments, adding noncash compensation expense, and adding (subtracting) unrealized losses (gains) on marketable securities. FAD provides an additional perspective on our ability to fund cash needs and make distributions by adjusting FFO for the impact of certain cash and noncash items, as well as adjusting FFO for recurring capital expenditures and leasing costs. However, other REITs may use different methodologies for calculating FAD and, accordingly, our FAD may not be comparable to other REITs.
Net Operating Income (NOI): We define NOI as operating revenues (rental income, tenant reimbursements, lease termination fees, ground lease rental income and other property income) less property and related expenses (property expenses, ground lease expense, property marketing costs, real estate taxes and insurance). NOI excludes general and administrative expenses, interest expense, depreciation and amortization, acquisition-related expense, other nonproperty income and losses, gains and losses from property dispositions, extraordinary items, tenant improvements and leasing commissions. Other REITs may use different methodologies for calculating NOI, and accordingly, our NOI may not be comparable to other REITs. Since NOI excludes general and administrative expenses, interest expense, depreciation and amortization, acquisition-related expenses, other nonproperty income and losses, gains and losses from property dispositions, and extraordinary items, it provides a performance measure that, when compared year over year, reflects the revenues and expenses directly associated with owning and operating commercial real estate and the impact to operations from trends in occupancy rates, rental rates, and operating costs, providing a perspective on operations not immediately apparent from net income. However, NOI should not be viewed as an alternative measure of our financial performance since it does not reflect general and administrative expenses, interest expense, depreciation and amortization costs, other nonproperty income and losses, the level of capital expenditures and leasing costs necessary to maintain the operating performance of the properties, or trends in development and construction activities which are significant economic costs and activities that could materially impact our results from operations.
Three Months Ended | Year Ended | |||||||||||||||
December 31, | December 31, | |||||||||||||||
Reconciliation of NOI to net income | 2012 | 2011 | 2012 | 2011 | ||||||||||||
Total NOI | $ | 40,886 | $ | 32,566 | $ | 149,352 | $ | 125,906 | ||||||||
General and administrative | (4,063 | ) | (3,091 | ) | (15,593 | ) | (13,627 | ) | ||||||||
Depreciation and amortization | (16,576 | ) | (15,293 | ) | (61,853 | ) | (55,936 | ) | ||||||||
Interest expense | (15,152 | ) | (14,236 | ) | (57,328 | ) | (54,580 | ) | ||||||||
Early extinguishment of debt | — | — | — | (25,867 | ) | |||||||||||
Loan transfer and consent fees | — | — | — | (8,808 | ) | |||||||||||
Gain on acquisition | — | — | — | 46,371 | ||||||||||||
Other income (expense), net | (273 | ) | 614 | (629 | ) | 212 | ||||||||||
Income from continuing operations | 4,822 | 560 | 13,949 | 13,671 | ||||||||||||
Discontinued operations | ||||||||||||||||
Income from discontinued operations | 279 | 95 | 932 | 1,672 | ||||||||||||
Gain on sale of real estate property | 36,720 | — | 36,720 | 3,981 | ||||||||||||
Results from discontinued operations | 36,999 | 95 | 37,652 | 5,653 | ||||||||||||
Net income | 41,821 | 655 | 51,601 | 19,324 | ||||||||||||
Net income attributable to restricted shares | (133 | ) | (132 | ) | (529 | ) | (482 | ) | ||||||||
Net loss attributable to Predecessor's noncontrolling interests in consolidated real estate entities | — | — | — | 2,458 | ||||||||||||
Net income attributable to Predecessor's controlled owners' equity | — | — | — | (16,995 | ) | |||||||||||
Net loss attributable to unitholders in the Operating Partnership | (13,111 | ) | (179 | ) | (16,133 | ) | (1,388 | ) | ||||||||
Net income attributable to American Assets Trust, Inc. stockholders | $ | 28,577 | $ | 344 | $ | 34,939 | $ | 2,917 | ||||||||
Overall Portfolio: Includes all operating properties owned by us as of December 31, 2012.
Fourth Quarter 2012 Supplemental Information | Page 35 |
GLOSSARY OF TERMS (CONTINUED) | |
Same-Store Portfolio and Non-Same Store Portfolio: Information provided on a same-store basis is provided for only those properties that were owned and operated for the entirety of both periods being compared and excludes properties that were redeveloped, expanded or under development and properties purchased or sold at any time during the periods being compared. The following table shows the properties included in the same-store and non-same store portfolio for the comparative periods presented.
Comparison of Three Months Ended | Comparison of Year Ended | ||||||
December 31, 2012 to 2011 | December 31, 2012 to 2011 | ||||||
Same-Store | Non-Same Store | Same-Store | Non-Same Store | ||||
Retail Properties | |||||||
Carmel Country Plaza | X | X | |||||
Carmel Mountain Plaza | X | X | |||||
South Bay Marketplace | X | X | |||||
Rancho Carmel Plaza | X | X | |||||
Lomas Santa Fe Plaza | X | X | |||||
Solana Beach Towne Centre | X | X | |||||
Del Monte Center | X | X | |||||
Geary Marketplace | X | X | |||||
The Shops at Kalakaua | X | X | |||||
Waikele Center | X | X | |||||
Alamo Quarry Market | X | X | |||||
Office Properties | |||||||
Torrey Reserve Campus | X | X | |||||
Solana Beach Corporate Centre | X | X | |||||
The Landmark at One Market | X | X | |||||
One Beach Street | X | X | |||||
First & Main | X | X | |||||
Lloyd District Portfolio | X | X | |||||
City Center Bellevue | X | X | |||||
Multifamily Properties | |||||||
Loma Palisades | X | X | |||||
Imperial Beach Gardens | X | X | |||||
Mariner's Point | X | X | |||||
Santa Fe Park RV Resort | X | X | |||||
Mixed-Use Properties | |||||||
Waikiki Beach Walk - Retail | X | X | |||||
Waikiki Beach Walk - Embassy Suites™ | X | X | |||||
Development Properties | |||||||
Sorrento Pointe - Land | X | X | |||||
Torrey Reserve - Land | X | X | |||||
Solana Beach Corporate Centre - Land | X | X | |||||
Solana Beach - Highway 101 - Land | X | X | |||||
Lloyd District Portfolio - Land | X | X | |||||
Tenant Improvements and Incentives: Represents not only the total dollars committed for the improvement (fit-out) of a space as it relates to a specific lease but may also include base building costs (i.e. expansion, escalators, new entrances, etc.) which are required to make the space leasable. Incentives include amounts paid to tenants as an inducement to sign a lease that do not represent building improvements.
Fourth Quarter 2012 Supplemental Information | Page 36 |